

Untitled - Vlaams Instituut voor de Zee
Untitled - Vlaams Instituut voor de Zee
Untitled - Vlaams Instituut voor de Zee

Create successful ePaper yourself
Turn your PDF publications into a flip-book with our unique Google optimized e-Paper software.
Supellsor: Prof. Dr. Maurie Hofrnann (Ucent & INBO)<br />
Go-srpervlsor: prof. Dr. Luc Lens (UGent)<br />
Readlng ommittee:<br />
Prof. Dr. Sip van Weren (WU& Wageningen)<br />
Dr. Liesbeth Bakker (NIOGKMW)<br />
Dr. Luc Maertens (ILVO)<br />
Dr. Rein Brys (tl@nt)<br />
other membersof theenm ommitbe:<br />
Prof. Dr. Wim Vperman, prei<strong>de</strong>nt (Uceng<br />
Prof. Dr. Dominique Adriaens (U@nt),<br />
Prof. Dr. Paul G@hebeur (UGent)<br />
Cwer photograph by pieter Bpeel
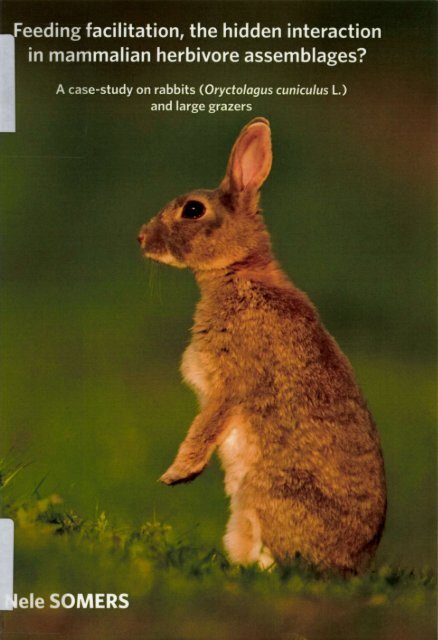
Feeding facilitation, the hid<strong>de</strong>n interaction<br />
in mammalian herbivore assemblages?<br />
1,5220 4<br />
A case-study on rabbits (Oryctolagus cunbulus L.) and large grazers<br />
Nele Souens<br />
Universiteit Gent, Aca<strong>de</strong>miejaar 2008-2009<br />
Proeftchrift <strong>voor</strong>gelegd<br />
tot het behalen van <strong>de</strong> graad van<br />
Doctor in <strong>de</strong> Wetenschappen, Biologie
<strong>voor</strong> papa
Dankwoord<br />
Wie een doctoraat maaK over konijnen, leert al heel snel dat een konijn heel wat<br />
meer is dan een schattig, stil, dom wezentje met lange oren, Al tij<strong>de</strong>ns mijn eerste weken in<br />
het konijnenon<strong>de</strong>aoek werd ik geconfronteerd met literatuur waarin "on<strong>de</strong>rzoekerlje pesten"<br />
als 66n van <strong>de</strong> favoriete hobby's van konijnen werd aangehaald. Ik heb <strong>de</strong> afgelopen jaren<br />
heel vaak teruggedacht aan die woor<strong>de</strong>n... Nu, zoveel jaren later, weet ik dat konijnen<br />
levendige, karaftervolle, koppige, eigenwijze, grappige en verstandige dieren zijn. En ja,<br />
toch ook wel schattig... B'rj <strong>de</strong>ze is dan ook het moment aangebroken om mijn dank te<br />
richten aan alle konijntjes, wil<strong>de</strong> 6n tamme, die op 66n of an<strong>de</strong>re manier, constructief of<br />
<strong>de</strong>structiet een bijdrage hebben geleverd aan dit proefschrift! We komen elkaar ongetwijfeld<br />
nog vaak tegen!<br />
Dat dit doctoraat ooit werd opgestaft heb ik in <strong>de</strong> eerste plaats te danken aan mijn<br />
promotor Maurice Hoffmann. Ongetwijfeld heeft hij nu en dan ook wel eens gedacht: "Nooit<br />
meer konijnen!". Maar al bij al bleef hij er steeds in geloven en daar wil ik hem bij <strong>de</strong>ze<br />
hartel'rjk <strong>voor</strong> bedanken! Mijn co-promotor Luc Lens werd pas later in <strong>de</strong> strijd gegooid, en<br />
vul<strong>de</strong> <strong>de</strong> laatste maan<strong>de</strong>n heel wat van zijn tijd met het doorworstelen van hoofdstukken<br />
over konijnen. Waar<strong>voor</strong> mijn oprechte dank!<br />
Heel wat instanties maaKen dit werk financieel en/of logistiek mogelijk. Het Fonds<br />
<strong>voor</strong> Wetenschappelijk On<strong>de</strong>aoek - Vlaan<strong>de</strong>ren (FWO-Vlaan<strong>de</strong>ren) on<strong>de</strong>rsteun<strong>de</strong> dit<br />
on<strong>de</strong>zoek financieel. Dit werd aangevuld door fondsen van het <strong>Instituut</strong> <strong>voor</strong> <strong>de</strong><br />
Aanmoediging van Innovatie door Wetenschap en Technologie in Vlaan<strong>de</strong>ren (IWT-<br />
Vlaan<strong>de</strong>ren) en het B'rjzon<strong>de</strong>r On<strong>de</strong>aoeksfonds (BOF) van <strong>de</strong> Universiteit Gent (UGent).<br />
Dankzij het Agentschap <strong>voor</strong> Natuur en Bos (ANB), <strong>de</strong> Intercommunale<br />
Waterleidingsmaatschappu van Veurne Ambacht (MA), le Conservatoire du Littoral, le<br />
Conseil G6n6ral du Nord, en <strong>de</strong> Provincie Oost-Vlaan<strong>de</strong>ren kregen we <strong>de</strong> mogel'tjkheid om<br />
veldwerk te verrichten op hun terreinen. Met speciale dank aan Rika Driessens (IWA) en<br />
Sandra Van Steerteghem (Provincie Oost-Vlaan<strong>de</strong>ren). Dankzij het <strong>Vlaams</strong> <strong>Instituut</strong> <strong>voor</strong> <strong>de</strong><br />
<strong>Zee</strong>, (VLl1) (met speciale dank aan Andr6 Catrijsse) was het mogelijk <strong>de</strong> infrastructuur in<br />
Wenduine te gebruiken <strong>voor</strong> het huisvesten en on<strong>de</strong>rhou<strong>de</strong>n van <strong>de</strong> tamme konijnen, <strong>voor</strong><br />
het opzetten van <strong>de</strong> plantenkweek en <strong>voor</strong> het drogen van ingezameld plantenmateriaal.<br />
Daarnaast werd ook heel wat logistieke steun gebo<strong>de</strong>n door het <strong>Instituut</strong> <strong>voor</strong> Natuur- en<br />
Boson<strong>de</strong>rzoek (INBO) en wer<strong>de</strong>n een groot <strong>de</strong>el van <strong>de</strong> plantanalyses uitgevoerd door het<br />
<strong>Instituut</strong> <strong>voor</strong> Landbouw- en Visserijon<strong>de</strong>aoek (ILVO)'
Naast financicile steun was ook technische hulp vaak onontbeerlijk. Een eervolle<br />
vermelding <strong>voor</strong> Frank Broucke (VUZ) is hier dan ook ten zeerste op zijn plaats! Fran( <strong>de</strong><br />
vele uren die je hebt doorgebracht met het verzorgen van <strong>de</strong> konijntjes en <strong>de</strong> planten z'rjn al<br />
lang niet meer op te tellen. De vrolijke babbels tussendoor <strong>de</strong><strong>de</strong>n altijd <strong>de</strong>ugd en het was<br />
altijd ftjn om in Wenduine aan te komen! Een zeer welgemeen<strong>de</strong> en ongelooflijk dikke merci!<br />
Daarnaast was er ook Ward Vercruysse (INBO) die heel wat te verduren kreeg: van pijnlijke<br />
knietjn na het tellen van keutels, over kou<strong>de</strong> en har<strong>de</strong> regenbuien tot het vol met<br />
schrammen staan na alweer een dagje te mid<strong>de</strong>n van <strong>de</strong> duindoorn... Gelukkig was het<br />
meestal ook gewoon gezellig en leutig - dankjewell Ook Tanja Milotic (INBO) en Wim De<br />
Bel<strong>de</strong>r (INBO) sprongen nu en dan in <strong>de</strong> bres.<br />
En dan zijn er nog <strong>de</strong> vele mensen die misschien niet steeds rechtstreeks kon<strong>de</strong>n<br />
helpen met het konijnenon<strong>de</strong>aoek, maar die er steeds waren om zware loodjes wat lichter<br />
te maken en <strong>de</strong> dagen op te vrolijken met hun aanwezigheidl<br />
Daarom uiteraard een oprechte merci aan al <strong>de</strong> TEREC-collega's! (Ook zij die er in<br />
het begin bij waren, maar on<strong>de</strong>ftussen el<strong>de</strong>rs een stekje hebben gevon<strong>de</strong>n.) De vrolijke<br />
koffiepauzes en gekke gedachtenkronkels plaatsten nu en dan het belang van een doctoraat<br />
weer eens in perspectief. Een opsomming van ie<strong>de</strong>reen zou me te ver lei<strong>de</strong>n, maar toch een<br />
speciale vermelding <strong>voor</strong> Bea, <strong>de</strong> Bram-bureaugenootjes, Els (mijn last-minute nieuw<br />
bureaugenoo$e), Viki en Angelica (<strong>voor</strong> administratieve en praktische hulp) en Nathalie,<br />
Greet en Debbie (<strong>voor</strong> <strong>de</strong> opbeuren<strong>de</strong> woor<strong>de</strong>n op tijd en stond!). Uiteraard ben ik <strong>de</strong> S8-<br />
collega's (lang vervlogen tij<strong>de</strong>n...) nog niet vergeten; <strong>voor</strong>al Christelle en Kathy ston<strong>de</strong>n<br />
steeds <strong>voor</strong> me klaar. To my Iranian colleagues Ata, Reza and pejman: thank you very much<br />
to learn me about the hospitality and kindness of your people! I wish you are all doing well<br />
back home, and maybe, we will once meet again? Omdat on<strong>de</strong>zoek soms toch een eenzame<br />
zaak kan zijn, heb ik ook ten volle genoten van <strong>de</strong> vlotte samenwerking met <strong>de</strong> stu<strong>de</strong>nten<br />
Marie-Alix, Binke, Esther en Arne!<br />
Een oprechte dankjewel ook aan mijn dansvrien<strong>de</strong>n! Een paar uurtjes (of dagen...?)<br />
stevig dansen, gevolgd door een on<strong>de</strong>r alle omstandighe<strong>de</strong>n zeer geslaag<strong>de</strong> aprds is <strong>de</strong><br />
beste remedie tegen eigenzinnige konijnenstreken I<br />
Wie absoluut niet mag ontbreken op het danklijstje is <strong>de</strong> bioloogjesben<strong>de</strong> [iaja,<br />
archeologen, geschiedkundigen en biochemici ook meegerekendl)! Alexan<strong>de</strong>r, Elisabeth &<br />
Bram, Jeroen & An, Marie-St6phanie, sofie, stephan, Tom, Val6rie & Toon, superbedankt<br />
<strong>voor</strong> alle leuke weekendjes, excursies, reizen, etentjes, <strong>voor</strong> sommigen het <strong>de</strong>len van onze<br />
doctoraatsjaren en <strong>voor</strong> allemaal <strong>de</strong> zeer <strong>de</strong>ugddoen<strong>de</strong> steun op moeilijke momenten! Ook
mijn an<strong>de</strong>re vrien<strong>de</strong>n Anneleen & Peter, Leen & Tim, Liesbeth, Lin<strong>de</strong>, Sabrina & Bart waren<br />
er op echt alle momenten <strong>voor</strong> me! En last but not least: een heel dikke merci aan Leen &<br />
Pieter, <strong>voor</strong> alles!<br />
Hoe onpettend belangrijk familie kan zijn heb ik het afgelopen jaar heel vaak mogen<br />
ervaren: mijn tante, mijn nonkel, mijn nichtje, Rik, Carine, Lenneft en Lars. Mijn grootou<strong>de</strong>rs<br />
en <strong>de</strong> groottantes en -nonkels die er helaas niet meer zijn. De Pevenagekes om me met<br />
open armen te ontvangen in hun gekke ben<strong>de</strong>, en in het speciaal Els & Jeroen.<br />
Een heel diepe, welgemeen<strong>de</strong> dankjewel is er uiteraard <strong>voor</strong> mijn ou<strong>de</strong>rs. Ze gaven<br />
me <strong>de</strong> lief<strong>de</strong> <strong>voor</strong> <strong>de</strong> natuur en het leven mee, hebben me altijd gesteund en op alle<br />
mogelijke manieren geholpen tij<strong>de</strong>ns mijn studies en doctoraatsjaren. Papa, het l'tjkt al zo<br />
lang gele<strong>de</strong>n dat we samen <strong>de</strong> eerste Steenkonijntjes gingen kopen. Ik had zo graag gewild<br />
dat je het ein<strong>de</strong> van m'n doctoraat had kunnen meemaken. Ik hoop dat je, ergens, waar dan<br />
ook, toch kan meekijken en trots kan zijn. Ik mis je ontzettend. Mama, het leven voert ons<br />
niet altijd naar <strong>de</strong> plaats die we ons had<strong>de</strong>n <strong>voor</strong>gesteld. Ik hoop <strong>de</strong>sondanks dat <strong>de</strong> weg nu<br />
rechtstreeks leidt naar geluk, en dat we die weg samen nog heel veel jaren zullen mogen<br />
bewan<strong>de</strong>len! Ik hou van jullie!<br />
En tenslotte... Maaften, toen je me een aantal jaren gele<strong>de</strong>n leer<strong>de</strong> kennen, wist je<br />
vaag dat ik "iets met konijntjes" <strong>de</strong>ed. On<strong>de</strong>rtussen heb je het allemaal meegemaaK: het<br />
tellen van keutels, het vangen (of net niet?) van konijnen, het bouwen van konijnenvilla's,<br />
het in elkaar knutselen van camera-opstellingen, het mengen van zand en potgrond, het<br />
typen van cijfeftjes en nog zoveel meer. Maar <strong>voor</strong>al, je steunen<strong>de</strong> en aanmoedigen<strong>de</strong><br />
woor<strong>de</strong>n waren er altijd <strong>voor</strong> me. Ik weet zeker dat dit boekje er zon<strong>de</strong>r jou niet had<br />
gelegen. Dankjewel! En nu... op naar nieuwe dromen!
Table of contents<br />
CHAPTER 1 - General introduction.. .......................3<br />
CHAPTER 2 - The effect of rabbits (Orytulagus cuniculus L.) and large herbivores on dry<br />
dune grassland structure and composition ............... ................21<br />
CHAPTER 3 - Does vegetaton height predict spatial foraging activity of the rabbit<br />
(Orydolagus cuniculus L.)?.............. ...................71<br />
CHAPTER 4 - Food quality affects diet preference of rabbits: experimental evi<strong>de</strong>nce ..........99<br />
CHAPTER 5 - The <strong>de</strong>termination of the diet of rabbits (Oryctulagus cuniculus L.) using<br />
microhistological faecal analysis: an experimental evaluation ...................... 115<br />
CHAPTER 6 - The diet of the wild rabbit (Oryctolagus cuniculusL.): selection of plant species<br />
in an acid dune grassland............,,.,, ................ 135<br />
CHAPTER 7 - General discussion ....................... 153<br />
Summary...... ...........169<br />
Samenvatting ...........173
How can species using the same or a similar limiting resource live together? (Photograph by<br />
N. Somers - Maasai Mara, Kenya, 2il)5)
CHAPTER 1<br />
General introduction
Feeding facilatation in herbivore assemblages<br />
Coexistence of different terrestrial grazer species is an important topic in ecology,<br />
leading to the question: how can species using the same or a similar limiting resource live<br />
together (e.9. Puws & OLFF, 1998; FARNswoRTH et al.,2002)? In this context, the concept of<br />
competition and niche differentiation has been extensively investigated (for a general<br />
overview: see BEGoN et al., 1990). However, positive interactions are far less extensively<br />
studied and <strong>de</strong>serve greater attention from ecologists (Knuecen, 1986; ARsENAULT & OwEN-<br />
Sunu, 2002). This thesis is focussing on the positive interspecific interaction called<br />
'facilitation'. Facilitation between animal species is a process or action, un<strong>de</strong>rtaken by one<br />
species, by which "something" is facilitated for the other species. This positive interaction<br />
has been suggested to play an impoftant role in un<strong>de</strong>rstanding coexistence of grazers with<br />
different body mass (PRrNs & orr, 1998): smaller grazer species may benefit from the<br />
grazing impacts of larger species that modify the vegetation (Ansrrunulr & Owrru-SunH,<br />
2002). This is called'feeding facilitation'.<br />
Feeding facilitation may arise for several reasons. When grazing by one species<br />
stimulates grass re-growth, it may thereby enhance the nutritional quality of forage for<br />
another species (Ansrnnulr & OwEN-SMrrn, 2002): the creation of low, high-productive and<br />
high-qualitative vegetation (McNAUGHroN, 1984). Secondly, feeding facilitation may arise<br />
when grazing by one species makes more forage accessible to another species (ARSENAULT &<br />
OWEN-SMIrH, 2002). For example, a tall sward might be more difficult to handle (FRvxELL,<br />
1991; Vnru DE KoppEL et a/., 1996; vAN DER GRMF ef al., 2oo2). A third form of feeding<br />
facilitation was mentioned by KuupER et al. (2008): in the long term, large herbivores may<br />
not only alter vegetation structure (and eventually forage quality) but also alter plant species<br />
composition. This could lead to a long term form of feeding facilitation: smaller grazers<br />
would be facilitated by large grazers because other plant species emerge, which was shown<br />
in a herbivore assemblage of cattle and hares (Kuteen et al., 2008). As far as feeding<br />
facilitation is concerned, we should further consi<strong>de</strong>r the option that medium-sized herbivores<br />
are able to maintain favourable grazing swards themselves, without the help of large<br />
herbivores. This is the concept of self facilitation (Anserunulr & OwEN-SMrrn, 2002) which<br />
might inte<strong>de</strong>re with interspecific feeding facilitation.<br />
Additionally, there might be a lower cost of vigilance in short grazed swards, because<br />
of increased predator <strong>de</strong>tection capacity (Van oe KoppEL et al., t996; IAsoN ef al., 2002; vav<br />
DER GRMF et al., 2002). Finally, more difficult locomotion might be at hand too (vAN DER<br />
GRMF ef a/., 2002): a low sward makes it easier for smaller herbivores to flee from<br />
Chapter I
predators (BAKKER et al., 20O9) as in the case of rabbits that are bound to burrows.<br />
Adversely, a higher sward gives better hiding opportunities for still smaller herbivores like<br />
voles (Bnrren et al.,2009).<br />
This multitu<strong>de</strong> of facilitation mechanisms makes it clear that this herbivore interaction<br />
is not yet completely un<strong>de</strong>rstood. The first type of feeding facilitation (facilitation by<br />
enhancement of forage quality) has been consi<strong>de</strong>red one of the most likely facilitation<br />
phenomena (AR5ENAULT & Owrru-Sunu ,2002). However, more recognition should be given to<br />
the effective mechanisms through which feeding facilitation operates (Ansenaulr & Owen-<br />
SMrrH, 2002). This thesis focuses on the mechanisms of feeding facilitation by the creation of<br />
short, supposedly high quality swards.<br />
Feeding facilitation by the creation of short, high quality swards<br />
G razin g optim iza tion h ypoth es is<br />
How large grazers create nutritionally advantageous swards was first <strong>de</strong>scribed in the<br />
Serengeti ecosystem (McNnucHron, 1979; 1984): mo<strong>de</strong>rate grazing by large herbivores not<br />
only reduced the height of the vegetation, but also stimulated re-growth. Therefore, biomass<br />
production and nitrogen concentration were enhanced. This was due to several plant<br />
compensatory re-growth mechanisms that occur after <strong>de</strong>foliation (for an overview: see<br />
M6NAUGHT6N, 1983). Grazing might maintain the phenologically young plant stages leading<br />
to a high nutrient concentration in leaf material; re-growth may be stimulated by grazing<br />
leading to increased biomass; tillering might be promoted, increasing shoot <strong>de</strong>nsity; grazing<br />
might reduce standing <strong>de</strong>ad biomass (varu orn GRMF ef al., 2OO5; TAHMASEBI KoHYANI ef al,<br />
2008). The low, high-productive and high-qualitative vegetation resulting from this process<br />
has been named 'grazing lawns'; the hypothesis predicting increased production and quality<br />
of plan6 grazed at intermediate grazing pressures is called the 'grazing optimization<br />
hypothesis' (e.g. vnn DER GRMF et al., 2O05). Although the positive effects of grazing or<br />
grazing simulation on forage quality (Coeeocr et al., t983; RUESS, 1984; CHENG & RrcHIE,<br />
2006) and forage availability (vAN orn Gnpar et al., 2005) have been observed, this<br />
hypothesis has been doubted by BrLsrv (1986). At least, many factors may influence the<br />
effect of grazing on plant productivity and quality, e.g. soil nutrient availability, shading,<br />
intensity and frequency of <strong>de</strong>foliation (MILCHUNAS et al., 1995). Also, simulated grazing might<br />
result in positive effects on only certain plant parts and the frequency of grazing or clipping<br />
influences the outcome (Fox efal., 1998).<br />
General introduction
Q ua lity th reshold h ypoth es is<br />
By creating grazing lawns, large grazers promote the availabilty of high-quality<br />
forage for other (smaller) herbivores. For allowing feeding facilitation of the type that we<br />
studied, these other herbivores should be sensitive for these short, high quality swards and<br />
should preferentially forage in this type of vegetation (OLFF er a/., 1997). These quality-<br />
sensitive herbivores are typically smaller animals, as larger grazers tolerate lower plant<br />
nutrient concentration (but require greater plant abundance (Orr et a/.,2002)) and thus are<br />
not very quality-sensitive. This phenomenon is expoun<strong>de</strong>d by Drruurrur & Varu Sorsr (1984):<br />
the propottion of the metabolic needs and the capacity of the digestive system of larger<br />
herbivores is very low. As a result, these grazers can have relatively long retention times,<br />
and consequently digest low quality food very slowly, in or<strong>de</strong>r to acquire sufficient nutrients.<br />
Some large herbivores even <strong>de</strong>veloped the very efficient system of being ruminant. Small<br />
herbivores have a very low capacity of the digestive system, and a very high metabolic need,<br />
As food is passing very quickly through their digestive tract, they should primarily feed on<br />
high quality plants to fulfil their metabolic needs.<br />
Quality-sensitive herbivores would therefore not forage in vegetation patches where<br />
biomass intake is maximized as was traditionally predicted by the Type Il-functional<br />
response (classical 'exploitation theory' - oKSANEN et al., lggt; LUNDBERG, lggg; LUNDBERG &<br />
AsrnON, 1990; GRoss et al., 1993). Instead, the medium-sized herbivores should forage<br />
according to a unimodal, dome-shaped Type IV functional response (Bos er al., 2002a;<br />
DUMNr et a/., 2003; DEKKER & vAN LANGEVetoq 2007; vAN LANGEVELoT et a/.,200g): as a<br />
vegetation with a high standing crop would <strong>de</strong>crease in forage quality (see above), gross<br />
daily food intake should <strong>de</strong>crease at higher vegetation biomass (Prurus & OLFF, 1998). The<br />
'quafity threshold hypothesis' (OLFF ef al., 1997; KuupER, 2004) predicts that the medium-<br />
sized herbivore populations are rather controlled by bottom-up effects than by top-down<br />
effecbs (predation - vAN DE KoppEL et al., 1996; KuupER, 2004). The 'green world' hypothesis<br />
(HAIRSToN et a/., L960) predicts that terrestrial grazing herbivore populations are not limited<br />
by their food supply and are generally controlled by predators. In contrast, the quality<br />
threshofd hypothesis fits better in the'optimal foraging theory' (BELovsKy et al., 1999), which<br />
predicts animals to forage in or<strong>de</strong>r to optimize their fitness by a maximal net nutritional<br />
intake, thereby coping with several constraints.<br />
Chapter 1
Factors influencing the occurence of facilitation<br />
Several factors may influence the occurrence of facilitation by the creation of grazing<br />
lawns and its balance with competition in mammalian grazer assemblages. There might be a<br />
temporal (seasonal) tra<strong>de</strong>-off between facilitation and competition (AnstrunulT & OWEN-<br />
SMrrH, 2002, RUEDA ef al., 2008) as forage maturation especially occurs during the growing<br />
season (FRy1ELL, 1991). Whether facilitation does occur or not also <strong>de</strong>pends on the <strong>de</strong>nsity<br />
of the farge grazers and of the facilitated grazers (BAKKER et al., 2009). There should be an<br />
increase of the impoftance of facilitation at <strong>de</strong>clining <strong>de</strong>nsity of the smaller grazers' Also,<br />
there should be an optimal difference between the body mass of the herbivores involved<br />
(pRrNS & Orr, 1998): when the difference is too large, smaller species are not expected to<br />
benefit (e.g. KrrStruC, 1998; Baxrrn et al., 2009), while resource competition occurs when<br />
the difference is too small. This was especially shown in African grazers assemblages (Pruns<br />
& OLFF, 1998). In this case, a grazer with a large body mass was per <strong>de</strong>finition a grazer with<br />
(relatively) lower energy and protein requirements and a higher capacity to ingest and digest<br />
the vegetation. We could however doubt whether this relationship between body mass and<br />
the occurrence of facilitation is universal, as feeding facilitation has been <strong>de</strong>tected in<br />
assemblages of bison (Bison bison L.) and prairie dog (Cynomys ludovicianus Ono) (large<br />
difference in body size - Knurcrn, 1986), Barnacle gese (Branta leucopsis Brcnsrrtru) and<br />
hare (Lepus europaeus Pnr-ms) (small difference in body mass - Stant et a1.,2006). Finally,<br />
habitat productivity may be important for the balance between facilitation and competition in<br />
herbivore assemblages (Cnrruc & RrcxIe, 2006): facilitation by vegetation modification is<br />
more likely in productive habitats (DEKKER & vAN LANGEVELDE,2O0T)'<br />
Examples of feeding facilitation in grazer assemblages<br />
Feeding facilitation by limiting forage maturation has been mentioned to occur in<br />
some terrestrial herbivore assemblages. The most famous example is that of the migratory<br />
wil<strong>de</strong>beest (Connochaetes taurinus BuRcHELL) and Thomson's gazelle (Eudorcas thomsonii<br />
GUNTHER) in the Serengeti-Mara-ecosystem in Tanzania and Kenya (MCNAUGHroN, 1976; but<br />
see Srrucrrun & NoRroN-GRrFFrrHs, 1982). Other examples in assemblages consisting only of<br />
wi6 herbivores are bison (Bison bison L.) and prairie dog (Cynomys ludovicianus Ono)<br />
(Knuecrn, 1986), Barnacle geese (Eranta leucopsis BrcnsrrIru) and hare (Lepus europaeus<br />
PALLAS) (STAHL ef al., 2006)). In Nofth-Western Europe, the wild large grazers have mostly<br />
been replaced by livestock. Although the communities of domestic and wib herbivores have<br />
General introduction
not been co-evolving for a long time (as in the savannah-ecosystem (McNAUGHToN, tgTg)),<br />
feeding facilitation between domestic herbivores and wild herbivores has been observed as<br />
well. Some examples are red <strong>de</strong>er (Ceruus elaphus L.) and cattle (Gonooru, 19gg), geese and<br />
cattfe (Bos et al.,2o02b), hares and cattle (KuDpER, 2004), ro<strong>de</strong>nts and sheep (AusfRHErM ef<br />
al., 2007) and alpine rein<strong>de</strong>er (Rangifer tarandus L.) and sheep (MvsrrRUD & AusrRHErM,<br />
2008).<br />
Also wild rabbits (oryctolagus cuniculus L.) have been wi<strong>de</strong>ly assumed to be<br />
facilitated by larger domestic grazers (e.g. wrLUAMs et al., 1974; WALLAGE-DREES, 19g2;<br />
oosrERVELD, 1983; Dnees, 1989; DREEs, 1998). However, supporting evi<strong>de</strong>nce is mainly<br />
anecdotic or indirect. Descriptive field studies indicate a preference for swards of medium<br />
plant standing crop (vnru or KoppEL et al., 1996) or find no consistent effect of large<br />
herbivores on rabbits (OLFF & BoERsMA, 1998); more recent (field-)experimental studies at<br />
least suggest the preference of the rabbit for shofter swards (IASoN ef a1.,2002; BAKKER ef<br />
a1.,2009).<br />
Aims of this research<br />
In this thesis, the assemblage of wild rabbits and introduced large grazers serve as a<br />
mo<strong>de</strong>l to gain insighG in the occurrence and mechanisms of feeding facilitation by the<br />
creation of grazing lawns. We focused on a limited number of aspects concerning feeding<br />
facilitation in this grazer assemblage. First, we studied the effect of large herbivores and<br />
rabbits on vegetation (effects on vegetation structure, on vegetation composition and on<br />
food quality for rabbits). Second, we studied some factors possibly <strong>de</strong>termining the food and<br />
foraging choice of rabbits, with a focus on food quality and vegetation height.<br />
The main hypothesis of the research is that introduced large herbivores facilitate<br />
rabbits (medium-sized herbivores) by modification of the vegetation. This modification<br />
involves creating short swards, creating <strong>de</strong>nser (more productive) swards, creating swards<br />
that have a high food quality for rabbits and influencing vegetation composition. We expect<br />
that these modifications are not completely in<strong>de</strong>pen<strong>de</strong>nt from each other: shofter swards are<br />
expected to have a higher food quality and to be more productive. This main hypothesis has<br />
been subdivi<strong>de</strong>d into several partial hypotheses:<br />
. Large herbivores modify vegetation structure by grazing, thereby creating short and<br />
<strong>de</strong>nse swards.<br />
. Medium-sized herbivores (represented by rabbits) preferentially forage in short swards.<br />
r These short swards are of a higher nutritional quality (for rabbits) than ungrazed swards.<br />
Chapter 1
When foraging, food quality is an impoftant factor <strong>de</strong>termining the diet choices of the<br />
rabbit.<br />
Rabbits prefer the shoft swards created by large herbivores because of the higher<br />
nutritional value of these swards.<br />
Rabbits are able to create short and high qualitative swards, thereby facilitating<br />
themselves.<br />
Large herbivores can modify vegetation composition. This has an influence on rabbits as<br />
they prefer certain plants species above others when foraging'<br />
We therefore peformed several research projects with different levels of environmental<br />
control. We performed field obseruations in two coastal dune areas (IJzermonding and Dune<br />
Fossile <strong>de</strong> GhWel<strong>de</strong> - see"study areas and large herbivoresJ. Here, herbivore assemblages<br />
consisting of rabbits and large grazers were studied to obtain information about:<br />
o the possibility of vegetation modification (vegetation structure, vegetation<br />
composition, food quality for rabbits) by the large herbivores<br />
o the occurrence of facilitation in these communities<br />
o plants species selection by rabbits (when foraging)<br />
As these dune areas are structurally very heterogeneous, there was a need for another study<br />
area were a semi-controlled field experiment could be performed. This study area was<br />
Puyenbroeck (see "study areas and large herbivoresl. In this area, it was possible to<br />
experimentally study preferences of rabbits for certain sward heights, because of:<br />
o the straight forest bor<strong>de</strong>rs<br />
o the relativelY flat relief<br />
o the large suface of a homogeneous and relatively simple vegetation<br />
composition and structure<br />
o the presence of large rabbit populations<br />
o the possibility to easily control vegetation height by mowing machines.<br />
Finally, also entirely controlled experiments in laboratory conditions were pedormed to study<br />
diet preferences of rabbits when controlling for vegetation height, but not for food quality'<br />
General introduction
Outline of the thesis<br />
The following chapters of this thesis <strong>de</strong>scribe the research that was conducted<br />
in or<strong>de</strong>r to test the hypotheses or parts of the hypotheses mentioned above, including one<br />
methodological chapter.<br />
Chapter 2 <strong>de</strong>scribes the results of a six-year exclosure study in the coastal dune<br />
nature reserves the IJzermonding and Ghyvel<strong>de</strong>. The exclosures had three treatments:<br />
accessibility for all herbivores (large grazers inclu<strong>de</strong>d), accessibility for rabbit but not for<br />
large grazers, and no accessibility to rabbits and large grazers. Several vegetation<br />
characteristics were measured in subsequent periods, in or<strong>de</strong>r to learn more about the<br />
influence of the different herbivore combinations on vegetation structure and vegetation<br />
composition. The possible importance of different grazer combinations for these dune<br />
grasslands will be discussed.<br />
Chapter 3 examines the expected preference of rabbits for shoft swards. A mowing<br />
experiment, simulating eltreme large grazer impact on vegetation sward, was conducted in<br />
two flat, monotonous lawns in the Flemish Provincial Domain 'Puyenbroeck'(Wachtebeke,<br />
Belgium). Short and high sward strips were created by differential mowing. We evaluated the<br />
use of the short and high strips by the wild rabbits in this study area. The second part of this<br />
chapter tests the preference of rabbits in Ghyvel<strong>de</strong> and IJzermonding for plots that had been<br />
grazed by the large herbivores in this area. Vegetation height and vegetation quality of<br />
grazed and ungrazed plots was measured.<br />
Chapter 4 experimentally tests whether rabbits prefer high-quality forage. As sward<br />
height and food quality can be correlated un<strong>de</strong>r natural conditions, we experimentally<br />
eliminated differences in sward height between swards of different quality and offered the<br />
plants to some rabbits during a controlled feeding trial. Originally, we planned a full factorial<br />
experiment in which also swards of different height, but with equal food quality, were<br />
offered to the rabbits. However, as the short and long swards did not prove to have a similar<br />
food quality, these data could not be used for statistical analysis. Therefore, this part of the<br />
experiment was omitted from Chapter 4.<br />
Chapter 5 is a methodological study, checking the use of epi<strong>de</strong>rmal plant fragments<br />
in rabbit pellets to <strong>de</strong>termine the diet composition of rabbits. The method has several<br />
advantages, but some limitations have been mentioned in the past. so we performed a<br />
feeding trial with rabbits to compare the known diet with the results obtained by faecal<br />
analysis. The main goal of the study was to find out whether the diet composition can be<br />
10 Chapter 1
eliably <strong>de</strong>rived from faecal analysis (<strong>de</strong>spite problems of differential digestion)' The method<br />
of faecal analysis was used for the research <strong>de</strong>scribed in Chapter 6.<br />
Chapter 6 is a field study that compares the diet of wiU rabbits in Ghyvel<strong>de</strong> (by using<br />
faecal analysis) with the availability of food plants in the study area. We tested whether food<br />
preferences of rabbits would occur on the plant species level. Plant quality was consi<strong>de</strong>red as<br />
a possible explanatory variable for diet preference.<br />
Chapter 7 synthesizes the results of the previous chapters. The results are<br />
commented within the framework of feeding facilitation. The hypotheses of the thesis are<br />
confronted with the field observations and experimental results'<br />
Description of the ecological mo<strong>de</strong>l systems used in this research<br />
The wild rabbit<br />
The wild rabbit is one of the approximately 40 contemporary living species of the<br />
family Leporidae. This family comprises all rabbit and hare species. The Leporidae belong to<br />
the or<strong>de</strong>r of Lagomorpha, which is paft of the class of Mammalia (CoRBFr, 1994).<br />
After the last glacial, rabbits were withdrawn to Spain and South-Western France<br />
(TACK ef al., 1993). The Romans introduced the rabbits in Italy, but especially abbeys and<br />
convents are responsible for the large-scale distribution in Western-Europe during the Middle<br />
Ages (Tlcr et at., Lgg3). The monks domesticated the animals (RoGERs et al., 1994), and<br />
from the 2nd half of the Middle Ages (10h-11h century), they were kept in large parks, also in<br />
Flan<strong>de</strong>rs (DREE5 et a1.,2007) and Northern French coastal dune areas (TERMorE, 1992)' Their<br />
populations expan<strong>de</strong>d, paftly caused by <strong>de</strong>struction of their predators by hunters (RoGERs ef<br />
al., L994). This expansion was stopped in the 1950's when the disease myxomatosis was<br />
successfully introduced in Europe (Locrrev, 1976). Originally, 99o/o of the animals died from<br />
the disease; nowadays, only 50o/o of the ill animals die (Pnovoosr & BoNTE, 2004). However,<br />
the rabbit populations now suffer from the outbreak of RHD (Rabbit Haemorrhagic Disease -<br />
VANDEKERCH9yE & PEETERS, 2002) and are generally supposed to be small nowadays (Jrulssru,<br />
2004; DREES et a1.,2007).<br />
Rabbits are medium-sized hindgut fermenters (DEMMENT & VAN SoEsr, 1984); their<br />
medium-sized statue forces them to feed on high qualitative, quickly digestible forage' As a<br />
consequence of the quick digestion of these animals, some nutrients are lost through their<br />
faeces, which is partly compensated by caecotrophy (DEMMENT & VAN SoEsr, 1984): rabbits<br />
are known to re-ingest soft faeces, directly after excretion and directly from the anus<br />
General introduction<br />
11
(Hlnnxawn, 2001). The two types of pellets (hard and soft faeces) are formed by a<br />
separation mechanism in the proximal colon. During hard faeces excretion, water-soluble<br />
substances and fine particles (including micro-organisms) from the colon are brought back to<br />
the caecum by means of antiperistaltic movements. During soft faeces formation, the motility<br />
of the caecal base and proximal colon <strong>de</strong>crease and the caecal contents are covered by a<br />
mucous envelope (Cnneaefto & PIQUER, 1998). So the difference between the soft and hard<br />
faeces is not due to the food having passed once or twice (HTMKAWA,2OOt), as is sometimes<br />
misinterpreted.<br />
Study areas and large herbivores<br />
The field work of this thesis was conducted in two coastal dune areas (Figure 1): the<br />
Flemish Nature Reserve 'IJzermonding' (Nieuwpoort, Belgium; 5tog'4" N, 2043'57" E;<br />
managed by the Agency for Nature and Forest (ANB) of the Flemish Government) and the<br />
French Nature Reserve'Dune Fossile <strong>de</strong> Ghyvel<strong>de</strong>'(Ghyvel<strong>de</strong>, France, 5loz'49" N,2o33'02,,<br />
E; managed by Conservatoire du Littoral); they are ca. 25 km apart. The nearness of the<br />
North Sea mitigates climatological extremes in these areas (mild winters and mild summers).<br />
In addition, relief, exposition and the oligotrophic, porous and quickly warming sandy<br />
substrate create microclimatological differentiation, resulting in a wi<strong>de</strong> variety of abiotic<br />
conditions and communities. The area of the original open coastal dune landscape has been<br />
reduced drastically by man (PRovoosr & BoNTE, 2004). Since the abandonment of agro-<br />
pastoral use of the coastal landscape since the mid 20th century, a general encroachment of<br />
scrub and monospecific rough grasslands is taking place, leading to a general loss of<br />
biodiversity of blond dune, grey dune and dry dune grassland communities. one of the<br />
nature management measures taken for this reason was large-scale cutting of scrubs and<br />
the consecutive introduction of large herbivores. Grazing by large grazers in the study areas<br />
started between 1996 and 1999, in or<strong>de</strong>r to prevent further encroachment of shrubs and<br />
competitive grass species. A large variety of herbivore species were used for this purpose<br />
and at different sites: at the Wvo study sites, these are sheep (Mergelland sheep, Ovis aries<br />
L.) in the IJzermonding and horses (Haflinger pony, Equus caballus L.) in Dune Fossile <strong>de</strong><br />
Ghyvel<strong>de</strong> (Table 1). Sheep are ruminant grazers, having a very efficient digestion, enabling<br />
them to forage on lower quality plants (DeuuENT & vAN sorsr, 19g4). The horses can be<br />
consi<strong>de</strong>red large bulk fee<strong>de</strong>rs. They are not ruminants, but large hindgut fermenters, with a<br />
long retention time, allowing them to feed on low quality food (DruueruT&VAN S9EST, 1984).<br />
t2 Chapter 1
Besi<strong>de</strong>s, wild rabbits are the most important "natural" grazers in the study sites, although<br />
they appear at different <strong>de</strong>nsities at the two study sites.<br />
France<br />
Hafringer & nbblt<br />
Uzermonding:<br />
sheep &<br />
l{otth Sea ,--' \ l{ieuwpooft<br />
, r.]<br />
-&<br />
.-.lwesthoek North<br />
l*-}we*troek South<br />
De Panne r)<br />
Ter Y<strong>de</strong><br />
'l..hornornn"<br />
KoksiJ<strong>de</strong><br />
Belgium<br />
Fiqure 1: This map indicates the position of the two coastal dune study sites (Llzermonding and Dune<br />
Fossile <strong>de</strong> Ghyvel<strong>de</strong>) and a few other important (grazed) nature reserves in the Belgian and northern<br />
French coastal dune area.<br />
Area Large herbivores Introduced<br />
in<br />
Grazed<br />
curface<br />
Grazing regime<br />
IJzermonding 5-25 Mergelland sheep<br />
until 2003 accompanied by 3-4 goats<br />
1999 5-10 ha winter grazing<br />
(August - March)<br />
Dune Fossile <strong>de</strong><br />
Ghwel<strong>de</strong><br />
10-15 Haflinger horses 1996 75 ha year round grazing<br />
Table 1: Introduction of large herbivores in the study areas (according to Horruaruru efal', 2005) with<br />
indications on grazer <strong>de</strong>nsities and grazing regime.<br />
In each of these areas, we selected a dry dune grassland, neighbouring a scrub<br />
vegetation of Hippophae rhamnoi<strong>de</strong>s(IJzermonding) or Ligustrum vulgare (GhWel<strong>de</strong>). These<br />
grasslands have a sandy substrate that is originally calcareous. This is still the case in the<br />
General introduction<br />
13
elatively young dunes of the IJzermonding that are situated very close to the coast. In Dune<br />
Fossile <strong>de</strong> Ghyvel<strong>de</strong>, situated at ca. 3 km from the coast line and of ol<strong>de</strong>r age (BarreNnru,<br />
2001) compared to the IJzermonding, local <strong>de</strong>calcification of the substrate resulted in<br />
mo<strong>de</strong>rately acid conditions (Tnnuesrar Konvnrur, 200g).<br />
Vegetation composition in the two dry grasslands differ as follows (based on<br />
HoFFMANN et al. (2005), combined with personal observations). A grey dune-like pioneer<br />
vegetation on a young dune area that was artificially flattened some fifty years ago and with<br />
a still very limited organic top soil layer, characterizes the dry lJzermonding dune grassland.<br />
The vegetation can be classified as a Toftulo-Koelerion (Phleo-Tortuletum ruraliformrs,<br />
ScHnmtruEr et al., 1996).It contains several annual and biennial plant species (e.g. Cerastium<br />
semi<strong>de</strong>candrum, Phleum arenarium, Crepis capillari), accompanied by some perennials (like<br />
Sedum acre) and some smaller graminoid species (e.g. Festuca rubra, Carex arenaria).<br />
Stabifisation of the substrate results in <strong>de</strong>nse moss patches, dominated by Homalothecium<br />
lutescens and Tortula ruralisvar. ruraliformis, in which also other annual species as Myosotis<br />
ramosissrma, Veronica aruensis, Arenana serpyllifolia and perennial herbs like Galium verum<br />
appear' Some parts of the grassland have been overgrown by increasingly dominant<br />
Calamagrostis epigejos and Hippophae rhamnoi<strong>de</strong>s.<br />
As mentioned before, the grassland in Ghyvel<strong>de</strong> is fundamentally different from the<br />
grassland in the IJzermonding by its acid soil. The vegetation can be assigned to the<br />
Plantagini-Festucion (Festuco-Galietum veri, scnAtrNtt et al., 1996) and corynephorion<br />
canescentis (Violo-Corynephoretum, ScnaurruEr et a/., L996). More or less acidophytic moss<br />
species (e.9. Dicranum scoparium, Polytrichum juniperinum) and lichens dominate large<br />
sudaces. Carex arenaria, Anthoxanthum odoratum, Luzula campestris and Rumex acetosella<br />
are the more impoftant herb and grass species, accompanied by, for example, Viola curtisii<br />
and Mibora minima. The dominant shrub species here is Ligustrum vulgare.<br />
The semi-controlled mowing experiment was carried out in another study area (see<br />
above): 'Puyenbroeck'. The Flemish Provincial Domain Puyenbroeck (Wachtebeke, Belgium,<br />
5109'11" N, 3052?3" E) is managed by the Provincial Government East-Flan<strong>de</strong>rs. The area is<br />
situated ca. 75 km W from Nieuwpooft. At this site, wiU rabbits are the dominant natural<br />
grazers (absence of large grazers). We selected two flat, monotonous lawns in the study<br />
area Puyenbroeck, both bor<strong>de</strong>red by a Poplar plantation and mown at regular intervals.<br />
L4 Chapter I
Refer€nces<br />
AR5ENAULT, R. & N. OryEN-SMrH (2002). Facilitation versus competition in grazing herbivore<br />
assemblages. Oikos 97 : 313-318.<br />
AusrRHErM, G., A. MysrERUD, K. HAssEL, M. EVJU & R.H. Orr-eno (2007). Interactions bewveen sheep,<br />
ro<strong>de</strong>nts, graminoids, and bryophytes in an oceanic alpine ecosystem of low productivity.<br />
Ecoscience 74:. I7B-187.<br />
BAFTEMAN, C. (2001). The Holocene <strong>de</strong>velopment of De Moeren and the Inland Dunes (Western<br />
coastal plain of Belgium). Excursiegids Field Meeting 2nd lune 2001 to the Western Coastal<br />
Plain, De Moeren and Inland Dunes. Belgian Geological Survey.<br />
Baxren, E.S., H. OLFF & LM. GLETCHMAN (2009). Contrasting effects of large herbivore grazing on smaller<br />
herbivores. tusic and Applid EcologyLO: 141-150.<br />
BEG9N, M., J.L. HARpER & C.R. TowHseruo (1990). Ecology. Individuals, populations and communities.<br />
Second edition. Blackwell Scientific Publications: 945 pp.<br />
BELovsKy, G.E., J. FRv1ELL & O.J. ScHMrz (1999). Natural selection and herbivore nutrition: optimal<br />
foraging theory and what it tells us about the structure of ecological communities. In: JUNG,<br />
H.J.G. & G.C. FAHEv (eds), Nutritional Ecology of Herbivores. Proceedings of the Vth<br />
International Symposium on the Nutrition of Herbivores. American Society of Animal Science,<br />
Savoy, Illinois, USA: 1-70.<br />
BELsKy, A.l. (1986). Does herbivory benefit plants? A review of the evi<strong>de</strong>nce. The American Naturalist<br />
127:870-892.<br />
Bos, D., l. vAN DE KoppEL, & F.J. WErssrNG (2002a). Brent Geese aggregate to cope with increased levels<br />
of primary production. In Bos, D., Grazing in coastal grasslands, Brent Geese and facilitation by<br />
herbivory, PhD dissertation, Rijksuniversiteit Groningen, Groningen, the Netherlands: 85-106.<br />
Bos, D., M. LooNEN, M. Stocx, F. Horrom, S. vnru orn Gnnnr & J.P. BAKKER (2002b). Utilisation of<br />
Wad<strong>de</strong>n Sea salt marshes by geese in relation to livestock grazing. In Bos, D., Grazing in<br />
coastal grasslands, Brent Geese and facilitation by herbivory, PhD dissertation, Rijksuniversiteit<br />
Groningen, Groningen, the Netherlands:131-153.<br />
CnnnaAilo, R. & J. Preuen (1998). The digestive System of the Rabbit. In DE BLAS, C. & J. WISEMAN J<br />
(eds), The nutrition of the rabbit, CABI Publishing, Wallingford, UK: 1-16.<br />
Cnrruc, E. & M.E. RrcHrE (2006). Impacts of simulated livestock grazing on Utah prairie dogs (Cynomys<br />
parur<strong>de</strong>ns) in a low productivity ecosystem. Oecologia 147: 546-555.<br />
CoppocK, D.1., J.K. DETLTNG, l.E. ELus & M.I. DvER (1983). Plant-herbivore interactions in a North-<br />
American mixed-grass prairie. L Effects of black-tailed prairie dogs on intraseasonal<br />
aboveground plant biomass and nutrient dynamics and plant species diversity' Orcologia 56:. l-<br />
9.<br />
CoRBEr, G.B. (1994). Chapter 1. Taxonomy and origins. In TH9MPSoN, H.V. & C'M. Ktruc (eds), The<br />
European rabbit. The history and biology of a successful colonizer. Oxford University Press: 1-7.<br />
General introduction<br />
15
Drrxrn, J.J.A. & F. vnru LANGEVELDE (2007). Plant productivity and free-ranging herbivores impact spatial<br />
foraging patterns and population dynamics of refuge-living herbivores. In: DEKKER, J.J.A.,<br />
Rabbits, refuges and resources. How foraging of herbivores is affected by living in burrows. phD<br />
disseftation, Wageningen Universiteit, Wageningen, the Netherlands: 65-84.<br />
DEMMENT, M.W. & P.J. VAN Soesr (1985). A nutritional explanation for body-size patterns of ruminant<br />
and nonruminant herbivores. The American Naturalist 125: 641-672.<br />
Dnees, M, H. Gooout't, S. BRoEKHUIZEN, J. Dexrrn & D. KLEES (2007). Wil<strong>de</strong> konijnen. KNNV Uitgeverij,<br />
Zeist, the Netherlands, 93 pp.<br />
Dnees, M. (1989). Konijnen als grazers. Duin 12:156-158.<br />
DREES, M. (1998). Langoor. Over konijnen en vegetatie in <strong>de</strong> duinen. Duin2l:4-6.<br />
Dunnrur, D., H. FRnz, S. BLAIs & P. Durucnru (2003). The functional response in three species of<br />
herbivorous Anatidae: effects of sward height, body mass and bill size. Journal of Animal<br />
EcologyT2: 220-231.<br />
FARNswoRrH, K.D., S. FocARDI&J.A. Bee+raM (2002). Grassland-herbivore interactions: how do grazers<br />
coexist? The Amerian Naturalist I59: 24-39.<br />
Fox, A.D., J.N. KPJ5nANSEN, D.A. SrRouD & H. BoyD (1998). The effect of simulated spring goose<br />
grazing on the growth rate and protein content of Phleum pratenseleaves. Oeologia 116: 154-<br />
159.<br />
FRYXELL, J.M. (1991). Forage quality and aggregation by large herbivores. The American Naturalist<br />
138:478-498.<br />
GoRDoN, I.J. (1988). Facilitation of red <strong>de</strong>er grazing by cattle and its impact on red <strong>de</strong>er performance.<br />
Journal of Applied Ecology 25: L-10.<br />
Gnoss, J.E., L.A. SHIPLEY, N.T. HoBBS, D.E. SeALTNGER & B.A. WuNDER (1993). Functional response of<br />
herbivores in food-concentrated patches: tests of a mechanistic mo<strong>de</strong>l EcologyT4:778-791.<br />
HAIRSToN, N.G., F.E. SrqrrH & L.B. SLoBoDKIN (1960). Community structure, population control and<br />
competition. The America n Naturalist 94: 42I-425.<br />
HIMKAWA, H. (2001). Coprophagy in leporids and other mammalian herbivores. Mammal Reuiew3I:<br />
61-80.<br />
HoFFMANN, M., BoNTE, D., CosyNS, E., CRIEL, p., Meeunr, J.-p., pRovoosr, S., SoMERS, N. & STRUWE, T.,<br />
2005. Evaluatie Begrazing Kustduinen, 1997-2004. On<strong>de</strong>rzoek en evaluatie van <strong>de</strong> biologische<br />
gevolgen van acht jaar begrazing in <strong>de</strong> <strong>Vlaams</strong>e Westkustreservaten. Ghent, Ghent University<br />
and Brussels, <strong>Instituut</strong> of Nature Conservation, un<strong>de</strong>r the authority of AMINAL, Dept. Nature,<br />
447 pp.<br />
lnsoru, G.R., T. MANSo, D.A. SIM & F.G. HARTLEv (2002). The functional response does not predict the<br />
local distribution of European Rabbits (Oryctolagus cuniculus) on grass swards: experimental<br />
evi<strong>de</strong>nce. Functbnal Ecology 16: 394-402.<br />
Jnrsseru, M. (2004). Op <strong>de</strong> bres <strong>voor</strong> het konijn. Duin27:3-4.<br />
KEESING, F. (1998). Impacts of ungulates on the <strong>de</strong>mography and diversity of small mammals in<br />
central Kenya. Oecologia 116: 38l-389.<br />
15 Chapter I
KRUEGER, K. (1986). Feeding relationships among bison, pronghorn, and prairie dogs: an experimental<br />
analysis. Ecology 67 : 7 60-77 0.<br />
KUUPER, D.p.J. (2004). Small herbivores losing control. Plant-herbivore interactions along a natural<br />
productivity gradient. PhD dissertation, Rijksuniversiteit Groningen, Groningen, the Netherlands.<br />
KuupER, D.p.J., P. BEEK, S.E. vAN WTEREN & J.P. BAKKER (2008). Time-scale effects in the interaction<br />
between a large and a small herbivore. tusic and Applied Ecology9: t26-I34'<br />
LocKLEy, R.M. (1976). The private life of the rabbit. Het Spectrum, Utrecht, the Netherlands, 179pp.<br />
LSNDBERG, p. & M. A5TROM (1990). Functional response of optimally foraging herbivores. -lournal of<br />
Theoretica I Biolqy L44: 367 -377'<br />
LSNDBERG, p. (1988). Functional response of a small mammalian herbivore: the disc equation revisited.<br />
lournal of Animal Eco/ogy57: 999-1006'<br />
MCNAUGHToN, S.J. (1976). Serengeti migratory wil<strong>de</strong>beest: facilitation of energy flow by grazing.<br />
Science t9l:92-94.<br />
MgNAUGHT9N, S.l. (1979) Grazing as an optimization process: grass-ungulate relationships in the<br />
Serengeti. The American Naturalist Ll3: 691-703'<br />
MgNAUGHTSN, S.J. (1983) Compensatory plant growth as a response to herbivory. Oikos 4O:. 329-336.<br />
M6NAUGHT9N, S.J. (1984) Grazing lawns: animals in herds, plant form and co-evolution. The Amerian<br />
Na tu ra I ist I24 : 863-886.<br />
MTLCHUNAS, D.G., A.S. VARNAMKHA5TT, W.K. LAUENRoTn & H. GoEz (1995). Forage quality in relation to<br />
long-term grazing history, current-year <strong>de</strong>foliation, and water resource. Oecologia 101: 366-<br />
374.<br />
MysrERUD, A. &G. AUSTRHETM (2008). The effect of domestic sheep on forage plants of wild rein<strong>de</strong>er; a<br />
landscape scale experiment. European Journal of wildlife Research 54; 461-468.<br />
OKSANEN, 1., S.D. FRFTryELL, J. ARRUDA & P. NTEMELA (1981). Exploitation ecosystems in gradients of<br />
primary productivity. The Amerian Naturalist lI8" 240-26t'<br />
OLFF, H. & S.F. BoERSMA (1998). Langoor. Lange termijn veran<strong>de</strong>ringen in <strong>de</strong> konijnenstand van<br />
Ne<strong>de</strong>rlandse duingebie<strong>de</strong>n. Oozaken en gevolgen <strong>voor</strong> <strong>de</strong> vegetatie. Landbouwuniversiteit<br />
Wageningen, Leerstoelgroep Natuurbeheer en Plantenoecologie, Wageningen, the Netherlands.<br />
OLFF, H., J. DE LEEUw, l.P. BAKKER, R.J. PLATERINK, H.J. vAN WDNEN & W. DE MUNCK (1997). Vegetation<br />
succession and herbivory in a salt marsh: changes induced by sea level rise and silt <strong>de</strong>position<br />
along an elevational gradient. Journal ofEcology85: 799-814.<br />
OrF, H., M.E. RrrcHrE & H.H.T. PRrNS (2002). Global environmental controls of diversity in large<br />
herbivores. Nature 4I5: 901-904.<br />
Oosrrnvelo, p. (1983). Eight years of monitoring of rabbits and vegetation <strong>de</strong>velopment on<br />
abandoned arable fields grazed by ponies. Acta Zoologica Fennica L74" 7l-74.<br />
pRrNs, H.H.T. & H. Our (1998). Species-richness of African grazer arsemblages: towards a functional<br />
explanation. In: Newaeny, D.M., H.H.T. PRINS & N. BRowN (eds), Dynamics of Tropical<br />
Communities, 37th Symposium of The British Ecological Society, Blackwell Science, UK: 449-<br />
490.<br />
General introduction<br />
t7
PRovoosr, S. & D. BoNrE (2004). Leven<strong>de</strong> duinen: een ovezicht van <strong>de</strong> biodiversiteit aan <strong>de</strong> <strong>Vlaams</strong>e<br />
kust. Me<strong>de</strong><strong>de</strong>lingen van het <strong>Instituut</strong> <strong>voor</strong> Natuurbehoud 22, Brussel, 420 pp.<br />
RoGERS, P.M., C.P. ARTHUR & R.C. Soplcuen (1994). Chapter 3. The rabbit in continental Europe. In<br />
THoMPSoN, H'V. & C.M. Ktrc (eds), The European rabbit. The history and biology of a successful<br />
colonizer. Oxford University Press: 22-62.<br />
Rueoa, M., s. REBoLLo, L. GALVEZ-BRAVo & A. EscuDERo (200g). Habitat use by large and small<br />
herbivores in a fluctuating Mediterranean ecosystem: implications of seasonal changes. Journal<br />
of Arid Environments 72: L69B-L708.<br />
RuESs, R.W. (1984). Nutrient movement and grazing: experimental effects of clipping and nitrogen<br />
source on nutrient uptake in Kyllinga neruosa. Oikos43:1g3-199.<br />
Scnnvlr'tEe, J.H.J., A.H.F. Srontloen & E.J. WEEDA (1996). De Vegetatie van Ne<strong>de</strong>rland. Deel 3.<br />
Plantengemeenschappen van graslan<strong>de</strong>n, zomen en droge hei<strong>de</strong>n. opulus press, Uppsala,<br />
Lei<strong>de</strong>n, 356 pp.<br />
SINcwR, A.R.E. & M. NoRroN-GRIFFrTHS, M. (1982). Does competition or facilitation regulate migrant<br />
ungulate populations in the serengeti? A test of hypotheses. oecologia 53: 364-369.<br />
Stnnl, J., A.J. vAN DER GRMF, R.H. DRENr & J.P. Barrrn (2006). Subtle interplay of competition and<br />
facilitation among small herbivores in coastal grasslands. Functional Ecology2g: 908-915.<br />
TncK, G', P. vAN DEN Bneur & M. HERMv (1993). Bossen van Vlaan<strong>de</strong>ren. Een historische ecologie.<br />
Uitgeverij Davidsfonds, Leuven, Belgium, 320 pp.<br />
TAHMASEBI KoHYANI, P. (2008). Grazer induced changes in dry, low-productive grassland plant<br />
communities. PhD dissertation, UGent, Ghent, Belgium, 136 pp.<br />
TnHMAsest KoHYANI, P., B. Bossurr, D. Borure & M. HoFFMANN (submitted). Plant performance plasticity as<br />
a mechanism of grazing tolerance.<br />
TERMoTE, J. (1992). Wonen op het duin. De bewoningsgeschie<strong>de</strong>nis van het duingebied tot aan <strong>de</strong><br />
Franse revolutie. In TERMoTE, J. (eds), Tussen land en zee. Het duingebied van Nieuwpoort tot<br />
De Panne, Lannoo, Tielt, Belgium: 46-87.<br />
VAN DE KoPPEL, J., J. HUISMAN, R. vaN DER WAL & H. oLFF (1996). Patterns of herbivory along a<br />
productivity gradient: an empirical and theoretical investigation. Eco/ogy77:736-745.<br />
VAN DER GRMF, A.J., D. Bos, M.J.J.E. LooNEN, M. ENGELMoER & R.H. DRENT (2002). Short and Iong-term<br />
facilitation of goose grazing by livestock. In Bos, D., Grazing in coastal grasslands, Brent Geese<br />
and facilitation by herbivory, PhD dissertation, Rijksuniversiteit Groningen, Groningen, the<br />
Netherlands:63-83.<br />
vAN DER Gnnnr, A.J., J. SrAHL & J.P. Baxxen (2005). Compensatory plant growth of Festuca rubra after<br />
grazing: can migratory herbivores increase their own harvest during staging? Functional Ecotqy<br />
19: 961-969.<br />
vAN LANGEVELDE, F., M. DRESCHER, I.M.A. HErrKoNrG & H.H.T. Pnrrus (2008). Instantaneous intake rate of<br />
herbivores as function of forage quality and mass: effects on facilitative and competitive<br />
interactions. Ecological Mo<strong>de</strong>lling 2I3: 27 3-284.<br />
VANDEKERCHoVE, D. & J.E. PEETERS (2002). On<strong>de</strong>zoek naar ziektes bij wil<strong>de</strong> konijnen in het <strong>Vlaams</strong>e<br />
18 Chapter 1
gewest. @DA{ERVA, Belgium.<br />
WAU-AGE-DREEs, J.M. (1988). Rabbits in oa$al sand dunes; weighed and counted. PhD dissertation<br />
University of Lei<strong>de</strong>n, Lei<strong>de</strong>n, the Netherlands.<br />
WTLLIAMS, O.B., T.C.E. Weus & D.A. WEus (1974). Grazing management of Woodwalton fen: seasonal<br />
dranges in the diet of cattle and nbb'rts. ,r,*1sf Arylid EnbgyLt:499-516.<br />
@nenl intodudiql
20<br />
Mergelland sheep (IJzermonding, 2005) Exclosure (IJzermonding, 2001)<br />
Exclosure (Dune Fossile <strong>de</strong> Ghyvel<strong>de</strong>, 2005) Haflinger horses (Dune Fossile <strong>de</strong> Ghyvel<strong>de</strong>, 2004)<br />
(Photographs by N. Somers)
CHAPTER 2<br />
Ihe effect of rabbits<br />
(Oryctolag us cun icu I us L-)<br />
1522 0 6<br />
and lalge herbivones on dry dune grassland<br />
structurc and comPosition<br />
Nele somers, Kauien De Maeyer, Beatrijs Bo6suyt, Luc Lens & Maurice Hoffinann<br />
2l
Abstract<br />
The wifd rabbit (Oryctolagus cuniculusL.) has often been mentioned as an important species<br />
for vegetation structure and composition in European coastal dune landscapes, through<br />
consumption of plants, digging, latrines, zoochory and effects on below-ground biota. This<br />
study focuses on grazing and digging effects of rabbits, when in combination with large<br />
herbivores. An exclosure experiment was carried out to measure the effect of rabbits and the<br />
combination of large herbivores and rabbits on vegetation structure and composition in two<br />
different coastal dune areas. We hypothesized that progressively excluding grazers would<br />
lead to a more rough vegetation structure (higher vegetation, higher litter cover, higher bare<br />
soil cover, expansion of shrubs and competitive graminoids, leading to a <strong>de</strong>cline of annual<br />
plant species and mosses). We expected these structural differences to result in changes in<br />
vegetation composition, due to competitive effecG and changing possibilities for<br />
germination. In all cases, the combination of rabbiB and large grazers as well as rabbits<br />
without large grazers were able to diminish vegetation height and litter cover. Additionally,<br />
rabbits created bare soil patches, giving extra structural diversity. Through these structural<br />
impacts, grazer activity maintained plant species diversity in only one of the study areas. The<br />
effect of rabbits on vegetation was smaller than the combined effect of rabbits and large<br />
grazers. Therefore, it is conclu<strong>de</strong>d that rabbit presence is not sufficient to stop succession of<br />
the open, species rich dune grassland to rough grass or shrub dominated, species poor<br />
grassland' Because of the ad<strong>de</strong>d effect of digging activity of rabbits, a combination of<br />
grazing by large herbivores and rabbits is the best grazing management option for these<br />
coastal dune areas.<br />
22 Chapter 2
Introduction<br />
Since maintaining plant diversity is a central goal in the management of biodiversity<br />
throughout the world (Or-rr & RrrcHIE, 1998), the effect of herbivores on the vegetation<br />
<strong>de</strong>serves our attention, even when it concerns medium-sized herbivores. Different herbivore<br />
species may have different effects and assemblages of different herbivores may have<br />
compensatory or additive effects (turcnlE & OLFF, 1997). In this study we will specifically<br />
focus on the effect of grazing and digging activity of the rabbit (Orydolagus cuniculusL'),<br />
both separately and in combination with large herbivore grazing.<br />
The wild rabbit is often consi<strong>de</strong>red to be an important species for vegetation (LEES &<br />
Bru-, 2008): DREES (1989, 1998), or BRU|N (1991) and vAtl DER HAGEN (1994) stated that<br />
rabbits would be necessary to preserve the general structural and compositional diversity of<br />
coastal dune vegetation in the Netherlands. Variation in rabbit <strong>de</strong>nsity in space and in time is<br />
an important environmental factor in a dune area (Zrwn-KING & FREsco, 1977)' Also in<br />
Flan<strong>de</strong>rs, mo<strong>de</strong>rate rabbit grazing was shown to be positive for dune grassland conseruation<br />
(VAN STEERTEGEM, 1982). Rabbits influence vegetation by different mechanisms, of which<br />
grazing is the most direct mechanism. Herbivores are generally thought to enhance plant<br />
diversity by direct consumption of competitively dominant plant species, causing diminished<br />
competition for less competitive species (OLFF & RrrcHIE, 1998). The second mechanism is<br />
digging: soil disturbances can be created, thereby enhancing possibilities for (ru<strong>de</strong>ral,<br />
annual) plants to colonize and establish themselves (OLFF & RffcHIE, 1998). Third, grazing at<br />
selected sites and dunging at others causes nutrient re-distribution: rabbit pellets have been<br />
shown to locally fertilize the vegetation via latrines (WILLor et al., 2000)' Latrines make<br />
significant localised contributions to soil fertility and may therefore be important in<br />
establishing and maintaining plant cover. Zoochory is a fourth mechanism: seeds can survive<br />
the rabbit gut, hence enabling plants to be dispersed by the rabbits (PAKEMAN et al., 2002;<br />
CosyNs et al., 2005). Finally, it has been <strong>de</strong>scribed that rabbits can structure below-ground<br />
biota. WEARN & Glncr (2007) showed that mo<strong>de</strong>rate grazing by rabbits had a rapid and<br />
persistent positive effect on mycorrhizal colonization of the roots of three grass species'<br />
Rabbit grazing was found to diminish vegetation height (TttottlAs, 1960; RANWELL,<br />
1960; Vm STEERTEGEM, 1982), resulting in a <strong>de</strong>creasing the cover of litter (accumulation of<br />
<strong>de</strong>ad plant biomass - Vnu SrrunrEGEM, 1982; BAKKER et al., 2003b). Litter accumulation in<br />
ungrazed situations was observed to lead to <strong>de</strong>creased moss cover (rrn Hnnrrl & vnru orn<br />
MEULEN, 1995) and a <strong>de</strong>crease of the cover of annual grasses and forbs (TEN HARKEL & vAN<br />
DER MEULEN, 1995). Shrub enhancement can be retar<strong>de</strong>d by rabbit grazing (WArr, 1957;<br />
Impad on vegetatton
THoMAS, 1960; BAKKER et a/.,2004b). Also, rabbits create bare soil patches (VAN STEERTEGEM,<br />
1982; rrru HARKEL&vnru orn MEULEN, 1995; BAKKER&O1FF,2003). These structural changes in<br />
vegetation caused by rabbits, combined with their selective grazing behaviour (Chapter 6)<br />
could lead to alterations in species composition of the grasslands. Grazing can cause a shift<br />
in plant composition towards an annual life history and an increasing relative abundance of<br />
forbs and annual grasses in dune grasslands (Tnnunsrer KoHyANr, 2008). This is partially<br />
<strong>de</strong>pending on the individual plant tolerance to herbivory and on competitive relations<br />
between competitive plant species and subordinate species: small annual olants can be<br />
released from competition when highly competitive grasses are suppressed by grazing or<br />
digging. An enhancement of thick grass layers when excluding rabbits has in<strong>de</strong>ed been<br />
observed (wnrr, 1957; vAN DER HAGEN, 1994), as well as negative changes in species<br />
composition (<strong>de</strong>creasing diversity, ZEEVALKTNG & FREsco, 1977; VAN STEERTEGEM, 1982). These<br />
trends are not universal: the variation in rabbit <strong>de</strong>nsity (ZEEVALKTNG & FRESco, t977; van<br />
STEERTEGEM, 1982), soil conditions (Werr, 1962; TAHMASEBT KoHyANr, 2008) and productivity<br />
(BAKKER et al., 2006) can also be critical factors in an ecosystem, affecting the extent of the<br />
effect of grazing on vegetation.<br />
After the collapse of the rabbit populations following the introduction of myxomatosis<br />
in 1952 (Locrrw, 1976), there was a lot of interest in studying the effects of rabbits on<br />
vegetation in Western Europe. WArr (1957; 1962) studied the impact of rabbit grazing by<br />
using exclosures; ZrrvnLnruc & Fnrsco (1977) compared plots with variable <strong>de</strong>grees of rabbit<br />
grazing; several authors (RANWELL, 1960; THOMAS, 1g60; WHFE, 1961; THOMAS, 1g63) used<br />
the advent of myxomatosis as a kind of "natural experimenti analysing the changes in the<br />
vegetation after the disease caused a major crash of the rabbit populations. Little is known<br />
about whether rabbits nowadays are still important in dune grasslands. The rabbit<br />
populations are generally supposed to be small nowadays, partly as a consequence of the<br />
outbreak of RHD (Rabbit Haemorrhagic Disease - VANDEKERcHovE & PEFTERs, 2002; JANSSEN,<br />
2004)' Also, there is a recent trend of introducing large herbivores in nature reserves<br />
(Horrunrun et al., 2005) and the question is raised whether the presence of rabbits has<br />
become superfluous for the conservation of the dune grassland structure and composition.<br />
Recent studies of Barrrn (2003) in the Netherlands suggest that this is not the case in an<br />
alluvial plain grassland situation in the Netherlands: a combination of cattle and rabbits<br />
would be the best grazer combination to enhance species as well as structural diversity.<br />
This paper <strong>de</strong>scribes a similar study, carried out in two different coastal dune areas<br />
along the Belgian and Northern French coast, which are grazed by rabbits on the one hand,<br />
and sheep or horses on the other. The areas differ significantly in soil pH (largely due to<br />
24 Chapter 2
differences in calcium concentration of the soil) and associated age, leading to different<br />
kinds of grassland types, belonging to respedively Tortulo-Koelerion (Phleo-Tortuletum<br />
ruraliformis, ScnnurruEe et al., L996) and Plantagini-Festucion (Festuco-Galietum veri'<br />
ScnlmrnEe et al., tgg6). We hypothesize that the rabbit is a crucial species for the vegetation<br />
in these dry sand dune areas: rabbit grazing is expected to cause a lower vegetation height,<br />
a higher bare soil cover, a <strong>de</strong>crease in shrub cover and a <strong>de</strong>crease of litter cover. We<br />
hypothesize that these effects lead to a shift in vegetation composition, whereby perennial<br />
grasses cover <strong>de</strong>creases, thereby promoting annual plant species and moss cover, which<br />
would eventually lead to a higher number of species in the vegetation' We further<br />
hypothesize that rabbit impact is quite similar to the combined impact of large grazers and<br />
rabbits and that rabbit impact is largely similar in both areas, <strong>de</strong>spite their large soil<br />
conditional differences and different accompanying large herbivores'<br />
Materials & Methods<br />
Study area<br />
Exclosure experiments were conducted in coastal dune grasslands at the Flemish<br />
Nature Reserue 'IJzermonding' (Nieuwpoort, Belgium; 51"9'4" N, 2o43'57" E; managed by<br />
ANB, Flemish Government) and the French Nature Reserve 'Dune Fossile <strong>de</strong> Ghyvel<strong>de</strong>'<br />
(Ghyvel<strong>de</strong>, France, 5I"2'48" N, 2o33'02" E; managed by Conservatoire du Littoral)' Both<br />
sites were located ca. 25 km apart from each other. At both sites, wib rabbits comprise the<br />
dominant natural grazers while large domestic herbivores are used for grazing management<br />
(IJzermonding: Mergelland sheep, Ovis aries L.; Ghyvel<strong>de</strong>: Haflinger pony, Equus caballus<br />
L.). More information about these dune areas and the introduced large grazers can be found<br />
in Chapter 1.<br />
Exclosure-experiment<br />
Between August 1999 - April 2000, a total of five exclosures (each consisting of three<br />
treatments of 350 x 350 cm) were set up along shrub-grassland edges in coastal dune<br />
grasslands at Uzermonding and Ghyvel<strong>de</strong> (Figure 1). Within each exclosure treatment, six 75<br />
x 75 cm permanent quadrates (pqs) were <strong>de</strong>lineated and assigned to one of the three<br />
treatments: (i) larger herbivores, rabbits and smaller herbivores allowed (L+R+S); (ii) larger<br />
herbivores exclu<strong>de</strong>d (R+S); (iii) larger herbivores and rabbits exclu<strong>de</strong>d (S). L+R+S<br />
Impad on vegebtion<br />
25
treatments were not fenced, R+S treatments were fenced with non rabbit-proof wire, S<br />
treatments were fenced with rabbit-proof wire.<br />
Fioure 1: Schematic presentation of one exclosure-group. Each group is positioned near shrubs and<br />
consists of one L+R+S-treatment (accessible to all herbivores), one R+S-treatment (accessible to<br />
rabbits and smaller herbivores, not to larger herbivores) and one S-treatment (accessible to small<br />
herbivores but not to rabbits and larger herbivores). Six pqs of 75 cm by 75 cm are marked off within<br />
each treatment.<br />
Vegetation measurements in all pqs were carried out four times: spring 2000 (April<br />
2000), summer 2000 (June - september 2000), summer 2001 (July - September 2001) and<br />
summer 2005 (August - September 2005). As horses did enter the S treatment in exclosures<br />
3 and 5 in Dune Fossile <strong>de</strong> Ghyvel<strong>de</strong> in 2005, no measurements were done in this pqs in<br />
summer 2005.<br />
vegetation height was measured at 25 fixed points in each pq by lowering down a<br />
disc (diameter 15 cm) with a central slot around a vertically held ruler, measuring the height<br />
at which the disc touched the vegetation first. This method is a combination of the "drop disc<br />
method" and "sward stick method", both <strong>de</strong>scribed and evaluated in STEWART et al. (2001).<br />
The 25 measurements were averaged, resulting in one average vegetation height for each<br />
pq.<br />
f"-"'="=":r:_:--r'q<br />
:I-l E.l LLirtrtrtrr<br />
|..H..H..F...: L F-q .: -t-<br />
L+R+S: R+S:<br />
Accssible to all Accesible to rabbib<br />
gnzers and smaller herbivores<br />
(not to large herbivores)<br />
trtrtr<br />
EEE<br />
S:<br />
Not accessible to<br />
rabbits and large<br />
herbivores<br />
In each pq, all plant species (including mosses and lichens) were <strong>de</strong>termined<br />
(following HENNIPMAN (L978), VAN DoBBEN & KoEMAN (1978), LANDWEHR (1984), ToUW &<br />
RUBERS (1989), vAN DER MEUDEN (1996), LAMBTNoN et a/. (Lgg8) and Veru Dor{t et al. (1ggg) -<br />
Appendix 11 and 12) and their cover was estimated using the Londo scale (LoNDo 1975). We<br />
26<br />
Chapter 2
also estimated the percentage of bare soil cover, cover of woody plants (shrubs), cover of<br />
non-woody plants, cover of graminoid species (Poaceae, Cyperaceae and Juncaceae<br />
together), cover of mosses (including lichens) and cover of litter.<br />
Between April-september 2000 and August 2001- september 2005, monthly or bi-<br />
monthly counts of rabbit pellets were performed in L+R+S and R+S pqs. To estimate the<br />
rate of pellet <strong>de</strong>cay, 100 freshly collected pellets were placed in the S treatment within each<br />
exclosure and the remaining pellets were counted during the following visit. To estimate<br />
local rabbit <strong>de</strong>nsities, we used the method of TAYLoR & WILLIAMS (1956), taking into account<br />
daily production of pellets per individual, rate of pellet <strong>de</strong>cay, and time interval between<br />
consecutive counts:<br />
number of rabbits/ha = !!2.k-l-lll1.k2 . In(kl / k2)<br />
g.(kl - k2) (t2 - tl)<br />
in which<br />
m1, m2: mean number of pellets per plot during the Rrst (1) and second (2) count, at<br />
the level of the study site; as pellets were removed from each plot after each count, m1=0;<br />
t2-t1: time interval between two consecutive counts; k1, k2: rate of pellet <strong>de</strong>cay based on<br />
samples of 100 pellets exposed away from rabbits; g: number of pellets produced per rabbit<br />
and per day, estimated at 333 which was the average of 360 pellets/ind/day reported by<br />
LocKLEy (L962; L976) and 305 pellets/ind/day based on nine days' counts of pellets of six<br />
domestic rabbits (Chapter 5). Local rabbit <strong>de</strong>nsities were calculated per counting date and<br />
study area.<br />
Statistical analysis<br />
As the data did not meet the assumptions for parametric analysis, non-parametric<br />
analyses (Kruskal-Wallis-tests) were carried out to test whether the grazing treatments<br />
resulted in significant differences in vegetation structure and composition. All tests were<br />
performed per season and per study area with TREATMENT as the in<strong>de</strong>pen<strong>de</strong>nt variable.<br />
Various response variables were tested: mean vegetation height, the percentage of bare soil<br />
cover, cover of woody plants (shrubs), cover of non-woody plants, percentage of graminoid<br />
species cover in the non-woody cover, cover of mosses, cover of litter, number of species<br />
per plot, percentage of annual plant species cover in the non-woody cover and the cover of<br />
Impact on vegetation<br />
27
plant species that were present in 120 or more plots per year and over the four seasons<br />
(except for the shrub species which would be very strongly correlated with woody plant<br />
cover and some less clearly i<strong>de</strong>ntifiable species). Also, Simpson's in<strong>de</strong>x of diversity was<br />
calculated and tested statistically the same way. Simpson's in<strong>de</strong>x of diversity was calculated<br />
as:<br />
1 - In (n-1)<br />
N (N-1)<br />
in which n = the total cover of a particular species and N = the total cover of all species<br />
(after Slmesoru, 1949). Sequential Bonferroni correction was applied for every four tests of a<br />
<strong>de</strong>pen<strong>de</strong>nt variable per study area. For example, Bonferroni correction was applied for the<br />
four tests of mean vegetation height in IJzermonding in spring 2000, summer 2000, summer<br />
2001 and summer 2005. The correction was applied sequential, which means that for<br />
example the most significant p-value was multiplied by 4, while the least significant p-value<br />
was multiplied by 1.<br />
Non-parametric Spearman correlations were performed to test the <strong>de</strong>pen<strong>de</strong>nce of<br />
species richness (total number of species) or species diversity (Simpson's in<strong>de</strong>x of diversity)<br />
and bare soil cover (global analysis per study area).<br />
Species composition and abundance data were also analysed with multivariate<br />
ordination techniques. DCA was used when the length of gradient was larger than 2.3; pCA<br />
was used in the other cases (JorucuAN et al., 1987). Differences between the scores of the<br />
pqs along the first ordination axis per exclosure group and per season were tested by<br />
Kruskal-Wallis-test, with TREATMENT as the in<strong>de</strong>pen<strong>de</strong>nt variable. As differences between<br />
exclosure groups, resulting from the ordinations, were larger than differences between<br />
treatments within an exclosure group, these analyses were performed separately for each<br />
exclosure group. PC-ord 4 was used for ordinations. The non-parametric analyses were<br />
performed using SAS 9.1. Sequential Bonferroni correction was applied for every five tests of<br />
a <strong>de</strong>pen<strong>de</strong>nt variable per study area and per period (e.g. the five tests for the five exclosures<br />
in Uzermonding in summer 2000).<br />
The analyses from spring 2000 were shown separately in Appendix 1,2,3, 4 and 5,<br />
as these were consi<strong>de</strong>red to represent more or less the original state of the vegetation<br />
(comparable to the situation before the establishment of exclosures).<br />
28 Chapter 2
140<br />
130<br />
120<br />
(E 4.^<br />
< rrv<br />
E 1oo<br />
ES0<br />
€Bo<br />
3oo<br />
OEn<br />
ll rv<br />
E40<br />
Z30<br />
20<br />
10<br />
n<br />
Results<br />
Rabbit activity<br />
The rabbit activity in Ilzermonding and Dune Fossile <strong>de</strong> Ghyvel<strong>de</strong> shows a cyclical<br />
course, generally with peaks in spring and summer months (Figure 2). From April 2000 until<br />
the summer of 20O2, rabbit activity is higher in IJzermonding compared to Dune Fossile <strong>de</strong><br />
Ghyvel<strong>de</strong>, but since the beginning of 2003, the pattern is reversed with higher rabbit activity<br />
in Ghwel<strong>de</strong> than in the lJzermonding. This pattern remains stable until the last counts in<br />
2005.<br />
Figure 2: Presence of rabbits in the Wvo study areas, expressed as number of rabbits/ha, calculated by<br />
the formula of TAyLoR & Wrr-uaus (1956). No data are availa<strong>de</strong> for November 2000 until July 2001.<br />
Impact on vegebtnn<br />
Date<br />
29
Vegetation structure<br />
Several characteristics of the vegetation structure in IJzermonding have been influenced by<br />
the grazing treatment (Figure 3, Appendix 6 and 8, see also Appendix 1 and 3). As woody<br />
plant cover and moss cover are already significantly different in spring 2000, we cannot be<br />
ceftain that these differences were due to the grazing treatment and we will not draw<br />
conclusions from these results. Trends originating during the course of the experiment and<br />
still visible In summer 2005 are: i) significant differences in vegetation height (highest in<br />
vegetation in S, lowest in L+R+S); ii) a significantly different bare soil cover percentage<br />
between the treatments (lower percentage in S); iii) significant differences in annual plant<br />
species cover (with a different pattern in different years); iv) a significantly higher litter cover<br />
in S. The percentage cover of non-woody plants (higher cover in S) and of graminoid species<br />
(higher cover in S) showed significant differences during the course of the field experiment,<br />
but not in 2005. Comparing averages from year to year, we can see that the cover of bare<br />
soil, annuals and mosses has <strong>de</strong>clined over the years in general, while the other vegetation<br />
variables have generally increased over the years.<br />
Also in Ghyvel<strong>de</strong>, vegetation structure has been influenced by the grazing treatments<br />
(Figure 4, Appendix 7 and 9, see also Appendix 2 and 4). Parameters already significantly<br />
differing since spring 2000 are mean vegetation height, percentage cover of woody and non-<br />
woody plants and cover of annuals, so these are not further discussed. Bare soil cover, cover<br />
of graminoids and cover of litter are significantly different between treatments in 2005: bare<br />
soil cover in 2005 is highest in R+S, while graminoid and litter cover are highest in S. The<br />
cover of mosses shows no significant differences at all. When we compare the averages of<br />
the different years, we can see that the cover of annuals has <strong>de</strong>clined, while mean<br />
vegetation height, cover of woody plants and cover of litter generally have increased.<br />
Vegeta tion composition<br />
Overall differences in plant species composition and abundance (Appendix 10, see<br />
also Appendix 5) indicate that significant differences between the three treatments in both<br />
areas are already present since spring 2000, in the lJzermonding as well as in Ghyvel<strong>de</strong>.<br />
However, the differences between treatments in spring 2000 in the lJzermonding are smaller<br />
than the differences in the subsequent periods (Figure 5), indicating that differences<br />
between the treatments are not only spatial differences, but could be related to the<br />
treatments. This is not the case in Ghyvel<strong>de</strong>. Therefore, it is hard to attribute the general<br />
Chapter 2
plant species composition differences in Ghyvel<strong>de</strong> really to the treatments. Although there<br />
are differences between two consecutive grazing treatments (L+R+S versus R+S, or R+S<br />
versus S), these differences are not consistent. Contrary, in almost all the cases, the L+R+S<br />
treatment is significantly different from the S treatment.<br />
The total number of species per plot in the Ilzermonding significantly differs between<br />
almost all treatments since summer 2001 (Figure 3, Appendix 6 and 8, see also Appendix 1<br />
and 3). The number of species is generally lowest in S, and higher in L+R+S and R+S' The<br />
number of species per plot has <strong>de</strong>clined over the years. Simpson's in<strong>de</strong>x of diversity show a<br />
significantly lower species diversity in S. In Ghyvel<strong>de</strong> (Figure 4, Appendix 7 and 9, see also<br />
Appendix 2 and 4), the average number of species is statistically different between<br />
treatments only in summer 2005, when comparing L+R+S and S, with the highest number of<br />
species in L+R+S and the lowest number of species in S. Also here, the average number of<br />
species per plots has been <strong>de</strong>clining. Simpson's in<strong>de</strong>x of diversity was not significantly<br />
influenced by the grazing treatments in summer 2005 (but see summer 2001). The<br />
Spearman correlation showed a positive relation between number of species and bare soil<br />
cover percentage in lJzermonding (Rho = O.21, p < 0.0001), but not in Ghyvel<strong>de</strong> (Rho =<br />
0.08, p = 0.16). The correlation between bare soil cover and Simpson's in<strong>de</strong>x of diversity<br />
was not significant in IJzermonding (Rho - -0'10, p = 0'06), but was significant in Ghyvel<strong>de</strong><br />
(Rho=0.13,p=0.0006).<br />
eualitative plant species composition has changed during the subsequent years:<br />
certain species have disappeared; others have appeared (Appendix 13)' For example, in<br />
IJzermonding, some annuals (Erodium cicutarium, Vutpia sp.) disappeared from S, while the<br />
perennial grass species Arhenatherum elatius appeared in S and expan<strong>de</strong>d to R+S. Also,<br />
ouantitative differences are observed. In IJzermonding (Appendix 6 and 8), several species<br />
show significant differences between treatments in summer 2OO5: Arenaria serpyllifolia,<br />
Bromus hor<strong>de</strong>aceus subso. thominei, Calamagrostis epigeios, Hypochaeris radicata, Lotus<br />
corniculatus, Phleum arenarium, Poa pratensis, Sedum acre, Senecio jacobaea, Tortula<br />
ruralisvar. ruraliformis and Veronica aruensiq, some of them already earlier (Carex arenarn<br />
in summer 2000, Crepis capillarisand Leontodon species in summer 2001). A global trend is<br />
<strong>de</strong>tectable for the majority of these significantly different species: the significant differences<br />
are noticed when comparing L+R+S and S, or R+S and S, but seldom when comparing<br />
L+R+S and R+S. Most of these species have the lowest percentage of cover in S and a<br />
higher percentage of cover in L+R+S and R+S in the period of significant differences, often<br />
intermediate in R+S. During the course of the study, especially shrub cover (Hippophae<br />
rhamnoi<strong>de</strong>) has increased, which was apparently at the expense of annual and perennial<br />
Impad on vegetation<br />
31
90.00<br />
80.00<br />
€ 70.00<br />
0<br />
E 60.00<br />
"g a<br />
: sooo<br />
.9<br />
! o.oo<br />
o<br />
> 30.00<br />
t zo.oo<br />
10.00<br />
B)<br />
0.00<br />
24.00<br />
22.W<br />
20.00<br />
18.00<br />
I 16.00<br />
E ra.oo<br />
= I 12.00<br />
! ro.oo<br />
$ o.oo<br />
6.00<br />
4.00<br />
2-@<br />
0.00<br />
D<br />
N<br />
I<br />
-<br />
II<br />
T<br />
DT<br />
Fioure 3 (oart I)<br />
32<br />
o<br />
o<br />
o<br />
)e<br />
c)<br />
'100.00 .<br />
90.00<br />
80.00<br />
70.00<br />
60.00<br />
50.00<br />
40.00<br />
30.00<br />
b<br />
HA<br />
sumrer 2000<br />
o<br />
I<br />
- ra\\\<br />
l-R\\\<br />
N<br />
rsssl<br />
I<br />
summer2002 summs2oo3 summe.2oo4<br />
Pcrlod<br />
summ€r2002 summer2003 smm2004<br />
Prrlod<br />
smrer 2002 sumrer 2003 summer 2004<br />
Pcrlod<br />
I<br />
T<br />
st<br />
:*.'<br />
;::<br />
N<br />
T<br />
h<br />
lR+S<br />
xs9. b<br />
-<br />
N\\<br />
t\\\<br />
* N\\<br />
.JN<br />
rN<br />
R<br />
R<br />
R<br />
lL+R+S<br />
lR+s<br />
NS<br />
Chapter 2
D)<br />
25.00<br />
20.00 ;<br />
o<br />
E<br />
oq.<br />
o 15.00<br />
o<br />
0oAIA<br />
: 10.00 ,<br />
o<br />
.o<br />
Et<br />
z<br />
5.00<br />
E)<br />
0.00<br />
0.9<br />
ne<br />
.a 0.7<br />
e<br />
o<br />
.z u.b ^^<br />
t o nq<br />
x "'"<br />
o<br />
!<br />
'E o.+<br />
6<br />
I o.s<br />
e<br />
E<br />
6 0.2<br />
0.1<br />
0<br />
m<br />
summer 2000<br />
A<br />
summer 200<br />
summer2002 summer2003 summer2004<br />
Period<br />
R<br />
summer 2000 summer 2001<br />
summer2002 summer2003 summer2004<br />
Perlod<br />
lL+R+S,<br />
ER+S<br />
NS<br />
lL+R+S<br />
ER+S<br />
NS<br />
Figure 3 (part II): Mean and standard error of mean vegetation height, percentage of bare soil cover,<br />
percentage of litter cover, number of species per plot and Simpson's in<strong>de</strong>x of diversity in the<br />
exclosures in Uzermonding, per treatment and per season. L+R+S = all grazers. R+S = rabbits and<br />
smal6r herbivores, but no larger grazers. S = only herbivores that are smaller than rabbits. Standard<br />
errors are shown. Different letters stand for significant differences.<br />
Impact on vegebtion<br />
2a<br />
-r<br />
G<br />
E<br />
E<br />
Ek{<<br />
s sE\\<br />
ESN<br />
summer 2005<br />
ai<br />
GilI<br />
reI<br />
s<br />
s R<br />
c\\l<br />
s<br />
R<br />
-N m<br />
summer 2005<br />
33
- 30.00 ,<br />
40,00<br />
:<br />
35.00 i<br />
E zs.oo ,<br />
g:<br />
o;<br />
! m.oo ,<br />
0<br />
o:<br />
i 1o.oo :<br />
;<br />
e:<br />
o:<br />
5 1o.m ,<br />
N<br />
sumrn€r?000<br />
B)<br />
24.00<br />
22,O0<br />
20.00<br />
18.00<br />
! 16,00<br />
8 rn.oo<br />
E te.oo<br />
! ro.oo<br />
rr a.oo<br />
c'<br />
6.00<br />
4.00<br />
2.00<br />
0.00<br />
90.00<br />
80.00<br />
70.00<br />
. 60.00<br />
E *'*<br />
I 40.00<br />
* ao.oo<br />
T<br />
!<br />
ru<br />
IRN<br />
r q\\\<br />
I\\I<br />
m,00 Db<br />
10.00 :<br />
0.00<br />
"N<br />
Fiqure 4 (part I)<br />
rl<br />
J.N<br />
R\f<br />
n\\<br />
K\\<br />
- m\\<br />
m<br />
ENN<br />
m<br />
smmer2@1<br />
summsr2002 sumnrr2003 summor2004<br />
I<br />
A<br />
D<br />
l<br />
N<br />
Porlod<br />
'l summ 2002 sumrer 2003 summ 2004<br />
PTlod<br />
smmry 2002 ruow 2003 summr 2004<br />
P!rlod<br />
lL+R+S<br />
!R+S<br />
NS<br />
N<br />
summof 2005<br />
I LIR+S i<br />
lR+S<br />
sts<br />
b<br />
I<br />
I4<br />
-IT<br />
f<br />
-II<br />
I<br />
Mrer2005 -:<br />
ttL+niSl<br />
:lR+S<br />
:NS<br />
. I \\\\<br />
.IR\\<br />
ITNS<br />
34 Cltapter 2<br />
I
D)<br />
16.00 ,<br />
14.00 .<br />
6 rz.oo<br />
6.<br />
o<br />
e 10.00<br />
o<br />
I<br />
& 8.00<br />
o<br />
o<br />
i 6'00<br />
r<br />
: 4.oo<br />
E)<br />
2.00<br />
0.m<br />
0.80 i<br />
0.70 !<br />
i o.oo i<br />
F<br />
t:<br />
€i<br />
; 0.s0 ,<br />
o1<br />
!t r<br />
's o.no i<br />
* H o.so<br />
I'<br />
E<br />
6 o.?o i<br />
0.10 ;<br />
0.00<br />
iAT<br />
GN\<br />
ENSI<br />
-EN<br />
XN\<br />
ESN<br />
EN\I<br />
R<br />
N<br />
summer 2000<br />
N<br />
summer 2000<br />
summor 2001<br />
.a<br />
summer2002 summer2003 sumtner2004<br />
Pefod<br />
N<br />
summer 200I<br />
summer2002 summer2003 summer2004<br />
Period<br />
iru+Rrs<br />
iBR+S ,<br />
,sts I<br />
l"o<br />
II u<br />
s<br />
R<br />
N<br />
R<br />
m!\al<br />
R<br />
N RIEITNI<br />
summer 2005<br />
-L;i;s'<br />
gR+S<br />
aa<br />
NS<br />
N<br />
summer 2005<br />
Fioure 4 (oart ID: Mean and standard error of mean vegetation height, percentage of bare soil cover,<br />
percentage of litter cover, number of species per plot and Simpson's in<strong>de</strong>x of diversity in the<br />
exclosures in Dune Fossile <strong>de</strong> Ghyvel<strong>de</strong>, per treatment and per season. L+R+S = all grazers. R+S =<br />
rabbits and smaller herbivores, but no larger grazers. S = only herbivores that are smaller than<br />
rabbits. Standard errors are shown. Different letters stand for significant differences'<br />
Impact on vqetation<br />
35
non-woody plant species cover. In Ghyvel<strong>de</strong> (Appendix 7 and 9), species differing<br />
significantfy between treatments after spring 2000 are: Carex arenaria (not significantly<br />
different in 2005), Plagiomnium affine (significantly different between R+S and S, highest<br />
cover in S), Pseudoscleropodium purum (significantly different between L+R+S and the two<br />
other treatments, highest cover in L+R+S) and *nuio jambaa (significantly different<br />
between all the treatments, highest cover in L+R+S).<br />
Uzemndlng<br />
70<br />
m<br />
!so<br />
o<br />
!lo<br />
0<br />
530<br />
F<br />
E*<br />
- 10<br />
!<br />
E<br />
o<br />
o<br />
d<br />
o<br />
o<br />
o<br />
E I<br />
o<br />
o-<br />
sprtng 2000 summ€r 2000 sumrer 2001<br />
Dure Fo$llo <strong>de</strong> Gh!ryoldo<br />
t* i-*-soi<br />
*i<br />
80 1<br />
70<br />
60<br />
50<br />
40<br />
30<br />
20<br />
10<br />
o<br />
$mmr 2002<br />
P!riod<br />
summer 2003 summ€l 2004 smrer 2005<br />
spring2ooo sffi2000 summ2o0l summer2oo2 summer2oo3 summer2oo4 summer2oos<br />
p.dod<br />
T<br />
T ITXI<br />
-)
Discussion<br />
Vegetation strudure<br />
The exclosure experiment in the Ilzermonding and Ghyvel<strong>de</strong> reveals that different<br />
grazing treatments result in a different vegetation structure: effect on vegetation height,<br />
bare soil cover and litter cover. These three parameters globally are intermediate in the<br />
grazing treatment with only rabbits and smaller grazers.<br />
The intermediate vegetation height in R+S in the lJzermonding is varying: sometimes<br />
very close to L+R+S, sometimes more simibr with S. In Ghyvel<strong>de</strong>, the differences were<br />
already significant in spring 2000 and they increased in the subsequent periods. Although it<br />
is not possible to prove that these were caused by the grazing treatment alone, this<br />
hypothesis seems nonetheless very probable because of the latter observation. So rabbits at<br />
the given <strong>de</strong>nsities are able to reduce vegetation height significantly, confirming earlier<br />
findings of RANWELL (1960), THoMAs (1960), CMWLEY (1990), CMWLEY & WEINER (1991), vAN<br />
DER HAGEN (1994) and BAKKER et al. (2003a). However, their impact on vegetation height is<br />
less impoftant than in combination with larger herbivores.<br />
Related to this increase of vegetation height by excluding rabbits and larger<br />
herbivores, there is also an increase in litter accumulation. This effect was also observed by<br />
BAKKER et at. (2003b) in a much more nutrient rich alluvial plain grassland in the<br />
Netherlands. Although the effect of R+S is intermediate between L+R+S and S, R+S<br />
resembles L+R+S more, indicating that rabbits play an important role in diminishing litter<br />
quantity. This is true for the calcareous, dry pioneer grassland vegetation in the<br />
IJzermonding as well as for the acidophytic dry grassland in Ghyvel<strong>de</strong>. Litter accumulation is<br />
however much higher in lJzermonding (compared to Ghyvel<strong>de</strong>), which was probably due to<br />
the high litter accumulation in the expanding Hippophaelayer in IJzermonding. The shrub-<br />
layer in Ghyvel<strong>de</strong> had a lower cover percentage and was expanding more slowly.<br />
The third important significant difference between the treatments concerns the bare<br />
soil cover percentage. In the llzermonding, bare soil cover percentage is clearly lower in S;<br />
while in Ghyvel<strong>de</strong>, especially R+S has a high bare soil cover percentage in 2005. The<br />
absence of rabbits and larger herbivores makes the amount of bare soil almost disappear. In<br />
IJzermonding, it is not very clear whether the rabbits or the larger herbivores are responsible<br />
for the bare soil patches, but the results of Ghyvel<strong>de</strong> make clear that rabbits are able to<br />
create them, which is also observed in the studies of rrru Hnnrer & vAN DER MEULEN (1995),<br />
BAKKER & OLFF (2003) and BAKKER et al. (2OO4a). BAKKER & Orr (2003) observed that almost<br />
Impact on vegetation<br />
37
half of the bare soil patches in their study area were created by rabbits, slightly less than a<br />
quarter by moles. Anthills and cattle trampling contributed least to the occurrence of bare<br />
soil and also resulted in the smallest gaps.<br />
It was expected that the increasing vegetation height and litter cover would be<br />
disadvantageous for mosses (competition for light and space). The cover of mosses seems to<br />
be influenced by the grazing treatments in IJzermonding, but since the significant differences<br />
are already observed in spring 2000, this cannot be proven. In Ghyvel<strong>de</strong>, where mosses are<br />
an important part of plant diversity, moss cover was not influenced by the treatments.<br />
Therefore, it is not possible to draw straightforward conclusions about the effect of grazing<br />
both by rabbits and large grazers on moss cover. Although it should be mentioned that rEN<br />
HARKEL & vAN DER MEULEN (1995) observed a <strong>de</strong>crease of mosses after excluding rabbits, the<br />
effect of rabbit grazing on mosses is disputable: moss cover increased in some areas after<br />
the advent of myxomatosis (Tnours, 1960) and WHrrE (1961) shows that the effect of<br />
rabbits on moss cover largely <strong>de</strong>pends on the moss species un<strong>de</strong>r consi<strong>de</strong>ration. To<br />
un<strong>de</strong>rstand the effect of rabbits on moss vegetation, an analysis at species level is<br />
necessary.<br />
It is hard to come to a conclusion about the effect of the treatments on the cover of<br />
woody plants, non-woody plants, graminoid species and annual species in our study areas.<br />
The results are either already significant at the staft of the experiment, or not very<br />
consistent in time. Only in Ghyvel<strong>de</strong>, grasses become more dominant in the non-woody layer<br />
of the S treatment, compared to L+R+S and R+S. Other authors noticed effects of rabbit<br />
grazing on woody plants (zEEvAxrruc & FRESco, 1977; BAKKER et a/.,2004b) and an increase<br />
in the frequenry of perennial graminoids and a <strong>de</strong>crease in the frequency of annual<br />
graminoids and herbs (rEN HARKEL & vAN DER Mruun, 1995).<br />
Veg eta tio n composi tion<br />
Although not all vegetation structure parameters are significantly different between<br />
the treatments, the fact that vegetation height, litter cover and bare soil cover are<br />
influenced, has possible implications for plant species composition, abundance and diversity,<br />
The most diverse vegetation is found at a low vegetation height. Light limitation related to<br />
increased living biomass negatively affects plant species richness due to reduced local<br />
colonization (BAKKER et a1.,2003b). According to I-AMB (2008), litter is the primary mechanism<br />
structuring grassland diversity, with both richness and evenness <strong>de</strong>clining with increasing<br />
litter cover. In dry habitats, litter may have several effects on species richness, i.e. through<br />
Chapter 2
microclimate effects or providing nutrienG (BAKKER et al., 2O03b). Finally, by creating<br />
burrows, rabbits are loosening up the soil, increasing aeration (BAKKER et al., 2004a) and<br />
creating patches were germination success is strongly improved (compared to an<br />
undisturbed vegetation or to dung pats of large herbivores). As a result, a significant positive<br />
correlation between the occurrence of bare soil and plant species richness has been proven<br />
(BAKKER & OLFF, 2003). Our resulG only partially confirm this finding, but when a significant<br />
correlation was found, it was indicated that bare soil cover and number of species/species<br />
diversity are positively correlated. Therefore, we could expect that plant species diversity,<br />
composition and abundance would be <strong>de</strong>pen<strong>de</strong>nt on the grazing treatments in the<br />
IJzermonding and Ghyvel<strong>de</strong>.<br />
In Ilzermonding, plant diversity has in<strong>de</strong>ed <strong>de</strong>creased in S. R+S is again intermediate<br />
in position. This fact confirms the importance of rabbits in maintaining the diversity of dune<br />
grasslands, which was already mentioned by e.g. ZEEVALKING & FRESco (1977) and VAN<br />
STEERTEGEM (1982), who stated that species diversity is highest in the plots with mo<strong>de</strong>rate<br />
rabbit grazing; lowest in species number were the plots without rabbit grazing. In Ghyvel<strong>de</strong>,<br />
the number of species per plot has been influenced only since 2005. It is possible that the<br />
impoftance of the grazers for this ecosystem will become only clear after a longer period of<br />
time, but by now, the effect of vegetation structure differences in llzermonding and<br />
Ghyvel<strong>de</strong> does not lead to the same effect on diversity.<br />
Grazing seemed to have influenced plant species composition and abundance in<br />
IJzermonding (Figure 5). These effects seemed to be really due to the grazer treatments, as<br />
the spatial differences in species composition present in spring 2000 had become larger over<br />
the years. As the vegetation became more rough when progressively excluding herbivores,<br />
we expected perennial graminoids cover to increase in S and also in R+S in a lesser extent,<br />
causing annual plant species to <strong>de</strong>crease in these treatments due to competitive effects'<br />
Also, bare soil cover creation by rabbits in L+R+S and R+S should have offered more<br />
germinating possibilities to annuals. During the course of the experiment, several plant<br />
species, of which the abundance in the three treatments was quite similar in 2000, <strong>de</strong>clined<br />
in S, while staying more abundant in R+S and certainly in L+R+S' Several of them (e'9.<br />
Arenaria serpyllifolia, Bromus hor<strong>de</strong>aceus subsp. thominei, Phleum arenarium, Veronica<br />
aruensis) were in<strong>de</strong>ed annuals. Some typical plants of the Tottulo-Koelerion (Phleo-<br />
Tortuletum ruraliformit ScHnurn6e et al., 1996),like Phleum arenarium, Sedum acrq Tortula<br />
ruralisvar. ruraliformisand Arenaria serpyllifolia <strong>de</strong>creased in S or even disappeared from S<br />
(Erodium cicutarium), suggesting that the maintenance of this vegetation type was<br />
<strong>de</strong>pen<strong>de</strong>nt on the indirect effects of grazing and digging of the herbivores. Also the perennial<br />
Impact on vegetation<br />
39
grass species Calamagrostis epigejos had <strong>de</strong>creased in S, probably due to increasing<br />
competition from the expanding shrub layer. Although this rough grass had a higher cover in<br />
L+R+S than in S, the typical vegetation of the grassland (see above) is globally best<br />
preserved in the L+R+S treatment, intermediately in R+S, although this last treatment has a<br />
reasonably similar vegetation composition as L+R+S. This situation is equivalent to the<br />
situation observed by RANwELL (1960) after the disappearance of the rabbits by mp
of grazing on plant species richness was not consistent. Also Orr & RrrcHIE (1998) indicate<br />
the importance of the soil fertility, combined with other factors (e.9. precipitation):<br />
contrasting results of grazing studies may be <strong>de</strong>pen<strong>de</strong>nt on several factors. Our two study<br />
areas have a different soil acidity, which may be the critical difference between the two<br />
areas. It was shown that the mechanisms un<strong>de</strong>rlying vegetation responses to grazing may<br />
be primarily <strong>de</strong>termined by edaphic factors (Sasaru et al., 2008). Also, IJzermonding has an<br />
open pioneer vegetation which is different from the more or less stable closed-canopy<br />
grassland in Ghyvel<strong>de</strong> (Chapter 1). Another factor possibly causing differences between the<br />
two areas is the number of grazers. The rabbit populations in the two areas evolved<br />
differently. The large rabbit population in lJzermonding in 2001 and 2002 crashed, so that<br />
their numbers were quite low from autumn 2002 until the end of the experiment. The<br />
population in Ghyvel<strong>de</strong> was quite low in 2001, but expan<strong>de</strong>d and came to a climax in 2004.<br />
The importance of the number of grazers and severity of the grazing pressure can be <strong>de</strong>rived<br />
from the studies of Zrrvmruruc & FRESco (1977), BowERS (1993) and ALBoN ef al. (2007).<br />
Moreover, the large grazers involved in the two areas and their grazing regimes were very<br />
different (winter grazing of sheep in IJzermonding, year round grazing of horses in<br />
Ghyvel<strong>de</strong>). All these factors and the possible interactions between them make it impossible<br />
to find a straightforward explanation for the differences between both areas.<br />
Conclusions<br />
Different grazing treatments in our two study areas lead to significant differences in<br />
certain aspects of vegetation structure (vegetation height, litter cover, bare soil cover).<br />
Generally, we can conclu<strong>de</strong> that progressively excluding herbivore species leads towards a<br />
more rough vegetation. We expected these structural differences to influence plant species<br />
diversity, composition and abundance. This was in<strong>de</strong>ed the case in Ilzermonding, but only<br />
very limited in Ghyvel<strong>de</strong>. In llzermonding, grazing seemed to be necessary to preserve the<br />
typical dune vegetation composition.<br />
In most cases the influence of the rabbits is weaker than the combination with the<br />
impact of larger grazers. This intermediate position is similar to the findings of Bnxren ef a/'<br />
(2003a), and indicates that the rabbit populations in our study areas during the study period<br />
are not able to maintain the characteristic dune grassland vegetation. It seems that the<br />
introduction of large herbivores in these areas was in<strong>de</strong>ed necessary to preserve vegetation<br />
diversity and structure.<br />
Impact on vegebtion<br />
4t
However, effects of herbivores on different aspects of grassland ecology cannot be<br />
generalised: different herbivore species have different effects (BAKKER, 2003). The creation<br />
of bare soil patches is a property of rabbits, much more than of non-burrowing large grazers:<br />
large herbivores may create the conditions un<strong>de</strong>r which high species richness is possible, but<br />
rabbits are the main creators of bare soil patches (BnrrrR, 2003): the combination of large<br />
herbivores and rabbit grazing will probably result in a higher structural diversity and<br />
sometimes also higher species richness in dry dune grasslands, than in a system w1h large<br />
grazers but without rabbits. Therefore, the rabbit still has the potential to be an impoftant<br />
species in coastal dune succession, although not being able to preserue the dry dune<br />
grassland vegetation composition and structure on its own.<br />
Acknowledgements<br />
We thank the Agency for Nature and Forest (ANB, Flemish Government) and the<br />
Conservatoire du Littoral for allowing access to the study areas and making it possible to perform the<br />
experiments. Technical support was provi<strong>de</strong>d by Ward Vercruysse (INBO), Wim De Bel<strong>de</strong>r (INBO),<br />
Patrick Geers (INBO) and Maarten Pevenage. The first author is supported by the Research<br />
Foundation - Flan<strong>de</strong>rs (Aspirant of the FWO-Vlaan<strong>de</strong>ren).<br />
References<br />
ALBoN, s.D., M.J. BREWER, s. o'Bruer'r, A.l. NoLAN & D. copE (2007). euantifying the grazing impacts<br />
associated with different herbivores on rangelands. Journal of Apptid Eology44: tL76-lLB7.<br />
Bnxxrn, E.S. (2003). Herbivores as mediators of their environment. The impact of large and small<br />
species on vegetation dynamics. PhD dissertation, Wageningen Universiteif Wageningen, the<br />
Netherlands.<br />
BAKKER, E.S. & H. OLFF (2003). The impact of different-sized herbivores on recruitment opportunities<br />
for subordinate herbs in grasslands. In: Berrrn, E.S., Herbivores as mediators of their<br />
environment. The impact of large and small species on vegetation dynamics. PhD dissertation,<br />
Wageningen Universiteit, Wageningen, the Netherlands: 13-29.<br />
BAKKER, E.S., H. OLFF & J.M. GutcHueru (2003a). Compositional constancy in grazed plant communities<br />
increases with herbivore size. In: BAKKER, E.S., Herbivores as mediators of their environment.<br />
The impact of large and small species on vegetation dynamics. PhD dissertation, Wageningen<br />
Universiteit, Wageningen, the Netherlands: 55-77.<br />
BAxKER, E.S., H. OLFF, J.M. GLEICHMAN & F. BERENDSE (2003b). The interactive effects of grazing and<br />
litter on grassland plant diversity. In: Baxren, E.S., Herbivores as mediators of their<br />
environment. The impact of large and small species on vegetation dynamics. PhD dissertation,<br />
Chapter 2
Wageningen Universiteit, Wageningen, the Netherlands: 31-52.<br />
Brxren, E.S., H. OLrr, M. BoexnoFF, J.M. GuIcnunru & F. BERENDSE (200aa). Impact of herbivores on<br />
nitrogen cycling: contrasting effects of small and large species. Oecologia 138: 91-101.<br />
Bnxxen, E.S., H. OLFF, C. Vrt{oeneencHE, K. DE MAEYER, R. Sun, J.M. GLeIcHI4nN & F.W.M. Venn (2004b).<br />
Ecological anachronisms in the recruitment of temperate light-<strong>de</strong>manding tree species in<br />
woo<strong>de</strong>d pastures. Journal of Applied Ecology4t'.57t-582.<br />
BAKKER, E.S., M.E. RncHrE, H. OLFF, D.G. MTLCHUNA5 &J.M. KNoPs (2006). Herbivore impact on grassland<br />
plant diversity <strong>de</strong>pends on habitat productivity and herbivore size. Ecology Letters9:780-788.<br />
BowERS, M.A. (1993). Influence of herbivorous mammals on an old-field plant community: years 1-4<br />
after disturbance. Oikos 67 : I29-I4I.<br />
CosyNS, E., A. DELpoRrE, L. LENS & M. HoFFMANN (2005). Germination success of temperate grassland<br />
species after passage through ungulate and rabbit guts. Journal of Ecology93:353-361.<br />
CMWLEY, M.J. (1990). Rabbit grazing, plant competition and seedling recruitment in acid grassland.<br />
Journal of Applid Ecology 27 : 803-820.<br />
CRAWLEY, M.J. & J. WETNER (1991). Plant size variation and vertebrate herbivory: winter wheat grazed<br />
by rabbits. Journal ofApplied Ecology2S: L54-172'<br />
DE BRUDN, G.-J. (1991). Konijnen. Hoveniers in <strong>de</strong> duinen. Duin L4:23-24.<br />
Dnees, M. (1989). Konijnen als grazers. DuinL2'- 156-158.<br />
Dnees, M. (1998). Langoor. Over konijnen en vegetatie in <strong>de</strong> duinen. Duin2l:4-6'<br />
HENNTpMAN, E. (1978). Korstmossen - Lichenes. De Ne<strong>de</strong>rlandse Cladonia's. WetenschappelUke<br />
me<strong>de</strong><strong>de</strong>lingen K.N.N.V., nr. L24.<br />
HoFFMANN, M., BoNTE, D., CosYt'{s, E., CRlrL, P', MAELFAT, J.-P., PRovoost, S., SoMERS, N' & STRUWE, T'<br />
(2005). Evaluatie Begrazing Kustduinen, L997-2004. On<strong>de</strong>zoek en evaluatie van <strong>de</strong> biologische<br />
gevolgen van acht jaar begrazing in <strong>de</strong> <strong>Vlaams</strong>e Westkustreservaten. Ghent, Ghent University<br />
and Brussels, <strong>Instituut</strong> of Nature Conservation, un<strong>de</strong>r the authority of AMINAL, Dept. Nature.<br />
JANsseN, M. (2004). Op <strong>de</strong> bres <strong>voor</strong> het konrjn' Duin27:3-4'<br />
JoNGMAN, R.H.G., C.J.F. Trn Bnnnx & O.F.R. Vnn Tor,rcenerl (1987). Data analysis in community and<br />
landscape ecology. Pudoc, Wageningen.<br />
LAMB, E.G. (2008). Direct and indirect control of grassland community structure by litter, resources,<br />
and biomass. EcologY 89:. 216-225.<br />
LAMBINoN, )., ).-E. DE LANGHE, L. DELVosALLE & J. DuvtcnrnuD (1998)' Flora van Belgie, het<br />
Groothertogdom Luxemburg, Noord-Frankrijk en <strong>de</strong> aangrenzen<strong>de</strong> gebie<strong>de</strong>n (fteridofi/ten en<br />
Spermatofyten). Nationale Plantentuin van Belgid, Meise.<br />
LANDryEHR, J. (1984). Nieuwe Atlas Ne<strong>de</strong>rlandse Bladmossen. Stichting Uitgeverij K.N.N'V., nr. 38.<br />
LEES, A.C. & D.J. BELL (2008). A conservation paradox for the 21s century: the European wild rabbit<br />
Oryctofagus cuniculus, an invasive alien and an endangered native species. Mammal Review 3&<br />
304-320.<br />
LocKLEy, R.M. (1976). The private life of the rabbit' Het Spectrum, Utrecht.<br />
LocKtEY, R.M. (1962). Production of faecal pellets in the wild rabbrt. Nature 194: 9BB-989.<br />
Impact on vegetation<br />
43
LoNDo, G. (1975). De <strong>de</strong>cimale schaal <strong>voor</strong> vegetatiekundige opnamen van permanente kwadraten.<br />
Gorteria 7: 101-106.<br />
OLFF, H. & M.E. RircHIE (1998). Effects of herbivores on grassland plant diversity. Trends in Ecotogy<br />
and Evolution t3: 26t-265.<br />
PAKEMAN, R.J., G., DIGNEFFE, & J.L. Svmr- (2002). Ecological correlates of endozoochory by herbivores.<br />
Fundional Ecology 16: 296-304.<br />
RANWELL, D'S. (1960). Changes in the vegetation on parts of the dune system after the loss of rabbits<br />
by myxomatosis. Journal of Ecology4S: 385-395.<br />
RrrcHIE, M.E. & H. Orrr (1997). Chapter 6. Herbivore diversity and plant dynamics: compensatory and<br />
additive effects. In: Our, H., V.K. Bnowru & R.H. Dnerur (eds), Herbivores: Between plants and<br />
predators. The 38th symposium of the British Ecological Society in cooperation with the<br />
Netherlands Ecological Society held at the Wageningen Agricultural University, The Netherlands.<br />
Blackwell Science, Oxford : L75-204.<br />
sASAKr, T., T. oKAyAsu, Y. sHrMro, u. Jnnsnaru, s. oKUBo & K. TAKEUCHT (200g). can edaphic factors<br />
<strong>de</strong>monstrate landscape-scale differences in vegetation responses to grazing? Plant EcologyLg4:<br />
51-66.<br />
ScHautruEe, J.H.J., A.H.F. SToRTELDER & E.J. Weron (1996). De Vegetatie van Ne<strong>de</strong>rland. Deel 3.<br />
Plantengemeenschappen van graslan<strong>de</strong>n, zomen en droge hei<strong>de</strong>n. opulus press, uppsala,<br />
Lei<strong>de</strong>n, 356 pp.<br />
SIMpsoN, E.H. (1949). Measurement of diversity. Nature 163: 68g.<br />
STEWART, K.E.J., N.A.D. Bounlt & l.A. THoMAs (2001). An evaluation of three quick methods commonly<br />
used to assess sward height in ecology. Journal ofApplid Ecology3g:1148-1154.<br />
TAHMASEBI KoHYANI, P. (2008). Grazer induced changes in dry, low-productive grassland plant<br />
communities. PhD disseftation, UGent, Ghent, Belgium, 136 pp.<br />
TAYLoR, R.H' & R.M. WtLunI4s (1956). The use of pellet counts for estimating the <strong>de</strong>nsity of populations<br />
of the wild rabbtt (Orydolagus cuniculus L.). New Zealand Journal of Science and Technology,<br />
Srtion B3B:236-256.<br />
rEN HARKEL, M. & F. vAN oen MeuLerl (1995). Impact of grazing and atmospheric nitrogen <strong>de</strong>position on<br />
the vegetation of dry coastal dune grassland s. Journal of Vegetation Science 6: 445-452.<br />
THoMAs, A.S. (1960). Changes in vegetation since the advent of myxomatosis. Journal of Ecology4S:<br />
287-306.<br />
THoMAs, A.S. (1963). Further changes in vegetation since the advent of myxomatosis. lournal of<br />
Ecology5T: 151-183.<br />
Touw, A. & W.V. Ruaens (1989). De Ne<strong>de</strong>rlandse Bladmossen. Flora en verspreidingsatlas van <strong>de</strong><br />
Ne<strong>de</strong>rlandse Musci (sphagnum uitgezon<strong>de</strong>rd). stichting Uitgeverij K.N.N.V., nr. 50.<br />
vAN DER HAGEN, H.G.J.M. (1994). Konunen als beheer<strong>de</strong>rs van <strong>de</strong> Harstenhoek in Meiien<strong>de</strong>l? De<br />
Leven<strong>de</strong> natuur95: 4-8.<br />
vAN DER METJDEN, R. (1996). Heukels' Flora van Ne<strong>de</strong>rland. wolters-Noordhoff, Groningen.<br />
VAN DoBBEN, H. & R. KoEMAN (1978). Korstmossentabel. De Ne<strong>de</strong>rlandse macrolichenen.<br />
44 Chapter 2
Jeugdbondsuitgeverij, Amsterdam.<br />
vAN DoRr, K., C. BrfiER & P. vAN WTEuNK (1998). Veldgids Mossen. Stichting Uitgeverij K.N'N'V''<br />
Veldgids nr. 10.<br />
VANDEKERSH9yE, D. & J.E. PEflERs (2002). On<strong>de</strong>zoek naar ziektes bij wil<strong>de</strong> konunen in het <strong>Vlaams</strong>e<br />
gewest. CODA-CERVA, Belgium'<br />
VAN STEERTEGEM, M. (1982). Invloed van konijnenbegrazing op een duingraslandcomplex (GroenendUK<br />
Oostduinkerke), Unpublished master dissertation, Ghent University, Ghent, Belgium, 116 pp.<br />
WArr, A.S. (1957). The effect of excluding rabbits from grassland B (Mesobrometum) in Breckland.<br />
Journal of Ecology45: 861-878.<br />
WArr, A.S. (1962). The effect of excluding rabbits from grassland A (Xerobrometum) in Breckland,<br />
1936-60. Joumal of Ecolqy50: 181-198.<br />
WEARN, J.A. & A.C. GANGE (2007). Above-ground herbivory causes rapid and sustained changes in<br />
mycorrhizal colonization of grasses. Oeologia 153: 959-971.<br />
WHrrE, D.J.B. (1961). Some observations on the vegetation of Blakeney Point, Norfolk, following the<br />
disappearance of the rabbits in 1954. Journal of Ecology49: 113-118'<br />
WrLLofi, S.J., A.J. MTLLER, L.D. INcoLL & S.G. @MproN (2000). The contribution of rabbits (Oryctolagus<br />
cuniculusL.) to soil feftility in semFarid Spain. Biologry and Feftility of fuils3L:379-384.<br />
ZEEVALfSNG, H.J. & L.F.M. Fnrsco (1977). Rabbit grazing and species diversity in a dune area. Vqetatio<br />
35: 193-196.<br />
Impact on vegetation
Appendices<br />
Aooendix 1: Mean and standard error (SE) of the cover of some plant species and some other<br />
vegetation parameters in the exclosures in IJzermonding, per treatment in spring 2000. L+R+S = all<br />
grazers. R+S = rabbits and smaller herbivores, but no larger grazers. S = only herbivores that are<br />
smaller than rabbits.<br />
IJzermondinq spring 2OOO<br />
Tf€atment L+R+S R+S s<br />
mean vegetation height (cm)<br />
o/o bare soil cover<br />
Vo cover of woody plants<br />
o/o coV€r of non-woody plants<br />
7o graminoid species cover in the non-woody cover<br />
7o annual plant species cover in the non-woody<br />
cover<br />
o/o coV€r of mosses<br />
o/o Cov€r'of litter<br />
Mean + SE Mean * SE Mean * SE<br />
4.90 r 0.47<br />
B.B3 r 1.99<br />
3.50 I 1.46<br />
51.00 + 2.62<br />
35.87 r 2.77<br />
28.48 r 2.72<br />
86.00 + 2.51<br />
2.30 + O.27<br />
4.78 L 0.42<br />
B.B3 + 1.91<br />
2.73 r. 0.79<br />
62.17 r 4.8L<br />
39.76 + 3.81<br />
26.07 + 2.57<br />
70.00 + 4.84<br />
2.07 + 0.37<br />
5.36 i 0.34<br />
6.83 r 1.00<br />
4.87 * 1.05<br />
62.83 + 4.59<br />
4t.42 r 3.93<br />
21.67 + 2.37<br />
67.50 + 4.12<br />
2.L7 r 0.29<br />
number of soecies Der Dlot 20.73 + 0.51 19.23 + 0.54 20.63 + 0.65<br />
SimDson's in<strong>de</strong>x of diversitv 0.78 r 0.02 0.78 * 0.02 0.81 + 0.02<br />
A rena ria serpyl lifol ia<br />
Bromus hor<strong>de</strong>aceu.subsp. thominei<br />
Ca la mag rostis epigejos<br />
Qrex arenaria<br />
Cladonia furcata<br />
Crepis capillaris<br />
Elymus repens<br />
Erodium cicutarium<br />
Festuca species<br />
Galium verum<br />
Geranium molle<br />
Hypochaeris radicata<br />
Leontodon species<br />
Lotus corniculatus<br />
Myosotis ramosissima<br />
Ononis repens<br />
Phleum arenarium<br />
Poa pratensis<br />
Sedum acre<br />
Senecio jacobaea<br />
Tortu la ru ra I is v ar. ru ra liform is<br />
Veronica aruensis<br />
5.47 + 0.81<br />
4.63 + 0.65<br />
7.97 L 1.79<br />
3.10 r 0.49<br />
I.B7 + 0.52<br />
0.03 + 0.03<br />
I.I7 + 0.38<br />
5.90 + 0.81<br />
3.70 + 0.71<br />
0.97 r 0.36<br />
7.13 r 0.80<br />
0.23 r 0.11<br />
3.93 + 0.90<br />
1.13 + 0.44<br />
3.87 r 0.49<br />
2.t3 i 0.70<br />
2.20 + 0.52<br />
5.00 r 0.90<br />
B.I7 + 0.81<br />
2.80 * 0.63<br />
6L.67 r 5.23<br />
2.70 + 0.53<br />
3.83 + 0.53<br />
5.40 + 0.73<br />
3.70 r 0.71<br />
4.03 r 0.57<br />
0.50 + 0.13<br />
0.I7 r 0.08<br />
0.07 + 0.05<br />
3.53 + 0.68<br />
7.27 r 1.53<br />
1.47 + 0.48<br />
8.60 + 0.80<br />
L.zO i 0.45<br />
4.73 + 1.15<br />
1.10 + 0.49<br />
4.40 r 0.50<br />
3.67 * 1.07<br />
1.57 * 0.47<br />
1337 r 4.02<br />
8.63 + 0.95<br />
5.43 t L32<br />
51.83 r 6.01<br />
2.90 + 0.48<br />
3.83 r 0.53<br />
5.83 + 0.81<br />
3.10 + 0.65<br />
4.37 a 0.53<br />
0.97 + 0.40<br />
0.00 * 0.00<br />
1.37 r 0.53<br />
3.53 r 0.68<br />
9.40 r L.87<br />
2.43 + 0.66<br />
8.40 + 0.88<br />
t.37 +. 0.49<br />
5.00 + 0.87<br />
L.67 + 0.56<br />
5.63 + 0.51<br />
3.37 + 1.06<br />
7.27 r 0.39<br />
11.80 r 2.88<br />
9.53 + 1.15<br />
6.50 + 1I2<br />
55.67 + 5.07<br />
2.70 i 0.43<br />
46 Chapter 2
Dune Fossile <strong>de</strong> Ghwel<strong>de</strong><br />
sorinq 2OO0<br />
Treatment L+R+S R+S S<br />
mean vegetation height (cm)<br />
o/o bare soil cover<br />
o/o coV€r of woodY Plants<br />
7o cover of non-woodY Plants<br />
o/o graminoid species cover in the non-woody cover<br />
o/o annudl plant species cover in the non-woody<br />
cover<br />
o/o cov€r of mosses<br />
o/o cov€I of litter<br />
Mean * SE Mean * SE Mean * SE<br />
7.89 r 3.60<br />
9.50 x. 2.87<br />
0.53 + 0.16<br />
70.33 L 2.94<br />
72.45 r 3.91<br />
46.10 r 5.69<br />
6t.83 r 4.72<br />
8.70 L 2.63<br />
4.74 + 0.16<br />
B.l7 r 2.01<br />
0.07 i 0.05<br />
77.00 i 3.11<br />
56.80 r 4.89<br />
61.61 r 5.11<br />
49.83 + 5.58<br />
9.40 r L42<br />
8.45 + 0.47<br />
5.33 + 1.31<br />
0.10 r 0.06<br />
84.50 + 2.08<br />
62.40 L 4.55<br />
64.40 + 5.18<br />
43.33 i 4.61<br />
8.00 r L.r7<br />
number of species per plot 15.73 i 0.59 15.37 + 0.38 17.17 r 0.58<br />
SimDson's in<strong>de</strong>x of diversitv 0.80 r 0.01 0.80 + 0.01 0.83 r 0.01<br />
Agrostis capillaris<br />
Aira praecox<br />
Grex arenaria<br />
Cladonia furata<br />
Dicranum scoparium<br />
Festuca specres<br />
Galium verum<br />
Geranium molle<br />
Hypnum cupressiforme<br />
Luzula campestns<br />
Plagiomnium aftine<br />
Preudoscleropodium Purum<br />
Rumex acetosella<br />
Senecio jacobaea<br />
Veronia aruensis<br />
23.73 L 2.88<br />
9.80 + 3.34<br />
8.53 + 0.83<br />
2.00 r 0.58<br />
t7.57 r 4.56<br />
3.83 r 0.80<br />
0.73 r 0.19<br />
7.27 r l.4L<br />
26.67 r 5.85<br />
11.00 + 1.88<br />
2.90 L L.Lz<br />
14.00 r 4.89<br />
2.97 i 0.51<br />
2.80 + 0.89<br />
4.I3 r 0.58<br />
15.97 t 3.64<br />
12.07 r 4.24<br />
10.33 r 1.00<br />
2.50 + 0.56<br />
L237 r 3.9r<br />
4.73 i 1.28<br />
0.63 +. 0.17<br />
7.60 r. I.92<br />
24.47 + 5.37<br />
4.53 + 1.28<br />
2.83 r 1.02<br />
9.90 L 4.26<br />
4.13 + 0.58<br />
4.10 * 1.28<br />
4.03 f 0.59<br />
19.57 r 3.53<br />
3.70 + 0.70<br />
13.23 f 1.81<br />
t.67 r 0.44<br />
7.03 + 2.07<br />
10.20 + 1.83<br />
0.73 r 0.16<br />
15.20 r 3.79<br />
22.17 L 4.58<br />
8.63 r 1.95<br />
6.67 L 2.39<br />
3.37 r 1.42<br />
3.07 L 0.47<br />
3.10 i 0.86<br />
3.47 x. 0.47<br />
Aooendix 2: Mean and standard error (SE) of the cover of some plant species and some other<br />
vegetation parameters in the exclosures in Dune Fossile <strong>de</strong> Ghyvel<strong>de</strong>, per treatment in spring 2000.<br />
L+R+S = all grazers. R+S = rabbits and smaller herbivores, but no larger grazers. S = only herbivores<br />
that are smaller than rabbits.<br />
Impact on vegetation<br />
47
Uzermonding All treatments<br />
chi-<br />
mean vegetation height (cm)<br />
o/o bare soil cover<br />
o/o coV€r of woody plants<br />
7o cover of non-woody plants<br />
o/o graminoid species cover in the non-woody cover<br />
o/o dnnual plant species cover<br />
in the non-woody cover<br />
%o COver Of mOSSes<br />
o/o CoV€r of litter<br />
souare DF P<br />
2.81 2 0.25<br />
0.00 2 1,00<br />
6.50 2 0.o4<br />
s.so 2 0.06<br />
0.42 2 0.81<br />
2.34 2 0.31<br />
16.43 2 0.00 *<br />
1.83 2 0.40<br />
L+R+S versus R+S<br />
chi-<br />
square DF P<br />
0.01 1 0.94<br />
0.00 1 0.99<br />
0.00 r 0.97<br />
3.99 1 0.05<br />
0.02 1 0.89<br />
1.64 | 0.20<br />
9.51 1 0.00 *<br />
1.90 L 0.L7<br />
L+R+S versus S<br />
chi-<br />
square DF P<br />
1.91 L 0.17<br />
0.00 1 1.00<br />
4.77 1 0.03<br />
4,24 1 0.04<br />
0.46 1 0.50<br />
1.85 7 0.r7<br />
14.36 1 0,00 *<br />
0.36 1 o.ss<br />
R+S versus S<br />
chi-<br />
square DF P<br />
2.27 1 0.13<br />
0,00 1 0.98<br />
4.82 1 0.03<br />
0.01 7 0.92<br />
0.16 1 0,59<br />
0.02 1 0,88<br />
0.80 I 0.37<br />
0,48 1 0.49<br />
number of species Der Dlot s.02 2 0.08 4.36 1 0.04 0.01 L 0.92 3.18 1 0.07<br />
Simoson's in<strong>de</strong>x of diversitv 3.29 2 0.19 0.00 1 0.98 2.36 1 0.12 2.55 1 0.1<br />
A rena ria serpylli fo lia<br />
Brom us hor<strong>de</strong>aceus subsp. thom inei<br />
Ca la ma g rostis ep igejos<br />
Grex arenaria<br />
Cladonia furcata<br />
Crepis capillaris<br />
Elymus repens<br />
Erodium cicutarium<br />
Festuca spectes<br />
Galium verum<br />
Geranium molle<br />
Hypochaens radicata<br />
Leontodon species<br />
Lotus corniculatus<br />
Myosotis ramosissima<br />
Ononis repens<br />
Phleum arenarium<br />
Poa pratensis<br />
Sedum acre<br />
Apoendix 3 (oart I)<br />
2.13 2 0.34<br />
1.00 2 0.61<br />
5.r7 2 0.08<br />
2.64 2 0.27<br />
7.42 2 0.O2 *<br />
5.48 2 0.06<br />
LL70 2 0.00 *<br />
6.59 2 0.O4<br />
7.93 2 0.02 *<br />
2.81 2 0.25<br />
2.13 2 0.34<br />
4.92 2 0,09<br />
0,83 2 0.66<br />
0.83 2 0.66<br />
6.09 2 0.05<br />
1.10 2 0.58<br />
2.07 2 0.36<br />
3.06 2 0.22<br />
0.62 2 0.73<br />
1.63<br />
U.Jd<br />
5.61<br />
1.03<br />
6.00<br />
1.97<br />
12.58<br />
5.44<br />
4.02<br />
0.19<br />
t.79<br />
4.34<br />
0.06<br />
0.06<br />
0.38<br />
1.09<br />
1.47<br />
0.55<br />
0.19<br />
1 0.20<br />
1 0.54<br />
1 0.05<br />
1 0.31<br />
1 0.01 *<br />
1 0.16<br />
1 0.00 *<br />
1 0.02<br />
1 0.05<br />
1 0.66<br />
1 0.18<br />
1 0.04<br />
1 0.81<br />
1 0.81<br />
1 0.54<br />
1 0.30<br />
t 0.23<br />
r 0.46<br />
1 0.66<br />
1.53<br />
1.00<br />
3.81<br />
2.65<br />
4.77<br />
1.00<br />
t.78<br />
4.32<br />
6.96<br />
2.48<br />
L40<br />
3.76<br />
0.89<br />
0.89<br />
5.64<br />
0.38<br />
t.54<br />
3.s3<br />
0.56<br />
L 0.22<br />
1 0,32<br />
1 0.05<br />
1 0,10<br />
1 0.03 *<br />
1 0.32<br />
1 0.18<br />
1 0,04<br />
1 0.01 x<br />
1 0.12<br />
L 0.24<br />
1 0.05<br />
1 0.35<br />
1 0.35<br />
1 0.02 *<br />
1 0.54<br />
1 0.21<br />
1 0.06<br />
1 0.45<br />
0.00 1 0.96<br />
0.12 L 0.73<br />
0.01 1 0.93<br />
0.24 1 0.62<br />
0.02 1 0.88<br />
4.21 1 0,04<br />
3.72 1 0.05<br />
0.10 1 0.75<br />
0.86 1 0.35<br />
1.40 t 0.24<br />
0.01 1 0.91<br />
0.01 1 0.94<br />
0.30 1 0.s8<br />
0.30 1 0.58<br />
3.r7 I 0.07<br />
0.18 L 0.67<br />
0.00 1 1.00<br />
0.55 1 0.46<br />
0.18 1 0.68<br />
48 Chapter 2
grwio jacffia<br />
Tutula runlis var, runlibrmls<br />
Vercnia atuengs<br />
Aopendix 3 (oart ID: Resulb of Kruskal-wallis-tests of the cOver of some plant species and some other vegetation param€ters in the exclosures in<br />
IJzermonding, with treatment as In<strong>de</strong>pen<strong>de</strong>nt variable, in spring 2000. ChFsquare = drFsquare-rralue obtalned by the test. DF = <strong>de</strong>grees of freedom. P =<br />
significance value obtained by the test. * indicates that P is stlll s'tgnificant after sequential Bonfenoni @nection. L+R+S = all grazers' R+S = rabbits and<br />
smaller herbirores, but no larger grazers, S = onlY herbivores that are smaller tian rabbits.<br />
Imrydon vegebfiq,<br />
3.73<br />
1.68<br />
2 0.15<br />
2 0.43<br />
2 0,83<br />
0.25 1 0.62<br />
1.31 1 0.25<br />
4.60 1 0.03<br />
1.19 1 0.28<br />
0.86 1<br />
0.01 1<br />
0.00 1<br />
0.35<br />
0.93<br />
49
Dune Fossile <strong>de</strong> Ghyvel<strong>de</strong> All treatments<br />
chi-<br />
mean vegetation height (cm)<br />
o/o bare soil cover<br />
o/o coV€r of woody plants<br />
o/o coV€r of non-woody plants<br />
% graminoid species cover<br />
in the non-woody cover<br />
o/o dnnuol plant species cover<br />
in the non-woody cover<br />
7o cover of mosses<br />
7o cover of litter<br />
square DF P<br />
48.20 2
Studyarea Exclosurc ordination<br />
technique<br />
IJzermonding Excl 1 rcA<br />
Excl 2 PCA<br />
Ghyvel<strong>de</strong> Excl 1<br />
Excl 2<br />
Excl 3 PCA<br />
Excl 4 rcA<br />
Fvd 5 PCA<br />
Excl 3<br />
Excl 4<br />
Excl 5<br />
rcA<br />
PCA<br />
PCA<br />
rcA<br />
DCA<br />
All treatments<br />
chi-<br />
sduare DF P<br />
10.05 2 0.01 '*<br />
15,16 2 0.00 t'<br />
7.52 2 0.02 *<br />
6.77 2 0.03<br />
11.65 2 0.00 {'<br />
8.57 2 0.01 ',i<br />
13.05 2 0.00 *<br />
7.52 2 0.02 t'<br />
11.66 2 0.00 *<br />
14.00 2 0.00 *<br />
L+R+S versus R+S<br />
chisduane<br />
DF P<br />
0,64 L 0.42<br />
8.31 1 0.00 {'<br />
0.23 1 0.63<br />
t.?6 | 0.26<br />
8.31 1 0.00 ,|'<br />
0,41 1 0,52<br />
8.31 1 0.00 *<br />
0.23 1 0.63<br />
0.64 t 0.42<br />
8.31 1 0.00 *<br />
L+R+S versus S<br />
chisouare<br />
DF P<br />
8.31 1 0.00 *<br />
8.31 1 0.00 *<br />
5.77 1 0.02 *<br />
6.56 1 0.01 *<br />
8.31 1 0.00 *<br />
6.56 1 0.01 *<br />
3.69 1 0.05<br />
5.77 1 0.02 *<br />
8.31 1 0.00 ',r'<br />
8.31 1 0.00 *<br />
R+S versus S<br />
chi-<br />
souare DF P<br />
5.77 1 0.02<br />
8.31 1 0.00 ',|<br />
s.03 1 0.03<br />
2.08 I 0.15<br />
0.54 7 0.42<br />
5.77 1 0.02 *<br />
8.31 1 0.00 r'<br />
5.03 1 0.03 *<br />
8.31 1 0.00 ',*<br />
5.77 1 0,02 {'<br />
Aooendix 5: Results of Kruskal-Wallis-tests on the scores of the pqs on the first ordination axis, with treatment as in<strong>de</strong>pen<strong>de</strong>nt variable, in spring 2000 per<br />
exclosure. Chi-square = chi-square-value obtained by the test, DF = <strong>de</strong>grees of freedom, P = significance value obtained by the test. * indicates that P is still<br />
significant after sequential Bonferroni correction. L+R+S = all grazers. R+S = rabbits and smaller herbivores, but no larger grazers. S = only herbivores that<br />
are smaller than rabbits'<br />
Impad on vegetation<br />
51
summer 2000 summer 2001 summer 2005<br />
Treatment L+R+S R+S s L+R+S R+S S L+R+S R+S 5<br />
mean vegetation height (cm)<br />
Yo bare soil cover<br />
o/o cover of woody plants<br />
o/o cover Of non-woody<br />
Ptanls<br />
o/o graminoid species cover<br />
in the non-woody cover<br />
o/o anfludl plant species<br />
cover<br />
in the non-woody cover<br />
o/o cover of mosses<br />
0/6 cover of litfer<br />
Mean t SE Mean i SE Mean + SE Mean * SE Mean * SE Mean t SE Mean * SE Mean * SE Mean * SE<br />
L7.71 r L.8L<br />
11.50 + 1.75<br />
15.50 + 2,91<br />
53.67<br />
t<br />
3.83<br />
60.39 + 3.41<br />
L9.87 r 43I<br />
79.00 + 1.89<br />
7.50 + 0.82<br />
19.03 i 1.95<br />
8.67 * 1.40<br />
13.20 + 2,50<br />
64.50 + 5.04<br />
69.04 * 3.04<br />
18.35 * 3.14<br />
65,00 r 5.70<br />
14.17 + 2.96<br />
28.45<br />
s.33<br />
2r.33<br />
76.00<br />
63.64<br />
11.03<br />
47.90<br />
18.67<br />
+<br />
+<br />
+<br />
-<br />
+<br />
1.80<br />
1.04<br />
3.16<br />
3.04<br />
3.23<br />
2.03<br />
q60<br />
2.53<br />
21.53 r 2.11<br />
17.60 r 4.06<br />
17.10 + 3.11<br />
48.40 + 4.49<br />
69.01 a 3.91<br />
22.7r<br />
75.70<br />
2.93<br />
+ 4.33<br />
- .t.tl.<br />
+ 0.55<br />
24,88 * 2.18<br />
7.77 + 2.I7<br />
15.97 + 3.21<br />
54.43 t 4.97<br />
75.69<br />
T6,71<br />
70.13<br />
7.03<br />
t<br />
3.30<br />
r 2.60<br />
x 6,76<br />
41.74 + 1.92<br />
2.10 * 0.95<br />
33.83 + 5.58<br />
74.90 + 4.87<br />
83.47 r 4.49<br />
10.19 r 2.56<br />
66.97 r 6.48<br />
54.80 r 8.03<br />
49.71 r 4.29<br />
9.87 + 4.4L<br />
63.80 I 5.86<br />
52.33 * 2.92<br />
89.17 t 2.44<br />
5.52 + 1.06<br />
\)4", + AA"<br />
44.43 r 5.76<br />
67.52 r 4.94<br />
4.97 r L73<br />
63.50 r 5.07<br />
60.17 + 5.08<br />
87.37 r 3.76<br />
8.79 t 2.53<br />
36.63 + 6.64<br />
51.93 I 6.87<br />
80,60 + 3.70<br />
0.17 r 0.10<br />
73.53 * 4.59<br />
48.67 + 5.33<br />
93.09 r 2.67<br />
7.68 + 3.16<br />
9.87 + 4.50<br />
89.77 + 3.51<br />
number of sDecies Der olot 15.90 + 0.49 15.07 + 0.44 t4.77 + 0.55 2L43 i. 0.46 19.93 + 0.41 18.20 * 0.55 16.03 + 1.00 15.30 r 0.93 8.97 r 0.56<br />
SimDson's in<strong>de</strong>x of diversltv 0.76 + 0.02 0,75 a 0.02 0.82 0.01 0.75 + 0.01 0.72 0.01 0.76 + 0.01 0.73 + 0.01 0.74 * 0.02 0.61 t 0.03<br />
A re n a ria se rp y / | i fo I ia 1.67 + 0.34 0.87 + 0.09 L20 + 0.18 1.17 a 0.11 0.97 + 0.I2 0.77 r 0.12 0,60 + 0.12 0.57 + 0.09 0.03 + 0.03<br />
Bromus hor<strong>de</strong>aceus<br />
subsp. thominei 0.40 r 0.24 1.97 + 0.67 1.10 r 0.38 0.90 + 0.06 0.93 * 0,07 1.00 + 0.14 0.47 t 0.09 0.60<br />
Ca la mag rostis epigejos 10.10 i<br />
i 0.09 0.10 + 0.06<br />
2.03 5.63 I 1.41 6.67 t 1.34 13.20 + 2.68 LT.B7 + 2.16 L3.97 x 3.28 15.07 + 1.68 14.73 r 2.35 9.63<br />
Carex arenaria 6.20 *<br />
* 2.14<br />
0.84 L4.OO r 2.02 J,/ / - !,51 7.83 + 1.03 13.70 r 1.55 15,25 i 2,o/ 10.40 + 1.61 14.60 I 1.93 3.97 r L20<br />
Cladonia furcata 3.87 + 0.84 0.87 * 0.34 0.40 + 0.24 1.93 + 0.39 0.90 r 0.27 0.53 + 0.10 1.00 r 0.34 0.40 + 0.11 0.07 r 0.05<br />
Crepis capillaris 0,63 + 0.15 0.93 r 0.32 0.53 + 0.25 1.43 * 0.19 L.70 r 0.29 0.63 + 9.16 0.57 + 0.10 0.57 r 0.12 0.17 r 0.07<br />
Elymus repens 0.93 + 0.51 0.03 + 0.03 0.00 t 0.00 2.03 + 0.39 t.77 + 0.70 6.23 r t.64 5.57 r L.37 12.03 + 2.69 17.33 + 4.51<br />
Erodium cicutarium 2.70 + 0.68 3.30 + 0.74 1.43 r 0.53 0.60 + 0.13 0.67 + 0.11 0.23 + 0.09 0.13 + 0.06 0.20 + 0,07 0.00 r 0.00<br />
Festuca species 10.43 + 1.80 17.67 + 3.43 24.43 r 2.84 17.80 + 3.64 21,57 r 4.07 37.53 + 4.82 8.20 I 1.50 o,L/ i r,o/ 0.97 r 0.40<br />
Galium verum L97 + 0.74 2.23 + 0.76 8.00 + 2.68 1.63 + 0,73 5.90 + 2.39 9.47 r 3.75 0,90 + 0.25 6.90 t 2.75 4.33 + 1.53<br />
Geranium molle 0.43 * 0,10 0.57 + 0,09 0.50 * 0,10 0.37 + 0.09 0.53 + 0.10 0.47 + 0.I0 0.33 + 0.09 0.40 + 0.09 0.37 + 0.09<br />
Hypochaeris radicata 1.00 t 0.42 2.20 + 0.65 u.oj = u.zd 0.97 r 0.9 1.63 + 0.36 0.80 + 0.21 0,40 r 0.24 0.53 10.18 0.07 + 0.07<br />
Leontodon species 4.70 + 0.70 4.47 + 0.66 4.10 + 0.73 2.53 * 0.4t 3.10 + 0.46 1.50 * 0.32 1.10 + 0.34 0.70 + 0.20 0.10 r 0.07<br />
Lotus cornlculatus 2.53 + 0.70 2.I7 1 0.66 4.67 + 7.39 1.47 r 0.51 1.33 i 0.40 3.43 t r.22 0.60 r 0.17 2,57 + 1.67 0.37 + 0.25<br />
Myosotis ramosissima 0.00 I 0.00 0.00 r 0.00 0.03 + 0.03 0,87 + 0.06 0.90 + 0.09 0.50 + 0.10 0,47 r 0.09 0.20 r 0.07 0.07 + 0.05<br />
Ononis repens 5.93 t 2,12 5.57 + 1.65 9.33 r 2.47 3.77 + L.79 4.30 + t.27 4.37 r L.49 0.90 + 0.40 0.67 r 037 0.13 + 0.08<br />
Phleum arenarium 1.43 r 0.42 0,57 r 0.10 0,43 r 0.12 0.67 + 0.10 0.63 + 0.13 0.40 + 0.12 0.23 + 0.08 0.27 r 0,08 0.03 I 0.03<br />
Aopendix 6 (paft I)<br />
52<br />
Chapter 2
fuEpt?lr,r*s<br />
Hunec<br />
htdoW<br />
Torfrla runlbvat.<br />
trt-dlfurnb<br />
7.97 * L.67<br />
3.87 * 0.57<br />
5.70 r 0.79<br />
52.93 + 5.64<br />
7.33 * L.47<br />
3..t0 + 0.66<br />
5.73 * 0.89<br />
9.80 + 1.89<br />
3.47 + 0.61<br />
8.67 + 1.21<br />
r.67 + 0.24<br />
4.20 * 0.70<br />
2.73 * 0.33<br />
1.90 r 0.30<br />
3.13 + 0.52<br />
4.07 + 0.50<br />
y.4 + 7.5t<br />
6.00 * 2.27<br />
2.50 + 0.50<br />
3.23 r 0.53<br />
2.97 + 0.99<br />
0.73 * 0.14<br />
7.40 + t.3t<br />
2.53 + 1.16<br />
0.2/ + 0.18<br />
3.83 + 0.61<br />
0.13 + 0.06<br />
0.07 r 0,07<br />
1.03 + 0.30<br />
49.50 + 6.50 41.07 * 5,80 50.,10 + s.tl8 51,50 + 7.53 21.77 + 5.88 11.40 + 4.56 0.67 t 0.67<br />
10+ * 0.97 + + 0.05 * 0.07 0.30 + +<br />
Appendix 5 (part ID: Mean and standad enor (sD of the over of some plant species and s(xne other vegetauon parameters in the arclosures in<br />
uzermonding, per beatment and per season. L*R+S = all grazers. R+S = rabbits and smaller herbivores, but no larger grazers, s = only herblvores that are<br />
smaller than nbbits.<br />
Imrycton Wqbtion<br />
53
Dune Fossile<br />
<strong>de</strong> Ghwel<strong>de</strong> summer 2000 summer 2001 summer 2005<br />
Treatment L+R+S R+S S L+R+S R+S S L+R+S R+S 5<br />
mean vegetation height (cm)<br />
% bare soil cover<br />
o/o cover of woody plants<br />
o/o cover of non-woody plants<br />
o/o graminoid species cover<br />
in the non-woody cover<br />
7o annual plant species cover<br />
in the non-woody cover<br />
o/o cover of mosses<br />
o/o cover of litter<br />
Mean * SE Mean t SE Mean * SE Mean i SE Mean i SE Mean + SE Mean t SE Mean + SE Mean * SE<br />
77.82 r 2.02<br />
7.17 r 1.99<br />
5.17 + 1.56<br />
77.50 + 2.28<br />
92.65 i 1. 18<br />
8.25 r 1.20<br />
67.83 + 4,36<br />
9,37 + 1.41<br />
29.58 * 2.18<br />
14,33 + 3.01<br />
4.00 r 1.47<br />
70.83 + 3,75<br />
91,77 r 1.54<br />
9.52 + 1.54<br />
60.77 + 4.74<br />
13.67 t t.6r<br />
36,32 * 1.31<br />
10,33 r 1.87<br />
0.33 r 0.23<br />
81.00 + 2.47<br />
92.24 r 1.37<br />
4.70 + 0.73<br />
61,50 t 4.97<br />
13.33 + 1,50<br />
16.48 + 1.94<br />
L27 i 0.60<br />
4.47 r. t.87<br />
68.13 + 3.06<br />
7410 + I qq<br />
2.26 + 0.28<br />
77.77 r 4.02<br />
34.40 * 4.31<br />
28.11 r 1.88<br />
6.90 + 2.63<br />
4.77 + t.s8<br />
65.90 * 4.11<br />
74.06 + L6L<br />
2.95 + 0.51<br />
69.33 r 5.05<br />
40.23 t 5.25<br />
29.26 r t.7L<br />
3.97 + t.45<br />
0.67 * 0.32<br />
68.63 * 4.00<br />
76.96 t L70<br />
4.40 r L07<br />
70.43 t 4.92<br />
53.13 + 5.71<br />
24.56 t 4.92<br />
4.90 r 2.14<br />
13.80 r 4.38<br />
81.57 + 4.18<br />
80.33 + 2.53<br />
1.09 + 0.20<br />
59.07 * 6.91<br />
7.27 r.2.91<br />
32.07 r 3.02<br />
15.87 + 3.97<br />
20.43 * 5.66<br />
68.77 r 4.72<br />
80.98 * 3.53<br />
L34 t 0.46<br />
38.13 + 7.15<br />
I4.I7 + 4.32<br />
31.89 t 4.26<br />
0.22 r 0.17<br />
8.61 t 3.72<br />
91.94 + 3.43<br />
96.75 + L.43<br />
0.52 + 0.15<br />
60,22 r 8.41<br />
69.78 r 7.83<br />
number of soecies oer olot 13.73 + 0.50 13.20 + 0.40 13.73 r 0.54 14.60 + 0.60 14.50 + 0.45 t3.70 i 0.57 13.43 r 0.47 12.13 + 0.73 11.22 r 0.67<br />
Simpson's in<strong>de</strong>x of diversitv 0.79 + 0.01 0.79 + 0,01 0,77 r 0.01 0.75 + 0.02 0.78 + 0.01 0.72 + 0.02 0.76 I 0.01 0.72 + 0.02 0.75 I 0.02<br />
Agrostis capillaris<br />
Aira pra€ox<br />
Carex arenaria<br />
Cladonia furcata<br />
Dicranum scoparium<br />
resfuca species<br />
Galium verum<br />
Geranium molle<br />
Hypnum cupressiforme<br />
Luzula campestris<br />
Plagiomnium affine<br />
Pseudoscleropodiu m puru m<br />
Rumex acetosella<br />
Senecio Jecobaea<br />
Veronica aruensis<br />
31.63 r 4.65<br />
2.57 + 0.63<br />
26.93 + 4.49<br />
2.40 r 0.62<br />
10,67 r 4.18<br />
8.53 + 1.57<br />
3.37 r 0.71<br />
L47 +. 0.42<br />
29.90 + 6.19<br />
8.60 t 2.29<br />
5.97 r 1.91<br />
17.90 + 5.44<br />
4.23 + 0.57<br />
3.83 + 1.01<br />
0,53 * 0.09<br />
23.20 + 4.81<br />
3.97 t 0.73<br />
30.40 r 4.64<br />
4.67 r L.L7<br />
4.57 + 2.52<br />
10.73 r 2.19<br />
3.33 + 0.74<br />
0.73 r 0.16<br />
26.30 * 5.51<br />
2.10 + 0.72<br />
10.33 + 3.50<br />
12.83 + 4.58<br />
J.JJ - U.)b<br />
6.60 + 2.03<br />
0.53 + 0.09<br />
31.90 + 5.16<br />
1.80 + 0.54<br />
28.60 + 5.62<br />
2.03 * 0.58<br />
3.37 r. 1.42<br />
21.90 + 3.88<br />
3.57 + 0.69<br />
0.50 + 0.10<br />
24,67 r 532<br />
3.13 t 0.76<br />
19.20 + 5.41<br />
7.77 +.2.23<br />
4.43 + 0.65<br />
5.53 * 1.41<br />
0.63 + 0.09<br />
31.50 + 4.52<br />
0.43 I 0.10<br />
16.83 + 3.28<br />
0,87 + 0.16<br />
8.13 r 3,55<br />
3.70 + 0.80<br />
2.30 I 0.64<br />
0.97 + 0.18<br />
27.00 r 6.66<br />
10,87 r 2.17<br />
7.43 + 2.97<br />
28.67 r 6.48<br />
2.93 r 0.47<br />
2.93 + 0.42<br />
0.00 + 0.00<br />
16.33 + 3.60<br />
0.57 * 0.12<br />
24.67 + 2.57<br />
L27 r 030<br />
4.33 t 2.63<br />
8.13 + 2.27<br />
2.03 + 0.55<br />
0.80 * 0.22<br />
26.53 t 5.77<br />
2.87 + L07<br />
9.37 * 3.02<br />
16,80 + 5.36<br />
2.97 + 0.48<br />
3,83 r 0.84<br />
0.13 * 0.06<br />
29.57 r 5,48<br />
0.53 + 0.27<br />
1437 r 2.41<br />
1.83 + 0.54<br />
5.23 + 3.08<br />
17.23 r 4.26<br />
2.83 * 0.82<br />
2.37 r 0.90<br />
25.50 + 5.97<br />
3.27 r 1,01<br />
L2.57 r 4.23<br />
17.33 r 5.59<br />
2.80 + 0.40<br />
2.97 t 0.75<br />
0.03 + 0.03<br />
13.67 t 2.76<br />
0,03 * 0.03<br />
31.47 r 231<br />
0.60 + 0.12<br />
0.53 r 0.27<br />
0.33 + 0.10<br />
2.03 + 0.59<br />
0.60 + 0.13<br />
10.10 r 3.04<br />
19.40 + 2.80<br />
5.13 r 1.64<br />
4t.37 t 6.95<br />
8.07 r 2.91<br />
16.77 + 2.98<br />
0,07 + 0.05<br />
8.30 * 1.55<br />
0.00 + 0.00<br />
31.60 + 3.91<br />
0,47 + 0.13<br />
0.57 + 0.36<br />
1.00 + 0,66<br />
1.83 * 0.57<br />
0.27 + 0.08<br />
8.33 + 3.33<br />
6,00 + 1.91<br />
5.83 t 2.36<br />
20,87 + 5.55<br />
7.00 r 1.92<br />
7.93 + 2.02<br />
0.03 + 0.03<br />
Appendix7:Meanandstandar<strong>de</strong>rror(SE)ofthecoverofsomep|antspeci@parameterSintheexclozuresinDuneFossi|e<strong>de</strong><br />
38.00 + 5.43<br />
0.00 r 0.00<br />
27.50 r 4.94<br />
0.28 + 0.14<br />
1.50 r. L.L2<br />
4.6L + 2.44<br />
1.50 + 0.58<br />
0.28 + 0.11<br />
'1 1RO + qq?<br />
3.44 + 1.80<br />
22.56 r 6.Q<br />
12.61 + 5.41<br />
3.11 + 1.19<br />
2.89 r, 1,37<br />
0.11 + 0.08<br />
Ghyvel<strong>de</strong>, per treatment and per season, L+R+S = all grazers. R+S = rabbits and smaller herbivores, but no larger grazers. S = only herbivores that are<br />
smaller than rabbits.<br />
54<br />
Chapter 2
IJzermonding<br />
Period<br />
mean vegetation height (cm) summer 2000<br />
summer 2001<br />
summer 2005<br />
o/obare soil cover summer 2000<br />
summer 2001<br />
summer 2005<br />
o/o cov€f of woody plants summer 2000<br />
summer 2001<br />
summer 2005<br />
o/o coV€r of non-woody plants summer 2000<br />
summer 2001<br />
summer 2005<br />
o/o graminoid species cover summer 2000<br />
in the non-woody cover summer 2001<br />
summer 2005<br />
o/o dnnudl plant species cover summer 2000<br />
in the non-woody cover summer 2001<br />
summer 2005<br />
o/o coV€I of mosses summer 2000<br />
summer 2001<br />
summer 2005<br />
o/o cover of litter summer 2000<br />
summer 2001<br />
cr rmmpr 7OO5<br />
number of species per plot summer 2000<br />
summer 2001<br />
summer 2005<br />
Simpson's in<strong>de</strong>x of diversity summer 2000<br />
summer 2001<br />
summer 2005<br />
Aooendix 8 (oart I)<br />
Impad on vegetation<br />
All treatments<br />
chi-<br />
souare DF P<br />
16.80 2 0.00 *<br />
35.51 2
Arenariaserpyllifolia summer2000<br />
summer 2001<br />
summer 2005<br />
Bromus hor<strong>de</strong>aceus summer 2000<br />
subsp, thominei summer 2001<br />
summer 2005<br />
Laamaqrosus eptqelos summer 2000<br />
summer 2001<br />
summer 2005<br />
Carex arenaria summer 2000<br />
summer 2001<br />
summer 2005<br />
LEoonB rurcaa summer 2000<br />
summer 2001<br />
summer 2005<br />
Crepis capillaris summer 2000<br />
summer 2001<br />
summer 2005<br />
Elymus repens summer 2000<br />
summer 2001<br />
summer 2005<br />
Erodium ctcutarium summer 2000<br />
summer 2001<br />
summer 2005<br />
Festuca species summer 2000<br />
summer 2001<br />
summer 2005<br />
Galium verum summer 2000<br />
summer 2001<br />
summer 2005<br />
Geranium molle summer 2000<br />
summer 2001<br />
summer 2005<br />
Appendix 8 (part II)<br />
56<br />
4.37 2 0.11<br />
5.s6 2 0.06<br />
2r.n 2
Hypochaeris radicata summer 2000<br />
summer 2001<br />
summer 2005<br />
Leontodon species summer 2000<br />
summer 2001<br />
summer 2005<br />
Lotus corniculatus summer 2000<br />
summer 2001<br />
summer 2005<br />
Myosotis ramosissima summer 2000<br />
summer 2001<br />
summer 2005<br />
Ononis repens summer 2000<br />
summer 2001<br />
summer 2005<br />
Phleum arenarium summer 2000<br />
summer 2001<br />
summer 2005<br />
Poa pratensis summer 2000<br />
summer 2001<br />
summer 2005<br />
Sedum acre summer 2000<br />
summer 2001<br />
summer 2005<br />
Senecio jacobaea summer 2000<br />
summer 2001<br />
summer 2005<br />
Tortula ruralis summer 2000<br />
var. ruraliformis summer 2001<br />
summer 2005<br />
Appendix 8 (part III)<br />
Impact on vegetation<br />
4.12 2 0.13<br />
3.94 2 0.t4<br />
7.33 2 0.03<br />
0.49 2 0.78<br />
8,43 2 0.01 *<br />
L6.29 2 0.00 ',*<br />
0,63 2 0.73<br />
0.34 2 0.84<br />
6.s8 2 0.O4<br />
2,00 2 0.37<br />
L2.52 2 0.00 't<br />
13.33 2 0,00 :*<br />
2.40 2 0.30<br />
1.59 2 0.4s<br />
4.12 2 0.13<br />
4.42 2 o.Lt<br />
4.41 2 0.11<br />
6.46 2 0.O4<br />
0.31 2 0.86<br />
0.29 2 0.87<br />
21.55 2
Veronia awsrsis zummer 20fi)<br />
summer 2001<br />
$tmmer 2005<br />
1.06 2 0.59<br />
2.t4 2 0.34<br />
1.05 1 0.30<br />
0.35 1 0.56<br />
0.35 1 0.s6<br />
1.93 1 0.15<br />
0.21 1 0.64<br />
0.73 1 0.39<br />
7.37 2 0.O3 0.79 1 0.38 3.98 1 o.Os 7.55 1 0.01 *<br />
KruslGFwallis-tests of the cover of some plant species some other vegetaUon parameters in the exclosures in<br />
Llzermonding, with treatment as in<strong>de</strong>pen<strong>de</strong>nt variable, analysed per season, ChFsquare = chFsquare.value obtained by the test. DF = <strong>de</strong>grees of freedom, p<br />
= significance value obtained S the test. * indicates that P is still significant after sequential Bonfenoni conection. L+R+S = all grazers. R+S = rabbits and<br />
smaller herbivores, but no larger grazen. S = only herbivores that are smaller than rabbits.<br />
58 Qrapter2
Dune Fossile <strong>de</strong> Ghyvel<strong>de</strong><br />
Period<br />
mean vegetation height (cm) summer 2000<br />
summer 2001<br />
summer 2005<br />
o/o bare soil cover summer 2000<br />
summer 2001<br />
summer 2005<br />
o/o coV€r of woody plants summer 2000<br />
summer 2001<br />
summer 2005<br />
Yo cover of non-woody plants summer 2000<br />
summer 2001<br />
summer 2005<br />
o/o graminoid species cover summer 2000<br />
in the non-woody cover summer 2001<br />
summer 2005<br />
o/o dnnual plant species cover summer 2000<br />
in the non-woody cover summer 2001<br />
summer 2005<br />
7o cover of mosses summer 2000<br />
summer 2001<br />
summer 2005<br />
o/o cover of litter summer 2000<br />
summer 2001<br />
summer 2005<br />
number of species per plot summer 2000<br />
summer 2001<br />
summer 2005<br />
Simpson's in<strong>de</strong>x of diversity summer 2000<br />
summer 2001<br />
summer 2005<br />
Appendix 9 (Part I)<br />
Impact on vegetation<br />
All treatments<br />
chi-<br />
souare DF P<br />
32.95 2
Agrostis capillaris summer 2000<br />
summer 2001<br />
summer 2005<br />
Aira praecox summer 2000<br />
summer 2001<br />
summer 2005<br />
hrex arenaria summer 2000<br />
summer 2001<br />
summer 2005<br />
Cladonia furcata summer 2000<br />
summer 2001<br />
summer 2005<br />
utcranum scoparium summer 2000<br />
summer 2001<br />
summer 2005<br />
Festuca species summer 2000<br />
summer 2001<br />
summer 2005<br />
Galium verum summer 2000<br />
summer 2001<br />
summer 2005<br />
Geranium molle summer 2000<br />
summer 2001<br />
summer 2005<br />
Hypnum cupressiforme summer 2000<br />
summer 2001<br />
summer 2005<br />
Luzula campestris summer 2000<br />
summer 2001<br />
summer 2005<br />
Plagiomnium affine summer 2000<br />
summer 2001<br />
summer 2005<br />
Aopendix 9 (part II)<br />
4.17 2 0.t2<br />
6.21 2 0.o4<br />
16.69 2 0.00 *<br />
4.4r<br />
3.19<br />
I. bU<br />
2 0.11<br />
2 0.20<br />
2 0.4s<br />
0.73 2 0.70<br />
9.32 2 0,01 *<br />
1.63 2 0.44<br />
1.05 2 0.59<br />
0.13 2 0.93<br />
3.32 2 0.19<br />
1.66 2 0.44<br />
1.66 2 0.44<br />
0.37 2 0.83<br />
6.73<br />
3.78<br />
t.2L<br />
0,06 2<br />
0.57 2<br />
0.09 2<br />
1.90<br />
4.I7<br />
4.24<br />
0.27<br />
1.15<br />
2.40<br />
2 0.03<br />
2 0,15<br />
2 0.54<br />
0.97<br />
0.75<br />
0.95<br />
2 0.39<br />
2 0.12<br />
2 0.12<br />
2 0.90<br />
2 0.56<br />
2 0.30<br />
6.43 2 0.O4 *<br />
13.63 2 0.OO *<br />
21.28 2
Pseudoscleropodiumpurum summer2000<br />
summer 2001<br />
summer 2005<br />
Rumev acetosella summer 2000<br />
summer 2001<br />
summer 2005<br />
Senecio jacobaea summer 2000<br />
summer 2001<br />
summer 2005<br />
Veronica aruensis summer 2000<br />
summer 2001<br />
summer 2005<br />
0.41 2 0.82<br />
2.68 2 0.26<br />
9.53 2 0.01 ',t<br />
L.43 2<br />
0.09 2<br />
4.33 2<br />
0.49<br />
0,96<br />
0.11<br />
0.52 2 0.77<br />
0,59 2 0.75<br />
17.41 2 0.00 *<br />
0.81 2 0.67<br />
5.44 2 0.07<br />
0.26<br />
2.07<br />
4.96<br />
1 0.61<br />
1 0.15<br />
1.3s 1 0.25<br />
0,06 1 0.80<br />
0.54 1 0.46<br />
0.06 1 0.81<br />
0.01 1 0.93<br />
6.29 1 0.01 *<br />
0.00 1 1.00<br />
4.2r 1 0.04<br />
0.3s 1 0.56<br />
0.34 1 0.56<br />
1.85 r 0.17<br />
8.34 1 0.OO :B<br />
0,00 1<br />
0.00 1<br />
2.53 1<br />
0.99<br />
0.95<br />
0.11<br />
0.7L 1 0.40<br />
0.72 1 0.40<br />
15.18 1
Study area Period Exclosure ordination<br />
technique<br />
IJzermonding Summer2000 Excl 1 PCA<br />
Excl 2 PCA<br />
Excl 3 PCA<br />
Excl 4 DCA<br />
Excl 5 pCA<br />
Summer 2001 Excl 1 PCA<br />
Summer 2005<br />
Excl 2 PCA<br />
Excl 3 PCA<br />
Excl 4 DCA<br />
Excl 5 PCA<br />
Excl 1 DCA<br />
Excl 2 PCA<br />
Excl 3 PCA<br />
Excl 4 PCA<br />
Excl 5 PCA<br />
pCA<br />
Ghyvel<strong>de</strong> Summer 2000 Excl 1<br />
Excl 2 PCA<br />
Excl 3 PCA<br />
Excl 4 PCA<br />
Excl 5 PCA<br />
Summer 2001 Excl 1 DCA<br />
Excl 2 PCA<br />
Excl 3 PCA<br />
Excl 4 DCA<br />
Excl 5 DCA<br />
Summer 2005 Excl 1 PCA<br />
Excl 2 PCA<br />
Excl 3 PCA<br />
Excl 4 DCA<br />
Excl 5 DCA<br />
All treatments<br />
chi-<br />
square DF P<br />
13.20 2 0.00 *<br />
13.05 2 0,00 *<br />
2.84 2 0.24<br />
L2.77 2 0.00 *<br />
11.56 2 0,00 *<br />
13.56 2 0.00 *<br />
10.05 2 0,01 *<br />
2.29 2 0.32<br />
10.98 2 0.00 *<br />
12,77 2 0.00 *<br />
12.54 2 0.00 *<br />
13.93 2 0.00 *<br />
10.05 2 0.01 *<br />
2.29 2 0.32<br />
14.75 2 0.OO *<br />
7.52 2 0,O2 *<br />
10.98 2 0.00 *<br />
2.84 2 0.24<br />
L4.36 2 0.00 *<br />
13.13 2 0.O0 *<br />
6.L4 2 0.0s *<br />
11.82 2 0.00 *<br />
8,64 2 0.01 *<br />
13.56 2 0.00 *<br />
6.74 2 0.03<br />
L2.78 2 0,00 *<br />
5.19 2 0.07<br />
5.77 1 0.02 *<br />
10.05 2 0.01 *<br />
0.10 1 0.7s<br />
L+R+S verus R+S<br />
chi-<br />
square DF P<br />
8.31 1 0.00 *<br />
3.69 1 0.05<br />
0.92 1 0.34<br />
8.31 1 0.00 *<br />
0.41 1 0.52<br />
8.31 1 0.00 *<br />
1.26 1 0.26<br />
0,10 1 0.75<br />
8.31 1 0.00 *<br />
6.56 1 0.01 *<br />
2.56 1 0.11<br />
6.56 1 0.01 *<br />
0.64 I 0.42<br />
0.23 1 0.63<br />
8.31 1 0,00 *<br />
0.41 1 0.52<br />
8.31 1 0,00 *<br />
0.92 1 0.34<br />
6.56 1 0.01 *<br />
6.56 1 0,01 x<br />
3.10 1 0.08<br />
8.31 1 0,00 *<br />
5.03 1 0,03<br />
7.41 1 0,01 *<br />
8.31 1 0.00 *<br />
3.10 1 0.08<br />
2.08 1 0.15<br />
5.77 1 0.02<br />
5.77 1 0.02<br />
0,10 1 0.75<br />
L+R+S versus S<br />
chisquare<br />
DF P<br />
7.4I 1 0.01 *<br />
8.31 1 0.00 *<br />
0.23 1 0.63<br />
5.03 1 0.O3<br />
8.31 1 0.00 *<br />
7.41 1 0.01 *<br />
6.56 1 0.01 *<br />
1.64 1 0.20<br />
7.4t 1 0.01 *<br />
8.31 1 0.OO *<br />
8.31 1 0.00 *<br />
8.31 1 0.00 *<br />
8.31 1 0.00 *<br />
2.08 1 0.15<br />
8.31 1 0.OO *<br />
s.03 1 0.03<br />
7.41 1 0.01 *<br />
0.23 1 0.63<br />
8.31 1 0,00 *<br />
8.31 1 0.00 *<br />
5.03 1 0.03<br />
6.56 1 0.01 x<br />
6.56 1 0,01 *<br />
8.31 1 0.00 x<br />
0.92 1 0.34<br />
8.31 1 0,00 *<br />
4.33 1 0.04 *<br />
8.31 1 0.OO *<br />
R+S versus S<br />
chi-<br />
square DF P<br />
s.03 1 0.03<br />
8.31 1 0,00 *<br />
3.69 1 0.0s<br />
6.56 1 0.01 *<br />
8.31 1 0.OO *<br />
5.77 1 0.02<br />
7.4r 1 0,01 *<br />
1.64 1 0.20<br />
0,64 | 0.42<br />
5.03 1 0.03<br />
8.31 1 0.00 *<br />
7.4I 1 0,01 *<br />
5.77 1 0.02 *<br />
7.26 L 0.26<br />
7.4I 1 0,01 *<br />
5.77 1 0.02 *<br />
0.41 1 0.52<br />
3.69 1 0.05<br />
8.31 1 0.00 *<br />
5.77 1 0.02<br />
0.92 1 0.34<br />
3.10 1 0.08<br />
1.26 L 0.26<br />
5.77 1 0,02<br />
0.92 1 0.34<br />
8.31 1 0.OO *<br />
r.26 1 0.26<br />
0.64 1 0.42<br />
62 Chapter 2
Aooendix 10: Resulb of KruskaFWallis-tests on tfie sores of ttre pqs on the first ordinauon axis, with treatment as in<strong>de</strong>pen<strong>de</strong>nt rariable, per season and per<br />
e
t, i<br />
Agrostis capillaris Gewoon struisoras Poaceae<br />
Agrostis stolonifera Fiorinqras Poaceae<br />
Ammophila arenaria Helm Poaceae<br />
Anthriscus caucalis Fiine kervel Apiaceae<br />
A rena ria serovlli fol ia Zandmuur Caryoohyllaceae<br />
Arrhenatherum elatius<br />
Avenula pubescens<br />
Glanshaver<br />
Zachte haver<br />
Poaceae<br />
Poaceae<br />
B rachyth eciu m a lbica ns Bleek dikkoomos Brachvtheciaceae<br />
Brach vthecium ru ta b u lu m<br />
Eromus hor<strong>de</strong>aceus subsp.<br />
Gewoon dikkoomos Brachvtheciaceae<br />
thominei Duindravik Poaceae<br />
Bromus sterilis IJle dravik Poaceae<br />
Ervonia dioica<br />
Bryum spsies<br />
G la m a o rosti-s e n ia e i o s<br />
Heqqenrank<br />
Knikmos<br />
Duinriet<br />
Cucurbitaceae<br />
Brvaceae<br />
Poaceae<br />
Carex arenaria Zandzeqqe Cvoeraceae<br />
Cerastium soecies Hoornbloem Carvophvllaceae<br />
Ceratodon DurDureus Purpersteeltie Ditrichaceae<br />
Circium species Ve<strong>de</strong>rdistel Asteraceae<br />
Cladonia furcata Cladoniaceae<br />
Cladonia owidata Cladoniaceae<br />
Creois caoillari.s Klein streeozaad Asteraceae<br />
Cynoqlossum officinale Veldhondstono Boraoinaceae<br />
Dactylis glomerata Gewone krooaar Poaceae<br />
Elymus athericus Strandkweek Poaceae<br />
Elymus repens Kweek Poaceae<br />
Erioeron cana<strong>de</strong>nsis Cana<strong>de</strong>se fiinstraal Asteraceae<br />
Erodium crcutarium Gewone reiqersbek Geraniaceae<br />
Erophila verna Vroegeling Brassicaceae<br />
Eu rhynch iu m praelo n g u m Fijn lad<strong>de</strong>rmos Brachvtheciaceae<br />
Kiemplant Fabaceae Fabaceae<br />
Festuca sDecies Zwenkqras Poaceae<br />
Galium aparine Kleefkruid Rubiaceae<br />
Galium verum Geel walstro Rubiaceae<br />
Geranium molle Zachte ooievaarsbek Geraniaceae<br />
Hippophae rhamnoi<strong>de</strong>s Duindoorn Elaeaonaceae<br />
Holcus lanatus Gestreeote witbol Poaceae<br />
Homa lothsium I utescens Smaraodmos Brarhvtheciareac<br />
Hypochaeris radicata Gewoon biqqenkruid Asteraceae<br />
Hypnum cupressiforme Gewoon klauwtiesmos Hvonaceae<br />
Kiemplant dicotyl<br />
Kiemplant monocotyl<br />
Koeleria macrantha Smal fakkelqras Poaceae<br />
Lamium purpureum Paarse dovenetel Lamiaceae<br />
Leontgdon species Leeuwentand Asteraceae<br />
lolium perenne Enqels raaiqras Poaceae<br />
Lotus corniculatus Gewone rolklaver Fabaceae<br />
Aopendix 11 (part I)<br />
64 Chapter 2
@ep|antspeciesfoundinthepqsinUzermonding(fromsprin9<br />
2000 until summer 2005).<br />
Impad on vegebtion<br />
65
Acer olatanoi<strong>de</strong>s Noorse esdoorn Saoindaceae<br />
Asrostis capillaris Gewoon struisoras Poaceae<br />
Aira oraeax Vroeqe haver Poaceae<br />
Anthoxanthum odorafum Gewoon reukoras Poaceae<br />
Aphanes inexspectata Kleine leeuwenklauw Rosaceae<br />
A re n a ria se rpvl I i fo I i a Zandmuur Carvophyllaceae<br />
Avenula pubescens Zachte haver Poaceae<br />
Brachythecium rubbulum Gewoon dikkopmos BrachWheciaceae<br />
Kiemplant Brassicaceae Brassicaceae<br />
B ro m us hor<strong>de</strong>ace us subsp.<br />
thominei Duindravik Poaceae<br />
Bryum spsia Knikmos Brvaceae<br />
G la m ao rosti-s e nio e iac Duinriet Poaceae<br />
Ca llierqonella cuspida ta Gewoon ountmos Amblysteqiaceae<br />
Grdamine hirsuta Kleine veldkers Brassicaceae<br />
Grex arenaria Zandzeqqe Cyperaceae<br />
Kiemplant G ryoph yllaceae Carvoohvllaceae<br />
Cerastium smies Hoornbloem Carvoohvllaceae<br />
C,eratodon purDureus Purpersteeltie Ditrichaceae<br />
Cladina arbuscula Cladoniaceae<br />
Cladonia furcata Cladoniaceae<br />
Cladonia pw
Rondbladig<br />
@ofthep|antspeciesfoundinthepqsinDuneFossi|e<strong>de</strong>Ghyvel<strong>de</strong><br />
(from spring 2000 until summer 2005).<br />
Impact on vegetation<br />
67
Llzermonding<br />
Ammophila arenaria was present in the three treatments in spring and summer 2000,<br />
but disappeared from L+R+S and R+S in 2001 and had completely gone in 2005.<br />
Anthriscus caucalis, which was not present in each treatment in spring 2000 (missing in<br />
L+R+s) and summer 2001 (absent in L+R+s and R+s), and even completely lacking in<br />
summer 2000, was present in the three treatments in summer 2005.<br />
Arrhenatherum elatius and Bromus sterilis, completely absent in 2000, appeared in s in<br />
2001 and were present in R+S and S in 2005.<br />
Erodium ctcutarium is present in all treatments until 2001, but disappeared from s in<br />
2005.<br />
During the four field periods, Peltigera caninawas never found in s and in summer 2000<br />
and summer 2005, it was also not found in R+S.<br />
Plantago lanceolata was found in R+s only in spring 2000 and summer 2001; however,<br />
it was missing in s only in summer 2000 and was present in all the treatments in<br />
summer 2005.<br />
Trifolium campestre, totally absent in summer 2000, is present in all treatments in<br />
spring 2000 and summer 2001, but disappeared from S in summer 2005.<br />
Vulpia sp. was found only in R+S in spring 2000, but was present in the three<br />
treatments in summer 2000 and 2001. Nevertheless, in summer 2005, it had<br />
disappeared from S.<br />
Ghyvel<strong>de</strong><br />
In 2000 and 2001, Aira praecox is present in all treatmenG, but in 2005, it is only<br />
observed in L+R+s. Erodium crtutarium was not found in R+s in spring 2000 and was<br />
absent from s in summer 2000. In summer 2001, it was not seen at all, and in 2005, we<br />
observed it again in R+S.<br />
Myosotis ramosissima was present in all treatments in 2000, but was missing in s in<br />
2001 and was observed in L+R+S only in 2005.<br />
Until 2001, Peltigera sp. was observed in the three treatments, but it completely<br />
disappeared from the pqs in 2005.<br />
seedlings of Populus tremula were completely absent in spring 2000, but appeared in s<br />
in summer 2000. In summer 2005, they had also expan<strong>de</strong>d to R+S.<br />
Tortula ruralisvar. ruraliformis was found in all treatments in 2000, disappeared from<br />
L+R+S in 2001 and had completely gone in 2005.<br />
Urtica dioica, found only in S in spring 2000 and only in L+R+S in summer 2000, was<br />
observed in L+R+S and S in 2001 and in all treatments in 2005.<br />
viola curtisii, observed in all treatments in 2000, was missing in s in 2001. In 2005, it<br />
could only be seen in R+S.<br />
Aooendix 13: Qualitative differences in species composition between tne treatnrents in Uzer Oing<br />
and Ghwel<strong>de</strong>.<br />
68 Chapter 2
Impact on vegetation 69
70<br />
Grasslands in Puyenbroec[ 2006 (Photographs by N. tumers)
CHAPTER 3<br />
Does vegetation height Predict<br />
spatial foraging activitY<br />
of the rabbit (Oryctolagus cuniculus L.)?<br />
Nele somers, Katrien De Maeyer, Beatrijs Bossuyt, Luc Lens & Maurice Hoffmann<br />
1522A+<br />
7l
Abstract<br />
The wild rabbit (Orydolagus cuniculus L.) is predicted to forage according to an unimodal<br />
functional response curve, which means that they would prefer a short to intermediate<br />
vegetation height for foraging rather than a high vegetation where food availability is higher.<br />
The higher food quality of a short-grazed vegetation is supposed to be responsible for this. A<br />
possible consequence is the occurrence of facilitation: by grazing, large herbivores can make<br />
the vegetation more suitable for smaller grazers. By performing two different studies in two<br />
study areas, we tested whether rabbits in<strong>de</strong>ed prefer to graze in shofter vegetation, by<br />
comparing rabbit activity in short (grazed or mown) and ungrazed vegetation. Mown<br />
vegetation in the most productive grassland site proved to be preferred by the animals, as<br />
indicated by an experimental set-up. There were no indications that this was due to a<br />
difference in forage quality. In a more complex, natural situation, rabbits were not facilitated<br />
by large grazers: they did not prefer to graze in the shorter vegetation. We suggest that<br />
experimental studies might reveal phenomena that are masked un<strong>de</strong>r more complex field<br />
conditions, for instance due to variation in productivity of the grassland or the occurrence of<br />
self-facilitation.<br />
72 Chapter 3
Introduction<br />
Generally, food intake by mammalian herbivores is predicted to increase<br />
asymptotically with food <strong>de</strong>nsity (Type II functional response, HoLLING, 1959) (OKSANEN ef<br />
al., 1981; LUNDBERG, 1988; LUToBERG & ASrnoN, 1990; GRosS et al., 1993). Food<br />
requirements, however, can be expected to differ among taxa. While larger herbivores may<br />
tolerate forage of low nutritional quality if availabb in sufficiently large quantities, the high<br />
metabolic rate and small digestive system of medium-sized grazers (DeNNenr & Vnru Soest,<br />
1985) entail a need for higher-quality forage, albeit in smaller quantities (PRINS & Orr, 1998;<br />
OLFF et a1.,2002). As fibre concentration of above-ground vegetation increases and nitrogen<br />
concentration <strong>de</strong>creases during the process of ageing (Bos, 2002), a vegetation consisting of<br />
fully-grown, mature plants is on average of lower nutritional quality than shoft swards<br />
consisting of regrown plants (grazing lawns' sersu McNAUGHToN, 1984). Hence, food intake<br />
rate of medium-sized grazers can be expected to be lower un<strong>de</strong>r high availability of low-<br />
quality food, and higher un<strong>de</strong>r low to intermediate availability of high-quality food (Type IV<br />
functional response; DEKKER & VAN LANGEvELDE, 2007), as reflected by unimodal, dome-<br />
shaped response curves (Bos et al., 2002b; DUMNr et a1.,2003; vAN LANGEVELDE et al',<br />
2oo8).<br />
presumed differences in functional response between smaller and large herbivores<br />
have given rise to the concept of 'feeding facilitation' among herbivore assemblages, i'e.<br />
larger herbivores creating 'grazing lawns' for smaller species (Ansrnlulr & OwEN-SMrrH,<br />
2OO2). lf coexistence of herbivore communities would paftly (or entirely) <strong>de</strong>pend on<br />
facifitation (PRINS & OLFF, 1998; FARNSWoRTH et al., 2002), removal or extinction of one or<br />
more bulk fee<strong>de</strong>rs might directly affect persistence of smaller-sized species (HUISMAN & OLFr,<br />
1998) and, in the longer term, have significant evolutionary-ecological implications<br />
(MCNAUGHT9N , t984; ClnornaLr et at., 2OO2). Evi<strong>de</strong>nce in favour of feeding facilitation has<br />
been provi<strong>de</strong>d by studies on natural herbivore assemblages (MCNAUGHroN, t976; KRUEGER,<br />
1986; SrnHl et al., 2006) as well as on assemblages consisting of wild and domestic<br />
herbivores (e.g. Gonoon, 1988; BoS ef al.,20O2c; KUttPEn, 2004; Ausrnnan et al., 20O7;<br />
My5TERUD & AusrRHErM, 2008). Other studies, however, failed to support such relationships<br />
(SrncLrun & NoRroN-GRrFFrrHS, 1982) or revealed trends opposite to those predicted (vlt'l orn<br />
Wat et a1.,1998). Apart from methodological grounds, heterogeneity in support of facilitation<br />
in medium-sized herbivores may stem from ecological differences among studies. First, the<br />
balance of facilitation and competition may <strong>de</strong>pend on plant productivity (KuuPER ef a/',<br />
2004; DEKKER & vAN LANGEVELDE, 2OO7), i.e. with <strong>de</strong>creasing plant productivity, interspecific<br />
Vegetation height and rabbit foraging activity<br />
73
competition for food can be expected to increase. Second, facilitation may show strong<br />
seasonality, e.g, only occur during the plant growing seasons (FRvxELL, 1991; ARSENAULT &<br />
owrN-SMrftr, 2002) or when food resources become limited (RueoA et a1.,200g). Third,<br />
feeding facilitation can be expected to be function of the difference in body mass among<br />
coexisting herbivores (PRINS & Orr, 1998); i.e. when differences are either very small or<br />
very large, smaller species may not (or to a lesser extent) benefit from the presence of<br />
larger ones. Body mass can here be consi<strong>de</strong>red as a global measure <strong>de</strong>termining energy and<br />
protein requirements of the herbivore and its capacity to ingest and digest the vegetation.<br />
Foutth, the <strong>de</strong>nsity of the large and medium-sized herbivores influences the outcome of the<br />
interaction (BAKKER et al., 2009). Facilitation is expected to be stronger at mo<strong>de</strong>rate large<br />
herbivore grazing intensity and at a low medium-sized herbivore <strong>de</strong>nsity. Finally, if high-<br />
<strong>de</strong>nsity grazing by medium-sized herbivores results in grazing lawns, as has been observed<br />
in geese (vAN DER GRMF et al., 2002) and rabbits (BAKKER et al., 2005), facilitation by larger<br />
herbivores may be replaced by self-facilitation (Ansrrunulr & owEN-sMrrn, 2002).<br />
While rabbits are wi<strong>de</strong>ly assumed to be facilitated by larger grazers (e.g. Wlr-uaus ef<br />
al., 1974; WALLAGE-DREES, 1982; OoSTERVELD, 1983; DREES, 1999; DREES, I99g; Bos et al.,<br />
2002a), suppofting evi<strong>de</strong>nce is mainly anecdotic or indirect. Only limited systematic research<br />
is available about the putative preference of rabbits for previously grazed (or clipped)<br />
vegetation and the hence <strong>de</strong>ductible facilitative effect of large grazers on rabbits: purely<br />
experimental studies suggest the preference of the rabbit for shofter swards (IAS6N ef a/.,<br />
2002; BAKKER et al., 2009); more <strong>de</strong>scriptive field studies indicate a preference for swards of<br />
medium plant standing crop (vnru DE KoppEL etal., 1996) or find no consistent effect of large<br />
herbivores on rabbits (Olrr & BoERSMA, 1998). We conducted two field experiments to test it<br />
and to what extent, wild rabbits (Oryctolagus cuniculus L.) are facilitated by domestic<br />
herbivores <strong>de</strong>ployed in nature management. One experiment was a short-term experiment<br />
un<strong>de</strong>r strictly controlled conditions in a homogeneous grazing habitat, while the second<br />
experiment was peformed during a long-term period, in a complex natural environment with<br />
a spatially heterogeneous grazing habitat. We hypothesized that rabbits will prefer grazing in<br />
vegetation that has been kept at low to intermediate height (by means of grazing or<br />
mowing) above grazing in higher vegetation.<br />
74 Chapter 3
Materials and methods<br />
Study area<br />
Experiments were carried out in three study sites. Grazing-simulating mowing<br />
exoeriments were conducted in the Flemish Provincial Domain 'Puyenbroeck' (Wachtebeke,<br />
Belgium, 51"9'11" N, 3052?3'E, managed by the Provincial Government East-Flan<strong>de</strong>rs) ca.<br />
75 km W from Nieuwpooft. At this site, wild rabbits are the dominant natural grazers<br />
(absence of large grazers). Exclosure experiments were conducted in coastal dune<br />
grasslands at the Flemish Nature Reserve'Uzermonding' (Nieuwpooft, Belgium; 51"9?" N,<br />
2"43'57" E; managed by ANB, Flemish Government) and the French Nature Reserve'Dune<br />
Fossife <strong>de</strong> Ghyvel<strong>de</strong>'(Ghyvel<strong>de</strong>, France, 5L"2'48" N, 2o33'02" E; managed by Conservatoire<br />
du Littoral), ca. 25 km apart. At both sites, wiH rabbits comprise the dominant natural<br />
grazers while large domestic herbivores are used for grazing management (IJzermonding:<br />
Mergelland shep, ovis aries L.; Ghyvel<strong>de</strong>: Haflinger pony, Equus caballus L.). More<br />
information about these dune areas can be found in Chapter 1.<br />
Mowing experiment<br />
We selected two flat, monotonous lawns (henceforth referred to as'grassland 1'and<br />
'grassland 2) in the study area Puyenbroeck, both bor<strong>de</strong>red by a Poplar plantation and<br />
mown at regular interuals. In each grassland, a single 72 x 30 m study plot was <strong>de</strong>lineated,<br />
immediately bor<strong>de</strong>ring the woodland (grassland 1) or ca. 2 m away from it (grassland 2).<br />
Both plots were divi<strong>de</strong>d into eight strips of equal width (numbered 1-8 in Fig. 1), and twelve<br />
75 x 75 cm pqs were distributed evenly across each strip (totalling 96 pqs per grassland). In<br />
a first experimental period (spring 2006), all grassland strips were mown at equal height<br />
fequal'treatment).<br />
In the second period (spring-summer 2006), even strips were mown at<br />
equal height, while odd strips were left untouched feven' treatment). In the third period<br />
(summer-autumn 2006), even strips were left untouched, and odd strips were mown at<br />
equal height fodd' treatment).<br />
Vegetation height and rabbit foraging activity<br />
75
l!<br />
at<br />
IF<br />
lt<br />
ll<br />
lt<br />
tl<br />
lt<br />
lt<br />
tt<br />
II<br />
TI<br />
It<br />
tt<br />
ll<br />
ll<br />
lt<br />
Sbip 3<br />
tl<br />
al<br />
!l<br />
tt<br />
ll<br />
lt<br />
!T<br />
tl<br />
IT<br />
ll<br />
ll<br />
tt<br />
Fioure 1: Schematic presentation of one grassland of the mowing experiment. There are eight strips<br />
of 9 m by 30 m, all bor<strong>de</strong>ring the forest. Within each strip, 12 pqs of 75 cm by 75 cm are marked off.<br />
Before the onset of the experiment, all rabbit pellets were removed in each pq. At the<br />
end of the three experimental periods Cequal' 25-26 April 2006; 'even' 10-12 July 2006; 'odd'<br />
26-27 september 2006), the total numbers of pellets in each pq were counted and<br />
subsequently removed. To estimate the rate of petlet <strong>de</strong>cay, a total of 50 freshly collected<br />
pellets were exposd in two small rabbit-proof exclosures in each grassland at the beginning<br />
of each experimental period and were counted at the end of this experimental period. On 8<br />
November 2006, x,y-coordinates of all rabbit burrows located in and around each grassland<br />
were recor<strong>de</strong>d using GPS (Garmin GPS map 76 - see Fig.2) The mean distance between<br />
each pq and the ten most close by rabbit holes was calculated.<br />
on every counting date, vegetation height was measured at the centre of each pq, by<br />
lowering down a disc (diameter 15 cm) with a central slot around a vertical ruler, measuring<br />
the height at which the disc touches the vegetation first (combination of "drop disc method"<br />
and "sward stick method" <strong>de</strong>scribed in STEwART et al.20Ol). The mowing treatments proved<br />
to be a<strong>de</strong>quate to establish significant differences in vegetation height between odd and<br />
even strips during the'even'and'odd'treatment, while vegetation height was similar in all<br />
strips during the'equal'beatment (see Appendix 1).<br />
In addition, four plant samples per grassland were collected by clipping aboveground<br />
vegetation. we collected on average L2 g dry weight per sample, consisting of a mix of the<br />
76 Cltapter 3<br />
ll<br />
ll<br />
tl<br />
II<br />
lt<br />
t!<br />
tl<br />
ta<br />
ll<br />
ll<br />
ll<br />
ll<br />
lt<br />
II<br />
lt<br />
ll<br />
ta
present plant species. The samples were distributed equally over short and long strips. They<br />
were drid at 60oC (WTB Bin<strong>de</strong>r with controller RD 2 EED/FED; Bin<strong>de</strong>r, Tuttlingen, Germany)<br />
until no further mass loss was <strong>de</strong>tected, after which the dried plants were grin<strong>de</strong>d' The<br />
percentage of cru<strong>de</strong> protein (CP) and of cell wall constituents (cellulose, hemicellulose and<br />
lignin, which were <strong>de</strong>rived from NDF (neutral <strong>de</strong>tergent fibre), ADF (acid <strong>de</strong>tergent fibre)<br />
and ADL (acid <strong>de</strong>tergent lignin)) were obtained by Near Infrared Spectroscopy (NIRS - for<br />
more information see GIVENS et al. (1997)). A FOSS Feed and Forage Analyzer was used,<br />
combined with Winisi softi /are (FOSS, Brussels, Belgium). The calibration for the NIRS was<br />
carried out by performing wet analyses for approximately 10o/o of the samples, following the<br />
method of Kjefdahl for CP and GoERTNG & Varu Soesr (1970) and VAN SoEsr et al. (1991) for<br />
cell wall constituents. Forage quality for rabbits was approximated by DP (digestible protein<br />
percentage) and DE (digestible energy). Amounts of digestible protein were estimated by<br />
multiplying CP with the mean digestibility coefficient of CP for grasses (value of 0'70; MAFF,<br />
1986). Digestible energy was estimated by multiplying Gross Energy (based on MAFF 1986)<br />
with a coefficient of digestibility, quantified as 0.867 - 0.0012 ADF (g/kg DM) (oe Btts et al',<br />
1992).<br />
Vegetatbn height and rabbit foraging activity<br />
77
I<br />
a<br />
6RASSLAN0 t<br />
c<br />
SttP t<br />
xxx<br />
Fored bor<strong>de</strong>r<br />
x<br />
xx<br />
x<br />
x<br />
x<br />
xxX<br />
Sfnp qII '<br />
"*t<br />
Separate grcup d<br />
rabbit holes<br />
Forest area with<br />
rcbbit holes x x<br />
\ xxx<br />
XX<br />
xx<br />
x<br />
Forest bor<strong>de</strong>r<br />
a<br />
[*1,.;:<br />
LXI'o-o'<br />
o \: nbbitholes<br />
x<br />
x<br />
xx xx<br />
xxx xxx<br />
xxx<br />
xx<br />
xx xx<br />
X<br />
xx<br />
xx \ \11<br />
I<br />
x<br />
\<br />
\\I1<br />
\'\'\<br />
r \\r<br />
Fiqure 2: Presentation of the two grasslands of the mo<br />
o stick<br />
x rabbit hole<br />
I Doint of orientation<br />
xx<br />
xxx<br />
xx. x<br />
x<br />
?<br />
I Strp<br />
1/<br />
'I<br />
P I<br />
I I<br />
I<br />
a<br />
GR/qSSUND 2<br />
obtained by GPS. The rabbit holes, the forest bor<strong>de</strong>r and the sticks (marking off the strips in each<br />
grassland) are indicated. In grassland 1, a separate group of rabbit holes can be seen near strip 8. All<br />
other rabbit holes are sifuated in or near the forest.<br />
Chapter 3
Exclosure experiment<br />
Between August 1999 - April 2000, a total of five exclosures (each consisting of three<br />
treatments of 350 x 350 cm) were set up along shrub-grassland edges in coastal dune<br />
grasslands at Ilzermonding and Ghyvel<strong>de</strong> (Fig. 3). Within each exclosure treatment, six 75 x<br />
75 cm permanent quadrants (pqs) were <strong>de</strong>lineated and assigned to one of the three<br />
treatments: (i) larger herbivores, rabbits and smaller herbivores allowed (L+R+S); (ii) larger<br />
herbivores exclu<strong>de</strong>d (R+S); (iii) larger herbivores and rabbits exclu<strong>de</strong>d (S)' L+R+S<br />
treatments were not fenced, R+S treatments were fenced with non rabbit-proof wire, S<br />
treatments were fenced with rabbit-proof wire.<br />
,tra<br />
t<br />
a<br />
I<br />
I<br />
a<br />
I<br />
I<br />
I ata<br />
tr<br />
tr<br />
Fioure 3: Schematic presentation of one exclosure-group. Each group is positioned near shrubs and<br />
consists of one L+R+S-treatment (accessible to all herbivores), one R+S-treatment (accessible to<br />
rabbits and smaller herbivores, not to larger herbivores) and one S-treatment (accessible to small<br />
herbivores but not to rabbits and larger herbivores). Six pqs of 75 cm by 75 cm are marked off within<br />
each treatment.<br />
tr<br />
tr<br />
tr<br />
tr<br />
ttattlllaaalllaa ":J-j---q<br />
aattrattatlraaaa<br />
L+R+S:<br />
Accessibh to all<br />
gmzers<br />
:; .i-l l-t tr |<br />
:r<br />
il [.--1 t'-l F-l I<br />
rrrr- ;-J<br />
- -*E -<br />
Accessible to rabbits<br />
and smaller herbivores<br />
(not to large herbivores)<br />
trtrtr<br />
trtrtr<br />
S:<br />
Not accessible to<br />
rdbbits and large<br />
herbivores<br />
Between April-September 2000 and August 2001- September 2005, monthly or bi-<br />
monthly counts of rabbit pellets were performed in L+R+S and R+S pqs. To estimate the<br />
rate of pellet <strong>de</strong>cay, 100 freshly collected pellets were placed in the S treatment within each<br />
exclosure and the remaining pellets were counted during the following visit.<br />
During April 2000 (spring season), June-September 2000, July-September 2001, and<br />
August-September 2005 (summer season), vegetation height in each pq was measured<br />
(Appendix 2) at 25 randomly selected points by lowering down a disc (diameter 15 cm) with<br />
Vegetation height and rabbit foraging activity<br />
79
a central slot around a vertical ruler, measuring the height at which the disc touches the<br />
vegetation first (see higher). We dld not measure vegetation height during the other<br />
seasons, but it was visually observed that the patterns in those other seasons were similar to<br />
those measured in the earlier mentioned seasons. As the grazing treatment did not result in<br />
significant differences in vegetation height in IJzermonding (except for summer 2005), the<br />
results of this study area (Appendix 3) are not discussed further. In Ghyvel<strong>de</strong>, the grazing<br />
treatment did significantly influence the vegetation height, except for spring 2000.<br />
Therefore, spring 2000 was omitted from the analyses of the data of Ghwel<strong>de</strong>. Additional<br />
vegetation measurements are <strong>de</strong>scribed in Chapter 2.<br />
In August-september 2005 (summer season), the aboveground vegetation of a<br />
random selection of pqs was totally clipped. Generally, two pqs per exclosure and per<br />
treatment were sampled. (By exception, 3 extra samples were taken in IJzermonding (2 in<br />
L+R+S and 1 in S) and 5 samples from Ghyvel<strong>de</strong> are missing (1 acci<strong>de</strong>ntally in L+R+S and 4<br />
in S because some ponies succee<strong>de</strong>d to graze the vegetation of these plots).) The food<br />
quality of these samples was analysed as <strong>de</strong>scribed above.<br />
Preference for vegetation height<br />
To assess preference for low versus high vegetation in the exclosure and mowing<br />
experiments, we used the method of Tnvlon & Wrunus (1956) to estimate rabbit <strong>de</strong>nsities,<br />
taking into account daily production of pellets per individual, rate of pellet <strong>de</strong>cay, and time<br />
interval between consecutive counts:<br />
number of rabbits/ha = m2.k1 - m1.k2 . In(kl / k2)<br />
in which<br />
s.(k1 - k2) (t2 - t1)<br />
m1, m2: mean number of pellets per plot during the first (1) and second (2) count, at the<br />
level of the study site (exclosure experiment) or individual pq (mowing experiment); as<br />
pellets were removed from each plot after each count, m1=0; t2-t1: time interval between<br />
two consecutive counts; k1, k2: rate of pellet <strong>de</strong>cay based on samples of 50 (mowing<br />
experiments) or 100 (exclosure experiments) pellets exposed away from rabbi6; g: number<br />
of pellets produced per rabbit and per day, estimated at 333 which was the average of 360<br />
pellets/ind/day repofted by Locruv (L962; t976) and 305 peilets/ind/day based on nine<br />
Chapter 3
days' counts of pellets of six domestic rabbits (Chapter 5). Rabbit <strong>de</strong>nsities were calculated<br />
per date, grassland and plot for mowing experiments and per date, study area and<br />
treatment (L+R+S, R+S) for exclosure experiments.<br />
Statistical analysis<br />
Effec6 of mowing on rabbit activity in Puyenbroeck was evaluated with generalized<br />
mixed mo<strong>de</strong>ls, one for the control period (when even and odd strips both were mown) and<br />
one for the two treatment periods together. Fixed factors inclu<strong>de</strong>d TREATMENT (even or odd<br />
strip (control) or long or short strip (treatment)), DISTANCE (the mean distance from the pq to<br />
the ten most close rabbit holes) and smsoru (only for the'treatmentlmo<strong>de</strong>l, in or<strong>de</strong>r to<br />
correct for the seasonal differences between the two treatment periods). The GRASSLAND (1-<br />
2), srrue (1-16) and pa (1-192) were inclu<strong>de</strong>d as random factors. Pqs in which the number of<br />
rabbit pellets equalled zero during both of the two treatment periods have been omitted<br />
from the analysis. Treatment effects on DP and DE were evaluated by Kruskal-Wallis-tests.<br />
After applying square root transformation of rabbit activity in the dune areas, we<br />
used paired t-tests to evaluate differences between exclosure treatments. Treatment effects<br />
on Dp and DE were evaluated by a general linear mo<strong>de</strong>l, with rnraruenr as the only factor.<br />
Carolina).<br />
Results<br />
The statistical tests were performed with SAS 9.1 (SAS Institute Inc., Cary, Notth<br />
The mowing experiment<br />
The estimated presence of rabbits was similar for even and odd strips in the control<br />
period (similar vegetation height - Table 1 and Table 2). The vegetation height was also<br />
similar for the odd and even strips (Appendix 1), although significantly higher in grassland 2<br />
than in grassland 1. As the vegetation was quite low in the control period,'long' strips during<br />
the following experimental periods would originate from fresh, regrowing vegetation. The<br />
distance between the pq and the rabbit burrows negatively influenced the rabbit activity.<br />
Therefore, this measure was also inclu<strong>de</strong>d in the mixed mo<strong>de</strong>l for the treatment periods.<br />
Significant differences in rabbit presence between the short and long strips were<br />
observed during the mowing treatments (Table 2): the number of rabbits was higher in the<br />
strips mown short than in the unmown strips. There was also a significant difference<br />
Vegetation height and rabbit foraging adivity<br />
81
etween the presence of rabbiE between season 1 and 2: the rabbit presence was much<br />
higher in season 1. No efiect of distance could be observed here.<br />
The Kruskal-Wallis-tests ompadng DP and DE for the even and odd silips indicaE<br />
that there were no significant diffierenes between the strips.
I<br />
Grassland I<br />
DescriPtion of<br />
treatment sbip<br />
t<br />
Similar vegetation<br />
height<br />
Even =<br />
similar<br />
Odd = similar<br />
'Even'treatment Even = short<br />
fHd = lono<br />
'Odd'treatment Odd = short<br />
Even = lonq<br />
2<br />
Similar vegetation<br />
height<br />
Even =<br />
similar<br />
Odd = similar<br />
'Even'beatment Even = short<br />
(Hd<br />
= lono<br />
'Odd'treatment Odd = short<br />
Even = lono<br />
t<br />
Similar vegetation<br />
height<br />
Even =<br />
similar<br />
Odd = similar<br />
'Even'treatment Even = short<br />
Odd = lonq<br />
'Odd'treatment Odd = short<br />
Fven = lono<br />
2<br />
Similar vegetation<br />
height<br />
Even =<br />
similar<br />
Odd = cimilar<br />
'Even'treatment Even = short<br />
Odd = lono<br />
'Odd'treatment Odd = short<br />
Even = lonq<br />
Similar vegetation<br />
t height<br />
Even =<br />
similar<br />
Odd = similar<br />
'Even'treatnent Even = shoft<br />
Odd = lono<br />
'Odd'treatment Odd = short<br />
Even = lono<br />
Similar vegetation<br />
2 height<br />
'Even'E@tment<br />
Even =<br />
similar<br />
Odd = similar<br />
Even = short<br />
Odd = lono<br />
'Odd'treatment Odd = short<br />
Fven = lono<br />
Average + standard<br />
elTor<br />
100 + 67<br />
100 + 62<br />
228 + 65<br />
102 * 59<br />
61+31<br />
0*0<br />
91+34<br />
200 * 54<br />
263 + 93<br />
99*20<br />
29+9<br />
16+8<br />
11.23 * 0.96<br />
10.17 + 1.33<br />
9.51 * 1.13<br />
7.47 + O.L6<br />
14.40 + 0.30<br />
13.16 + 0.91<br />
14.03 + 1.56<br />
14.22 * L.28<br />
8.30 + 0.93<br />
6.70 * O.l7<br />
11.94 + 0.33<br />
11.43 + 1.11<br />
11.67 * 0.00<br />
11.30 + 0.43<br />
10.97 * 0.08<br />
9.49 r 0.05<br />
11.02 * 0.20<br />
11.05 + 0.00<br />
12.26 + 0.06<br />
12.15 + 0.17<br />
11.10 + 0.18<br />
11.84 + 0.00<br />
10.44 * 0.20<br />
rL.22 * 0.24<br />
Table 1: Averages and standard error of the number of rabbits, DP (percentage of digestible protein)<br />
and DE (MJ per kg dry matter) of the mowing experiment. The resutts are presented per grassland,<br />
per g.eatrnent period and subdivi<strong>de</strong>d by even and odd strips (which also represents the short and long<br />
vegetation height in the two last treatment periods).<br />
Vqebtion height and rabbit foraging activity<br />
83
Effect<br />
Control Even or odd strip<br />
Distance<br />
Grassland<br />
Strip<br />
PQ<br />
Residual<br />
Treatment Short or long strip<br />
Season<br />
Distance<br />
Grassland<br />
Strip<br />
PQ<br />
Residual<br />
Control Even or odd strip<br />
Num DF Den DF F-value Prob Estimate<br />
| 76 0.89 0.349 Even: -83.89; Odd: 0.00<br />
| 76 4.78 0.032 -8.42<br />
Covariance parameter estimates<br />
0.00<br />
18457.00<br />
0.00<br />
52071.00<br />
Num DF Den DF F-value Prob Estimate<br />
L L67 5.43 0.021 Long: -87.72; Short: 0.00<br />
L L67 16.38
and summer 2005 (Appendix 2). There were no significant differences in DP and DE between<br />
the treatments.<br />
Rabbits per<br />
year 2000<br />
2001<br />
2002<br />
2003<br />
2004<br />
2005<br />
Rabbits<br />
per season<br />
Rabbits<br />
per season and<br />
year<br />
Spring<br />
Summer<br />
Autumn<br />
Winter<br />
Summer 2000<br />
Summer 2001<br />
Autumn 2001<br />
Winter 2002<br />
Spring 2002<br />
Summer 2002<br />
Autumn 2002<br />
Winter 2003<br />
Spring 2003<br />
Summer 2003<br />
Autumn 2003<br />
Winter 2004<br />
Spring 2004<br />
Summer 2004<br />
Autumn 2004<br />
Winter 2005<br />
Spring 2005<br />
Summer 2005<br />
Average + standard error<br />
L+R+S I R+S<br />
22 + I<br />
5r2<br />
2Ir.4<br />
35+ 5<br />
59i10<br />
22t.4<br />
57r10<br />
33r 6<br />
2t i 5<br />
t7+ 4<br />
22 r 1<br />
612<br />
4t3<br />
3+1<br />
37r.4<br />
27r 4<br />
15f 6<br />
24t 2<br />
56 x. 22<br />
38r12<br />
29 + 1<br />
36+16<br />
86+19<br />
78 + 5<br />
36 r. L4<br />
13+ 3<br />
27 t n.a.<br />
30+ 1<br />
25 + 6<br />
6+2<br />
23 r 5<br />
31 r 5<br />
62 r. t2<br />
27 r 5<br />
61 *<br />
37r<br />
19 1<br />
16+<br />
11<br />
7<br />
4<br />
3<br />
25 r 6<br />
Bt3<br />
5r2<br />
5r2<br />
45L7<br />
27r.7<br />
13+ 3<br />
16+ 2<br />
47 r 1<br />
46r21<br />
26 r 1<br />
33i11<br />
94+22<br />
90r 3<br />
32 r 8<br />
L4 + 3<br />
38 + n.a.<br />
36r 3<br />
Paired t-test or GLM<br />
DF t-value or F-value Prob<br />
1 -0.42 0.749<br />
4 -0.93 0.406<br />
11 -0.95 0.365<br />
9 1.12 0.292<br />
9 -0.75 0.470<br />
6 -2.40 0.053<br />
8 -0.94 0.373<br />
13 -1.74 0.106<br />
11 0.54 0.599<br />
10 0.28 0.785<br />
1<br />
I<br />
2<br />
2<br />
2<br />
2<br />
2<br />
2<br />
1<br />
1<br />
2<br />
1<br />
2<br />
1<br />
2<br />
2<br />
n.a.<br />
2<br />
-0.42<br />
-13.09<br />
-0.30<br />
-t.27<br />
-2.82<br />
0.11<br />
0.34<br />
IL.7O<br />
0.34<br />
-0.83<br />
3.46<br />
0.37<br />
-1.39<br />
-1.50<br />
0.35<br />
-0.55<br />
n.a.<br />
-3.21<br />
0.749<br />
0.049<br />
0.792<br />
0.331<br />
0.106<br />
0.925<br />
0.767<br />
0.007<br />
0.793<br />
0.558<br />
0.075<br />
0.775<br />
0.299<br />
0.374<br />
0.761<br />
0.638<br />
n.a.<br />
0.085<br />
Rabbits - all<br />
data 31r.4 32+ 4 45 -1.10 0.277<br />
DP (o/o) Summer 2005 7.28 i 0.35 5.99 r 0.28 Ut7 0.45 0.s13<br />
DE (Ml / kg<br />
DM) Summer 2005 9.01 + 0.44 8.24 L 0.23 rlLT 2.52 0.131<br />
Table 3: Results of the rabbit counts and DP and DE in Ghyvel<strong>de</strong>. Averages and standard errors are<br />
presented per treatment (L+R+S = accessible to all herbivores; R+S: accessible to rabbits and smaller<br />
herbivores, but not to large grazers). Rabbit counts are presented by year, by season, by season and<br />
year or all together. The results of the paired t-tests (for the rabbit counts) and the GLM (for DP and<br />
DE) are presented. DF = <strong>de</strong>grees of freedom. T-value or F-value = test sbatistic obtained by the test.<br />
prob = the significance level obtained by the test. n.a. = not applicable (only one data point<br />
available).<br />
Vqetation height and rabbit foraging adivity<br />
85
Discussion<br />
The results of the clipping experiment in Puyenbroeck indicate that the rabbits<br />
preferred a lower vegetation, while this pattern was not observed in the dune area of<br />
Ghyvel<strong>de</strong>. A drastic, short-term experimental mowing regime confirmed our hypothesis that<br />
rabbits do prefer shofter swards (leading to facilitation), but a long-term grazing trial un<strong>de</strong>r<br />
more complex natural circumstances did not confirm the hypothesis (and did neither indicate<br />
the opposite possibility of competition). Two remarkable consi<strong>de</strong>rations concerning<br />
Puyenbroeck are 1. that after reversing the place ofthe treatment (the reversal ofthe even<br />
and the odd strips), the results are still significant and 2. that during the control period<br />
(similar vegetation height in all strips), a period in which vegetation height was not<br />
significantly different between the strips, there was no such preference for the odd or even<br />
strips. This makes the finding that facilitation of rabbits in Puyenbroeck is probable even<br />
stronger. Consi<strong>de</strong>ring the significant differences of the vegetation height during the two<br />
experimental periods, in both grasslands, we can conclu<strong>de</strong> that vegetation height <strong>de</strong>termined<br />
the activity pattern of the rabbits in Puyenbroeck. This is consistent with the findings of<br />
BAKKER etal.,(2009) and IAsoN etal.(2002).<br />
However, our results do not suggest that this preference is caused by a difference in<br />
vegetation quality, when comparing the lower and higher vegetation. Despite the fact that<br />
we earlier proved that rabbits are able to distinguish between food samples of different<br />
quafity (SoNens et al., 2008; Chapter 4), this quality does not seem to interfere with their<br />
preference for short swards. Table 1 shows that overall the average DP of short vegetation is<br />
slightly higher than that of the taller vegetation, suggesting a higher quality of the shorter<br />
vegetation. These differences proved to be not significant though. As the sample size of the<br />
quality measurements is rather low, we could won<strong>de</strong>r whether the differences are really not<br />
significant or whether the sample size was simply too small to <strong>de</strong>tect significant differences.<br />
Neveftheless, even five years of different grazing regimes in Ghyvel<strong>de</strong> also did not<br />
significantly alter the food quality between the treatments, so we should consi<strong>de</strong>r some<br />
alternative hypotheses to explain the preference of the rabbits for short vegetation. IAsoN ef<br />
al' (2002) propose that the preference of their study rabbits for short vegetation originated<br />
from antipredator consi<strong>de</strong>rations of the animals (better visibility of predators in an open<br />
vegetation). Also, short swards could improve communication with other rabbit individuals in<br />
case of predator <strong>de</strong>tection (warning by upturned white tail). Foraging <strong>de</strong>cisions are assumed<br />
to be titrations of costs and benefits within and across patches; herbivores would balance<br />
conflicting <strong>de</strong>mands for food acquisition and safety (KorLER & BLnusrum, 1995). This means<br />
86 Chapter 3
that it is possible that the unimodal functional response curve of rabbits is not caused by<br />
food quality consi<strong>de</strong>rations, but is simply the price to pay when they want to graze in a safe<br />
way: a large return of high biomass is not possible because it is too dangerous. However,<br />
the experiments of BAKKER et al. (2005) and Derrrn et al. (2007) show that rabbits are<br />
sensitive to perceived predation risk, but this does not influence the average spatial<br />
distribution of their grazing pressure. Rather, the rabbits shifted the time of foraging or did<br />
increase total foraging time (spending more time on vigilance). Another suggestion is that<br />
forage efficienry (handling time) in a <strong>de</strong>nse vegetation is higher than in a low, open<br />
vegetation (vnru or KoppEL et a1.,1996). It is clear that further research on these hypotheses<br />
is necessary.<br />
In Ghyvel<strong>de</strong>, facilitation does not seem to be present yet, but maybe there is a<br />
chance that it would staft to occur in future years: the balance between competition and<br />
facilitation might have shifted towards a neutral point due to the growing difference between<br />
the vegetation height during the experiment, and maybe, it will further shift towards<br />
facilitation in the future? According to KUIJPER et al. (2008), species competing each other for<br />
the same resources on shoft time-scale might well be facilitating each other when looking at<br />
larger time-scales (e.g. while taking plant species replacement into account). Also, when<br />
facilitation occurs, its effect becomes stronger over the years (Bxrrn et a1.,2009)' However,<br />
at present, we have no indications that facilitation will occur in Ghyvel<strong>de</strong> while facilitation in<br />
the mowing experiment at Puyenbroeck is already occurring after a few months.<br />
So we consi<strong>de</strong>r some possible factors masking or preventing facilitation in the dune<br />
area. A first possible explanation is that vegetation height in Ghyvel<strong>de</strong> in L+R+S is mostly<br />
not that much lower than unmown strips in Puyenbroeck. Maybe, the vegetation in Ghyvel<strong>de</strong><br />
should simply be shorter to allow facilitation. However, mean vegetation height in Ghyvel<strong>de</strong><br />
is probably quite high as a consequence of the height of the shrub layer. The grass layer<br />
itself was probably not that much higher than the mown strips in Puyenbroeck.<br />
An important possible explanation comes from the different plant productivity levels<br />
of the two study areas. The study sites in Ghyvel<strong>de</strong> have a relatively low productivity.<br />
possibly, each herbivore is just taking what it can get, as the availability of food is quite low'<br />
In the highly productive grasslands of Puyenbroeck, regrowth is occurring much quicker, and<br />
after mowing, the stimulation of the formation of a grazing lawn is starting directly, leading<br />
to the occurrence of rabbit facilitation.<br />
Seasonality did not seem to have any effect on the grazing behaviour of the rabbits.<br />
The rabbiB in lJzermonding and Ghyvel<strong>de</strong> did not change their vegetation preferences<br />
during the different seasons, neither during the growing season, neither in the season when<br />
Vegetatbn height and rabbit foraging actrvity<br />
87
esources are limiting, which is the winter season for the rabbits in our study areas<br />
(WALLAGE-DREES, 1988). The experiment in Puyenbroeck was stopped before the start of the<br />
winter, but it would be an interesting suggestion for fufther research to extend this<br />
experiment during a longer period, in or<strong>de</strong>r to investigate whether seasonality is influencing<br />
the behaviour of rabbits towards short and high vegetation.<br />
An alternative explanation involves the type of herbivore involved in the different<br />
areas' When there is no optimum difference in body mass to allow facilitation (Prurus & OLrr,<br />
1998), facilitation cannot be expected. This is shown by the <strong>de</strong>crease of ro<strong>de</strong>nts in the<br />
presence of cattle (Kersrnc, 1998; BAKKER et a1.,2009; STEEN ef a/., 2005) and the <strong>de</strong>crease<br />
of insects in the presence of lagomorphs (GuvsoN & HAssALL, 1985; HSNT7TNGER ef a/.,<br />
2008), although sometimes the abundance of insects is increased by vertebrate grazing<br />
(RAMBo & FAFTH, 1999). The herbivores involved in Ghyvel<strong>de</strong> (ponies) are not the same as<br />
the'large herbivore'in Puyenbroeck (an artificial one: the mowing machine). However, since<br />
this aftificial 'grazer' was 'grazing' large quantities of forage, we could consi<strong>de</strong>r it a mo<strong>de</strong>l for<br />
a large, generalist herbivore (a bulk fee<strong>de</strong>r) present in large <strong>de</strong>nsities. As this bulk fee<strong>de</strong>r<br />
was facilitating the rabbits of Puyenbroeck, we have no reason to assume that the body<br />
mass of the ponies of Ghyvel<strong>de</strong> would be too large to allow for facilitation. We can conclu<strong>de</strong><br />
that body mass differences between the herbivores of our two areas are not sufficient to<br />
explain the different results of these areas.<br />
We could not compare the <strong>de</strong>nsities of large herbivores in both study areas, as the<br />
"large herbivore" was artificial in Puyenbroeck. We can however compare rabbit <strong>de</strong>nsity<br />
between the areas. As facilitailon would in<strong>de</strong>ed be more important in areas with low rabbit<br />
<strong>de</strong>nsity (BAKKER et al., 2009), we would expect that facilitation would occur in Ghyvel<strong>de</strong><br />
rather than in Puyenbroeck. This was however not the case, so we conclu<strong>de</strong> that rabbit<br />
<strong>de</strong>nsity in Ghyvel<strong>de</strong> is not too high to obtain facilitation.<br />
Finally, self-facilitation (Ansrrunurr & owEN-sMrrn, 2002) could be a valuable<br />
alternative explanation for the lack of visible feeding facilitation in Ghyvel<strong>de</strong>. It might be<br />
possible that the grazing pressure insi<strong>de</strong> the exclosures of Ghyvel<strong>de</strong> is so high that they<br />
prefer to maintain a grazing lawn insi<strong>de</strong> this exclosure, thereby avoiding possible competitive<br />
interactions with herbivores outsi<strong>de</strong> the exclosure. Neveftheless, as the vegetation height in<br />
Ghyvel<strong>de</strong> is increasing over the years, we can assume that the rabbits are not able to<br />
maintain the grazing lawns themselves and in the future, facilitation will be more necessary<br />
than ever before.<br />
This research aimed to investigate whether rabbits in<strong>de</strong>ed do prefer short vegetation<br />
above longer vegetation, as predicted by an unimodal functional response. Clearly, the<br />
88 Chapter 3
conditions un<strong>de</strong>r which facilitation is tested are <strong>de</strong>termining for the research outcome.<br />
Straight experimental conditions are able to reveal clear patterns, which is probably due to<br />
the simplicity of the environment. In complex natural situations, many more factors could<br />
influence the behaviour of the animals, thereby possibly masking trends that could<br />
effectively be present. Also, we cannot exclu<strong>de</strong> that some biological factors (like large<br />
herbivore species, grassland productivity, season, herbivore <strong>de</strong>nsity) are the reason for the<br />
observed differences between Puyenbroeck and Ghyvel<strong>de</strong>, which stresses our opinion that<br />
facilitation should be tested un<strong>de</strong>r various conditions, and that one study indicating no<br />
facilitation in a herbivore assemblage should not be consi<strong>de</strong>red <strong>de</strong>cisive. Fufther, our results<br />
did not indicate a higher food quality to be responsible for the rabbits' preference for shott<br />
vegetation in a high-productive grassland. Although some plausible alternative explanations<br />
have been discussed, none of them seem to be entirely satisfying on their own, Also on this<br />
topic, further research is clearly necessary.<br />
Acknowledgements<br />
We thank the Agency for Nature and Forest (ANB, Flemish Government), the Conservatoire du<br />
Littoral and the Provincie Oost-Vlaan<strong>de</strong>ren for allowing access to the study areas and making it<br />
possible to perform the experiments. Technical support was provi<strong>de</strong>d by the mowing technicians of<br />
puyenbroec6 Ward Vercruysse (INBO), Wm De Bel<strong>de</strong>r (INBO), Patrick Geers (INBO) and Maarten<br />
pevenage. We are grateful to INBO and ILVO for analyses of plant material. We thank the Flan<strong>de</strong>rs<br />
Maritime Institute (VLIZ) for the use of their infrastructure and Chris Van Waes (ILVO, Plant<br />
Department) for the information on the plant analysis procedure. We also want to thank Carl<br />
Vangestel for statistical help and Carine Wils (INBO) for help with ArcGIS. The first author is<br />
supported by the Research Foundation - Flan<strong>de</strong>rs (Aspirant of the FWo-Vlaan<strong>de</strong>ren).<br />
Refercnces<br />
ARSENAUTT, R. & N. Oweru-SynH (2002). Facilitation versus competition in grazing herbivore<br />
assemblages. Oikos 97 : 313-318.<br />
AusrRHErM, G., A. MysrERUD, K. HAssEL, M. EvJU & R.H. Oxurrro (2007). Interactions between sheep,<br />
ro<strong>de</strong>nts, graminoids, and bryophytes in an oceanic alpine ecosystem of low productivity.<br />
Ecoscie n ce 14 : 17 B- I87 .<br />
Bmxea, E.S., H. OrFF & J.M. Gurcnum (2009). Contrasting effects of large herbivore grazing on smaller<br />
herbivores. tusic and Applied Ecology LO: 141-150.<br />
BAKKER, E.S., R.C. RETFFERS, H. Or-rr & J.M. GlercnrqAN (2005). Experimental manipulation of predation<br />
risk and food quality: effect on grazing behaviour in a central-place foraging herbivore.<br />
Vegetation height and rabbit foraging acttvity<br />
89
Oecologia 146:. 157 -L67 .<br />
Bos, D. (2002). Synthesis: Habitat use by Brent Geese in the Wad<strong>de</strong>n Sea un<strong>de</strong>r different scenarios of<br />
livestock-grazing management. In Bos, D., Grazing in coastal grasslands, Brent Geese and<br />
facilitation by herbivory, PhD dissertation, Rijkuniversiteit Groningen, Groningen, the<br />
Netherlands: 189-205.<br />
Bos, D., J.P. BAKKER, Y. DE VRIES & S. varu LIEsHour (2002a). Long-term vegetation changes in<br />
experimentally grazed and ungrazed back barrier marshes in the Wad<strong>de</strong>n Sea. In Bos, D.,<br />
Grazing in coastal grasslands, Brent Geese and facilitation by herbivory PhD dissertation,<br />
Rijksuniversiteit Groningen, Groningen, the Netherlands: 1 1 1-130.<br />
Bos, D., J. vnru or K0PPEL, & F.l. WEIsstNG (2002b). Brent Geese aggregate to cope with increased levels<br />
of primary production. In Bos, D., Grazing in coastal grasslands, Brent Geese and facilitation by<br />
herbivory, PhD disseftation, R'rjksuniversiteit Groningen, Groningen, the Netherlands: 85-106.<br />
Bos, D., M. LooNEN, M. srocK, F. HoFEDm, s. vnru oen Gnnnr & J.p. Bnrrrn (2002c). Utilisation of<br />
Wad<strong>de</strong>n Sea salt marshes by geese in relation to livestock grazing. In Bos, D., Grazing in<br />
coastal grasslands, Brent Geese and facilitation by herbivory, PhD dissertation, Rijksuniversiteit<br />
Groningen, Groningen, the Netherlands:131-153.<br />
CARDINALE, 8.J., M.A. PALMER & S.L. CoLuNs (2002). Species diversity enhances ecosystem functioning<br />
through interspecific facilitation. Nature 4I5: 426-429.<br />
DE BLAS, C., J. WIsevnru, M.l. FMGA & M.J. VIlr-nr'rroE (1992). Prediction of the digestible energy and<br />
digestibility of gross energy of feeds for rabbits. 2. Mixed diets. Animal Feed Science and<br />
Technology39: 39-59.<br />
DEKKER, J.J.A' & F. vnru LarucrvrLoe (2007). Plant productivity and free-ranging herbivores impact spatial<br />
foraging patterns and population dynamics of refuge-living herbivores. In: Drrren, J.J.A.,<br />
Rabbits, refuges and resources. How foraging of herbivores is affected by living in burrows. phD<br />
dissertation, Wageningen Universiteit, Wageningen, the Netherlands: 65-g4.<br />
DEKKER, J.J.A., M.L.w.J. BRoEKHUUSE, w.F. DE BoER, F. vAN LANGEVELDE, s.E. Vnr WTEREN & H.H.T. pRrNS<br />
(2007). Grazing gradients around refuges of small herbivores are caused by spatial variation in<br />
vigilance. In: Drrren, J.l.A., Rabbits, refuges and resources. How foraging of herbivores is<br />
affected by living in burrows. PhD dissertation, Wageningen Universiteit, Wageningen, the<br />
Netherlands: 19-31.<br />
DEMMENT, M.W. & P.l. Vall SoEsr (1985). A nutritional explanation for body-size patterns of ruminant<br />
and nonruminant herbivores. The American Naturalistl2|: 64L-672.<br />
DREES, M. (1989). Konijnen als grazers. Duin 12:156-158.<br />
Dnres, M. (1998). Langoor. Over konijnen en vegetatie in <strong>de</strong> duinen. Duin2I:4-6.<br />
DuMNr, D., H. FRrrz, S. Br-ats & P. Dur'tcnru (2003). The functional response in three species of<br />
herbivorous Anatidae: effects of sward height, body mass and bill size. Journal of Animal<br />
Eco/ogy72: 220-23L.<br />
FARNswoRTtt, K.D., S. Focnaol &J.A. BEEcHAM (2002). Grassland-herbivore interactions: how do grazers<br />
coexist? The American Naturalist I59: 24-39.<br />
90 Chapter 3
FRy1ELL, J.M. (1991). Forage quality and aggregation by large herbivores. The Amerian Naturalist<br />
138:478-498.<br />
GrvENS, D.L, DE BoEVER, J.L. & DeevIue, E.R. (1997). The principles, practices and some future<br />
applications of near infrared spectroscopy for predicting the nutritive value of foods for animals<br />
and humans. Nutrition research reviews 10: 83-114 .<br />
GoERTNG, H.K. & p.J. VAN SoEsr (1970). Forage Fibre Analysis (Apparatus, Reagents, Procedures, and<br />
Some Applications). Agricultural Handbook No. 379, Agricultural Research Service, United States<br />
Department of Agriculture.<br />
Gonoor, I.J. (1988). Facilitation of red <strong>de</strong>er grazing by cattle and its impact on red <strong>de</strong>er performance.<br />
Journal of ApPlid EcologY25: I-LO.<br />
Gp4ysoN, F.W.L. & M. HA55ALL (1985). Effects of rabbit grazing on population variables of Chortippus<br />
brunneus (Orthoptera). Oikos 44:. 27-34'<br />
GRoss, J.E., L.A. SHrpLEy, N.T. HoBBS, D.E. SPALTNGER & B.A. Wuuoen (1993). Functional response of<br />
herbivores in food-concentrated patches: tests of a mechanistic mo<strong>de</strong>l. EcologyT4;778-791'<br />
H9LLTNG, C.S. (1959). Some characteristics of simple types of predation and parasitism. Gnadian<br />
Entomologist 91 : 385-398.<br />
HursMAN, J. & H. OLFF (1998). Competition and facilitation in multispecies plant-herbivore systems of<br />
productive environments. Ecology Letterc t: 25-29'<br />
HuNrzrNGER, M., R. KARBAN & J.H. CusHven (2008). Negative effects of vertebrate herbivores on<br />
inveftebrates in a coastal dune communitV. EcologyS9:1972-1980.<br />
IAsoN, G.R., T. MANSo, D.A. SrM & F.G. HARTLEY (2002). The functional response does not predict the<br />
local distribution of European Rabbits (Oryctotagus cuniculus) on grass swards: experimental<br />
evi<strong>de</strong>nce. Functbnal Ecology 16: 394-402.<br />
KEE5TNG, F. (1998). Impacts of ungulates on the <strong>de</strong>mography and diversity of small mammals in<br />
central Kenya. Oecologia 116: 381-389.<br />
KorLER, B.p. & L. BLAUSTETN (1995). Titrating food and safety in a heterogeneous environment: when<br />
are the risky and safe patches of equal value? OikosT4:257-258.<br />
KRUEGER, K. (1986). Feeding relationships among bison, pronghorn, and prairie dogs: an experimental<br />
analysis. Ecology 67 : 7 60-77 O.<br />
KuDpER, D.p.J. (2004). Small herbivores losing control. Plant-herbivore interactions along a natural<br />
productivity gradient. PhD dissertation, R'rjksuniversiteit Groningen, Groningen, the Netherlands.<br />
KuDpER, D.p.J., p. BEEK&J.P. BaKen(2004). Short-term and long-term interactions between cattle and<br />
European Brown hares in a salt-marsh system. In: KuuPER, D.P.J, Small herbivores losing<br />
control. Plant-herbivore interactions along a natural productivity gradient. PhD dissertation,<br />
R'rjksuniversiteit Groningen, Groningen, the Netherlands: 85-99.<br />
KuupER, D.p.J., P. Beer, S.E. vAN WTEREN & J.P. BAKKER (2008). Time-scale effects in the interaction<br />
between a large and a small herbivore' Basic and Applied Ecology9" L26-134'<br />
LocKLEy, R.M. (1962). Production of faecal pellets in the wib rabbit. Nature 194: 988-989.<br />
LocKLEY, R.M. (1976). The private life of the rabbit' Het Spectrum, Utrecht.<br />
Vegetation height and rabbit foraging activity<br />
91
LUNDBERG, P. (1988). Functional response of a small mammalian herbivore: the disc equation revisited.<br />
Journal of Animal Ecology 57 : 999-1006.<br />
LUNDBERG, P. & M. Asrnou (1990). Functional response of optimally foraging herbivores. lournal of<br />
Thoretical Biology t44 : 367 -377 .<br />
Marr (1986)' Feed Composition - UK Tables of Feed Composition and Nutritive Value of Ruminants.<br />
Chalcombe Publications, Marlow, Bucks, UK.<br />
MCNAUGHToN, S.J. (1976). Serengeti migratory wil<strong>de</strong>beest: facilitation of energy flow by grazing.<br />
Science L9L: 92-94.<br />
McNeucHtor't, S.J. (1984) Grazing lawns: animals in herds, plant form and co-evolution. TheAmerican<br />
Na tura list t24 : 863-886.<br />
MYSTERUD, A. & G. AusRHeIu (2008). The effect of domestic sheep on forage plants of wild rein<strong>de</strong>er; a<br />
landscape scale experiment. European Journal of wldhfe Research 54:461-468.<br />
OKSANEN, L., S.D. FRFTWELL, J. ARRUDA & P. NIEMELA (1981). Exploitation ecosystems in gradients of<br />
primary productivity. The Amerlcan Naturalist lLg: 240-26t.<br />
OLFF, H. & S.F. BoERsMe (1998). Langoor. Lange termijn veran<strong>de</strong>ringen in <strong>de</strong> konijnenstand van<br />
Ne<strong>de</strong>rlandse duingebie<strong>de</strong>n. Oorzaken en gevolgen <strong>voor</strong> <strong>de</strong> vegetatie. Landbouwuniversiteit<br />
Wageningen, Leerstoelgroep Natuurbeheer en Plantenoecologie, Wageningen, the Netherlands.<br />
OLFF, H., M'E. RncnIr & H.H.T. PRINS (2002). Global environmental controls of diversity in large<br />
herbivores. Nature 4I5: 901-904.<br />
Oosrrnveo, P. (1983). Eight years of monitoring of rabbits and vegetation <strong>de</strong>velopment on<br />
abandoned arable fields grazed by ponies. Acta Zoologlca FennicaLT4:71-74.<br />
PRINS, H.H.T' & H. Our (1998). Species-richness of African grazer assemblages: towards a functional<br />
explanation. In: Newaenv, D.M., H.H.T. pnrrus & N. BRowN (eds), Dynamics of rropical<br />
Communities, 37th Symposium of The British Ecological Society, Blackwell Science, UK: ,149-<br />
490.<br />
RAMBo, J.L' & S.H. Farrx (1999). Effect of vertebrate grazing on plant and insect community structure.<br />
Conseruation Bblogy 13: 1047-1054.<br />
RUEDA, M., s. REBorLo, L. GAlvez-Bnevo & A. EscuDERo (200g). Habitat use by large and small<br />
herbivores in a fluctuating Mediterranean ecosystem: implications of seasonal changes. Journal<br />
of Arid EnuironmenbT2: L698-t708.<br />
SINCLAIR, A.R.E. & M. NoRroN-GRIFFTTHS, M. (1982). Does competition or facilitation regulate migrant<br />
ungulate populations in the Serengeti? A test of hypotheses. oecologias3:364-369.<br />
SoMERS, N., B. D'HAESE, L. LENS, B. Bossuyr & M. HoFFMANN (2008). Food quality affects diet preference<br />
of small herbivores: experimental evi<strong>de</strong>nce. Belgian Journal of zoologyL3g: t7o-L76.<br />
STAHL, J', A.J. vAN DER GRAAF, R.H. DRENr & J.P. Bnrren (2006). Subtle interplay of competition and<br />
facilitation among small herbivores in coastal grasslands. Functional Ecology20: 908-915.<br />
STEEN, H., A. MYSTERUD & G. AUsTRHEIM (2005). Sheep grazing and ro<strong>de</strong>nt populations: evi<strong>de</strong>nce of<br />
negative interactions from a landscape scale experiment. oecologia L43: 357-364.<br />
Sftwnnt, K.E.J., N.A.D. BoURN & J.A. THouns (2001). An evaluation of three quick methods commonly<br />
92 Chapter 3
usd to ass€ss sward height in ecology' Joumal of Applied Ecolqy3S: 1148-1154.<br />
TAyLo& R.H. & R.M. W1-uaus (1956). The use of pellet counts for estimating the <strong>de</strong>nsity of populations<br />
of the wifd rabbrt (Oryctotagus cuniculusL.). New Zealand loumal of $ience and Trchnology,<br />
ffiion 838:236-256.<br />
vnn De Koppeu, J., J. HuIsrutl, R. varu DER WAL & H. OLFF (1996). Patterns of herbivory along a<br />
productivity gradient: an empirical and theoretical investigation. EcologyTT:736-745.<br />
vAN DER GRMF, A.J., D. Bos, M.J.I.E. LooNEN, M. Et{ceLMoen & R.H. Dnerur (2002). Short and long-term<br />
facilitation of goose grazing by livestock. In Bos, D., Grazing in coastal grasslands, Brent Geese<br />
and facilitation by herbivory, PhD dissertation, Rijksuniversiteit Groningen, Groningen, the<br />
Netherlands:63-83.<br />
vAN DER WAL R., P. KuNsr & R. DnEur (1998). Interactions between hare and brent goose in a salt<br />
marsh system: evi<strong>de</strong>nce for food competition? Oecologia tL7;227-234.<br />
vAN IANGEVETDE, F., M. DRESCHER, I.M.A. HErKoNIG & H.H.T. PRINs (2008). Instantaneous intake rate of<br />
herbivores as function of forage quality and mass: effects on facilitative and competitive<br />
interactions. Ecological Mo<strong>de</strong>lling 213: 273-284.<br />
VAN SoEsr, P.J., l.B. RoBERrsoN & B.A. LEws (1991). Methods for Dietary Fibre, Neutral Detergent Fibre'<br />
and Nonstarch Polysacchari<strong>de</strong>s in Relation to Animal Nutrition. Journal of Dairy Science, 74:3583-<br />
3597.<br />
WALLAGE-DREE5, J.M. (1988). Rabbits in coastal sand dunes; weighed and counted. PhD dissertation<br />
University of Lei<strong>de</strong>n, Lei<strong>de</strong>n, the Netherlands.<br />
WTLuAMS, O.8., T.C.E. Weus & D.A. WELrs (1974). Grazing management of Woodwalton fen: seasonal<br />
changes in the diet of cattle and rabbits. Journal of Applid Ecolqy ll; 499-516.<br />
Vegetation height and rabbit foraging adivity<br />
93
Appendices<br />
Similar vegetation<br />
height Even or odd strip<br />
Grassland<br />
'Even'treatment Short or long strip<br />
Grassland<br />
'Odd'treatment Short or long strip<br />
Grassland<br />
Num DF<br />
8.19 + 0..16<br />
6.69 + 0.29<br />
,14.00 + 3.96<br />
10.83 + 0.42<br />
9.15 + 2.05<br />
Appendix 1: Averages and standard error of the vegetation height of the mowing experiment. Resulb<br />
of the mixed mo<strong>de</strong>ls applied to the vegetation heigh! after In transformation, are also preented. The<br />
results presented for the fixed effects of the mixed mo<strong>de</strong>ls are the results after omitting the<br />
interaction, when this interaction was not significant. The interaction term of the'even'treatment was<br />
significant. Least squares means were calculated for all the interaction combinations: even strips x<br />
grassfand 1: estimate = 1.90i odd strips x grassland 1: estimate = 3.77i even strips x grassland 3:<br />
I<br />
1<br />
Den F-<br />
DF value Prob<br />
6 0.L7 0.699<br />
6 25.95 0.002<br />
Covariance parameter estimates<br />
0.01<br />
0.02<br />
F-<br />
Num DF Den DF value Prob<br />
1 6 272.94
estimate = 2.38; odd strips x grassland 3: estimate = 2.94. As the interaction was significant, we<br />
conclu<strong>de</strong> that the effect of the mowing was different for the two graaslands, but the least squares<br />
estimates show that nevertheless, the vegetation was highest for the odd (not mown) strips. The<br />
results are presented per grassland, per treatment and subdivi<strong>de</strong>d by even and odd strips (which also<br />
represents the short and long vegetation height in the two last treatment periods). Num DF =<br />
numerator <strong>de</strong>grees of freedom. Den DF = <strong>de</strong>nominator <strong>de</strong>grees of freedom. DF = <strong>de</strong>grees of<br />
freedom. F-value = test statistic obtained by the mixed mo<strong>de</strong>l. Prob = the significance level obtained<br />
by the test.<br />
Vegetation height<br />
(cm)<br />
Spring 2000<br />
Summer 2000<br />
Summer 2001<br />
Summer 2005<br />
Spring 2000<br />
Summer 2000<br />
Summer 2001<br />
Summer 2005<br />
Average * sl andard error<br />
L+R+S<br />
7.89 + 3.60<br />
17.82 + 2.02<br />
16.48 r 1.94<br />
24.56 r 4.92<br />
4.90 x 0.47<br />
I7.7t L L.8T<br />
21.53 + 2.11<br />
49.7L t 4.29<br />
R+S<br />
4.74 L 0.t6<br />
29.58 r 2.18<br />
28.11 + 1.88<br />
32.07 * 3.02<br />
4.78 + 0.42<br />
19.03 i 1.95<br />
24.88 r 2.18<br />
67.52 + 4.94<br />
Kruskal-Wallis-test<br />
chi-<br />
DF square Prob<br />
1 2.55 0.110<br />
1 16.41
*<br />
Rabbits per year 2000<br />
2001<br />
2002<br />
Rabbits<br />
per season<br />
Rabbits<br />
per season ano<br />
year<br />
2003<br />
2004<br />
20ns<br />
Spring<br />
Summer<br />
Autumn<br />
Winter<br />
Spring 2000<br />
Summer 2000<br />
Autumn 2000<br />
Summer 2001<br />
Autumn 2001<br />
Winter 2002<br />
Spring 2002<br />
Summer 2002<br />
Autumn 2002<br />
Winter 2003<br />
Spring 2003<br />
Summer 2003<br />
Autumn 2003<br />
Winter 2004<br />
Spring 2004<br />
Summer 2004<br />
Autumn 2004<br />
Winter 2005<br />
Spring 2005<br />
Summer 2005<br />
Average * standard error<br />
L+R+S I R+S<br />
40 + B<br />
67+10<br />
26 t 6<br />
l2t 2<br />
16r.4<br />
11 t2<br />
38+7<br />
28r 7<br />
23t 7<br />
13+ 3<br />
51 + B<br />
39i11<br />
12 t n.a.<br />
76r13<br />
62+15<br />
29 r 5<br />
56+11<br />
l4r 2<br />
6i2<br />
611<br />
10* 5<br />
15+ 4<br />
16L 4<br />
711<br />
29 a 3<br />
19+13<br />
11 + 2<br />
10t 3<br />
L7 + n.a.<br />
10L2<br />
62+11<br />
B0+16<br />
47 r 9<br />
25 r 3<br />
2I a 3<br />
18t4<br />
54 + 11<br />
42+10<br />
34 r 6<br />
26 + 5<br />
73+19<br />
62 * 3<br />
28 t n.a.<br />
lo7 t 27<br />
62+13<br />
4L+11<br />
89L17<br />
29+10<br />
27 + 3<br />
2IL 2<br />
18! 2<br />
25 + 1<br />
34r10<br />
18+.2<br />
26 + 6<br />
24+10<br />
17 + 5<br />
27 t 9<br />
t7 + n.a.<br />
14 r 0<br />
Paired t-test or GLM<br />
t-value or F-<br />
DF value Prob<br />
5<br />
4<br />
1l<br />
9<br />
8<br />
5<br />
-s.15 0.oo4<br />
-1.53 0.200<br />
-6.11
Vegetation height and rabbit foraging activity 97
98<br />
Feeding triaf, 2005 (Photographs by N. Somerc)
CHAPTER 4<br />
Food quality affects diet prcfercnce of<br />
rabbits: experimental evi<strong>de</strong>nce<br />
Nele Somers, Etinke Dtlaese, BeaUijs Bossu$ Luc Lens &Maurie Hoffinann<br />
&tgian.bwml of Zolqy, 2M8, 138 (2): 1D176<br />
7522:(t<br />
99
Abstract<br />
When foraging, small mammalian herbivores do not show a preference for the forage with<br />
the highest biomass, which can be explained by several hypotheses (e.g. antipredator<br />
consi<strong>de</strong>rations, more difficult handling of tall swards and/or the higher nutritional quality of<br />
shorter grasses). We tested the ability of rabbits to discriminate between plants of different<br />
nutritional value and whether they prefer the most nutritious. A feeding trial in which rabbits<br />
(Oryctolagus cuniculus L.) were offered two different types of grasses (fertilised and<br />
unfertilised) was executed un<strong>de</strong>r experimental conditions. The rabbits preferred the grasses<br />
with the highest protein percentage, when controlling for sward heigh{plant biomass. This<br />
observation is equivalent to results obtained in geese and provi<strong>de</strong>s o
Introduction<br />
predicting the impact of herbivores on their environment requires insight into the<br />
criteria by which grazers select food patches. The mechanism of functional response<br />
(reviewed in CnnwLry, 1983) predicts herbivores to prefer patches with the highest biomass<br />
and plant size (LUnoaenc, 1988; GROSS ef al., 1993), in or<strong>de</strong>r to obtain as much forage as<br />
possible in a given time period. However, some studies evi<strong>de</strong>nced that medium-sized<br />
herbivores, such as rabbits (Oryctotagus cuniculus L.) and geese, prefer rather swards of<br />
intermediate height (Orr et al., 1997; WILMSHURST et al., 2000i HA5SALL ef a/., 2001; Inson<br />
et al., 2002; BAKKER et al., 2OO5). Several explanations for this phenomenon have been<br />
mentioned. IAsoN ef at. (2002) and Vau DE KoppEL et al. (1996) suggested that rabbits and<br />
hares, Lepus europaeus (Pnr-r-nS), prefer vegetation with medium standing crop swards<br />
because predators are most likely to occur in the cover offering higher vegetation. Moreover,<br />
a tall sward is more difficult to handle for medium-sized animals. A dislike for tall swards by<br />
brent geese, Branta bernicla bernicla (L.), and barnacle geese, Branta leucopsis (Brcnsrern)'<br />
was explained by the larger costs of handling, more difficult locomotion, and <strong>de</strong>creased<br />
predator <strong>de</strong>tection in the taller vegetation (vnru oen GR/dF et a1.,2002)'<br />
However, preference for shofter swards may also be related to their higher food<br />
quality: grazing creates fastly growing and nutritionally-rich vegetation (so called 'grazing<br />
lawns', MCNAUGHTON, 1984), due to plant compensatory mechanisms operating after<br />
<strong>de</strong>foliation (Mnrrson, 1980; MCNAUGHToN, 1983). Large herbivores need a larger plant<br />
biomass, but can tolerate low plant quality, while smaller herbivores can persist on small<br />
quantities of food on the condition that the plants are of high nutritional quality (OLFF ef a/.,<br />
2002). Medium-sized hindgut fermenters (e.g. the rabbit) <strong>de</strong>pend on highly digestible forage<br />
because they have high metabolic requirements and their digestive system is very small<br />
(DEMMENT & VAN SoEsr, 1985). The creation of grazing lawns by large herbivores may hence<br />
result in 'feeding facilitation' (AR5ENAULT & OwEN-SMrrH, 20OZ) benefiting smaller grazers.<br />
Hunger may strengthen this preference for nutritionally-rich forage (CMWLEY, 1983)'<br />
The wild rabbit is consi<strong>de</strong>red to have a preference for shofter swards. For example,<br />
MoRENo & VTLLAFUERTE (1995) noticed that rabbit grazing pressure was higher in fresh, re-<br />
growing vegetation (after burning). Being a central-place forager (Scnorruen, 1979), foraging<br />
of this herbivore is concentrated in the neighbourhood of the burrow (Drrxrn, 2007), less<br />
than 20 m from cover (Monrruo & VrLLAFUEnre, 1995). With increasing distance from the<br />
burrow, grazing pressure of rabbits gradually <strong>de</strong>creases, causing a gradient pattern'<br />
Consequently, vegetation height increases and nitrogen concentration of forage <strong>de</strong>creases,<br />
Diet preference of rabbits<br />
101
due to repeated grazing of the rabbits, stimulating fresh regroMh (BAKKER et al., 2005).<br />
BAKKER et a/. (2005) conclu<strong>de</strong> that the grazing pattern has to be explained by food quality.<br />
Univocal discrimination of factors <strong>de</strong>termining feeding preferences is only possible in<br />
strictly controlled choice experiments (so-called 'cafeteria-trials'; CMWLEy, 19g3).<br />
Experimentally enhancing food quality in field experiments by fertilisation increases both<br />
biomass (Batt et a/.,2000) and plant height. Moreover, feeding preferences are very difficult<br />
to measure in the field (CRnwlev, 1983). For these reasons, we conducted a laboratory<br />
experiment to test the ability of rabbits to discriminate between grasses of low and high<br />
nutritional quality, while controlling for sward height or vegetation biomass. We predicted<br />
that rabbits would prefer grasses of the highest forage quality either when offered grass<br />
swards of comparable height or cut grasses of the same biomass.<br />
Materials and methods<br />
Study species<br />
Twelve domestic rabbits (six males and six females, all between 1 and 3 years old) of<br />
the breed 'Steenkonijn'were used. The Steenkonijn is the ol<strong>de</strong>st Belgian rabbit breed, and is<br />
most closely related to the wild rabbit (WrnrueR, 1980). Therefore, the behaviour of these<br />
animals is supposed to be comparable to the behaviour of their wild ancestor. The rabbits<br />
were housed in wire mesh pens (65 cm x 110 cm, height: 60 cm) such that each individual<br />
could see a single other individual. This allowed social contact between the animals (Durucaru<br />
et al., 2006)' A vaccination against myxomatosis and viral haemorrhagic syndrome was<br />
administered. All the individuals received water ad libitum, and were fed with a mixture of<br />
commercial rabbit pellets and grains (Bonito 96, Aveve, Belgium). From the first day of the<br />
feeding trials, the pellet feeding was discontinued, so that the rabbits <strong>de</strong>pen<strong>de</strong>d for their<br />
feeding on the experimental plants, supplemented with straw that was provi<strong>de</strong>d in the pens.<br />
We used Festuca rubraas forage in all trials. Festuca rubraplants were grown from<br />
seeds (Herbiseed, Twyford, England), sown on a mixture of 50o/o dune sand and 50o/o<br />
potting soil, in seed trays of 40 cm by 45 cm during July - October 2O04.Immediately after<br />
sowing, halve of the seed trays (selected at random) received 30 g of organic fertiliser (8olo<br />
nitrogen, 6% phosphorus, 7o/o potassium, 3olo magn€sium and 3g% organic matter), further<br />
referred to as'fertilised plants' (F+). All trays received an inorganic fertiliser twice (once one<br />
month after sowing and once in March 2005). The 'fertilised plants, received 7.5 g of<br />
r02 Chapter 4
inorganic feftiliser (20olo nitrogen, 5o/o phosphorus and 8olo potassium) at a time; the<br />
'unfeftilised plants'(F-) received 2.5 I at a time.<br />
The trays were put insi<strong>de</strong> the greenhouse immediately after sowing, and were<br />
watered every two days. From December 2004 until March 2005, the trays were put outsi<strong>de</strong><br />
for better aeration. Fungici<strong>de</strong> (sulphur) was ad<strong>de</strong>d twice to cope with a mil<strong>de</strong>w infection, and<br />
an infection of aphids was treated by using a mix of piperonylbutoxi<strong>de</strong> and pyrethrine.<br />
Experimental <strong>de</strong>sign<br />
The feeding trial took place in an experimental pen (Figure 1) of 104 cm <strong>de</strong>pth, 91<br />
cm width and 73 cm height, connected to a smaller pen (36 cm by 26 cm by 30 cm) from<br />
which the rabbit was not able to see the surroundings. Two grass swards (trimmed just<br />
before the start of the trial to an height of 13 cm (further called short swards fS)) or of 33<br />
cm (tall swards CT))) or two dishes with clipped grass (100 g per dish) were put in the<br />
larger pen, on the opposite si<strong>de</strong> of the entrance from the small pen. A partition of 40 cm<br />
high (in the middle between the two swards or dishes) divi<strong>de</strong>d the large pen into two halves.<br />
J<br />
Sward/Dish ET Sward/Dish<br />
l,€ft nM Right<br />
posiUon Eld Posnion<br />
26cm<br />
Figure 1: Design of the experimental pen'<br />
Diet preference of rabbiE<br />
Ir,<br />
cn<br />
e}<br />
3<br />
Helght of<br />
large pen:<br />
73cm<br />
Height af<br />
partition:<br />
4{lcm<br />
Height of<br />
small p€n:<br />
3(hn<br />
103
In the sward trial (22-29 April 2005), there were four groups of three rabbits and two<br />
treatments (two combinations of swards): F+T versus F-T and F+S versus F-S. Each two<br />
groups of rabbits received the treatments in a different or<strong>de</strong>r. This total <strong>de</strong>sign was<br />
replicated once, but with a reverse of the left-hand and the right-hand sward. During the<br />
clipping trial (2-5 May 2005), the rabbits received dishes with clipped fertilised grass on one<br />
si<strong>de</strong> of the pen, and unfeftilised grass on the other si<strong>de</strong> (F+ versus F-). In the replicate of<br />
the clipping trial, the position of F+ and F- was reversed. Since the <strong>de</strong>sign was randomized<br />
and fully balanced, possible effects of the or<strong>de</strong>r of treatments were minimized.<br />
Before the start of the feeding trial, four learning days were organised: the rabbits<br />
were placed in the pen to habituate to the pen, the grass and the observer. Research carried<br />
out with ruminants shows that food preferences <strong>de</strong>velop because of the exoerience of<br />
postingestive effects (satiety or malaise) and their interaction with the senses of mainly taste<br />
and smell (PRoVENZA, 1995). Herbivores learn about grass quality through foraging<br />
consequences, which they link with preingestive cues necessary to recognize the value of the<br />
forage (GIruaruE et a1.,2005). Although this was only evi<strong>de</strong>nced for ruminants, it is reasonable<br />
to assume that ruminants and non-ruminants do not differ in the non-cognitive aspects of<br />
how feedback is processed (Pnovrnzn, 1995). Non-ruminants have in<strong>de</strong>ed been found to be<br />
able to discriminate between foods, even when the differences are relatively small (posr,<br />
1993). This means that the rabbits were only able to select the most nutritious food if they<br />
had the opportunity to experience the differences in postingestive effects between F+ and F-<br />
grasses. This condition was fulfilled through the learning days preceding the experiment.<br />
At the start of each experimental session, the individual was weighed (to estimate its<br />
body condition) and placed in the small pen. When the entrance to the experimental pen<br />
was opened and the rabbit approached the feeding trays, we started an observation session<br />
of 20 minutes, from a central point which did not intefere with the experiment. A <strong>de</strong>tailed<br />
<strong>de</strong>scription of the foraging behaviour of the rabbit was noted.<br />
Forage quality analysis<br />
After each session, plant material that had not been consumed was removed from<br />
the pen and dried at 60oC (WTB Bin<strong>de</strong>r with controller RD 2 EED/FED (Bin<strong>de</strong>r, Tuttlingen,<br />
Germany)), until no more mass loss was <strong>de</strong>tected, after which the dried plants were grin<strong>de</strong>d.<br />
The percentage of cru<strong>de</strong> protein (CP) and of cell wall constituents (cellulose, hemicellulose<br />
and lignin, which were <strong>de</strong>rived from NDF (neutral <strong>de</strong>tergent fibre), ADF (acid <strong>de</strong>tergent<br />
fibre) and ADL (acid <strong>de</strong>tergent lignin)) were obtained by Near Infrared Spectroscopy (NIRS -<br />
104 Chapter 4
for more information see GwEr'rs et al. (L997)), A FOSS Feed and Forage Analyzer was used,<br />
combined with Winisi softrrrrare (FOSS, Brussels, Belgium). The calibration for the NIRS was<br />
carried out by performing wet analyses for approximately 10o/o of the samples, following the<br />
method of Kjeldahl for CP and following the protocols of Goerunc & VAN SoEsr (1970) and<br />
VAN SoEsr et al. (1991) for cell wall constituents.<br />
The amount of digestible protein (DP) was calculated by multiplying CP with the<br />
mean digestibility coefficient of CP in grasses (value of 0.70; MAFF, 1986). DE (Digestible<br />
Energy) was calculated based on ADF, by multiplying GE (Gross Energy, value based on<br />
MAFF (1986)) by GEo (coefficient of digestibility of Gross Energy, in which GEo is <strong>de</strong>fined as<br />
follows: GEe = 9.367 - 0.0012 ADF (g/kg DM) (DE BIAS et al., L992)'<br />
Statistial analysis<br />
The feeding preference of rabbits for different types of grasses was tested by Mixed<br />
Linear Mo<strong>de</strong>ls, with TNDMDUAL as random effect and "relative foraging time" as <strong>de</strong>pen<strong>de</strong>nt<br />
variable. This last variable was calculated by timing individual feeding bouts per sward or<br />
dish, stafting from the moment when the experimental individual had tasted from either both<br />
swards or both dishes until the end of the session, divi<strong>de</strong>d by the total time left until the end<br />
of the session, As vegetation height or biomass were controlled for, differences in handling<br />
time were not expected, so that the relative foraging time can be consi<strong>de</strong>red a good<br />
measure for intake rate. Fufthermore, the level of satiety after eating (PRovENzA, 1995;<br />
GTNANE et al., 2005) will have been higher for the more nutritious grasses. Since mammals<br />
learn to link the taste of the forage to the satiety level, directed foraging behaviour can only<br />
staft from the moment they have tasted both grasses. Therefore, the relative foraging time,<br />
as <strong>de</strong>fined above, is the most appropriate measure <strong>de</strong>scribing their preference'<br />
Four in<strong>de</strong>pen<strong>de</strong>nt categorical variables were inclu<strong>de</strong>d in the mo<strong>de</strong>l: FERTILISATIoN<br />
(0/l), eosmoN oF rHE swARD oR DrsH (left or right), oRY and sEX. We started with a full mo<strong>de</strong>l<br />
including all two-factor and higher-or<strong>de</strong>r interactions and applied a backward stepwise<br />
selection procedure.<br />
The effect of rrnnusenon on forage quality was analysed by a General Linear Mo<strong>de</strong>l.<br />
We tested the effect of fertilisation as a categorical variable separately on the percentages of<br />
Cp, cellulose, hemicellulose, lignin, DP and DE. Mixed regression analysis mo<strong>de</strong>lling repeated<br />
measurements at individual level was used to examine shifls in weight during the feeding<br />
trials.<br />
Diet preference of rabbits<br />
10s
Carolina).<br />
Results<br />
All statistical analyses were performed using sAS 9.1 (sAS Institute Inc., cary, North<br />
Table 1 summarizes the effect of feftilisation, day, sex and the position of the sward<br />
or dish (and all possible interaction terms) on the relative foraging time. Fertilised swards<br />
and dishes were preferred over unfertilised ones, as can be seen in Figure 2: the mean of<br />
the refative foraging time was lower for F-plants (sward trial: mean = 20.02o/o + 3.31 SE, N<br />
= 48; clipping trial: mean = 18.25 r4.74o/o, N = 24) than for F+plants (sward trial: mean =<br />
3L26 + 3.3to/o, N = 48; clipping trial: mean = 37.I3 *. 4.74o/o, N = 2a).<br />
F<br />
o)<br />
.E<br />
C)<br />
G)<br />
c<br />
c<br />
o<br />
q)<br />
tr Unfertilised plants (F-)<br />
I Fertilised plants (F+)<br />
Fioure 2: Mean and standard error of the relative foraging time of rabbits, when offered the choice<br />
between fertilised and unfertilised grasses, controlling for sward height (sward trial) or plant biomass<br />
(clipping trial). The relative foraging time was calculated by timing individual feeding bouts per sward<br />
or dish, starting from the moment when the experimental individual had tasted from either both<br />
swards or both dishes until the end of the session, divi<strong>de</strong>d by the total time left until the end of the<br />
session.<br />
Sward trial Clipping trial<br />
106 Chapter 4
Sward<br />
trial Fertilisation(F)<br />
Day (D)<br />
Position grass (P)<br />
Sex (S)<br />
F*P<br />
P*D<br />
DXS<br />
F*S<br />
P*S<br />
F*D<br />
Clipping<br />
trial<br />
FXPXD<br />
F*DXS<br />
P*D*S<br />
FXP*S<br />
Individual<br />
IFertilisation (F)<br />
Sex (S)<br />
Day (D)<br />
Position grass (P)<br />
F*S<br />
D*S<br />
P*D<br />
P*S<br />
F*D<br />
F*P<br />
F*D*S<br />
F*PXD<br />
P*DXS<br />
F*PXS<br />
FxP*DxS<br />
Individual<br />
1<br />
7<br />
1<br />
1<br />
1<br />
7<br />
7<br />
1<br />
1<br />
3<br />
3<br />
7<br />
3<br />
1<br />
3<br />
1<br />
1<br />
I 1<br />
1<br />
1<br />
1<br />
1<br />
94<br />
87<br />
86<br />
85<br />
84<br />
77<br />
70<br />
69<br />
68<br />
65<br />
62<br />
55<br />
52<br />
51<br />
525.03<br />
E46 45<br />
44<br />
43<br />
42<br />
4L<br />
40<br />
39<br />
38<br />
37<br />
36<br />
35<br />
34<br />
33<br />
32<br />
I633.67 5.74 0.02<br />
r.2t 0.3<br />
0.84 0.36<br />
0.35 0.s6<br />
0.8s 0.36<br />
1.05 0.4<br />
0.9 0.51<br />
0.3 0.59<br />
0.02 0.89<br />
0.19 0.9<br />
1.72 0.17<br />
1.08 0.39<br />
0.29 0.83<br />
0.03 0.87<br />
0.87<br />
7.86 0.01<br />
3.45 0.07<br />
0.08 0.78<br />
0 0.97<br />
2.97 0.09<br />
0.3 0.59<br />
0.26 0.61<br />
0.22 o.ffi<br />
0.2 0.66<br />
0.04 0.85<br />
0.98 0.33<br />
0.21 0.65<br />
0.1 0.76<br />
0.04 0.85<br />
0.13 0.72<br />
Table l: Results of the Mjxed Linear Mo<strong>de</strong>l testing for the effect of the four main factors (fertilisation'<br />
position, day and se>
the gward trial as in the clipping trial. In the clipping trial, also the hemicellulose percentage<br />
was higher in the F+plants, while the lignin percentage was lower in these plants. The value<br />
of digestible protein percentage was significantly higher in the F+plants, compared to the F-<br />
plants' This applied to the sward trial as well as to the clipping trial. Also, the DE percentage<br />
differed significantly between F+ and F-plants, with a higher DE percentage in F-planb, in<br />
the sward trial, but not in the clipping trial.<br />
The effect of day on the relative foraging time was not significant, although the<br />
rabbits lost weight during the trials. These losses were statistically significant in both trials<br />
(sward trial: fis1= 519.51, estimate for time effect = -22.74, p < 0.001; clipping trial: Ft. tt.t<br />
= 7.11, estimate for time effect = -18.50, p = 0.02).<br />
Sward trial<br />
CP f/o)<br />
Cellulose (o/o)<br />
Hemicellulose (o/o)<br />
Lignin (o/o)<br />
DP (o/o)<br />
Clipping trial<br />
cP (%)<br />
Cellulose (o/o)<br />
Hemicellulose (o/o)<br />
Lignin (o/o)<br />
DP (o/o)<br />
Table 2: Resuhs of the General Linear Mo<strong>de</strong>l testing for the effect of fertilisation on forage quality<br />
measures of standing crop (sward trial) and clipped grass material (clipping trial). F-plants =<br />
unfertilised plants, F+plants = fertilised plants. CP = o/o Cru<strong>de</strong> Protein , DP = o/o Digestible protein, DE<br />
= Digestible Energy (MJ per kg dry matter). Num d.f. = numerator <strong>de</strong>grees of freedom, <strong>de</strong>n d.f. =<br />
<strong>de</strong>nominator <strong>de</strong>grees of freedom.<br />
Discussion<br />
1<br />
I<br />
1<br />
1<br />
1<br />
I<br />
1<br />
1<br />
I<br />
1<br />
1<br />
1<br />
94<br />
94<br />
94<br />
94<br />
94<br />
94<br />
46<br />
46<br />
46<br />
46<br />
46<br />
46<br />
60.95 < 0.001<br />
19.99 < O.OOI<br />
0.2r 0.65<br />
0.36 0.5s<br />
60.95 < O.OOI<br />
57.65 < 0.OO1<br />
10.32 < 0.001<br />
17.22
This was to be expected, since nitrogen is a principal component of the used fertilisers and<br />
its concentration is strongly related to protein concentration. We also observed a higher<br />
percentage of cellulose and hemicellulose, although the latter only in the F+plants from the<br />
clipping trial, in which lignin <strong>de</strong>creased. As forage quality is believed to be enhanced by the<br />
protein level (LnrucvarN & HANLEY, 1993) and to be diminished by the fibre concentration<br />
(OLFF ef al., 1997), the question raises whether fertilisation effectively resulted in a higher<br />
food quality. Moreover, in the sward trial, the F+plants even had a lower digestible energy<br />
content. However, it is reasonable to assume that the increase of digestible protein is the<br />
most important factor <strong>de</strong>termining forage quality. Since some amino acids cannot be<br />
synthesized by the animal's body itself, animals need amino acids, immediately available<br />
from the forage to maintain body conditions constant (Fnnen, 1998). The close agreement<br />
between the sum of individual amino acids levels in the body of the rabbit and the CP<br />
concentration (FMGA, 1998), indicates that CP concentration provi<strong>de</strong>s a good estimate of<br />
forage quality. We can hence conclu<strong>de</strong> that the rabbits selected the forage with the highest<br />
nutritional quality.<br />
This preference for high quality forage has been suggested for rabbits (KUDPER ef a/',<br />
2004; ROoa, 2005) and also for other relatively small mammal herbivores, e'9. small<br />
ruminants (WrLMsHURsr et al.,2OO0) and mountain hares (Lepus timidus L.) (LINDLOF ef a/.,<br />
1974). However, studies eliminating the correlation between forage quality and sward<br />
heighVbiomass are scarce. Therefore, it is difficult to know whether the animals are really<br />
able to select for the higher nitrogen concentration, or whether this selection is just<br />
coinci<strong>de</strong>ntal related to the selection of swards with medium standing crop' Some studies<br />
concerning geese (HnsseLL et al.,2001; Bos et al., 2002; HASSALL & Lal{E, 2005) showed the<br />
capability of these birds to discriminate between high and low quality forage, by eliminating<br />
the relationship between forage quality and sward height. BAKKER et al' (2005) executed a<br />
field experiment which eliminated the relationship between distance from the rabbit burrow<br />
and forage quality, and showed that forage of a higher quality is preferred, even when<br />
farther from the burrow (and thus with a higher sward height). However, the highest (and<br />
farthest) swards in this trial were on average approximately as high as the short swards in<br />
our study. Therefore, it is possible that sward height in their trial did not show enough<br />
variation to really affect the rabbit behaviour. However, their results are confirmed by the<br />
results of the present study, controlling for plant height and biomass, which clearly indicate<br />
that plant quality, particularly nitrogen and related protein concentration, is a crucial factor<br />
for selecting foraging patches in rabbits.<br />
Diet preference of rabbits<br />
109
The other factors inclu<strong>de</strong>d in the mo<strong>de</strong>l (position of the sward or dish,<br />
experimental day and sex) did not significantly influence the food preference of the rabbits.<br />
The day of feeding was of no importance, although CMWLEv (1983) mentions that a hungry<br />
animal will be more selective. Since the animals lost weight during the experiments, it could<br />
be expected that the animals would become more selective towards the end of the<br />
experiment, but this was not confirmed. Similar results were obtained by DuNcAN ef a/.<br />
(2006) who found no evi<strong>de</strong>nce that nutritional plane had an overall effect on the proportion<br />
of several plant species eaten during preference tests carried out with herbivores. The<br />
authors relate this to the more extreme forage <strong>de</strong>ficits in the wild. Similar|y, the scarcity of<br />
food during winter time in the temperate regions will cause stronger feelings of hunger than<br />
the rabbits in our experiment experienced.<br />
Although we evi<strong>de</strong>nced that food quality is impoftant for <strong>de</strong>termining preferences, we<br />
were not able to exclu<strong>de</strong> the importance of antipredation consi<strong>de</strong>rations and other sward<br />
height related issues in diet selection (see also Chapter 3): other factors, besi<strong>de</strong>s nutrient<br />
concentration, may also have played a role during the <strong>de</strong>cision process of the rabbits. Other<br />
research in<strong>de</strong>ed showed that rabbits also choose the swards with the lowest biomass, when<br />
there are no nutritional differences between the swards of different heights (Iasoru ef a/.,<br />
2002). However, the field experiment of BAKKER et al. (2005) <strong>de</strong>monstrates that the presence<br />
of predators causes a shift in the moment of feeding, but does not affect patch preferences.<br />
The presented results clearly showed that nutritional content plays an important role in the<br />
observed preference of medium-sized herbivores for swards of intermediate size, but fufther<br />
research is nee<strong>de</strong>d to unravel the relative importance of other potentially contributing<br />
factors.<br />
Acknowledgements<br />
We thank VLIZ and AWZ-WWK for the use of their infrastructure. We are grateful to INBO and ILVO<br />
for grinding and analyses of plant material. Invaluable technical support was provi<strong>de</strong>d by Frank<br />
Broucke (VUZ), ward vercruysse (INBO), wim De Bel<strong>de</strong>r (INBo) and Maarten pevenage. Luc<br />
Maertens (ILVO) provi<strong>de</strong>d interesting information and literature on rabbit feeding trials and feed<br />
quality for rabbits. We also thank Chris Van Waes (ILVO) for the information on the plant analysis<br />
procedure. The first author is granted by the Research Foundation - Flan<strong>de</strong>rs (Aspirant of the FWO-<br />
Vlaan<strong>de</strong>ren).<br />
110 Chapter 4
References<br />
ARSENAULT, R. & N. OWEN-SMnH (2002). Facilitation versus competition in grazing herbivore<br />
assemblages. Oikos 97 : 313-318.<br />
BAKKER, E.S., R.C. RETFFERS, H. OrFF & J.M. GurcHuAN (2005). Experimental manipulation of predation<br />
risk and food quality: effect on grazing behaviour in a central-place foraging herbivore.<br />
Oecologia 146: 157 -167 .<br />
Bnu-, J.p., K. DANELL & P. Sur,lesson (2000). Response of a herbivore community to increased food<br />
quality and quantity: an experiment with nitrogen fertilizer in a boreal fore*' Journal of Applied<br />
Ecology3T'. 247-255.<br />
Bos, D., R. DRENT, M. RUBTNTGG & l. SrnHl (2002). The relative importance of food biomass and quality<br />
for oatch and habitat choice in Brent Geese. In Bos, D., Grazing in coastal grasslands, Brent<br />
Geese and facilitation by herbivory, PhD dissertation, Rijksuniversiteit Groningen, Groningen, the<br />
Netherlands: 23-41.<br />
CMWLry, M.J. (1983). Herbivory. The dynamics of animal-plant-interactions. Blackwell Scientific<br />
Publications, Oxford, Great Britain'<br />
DE BLA5, C., J. Wrseprnru, M.J. FMGA & M.J. VTLLAMIDE (1992). Prediction of the digestible energy and<br />
digestibility of gross energy of feeds for rabbits. 2. Mixed diets. Animal ftd Science and<br />
Technology39: 39-59.<br />
DEKKER, J.l.A. (2007). Rabbits, refuges and resources. How foraging of herbivores is affected by living<br />
in burrows. PhD disseftation, wageningen Universiteit, wageningen, the Netherlands.<br />
DEMMENT, M.W. & P.J. Veru SoEsr (1985). A nutritional explanation for body-size patterns of ruminant<br />
and nonruminant herbivores. The American Naturalist I25'- 64L-672.<br />
DuNcAN, A.J., C. GTNANE, D.A. ELsroN, A. KuNAVER & LJ. GoRDoN (2006). How do herbivores tra<strong>de</strong>-off the<br />
positive and negative consequences of diet selection <strong>de</strong>cisions? Animal BehaviourTl'. 93-99.<br />
FMGA, M.J. (1998). Protein requirements. In oe BLns, C. & J. WISEMATTT J (eds), The nutrition of the<br />
rabbit, CABI Publishing, Wallingford, UK: 133-143.<br />
GTNANE, C., A.J. DuNcAN, S.A. Your'tc, D.A. ELsroN & I.l. GoRDoN (2005). Herbivore diet selection in<br />
response to simulated variation in nutrient rewards and plant secondary compounds. Animal<br />
Behaviour 69: 541-550.<br />
GrvENS, D.I., J.L. DE BoEVER & E.R. DEAVTLLE (1997). The principles, practices and some future<br />
applications of near infrared spectroscopy for predicting the nutritive value of foods for animals<br />
and humans. Nutrition Research Reviews 10: 83-114'<br />
GoERTNG, H.K. & p.J. VAN SoEsr (1970). Forage Fibre Analysis (Apparatus, Reagents, Procedures, and<br />
Some Applications). Agricultural Handbook No. 379, Agricultural Research Service, United States<br />
Department of Agriculture.<br />
GRoss, J.E., L.A. SHrpLEy, N.T. HoBBs, D.E. SPAuNGER & B.A. WUNDER (1993). Functional response of<br />
herbivores in food-concentrated patches: tests of a mechanistic mo<strong>de</strong>l. EcobgyT4:778-791'<br />
HA55ALL, M. & S.J. LANE (2005). Partial feeding preferences and the profitability of winter-feeding sites<br />
Diet preference of rabbits<br />
111
for brent gerc*. tusic and Applied Ecotogy6: 559-570.<br />
HASSALL, M., R. RIDDINGToN &A. HELDEN (2001). Foraging behaviour of brent ger-xr-., Branta b. bernicla,<br />
on grasslands: effects of sward length and nitrogen content. @otogia 127 97-L04.<br />
LAsot'1, G'R., T. MANso, D.A. SIM & F.G. HARTLEY (2002). The functional response does not predict the<br />
local distribution of European Rabbits (Oryctotagus cunicutus) on grass swards: experimental<br />
evi<strong>de</strong>nce. Fundional Ecology 16: 394-402.<br />
KUDPER, D.P'J., S.E. vAN WIEREN & J.P. Bnxren (2004). Digestive strategies in two sympatrically<br />
occurring lagomorphs. Joumal of Zmlogy264: l7L-I79.<br />
I-ANGVATN, R. & T.A. Hnrur-ev (1993). Feeding-patch choice by red <strong>de</strong>er in relation to foraging efficiency.<br />
An experiment. Orologia 95: L64-170.<br />
Ltruolor, 8., E. lrnosrnov & A. PrnesoN (1974). Nutrient content in relation to food preferred by<br />
mountain hare. Journal of Wldlife Management3g: 875-g79.<br />
LUNDBERG, P. (1988). Functional response of a small mammalian herbivore: the disc equation revisited.<br />
lournal of Animal Ecolryy 57: 999-1006.<br />
MAFF (1986). Feed Composition - UK Tables of Feed Composition and Nutritive Value of Ruminants.<br />
Chalcombe Publications, Marlow, Bucks, UK.<br />
MArrsoN, W.J. (1980). Herbivory in relation to plant nitrogen content. Annual Review of Ecology and<br />
Systematio LI: I 19-161.<br />
MCNAUGHToN, S.J. (1983). Compensatory plant growth as a response to herbivory. Oikos40:329-336.<br />
MCNAUGHToN, S.J. (1984). Grazing lawns: animals in herds, plant form and co-evolution. TheAmerian<br />
Na tu ra I ist L24 :863 -886.<br />
MoRENo, S. & R. Vttrmuenre (1995). Traditional management of scrubland for the conservation of<br />
rabbits Oryctolagus cuniculus and their predators in Dofiana National par( Spain. Biological<br />
ConseruationT3: 81-85.<br />
oLFF, H., J. DE LEEUW, J.P. BAKKER, R.J. PLATEPJNK, H.J. vAN wuNEN & w. DE MuNcK (1997). vegetation<br />
succession and herbivory in a salt marsh: changes induced by sea level rise and silt <strong>de</strong>Dosition<br />
afong an elevational gradient. Journal ofEcologyg5: 799-g14.<br />
OLFF, H., M'E. RrrcHIE & H.H.T. PRINS (2002). Global environmental controls of diversity in large<br />
herbivores. Nature 4L5: 901-904.<br />
Posr, D.M. (1993). Detection of differences in nutrient concentrations by eastern woodrats (Neotoma<br />
floridana). Journal of MammalogyT4: 493497.<br />
PRovENzA, F.D. (1995). Postingestive feedback as an elementary <strong>de</strong>terminant of food preference and<br />
intake in ruminants. Journal of Range Management 48:: 2-I7.<br />
RoDEL, H.G. (2005). winter feeding behaviour of European rabbits in a temperate zone habitat.<br />
Mammalian Biology/Zei&hrift Ftjr Sdugetierkun<strong>de</strong> 70: 300-306.<br />
SCHoENER, T.W. (1979). Generality of the size-distance relation in mo<strong>de</strong>ls of optimal foraging. The<br />
Ameri@n Naturalist LL4: 9OZ-914.<br />
vAN DE KoppEL, J., J. Hursum, R. vAN DER wAL & H. olrr (1996). patterns of herbivory along a<br />
productivity gradient: an empirical and theoretical investigation. EcologyTT:736-745.<br />
ll2 onpter 4
vAN DER GRAAF, AJ., D. Bos, M.J.J.E. LooNEN, M. EtcrwoEn & R.H. DREMr (2002). Short and long-term<br />
facilitation of goose grazing by livestock In Bos, D., Grazing in coastal grasslands, Brent Geese<br />
and facilitation by herbivory PhD dissertation, Rijksunivesiteit Groningen, Groningen, the<br />
Nefierlands: 63-83.<br />
Vrul Soesr, P.J., l.B. RoBERrsoN & B.A. l-etms (1991). Methods for Dietary Fibre, NzuFal Detergent Fibre,<br />
and Nonstardr Folpdnri<strong>de</strong>s in Relation to Animal Nutrition. -bumal of hiry9isre74:3fi3-<br />
3597.<br />
WERNE& B.J. (1980). Vezorgingsgids Konijnen. Grote-, mid<strong>de</strong>n-, l<strong>de</strong>ine- en dwergrren. Zuklgroep B.V.<br />
UiQevers, Best.<br />
WrLilsHupsr, J.F., J.M. FR\rcLr & C.M. Bencum (2000). The allometry of patch selection in ruminants.<br />
Mirys of the Royal Wy of London, *ris 8267: 345-349.<br />
Aetprcfveneof nbbib 113
Growing plants, 2003<br />
(Photograph by N. tumerc)<br />
114<br />
Feeding trial, 2003<br />
(Photograph by N. Somerc)<br />
Epi<strong>de</strong>rmal fragment of<br />
fusfitca rubra<br />
(Photqraph by K. De Maeyer)
CHAPTER 5<br />
1522!,2<br />
The <strong>de</strong>termination of the diet of rabbits<br />
(Oryctola g us cu n icu I us L.)<br />
using micrchistological faecal analysis:<br />
an experimental evaluation<br />
Nele Somers, Beafijs Bossuyt, Luc Lens & Maurice Hofrnann<br />
115
Abstract<br />
Microhistological faecal analysis to assess the diet of herbivores is a wi<strong>de</strong>ly used method: the<br />
diet of the herbivore is qualified and quantified by i<strong>de</strong>ntifying plant epi<strong>de</strong>rmal fragments<br />
which can be found in the pellets of this animal. The method has several advantages, but<br />
some limitations have been mentioned in the past. A clear consensus on the accuracy of this<br />
technique is lacking. So we peformed a feeding trialwith rabbits (Oryctolagus cuniculusL.)<br />
to compare the known diet with the results obtained by faecal analysis. The main goal of the<br />
study was to find out whether the diet composition can be reliably <strong>de</strong>rived from faecal<br />
analysis (<strong>de</strong>spite problems of differential digestion). Therefore, we also <strong>de</strong>termined the<br />
number of i<strong>de</strong>ntified fragments which is necessary to obtain a good result and investigated<br />
whether the best quantification of the diet is originating from fragment counts or from<br />
fragment area measurements. It is conclu<strong>de</strong>d that only the composition of grass diets can be<br />
estimated from pellet analyses, due to a higher digestion intensity of forbs. We recommend<br />
the i<strong>de</strong>ntification of 150 epi<strong>de</strong>rmal fragments and quantification by area measurements.<br />
Fufther research is nee<strong>de</strong>d to <strong>de</strong>velop new, more reliable methods to <strong>de</strong>termine the diet<br />
composition of wiH grazers more accurately.<br />
116 Chapter 5
Introduction<br />
Microhistological faecal analysis has been wi<strong>de</strong>ly used for <strong>de</strong>termining the diet<br />
composition of wild herbivores (e.g. Wtlunus et al., 1974; PLTTMAN, 1984; DE JONG ef a/',<br />
1995; TREyDTE et a1.,2006; YOSHTHAM ef al., 2008), including lagomorphs (e.9. Bnnonrsa,<br />
Lg77t HoMoLxn, 1982; HOMOLKA, 1987; HOMOLTA, 1988; DUFFY ef al., 1996; PUC et al.,<br />
2007). The method is based on the fact that epi<strong>de</strong>rmal plant material is preserved well<br />
during digestion, so that epi<strong>de</strong>rmal plant fragments are preserved in the stomach and the<br />
faeces. The characteristics of these fragments are different for different plant species, and so<br />
they are useful to microscopically i<strong>de</strong>ntify the plant species that have been eaten by the<br />
animal.<br />
Determining diet composition by analysing faeces has several advantages over other<br />
methods (HoucHrr et al., t982). Utilization studies (estimation of the level of utilization of<br />
plants by direct observation of living plant material) suffer from many confounding factors<br />
(e.g. trampling, weathering) and accurary is lacking. Direct observation of the animals'<br />
grazing behaviour is not accurate for wild animals that are difficult to approach. Fistula<br />
sampling is also not possible for free-living wild herbivores. Stomach analyses need<br />
sacrificing the animals. Hence, as all these methods have practical and/or accuracy<br />
fimitations, when wanting to investigate the diet of a wild rabbit (Oryctolagus cuniculus L.)<br />
population during the course of a year (see Chapter 6), microhistological faecal analysis is<br />
the most plausible option. A continuous collection of pellets can be taken from the same<br />
rabbit population without seriously disturbing them (Dust 1949). Moreover, not only<br />
qualitative data are <strong>de</strong>rived from these analyses, but most researchers also try to quantify<br />
the proportion of each plant species in the herbivore diet, mostly by counting the fragments<br />
(e.g. Durrv et al., 1996), sometimes by measuring the area of the fragments (e.g' BHADRESA,<br />
1977).<br />
However, there are a lot of studies testing the validity of the results of faecal analysis<br />
(e.g. Srrwnnr, t967; SPARKs & MALEcHEK, 1968; FREE et al., 1970; HAVSTAD & DoNART, 1978;<br />
VAVM ef al., t978; PULLIAM & NELsoN, 1979; SMIrH & SHANDRUK, 1979; VAVRA & HoLECHEK,<br />
1980; HoLECHEK & VAVM, 1981; LESuE et al., 1983; MCINNIS et al., 1983i SAMUEL & HowARD,<br />
1983; WALLAGE-DREES, 1988; ALIPAYo et al., L992; MAIA ef at., 2003) and several aspects of<br />
faecal analysis have been questioned by them.<br />
When evaluating faecal analysis, the problem of the disappearing forbs<br />
(Snuurl & HowARD, 1983) is very often encountered. It seems that forbs are often<br />
un<strong>de</strong>restimated in faecal analysis, while grasses are overestimated (e.9. VAVRA ef al., t978;<br />
Evaluation of faecal analYsis<br />
tt7
SMNH & SHANDRUK, 1979; LESUE Ct AI., 1983; MCINNIS Et AI., L983; WALLAGE-DREES, 1988).<br />
Possible causes are enumerated by SAMUEL & HowARD (1983): maybe the epi<strong>de</strong>rmis of forbs<br />
is not being separated readily from lower layer cells; forb fragments might not survive the<br />
grinding which is involved in sample preparation or sli<strong>de</strong> preparation; the proportion of forbs<br />
might also be altering during the digestion process. This last option (differential digestion<br />
between grasses and forbs) is mostly accepted as causing the disappearance of forbs, and<br />
even called an obvious shortcoming of the method (VAVM et a/., 1978), but see also Snruorns<br />
et al. (1980), HoMoLKA (1986) and ALrpAyo et a/. (L992). According to puunu & NELsoN<br />
(1979), there is also a significant higher digestibility in annual grasses than in most perennial<br />
grasses. Thus, a major questing regarding faecal analysis is whether it should rather be used<br />
as a qualitative than as a quantitative technique (Houcner & VALDEZ, 1995).<br />
A second problem associated with faecal analysis is the lack of a consensus about<br />
how many fragments have to be i<strong>de</strong>ntified before reaching a stable and accurate estimate of<br />
the diet' In his pioneering research, Du$ (1949) took a small portion of a pellet, examined<br />
the whole sli<strong>de</strong> and i<strong>de</strong>ntified all fragments encountered. Later authors used numerous<br />
methods: making five sli<strong>de</strong>s per sample and looking at 20 locations per sli<strong>de</strong> where each<br />
species was i<strong>de</strong>ntified (spARKS & MeLecner, 1969; FREE et a/., r97o), 500 fragments per<br />
sample (AupAyo et al., L992), making 3 sli<strong>de</strong>s and using 60 fragments in total (VAVM &<br />
HoLECHEK, 1980), i<strong>de</strong>ntifying all fragments in 40 microscopic fields per sli<strong>de</strong> (VA7R et al.,<br />
1978), 100 fragments (10 sli<strong>de</strong>s) per pellet using four pellet groups (MArA ef a/., 2003),<br />
analysing 200 fragments per sample (WALLAGE-DREEs, 19gg).<br />
Third, there is some doubt whether just counting the fragmenG and calculating their<br />
frequency is a good method. VAVRA & HoLECHEK (1980) state that it becomes obvious that<br />
there is a large variation in structural breakdown of plant species during digestion. During<br />
digestion, different plant species break up into fragments that significantly differ in size<br />
(Purunru, 1984), so that counts would not be a valid means of estimating the proportions of<br />
epi<strong>de</strong>rmis ingested (Srewnnr, 1967). Estimating the proportion of plant species in the diet by<br />
measuring the area of the plant fragments could be a solution, but is used by only few<br />
authors (e.9. orJoNG ef a/., 1995).<br />
Taking into account these unceftainties about the method of microhistological faecal<br />
analysis, we <strong>de</strong>ci<strong>de</strong>d to carry out a feeding trial to evaluate and optimize the technique,<br />
before using it in our studies of the diet of wib rabbits (see Chapter 6).This was necessary<br />
as we did not encounter any research in which several plant species (as well forbs as<br />
grasses; as well annuals as perennials) were fed in a known amount, followed by faecal<br />
analysis in which several aspects of the analysis were tested simultaneously: proportions of<br />
118<br />
Chapter 5
the plants eaten were compared to the propoftion of plants in the faeces; area ancl<br />
frequency measures were compared and it was tested how many fragments have to be<br />
i<strong>de</strong>ntified before achieving a reliable result. An additional reason for doing this trial is the<br />
possibility that effects on digested material may also differ among animal species (SMrrH &<br />
SHANDRUK 1979), so animal species specific research might be nee<strong>de</strong>d.<br />
During the feeding trial, six rabbits were fed three known diets. Pellets were collected<br />
and analyzed by using microhistological analysis (including measuring the area of the<br />
fragments). The goal of the research was answering the question whether faecal analysis<br />
can be used as a reliable quantitative method to <strong>de</strong>termine the diet of the rabbit: is there a<br />
good accordance between the diets fed and the diet estimated resulting from the faecal<br />
analysis (taking into account forbs and grasses)? We tested how many fragments have to be<br />
i<strong>de</strong>ntified and taken into account before reaching a good result and whether measuring the<br />
area of the fragments offers better results than simply counting the fragments'<br />
Materials and methods<br />
Study species<br />
During the feeding trial, six domestic rabbits (three males and three females, all one<br />
year old) of the breed 'steenkonijn' were used. The Steenkonijn is the ol<strong>de</strong>st Belgian rabbit<br />
breed, and is closely related to the wild rabbit (WennrR, 1980). (Wild rabbits in captivity<br />
proved to behave very anxious and stressed. Therefore, we <strong>de</strong>ci<strong>de</strong>d to use domestic rabbits<br />
during the feeding trial.) The rabbits were housed in wire mesh pens (65cm x 110cm,<br />
height: 60cm), of which the floor was covered with sand (no straw, in or<strong>de</strong>r to prevent the<br />
rabbit to eat plant material that was not involved in the experiment). The animals received a<br />
vaccination against myxomatosis and RHD and a basic diet - a mixture of commercial rabbit<br />
pellets (Bonito 96, Aveve, Belgium) was provi<strong>de</strong>d. Water was always availabb ad libitum.<br />
Five plant species were grown in greenhouse conditions in or<strong>de</strong>r to feed them to the<br />
rabbits during the course of a feeding trial Arhenatherum elatius (perennial grass), Festua<br />
rubra (perennial grass), Poa annua (annual grass, although sometimes biennial), Galium<br />
verum (perennial forb) and Stellaria media (annual forb). All plants were grown from seeds<br />
(provi<strong>de</strong>d by Ecoflora, Halle, Belgium and Herbiseed, Twyford, England), sown on a mixture<br />
of 50% calcareous dune sand and 50o/o potting soil, in seed trays of 40cm by 45cm in May -<br />
lune 2003.<br />
Evaluation of faecal analwis<br />
119
Feeding trial and collection of the pellets<br />
In or<strong>de</strong>r to compare the known diet of the rabbits with the comoosition of their<br />
faeces, we conducted a feeding trial in which a known quantity of several plant species was<br />
fed to the animals. The rabbit pellets were collected and prepared for faecal analysis.<br />
Before the start of the experiment, the different plant species were fed to the rabbits<br />
to aflow them to get used to the plants. The feeding trial stafted on the 276 of september<br />
2003 and en<strong>de</strong>d on the 16th of October 2003.<br />
Plant material was administered to the rabbits in one of three combinations: "grass<br />
vs. forb", "perennial vs. annual" and "perennial grasses vs. annual grasses" (see Table 1).<br />
The six rabbits were subdivi<strong>de</strong>d into three groups (each consisting of one male and one<br />
female). These rabbit groups received the three plant combinations each in a different or<strong>de</strong>r<br />
during three feeding periods, each consisting of five feeding days (a latin square <strong>de</strong>sign,<br />
NFrER ef a/. (1996)). On the third feeding day of each period, all rabbit pellets were removed<br />
from the pen. on the fourth and fifth feeding day, as well as on the day after the fifth<br />
feeding day, all rabbit pellets in the individual pens were collected and frozen. Since the<br />
mean retention time of the rabbit varies between 9 and 30 hours, with an average of 19<br />
hours (see review of CnMaaNo & PIeuER (1998), we waited until the fourth feeding day<br />
before collecting the first pellets for investigation, This gave us the certainty that no other<br />
plant species, fed before the start of the feeding period, would be present in the faeces.<br />
After the last pellet collection and on the day thereafter, a mixture of 20g of all plant species<br />
was fed to the animals. After these two habituation days, a new feeding period was started.<br />
This structure was continued until the end of the third feeding period and the last pellet<br />
collection after the third feeding period. So in the end, nine pellet samples had been taken<br />
from each of the six rabbits, from which three samples originated from the same plant<br />
combination. This finally resulted in 54 samples. The mean number of pellets per rabbit and<br />
per day was 305 + 12.<br />
As mentioned before, also the animal species involved may influence the result of<br />
faecal analysis. Leporids (the wild rabbit inclu<strong>de</strong>d) are known to reingest soft faeces<br />
(caecotrophy). The soft faeces are ingested after excretion directly from the anus (HrRnrnwe,<br />
2001), so we only collected hard faeces. The two types of pellets are formed by a separation<br />
mechanism in the proximal colon, so the difference between the soft and hard faeces is not<br />
due to the food having passed once or twice (HtRnxnu, 2001), as is sometimes<br />
misinterpreted, The soft faeces mainly contain greater proportions of protein, minerals and<br />
vitamins, while the hard faeces are enriched in fibrous components (Cennenfro & plqurn,<br />
r20 Chapter 5
1998; HTMKApA, 2001). Therefore, we can suppose that the fibrous, indigestible epi<strong>de</strong>rmal<br />
plant fragments on which the method of faecal analysis is based are especially present in the<br />
hard faeces, and so we expect that caecotrophy is not likely to influence the results of faecal<br />
analysis.<br />
Amount of plants<br />
fed<br />
Amount of plants<br />
eaten effectively<br />
to and effectively eaten by six experimental rabbits.<br />
oftheplantspeciesinthethreep|antcombinationsfed<br />
The plant material was not always eaten completely by the rabbits. We collected<br />
residual plant material before feeding fresh plants to the animals, and measured the dry<br />
weight of the uneaten plants. To correct for the <strong>de</strong>siccation of the plant material, 109 of<br />
each plant species was placed each day in the neighbourhood of the pens, and weighed on<br />
the next day. By subtracting the spoiled plant weight (corrected for <strong>de</strong>siccation) from the fed<br />
plant weight, we calculated the real amount of plant material per plant species eaten by<br />
each rabbit. Per plant combination, these values were averaged over all the rabbits' From<br />
now on, we consi<strong>de</strong>r these values (see Table 1) as the plant amount eaten by the rabbits.<br />
Preparation of the faeces<br />
Plant combinations<br />
Grass vs. forb Perennial vs. annual<br />
259 Festuca rubra<br />
209 Galium verum<br />
35o Stellaria media<br />
239 Festuca rubra<br />
129 Galium verum<br />
34o Stellaria media<br />
209 Arhenatherum elatius<br />
309 Poa annua<br />
30a Stellaria media<br />
1 99 Arrhenatherum elatius<br />
299 Poa annua<br />
30o Stellaria media<br />
Perennial grasses vs.<br />
annual qrasses<br />
3 0g Arrh ena theru m elati us<br />
309 Festuca rubra<br />
30o Poa annua<br />
2 99 A rhena th erum ela tius<br />
299 Festua rubra<br />
29o Poa annua<br />
From the frozen pellets, 30 pellets per sample were selected at random to be<br />
prepared for microscopical analysis. The preparation method was based on the method<br />
foffowed by DE JoNG et al. (1995). The selected pellets were put in an autoclave (Cefto Clav<br />
Multicontrol) with some distilled water, and sterilized for five minutes at a temperature of<br />
125"C. After cooling down, the water was poured off, using a plankton screen (openings of<br />
100pm), and thereafter the pellet sample was crushed. We weighed 59 of that sample and<br />
put it in a blen<strong>de</strong>r (Waring Blen<strong>de</strong>r ll, I2O-240 volt) for being mixed during one minute in<br />
or<strong>de</strong>r to create a homogeneous pellet sample (Put-unu & NELsoN, 1979; Mrun et a1.,2003).<br />
The water was poured off using the plankton screen again and the sample was put in a small<br />
pot, filled with ethanol 70o/o and closed by a lid. The samples were conserved this way.<br />
Evaluation of faeal analysis<br />
L2l
Mbroscopical analysis of the faeces<br />
For microscopical analysis, a drop of the sample was put on a microscopic sli<strong>de</strong> and<br />
covered by a cover slip. Per sample, 30 sli<strong>de</strong>s were ma<strong>de</strong>. Each sli<strong>de</strong> was examined using a<br />
microscope (Olympus BX41) at magnification 10x10. Ten epi<strong>de</strong>rmal plant fragments where<br />
i<strong>de</strong>ntified per sli<strong>de</strong>, in at least two transects. (Particles smaller than 10;rm x 10pm were<br />
discar<strong>de</strong>d.) In total, 300 plant fragments were i<strong>de</strong>ntified per pellet sample. I<strong>de</strong>ntification of<br />
the fragments was done by comparing the fragments with reference photographs of<br />
epi<strong>de</strong>rmal fragments of the plant species administered. The reference collection was created<br />
by K. Dr MAEYER. Plant material was collected in the field; epi<strong>de</strong>rmal fragments were taken<br />
from the plants, cleared by household bleach and put on microscopic sli<strong>de</strong>s. Photographs of<br />
the fragments were taken, and the characteristics of the fragments were noted. As<br />
distinguishing between the fragments of Galium verum and Stellaria mdiawas not always<br />
possible, they were both noted as "dicot"; the same problem was encountered with Festuca<br />
rubra and Arrhenatherum elatius, therefore both noted as "perennial grassi at least in the<br />
trials where these species were fed simultaneously.<br />
The area of each plant fragment was measured and noted by using a grid of<br />
100 small squares, each square representing an area of 100pm x 100pm at the magnification<br />
used.<br />
Statistical analysis<br />
Due to technical problems, five of the 54 samples dried out completely. The analyses<br />
of these samples were left out of all statistical analyses. From these five samples, two<br />
originated from the grass-forb combination, two from the grass combination and one from<br />
the perennial-annual combination. So in total, 49 samples were taken into account for the<br />
statistical analysis. To avoid nested data, we randomised the data by using Excel: the or<strong>de</strong>r<br />
in which the fragments were encountered was not respected anymore and doubles were<br />
possible.<br />
For each plant combination, we formulated a plant species ratio (calculated either<br />
with the amount of plant species effectively eaten or with the area or frequency of the<br />
epi<strong>de</strong>rmal fragments of the plant species in the faeces). For the plant combination "grass vs.<br />
forb", we calculated the ratio of Festuca rubra (a grass) over the sum of the two dicot<br />
species Galium verum and Stellaria media. For the plant combination "perennial vs. annual",<br />
we cafculated the ratio of Arhenatherum elatius (perennial) over the sum of the two annual<br />
L22 Chapter 5
species poa annua and Stellaria media. For the plant combination "perennial grasses vs'<br />
annual grasses", we calculated the ratio of the sum of Festuca rubra and Affhenatherum<br />
elatiusover the amount of Poa annua'<br />
Chi-square analyses were performed for testing the differences (or resemblances)<br />
between the plant amounts eaten and plant quantity obtained by the faecal analysis (after<br />
examining 25, 50,..., 300 fragments). Using mixed linear mo<strong>de</strong>ls, we tested (separately for<br />
each plant combination) whether the area of epi<strong>de</strong>rmal fragments is statistically different<br />
between pLANT spEcrES. This information should be very useful in the discussion whether<br />
using frequency or area of fragments. The random factor used in the mo<strong>de</strong>l was the sEssIoN<br />
NUMBER, which is a combination of the day of pellet collection and the rabbit from which the<br />
pellets were collected. For the combination "perennial grasses vs' annual grasses", we<br />
calculated the difference between the ratio eaten and the ratio obtained by measuring<br />
fragment area on one hand, and the difference between the ratio eaten and the ratio<br />
obtained by counting fragments. This was done for 100, 150, 200, 250 and 300 fragments' A<br />
Wilcoxon Signed Rank Test was performed on these calculated values to test whether<br />
measuring area or counting fragments gives a different view of the true diet. The statistical<br />
tests were performed using sAS 9.1 (SAS Institute Inc., cary, North carolina).<br />
Results<br />
When comparing the three plant combinations, "perennial grasses vs. annual<br />
grasses" was the plant combination showing the most stable evolution (Figure 1)' The two<br />
other combinations were not very stable when consi<strong>de</strong>ring less than 100 fragments,<br />
indicating that results can still change a lot when examining extra fragments' However, when<br />
examining more than 150 fragments, the results were better, although never as stable as for<br />
the plant combination "perennial grasses vs. annual grasses".<br />
The proportion of the different plant species in the plant mixes eaten by the rabbits<br />
differed significantly from the proportion of these plants in the pellets, at least for the<br />
combinations "grass vs. forb" and "perennial vs. annual" (Table 2). For the plant combination<br />
'.perennial grasses vs. annual grasses", no significant differences were found, indicating that<br />
the amount of grass species eaten by a rabbit was well reflected by the proportion of these<br />
species in the rabbit pellets, whether observed as number of fragments or as fragment area'<br />
Evaluation of faecal analYsis<br />
r23
With randomisation<br />
= oo<br />
; 12oo<br />
? ,o.oo<br />
B<br />
oq<br />
oo<br />
o 6 8.00<br />
93<br />
oc<br />
'g oo<br />
600<br />
!" 4.00<br />
E 2oo<br />
E<br />
0.00<br />
25 50 75 ff.,":::";:'".;::*"i';*"::<br />
---a- grassjorb (area)<br />
*-C- grassjorb (frequency)<br />
---+- perr. vs. ann. grasses (area)<br />
+ perr. vs. ann. grasses (trequency)<br />
--{- perennial-annual (area)<br />
perennial-annual -+- (frequency)<br />
.. 4-. grass-torb (eaten)<br />
. -!.- perr. vs, ann. grasses (ealen)<br />
' ' l" - perennial-annual (eaten)<br />
250 275 3oo<br />
Fioure 1: The evolution of the ratio of the plant species after examining 25, s0, ...,300 epi<strong>de</strong>rmal<br />
fragments. For the plant combination "grass vs. forb', we calculated the ratio of Festuca rubra (a<br />
grass) over the sum of the two dicot species Galium verum and Stellaria media. For the plant<br />
combination "perennial vs. annual", we calculated the ratio of Arrhenatherum elatius (perennial) over<br />
the sum of the two annual species Poa annua and Stellaria mdia. For the plant combination<br />
"perennial grasses vs. annual grasses", we calculated the ratio of the sum of Festuca rubra and<br />
Arrhenatherum elatius over the amount of poa annua. standard errors are shown.<br />
There were significant differences between the areas of epi<strong>de</strong>rmal fragments among<br />
different plant species, for the three plant combinations. In the combination "grass vs. forb,,<br />
(Fr, onz = t3.79, p = 0.0002), dicots had the smallest area (lsmean = 4.46 + 0.24)<br />
compared to Festua rubra (lsmean = 5.27 + 0.15). In the combination ,.perennial vs.<br />
annual" (Fz, sost = 58.91, p < 0.0001), Arrhenatherum elatiushad the largest area (lsmean =<br />
5,84 + 0.13), compared to the two annuals poa annua (lsmean = 4.49 + 0.09) and Stellaria<br />
media (lsmean = 4.30 + 0.15). In the combination ..perennial grasses vs. annual grasses,,<br />
(Ft, rrar = 69.37, p < 0'0001), the annual Poa annua had the smallest area (lsmean = 4.40 +<br />
0.17) compared to the perennial grasses (lsmean = 5.43 + 0.16).<br />
After stabilisation of the calculated ratio (from 100-150 fragments onwards, see<br />
above), the ratio calculated by the area of the fragments was always larger than the one<br />
calculated by the frequency of the species (Figure 1). The differences between the area<br />
results and the frequenry results were smallest for the combination "perennial grasses vs.<br />
t24 Chapter 5
annual grasses". The ratio of the epi<strong>de</strong>rmal fragments in the plant combination "perennial<br />
grasses vs. annual grasses" was closer to the true amount of eaten plant species by the<br />
rabbits when onsi<strong>de</strong>ring the area of the fragments instead of the frequency of the<br />
fragments (Figure 2). The difference behreen the two methods was shown by the Wilcoxon<br />
Signed Rank Test, in which pvalues were always significant (p < 0'01)' This observation<br />
was true in any of the number of analyzed fragments, i.e. 100, 150, 200, 250 as well as 300<br />
fragments. A simi6r comparison was not ma<strong>de</strong> for the two other plant combinations, since<br />
the relationship between the amount of plants eaten did not match the amount of plant<br />
species in the pellets (see above), nor in the case of consi<strong>de</strong>ring the area of the fragments,<br />
neither when consi<strong>de</strong>ring their frequency.<br />
Eualuation of bml analPis<br />
t25
25<br />
50<br />
75<br />
100<br />
125<br />
150<br />
175<br />
200<br />
22s<br />
250<br />
275<br />
L 67.73
o<br />
o<br />
6 o<br />
6 a<br />
o<br />
(!<br />
av.<br />
Number of fragments analYsed<br />
leaten by the rabblts<br />
Nfaecal analysis (area)<br />
E!faecal analysis (frequencY)<br />
Fiqure 2: The ratio of the sum of Festuca rubra and Arrhenatherum elatius ovet the amount of Poa<br />
annua (in the plant combination "perennial grasses vs. annual grasses") is shown. This ratio is<br />
compared for the plant amounts effectively eaten by six rabbits and the ratios calculated from the<br />
area and the frequency of epi<strong>de</strong>rmal fragments in the pellets of these rabbits. The comparison is<br />
ma<strong>de</strong> after examining 100, 150, 200, 250 and 300 epi<strong>de</strong>rmal fragments. Standard errors are shown.<br />
Discussion<br />
The results of our feeding trial show that the known diet of the rabbits was only<br />
reflected qualitatively and quantitatively in the epi<strong>de</strong>rmis fragments in the pellets when<br />
concerning diets that consist only of grasses. I<strong>de</strong>ntifying 150 epi<strong>de</strong>rmal fragments should be<br />
recommen<strong>de</strong>d, and the use of area measurements has to be preferred over simply counting<br />
the fragments.<br />
150<br />
When evaluating the comparison between the ratio of plant species eaten and the<br />
ratio obtained by faecal analysis, we can conclu<strong>de</strong> that the results of the faecal analysis are<br />
unreliable when concerning diets including forbs (the grass-forb-diet and the perennial-<br />
annual-diet): comparing the amount eaten and analysed in the faecal pellets results in very<br />
Evaluation of faecal analYsis<br />
r27
significant differences for these two diets. The third diet, comprising only grass species,<br />
seems to be reflected reliably in the faeces. Thus, we should conclu<strong>de</strong> that the<br />
disproportional disappearance of forbs as compared to grass species (VAVRA et al., l97g;<br />
sMnH & SHANDRUK, 1979; LESUE et al., t9g3; McINNrs et al., r9g3; Seuurl & HowARD, 19g3;<br />
WALLAGE-DREEs, 1988), is severely distorting the proportions of the plant species found in the<br />
faecal pellets. Differential digestion makes the microhistological results unreliable as far as<br />
forb consumption is concerned. As faecal material taken from the intestines of some<br />
ruminants contains more species than faeces taken from the ground, SMITH & SHANDRUK<br />
(1979) suppose that also weather conditions could alter the composition of the faeces, and<br />
moreover/ the <strong>de</strong>gree of over- and un<strong>de</strong>restimation could be significantly affected by the<br />
season (LESLTE et al., 1983). As the pellets analysed in our study were taken freshly from<br />
captive rabbits (not exposed to fluctuating weather conditions), we should assume that<br />
pellets collected in the field will expose even more distorted results than presented in Table<br />
2' Some authors tried to establish correction factors (DEARDEN et al., t975; LEsLtE et al.,<br />
1983; BARToLoMt et a/.,1985), but these correction factors should not only be calculated for<br />
each plant species, but also for specific study areas and seasons (Lrsue et al., r9g3), and<br />
probably even for each herbivore species and the age of the animals concerned (Srrwnnr,<br />
1967). This would be a very time-consuming process, and for some rare herbivore species,<br />
this would probably be impossible. As SMITH & SHANDRUK (1979) conclu<strong>de</strong>, a close agreement<br />
between the diet and the faeces can only be reached when the herbivore has mainly eaten<br />
grasses; the i<strong>de</strong>ntification of forbs in faeces on rangelands dominated by forbs poses an<br />
important problem (FREE et al., lgTO).<br />
From each pellet sample, 300 fragments have been i<strong>de</strong>ntified. This quantity proved to<br />
be far more numerous than really nee<strong>de</strong>d to obtain a stable result. When less than 100<br />
fragments are i<strong>de</strong>ntified, the ratio of plant species obserued in the faecal pellets is not yet<br />
stabilized, especially when consi<strong>de</strong>ring the data from the grass-forb-diet and the perennial-<br />
annual-diet. From the measurement of 100 fragments onwards, results become more stable,<br />
especially when looklng at the grasses-diet. We may conclu<strong>de</strong> that we should i<strong>de</strong>ntify at<br />
least 100 fragments for obtaining a more or less stable result. However, when including a<br />
safety margin, we recommend i<strong>de</strong>ntifying 150 plant fragments in the analysis.<br />
Comparing the area of the fragments of different plant species confirms the results of<br />
VAVM & HoLECHEK (1980) and PUTMAN (198a): forbs and annual grasses break down in<br />
fragments that are significantly smaller than the fragments of perennial grasses. Our results<br />
indicate that the plant ratio is usually higher for the area measurements. As mentioned<br />
above, this plant ratio obtained by faecal analysis is only reliable for the grasses diet, but<br />
L28 Chapter 5
also in this diet, we can see a clear distinction between the frequency and area<br />
measurements. The tests indicated that frequency as well as area measurements give a<br />
good estimate of the real diet, but that the area measurement gives an even more reliable<br />
estimate. As a consequence, we suppoft the view of STEWART (1967) that area<br />
measurements are an improvement when comparing to fragment counts. STEWART (1967)<br />
also tested a third quantification method, the point quadrate method, but conclu<strong>de</strong>d that it<br />
would be a too time-consuming process to enable sufficient analyses to reduce the very high<br />
standard error he obtained by this method.<br />
We can conclu<strong>de</strong> that the most important limitation of microhistological faecal<br />
analysis is the problem of differential digestion of forbs. As it is hardly possible to overcome<br />
this shortcoming of the method, there is a need for better methods. MARINS et al. (2002)<br />
and Frnnunn et al. (2007) <strong>de</strong>scribe a method for estimating diet composition by using n-<br />
alkanes. particular patterns of concentrations of n-alkanes in cuticular wax are specific to<br />
individual plant species or species groups and can be compared to n-alkane concentrations in<br />
faeces (by gas chromatography). However, this method is limited to the number of n-alkane<br />
markers available (probably limited to 9) and, as a consequence, this method is only useful<br />
when <strong>de</strong>aling with simple diets. For the study of complex diets, pooling plant species into<br />
groups is necessary. Therefore, fufther research to increase the number of markers is<br />
nee<strong>de</strong>d. CAUr ef a/. (2008) investigated the possibility to compare stable isotope ratios of<br />
nitrogen and carbon in resources and consumer tissues. Using hairs of the consumer could<br />
be used as a non-lethal method to assess the diet. However, this method is still un<strong>de</strong>r<br />
<strong>de</strong>velopment.<br />
Acknowledgements<br />
We thank VLIZ and AWZ-WWK for the use of their infrastructure and the logistic support.<br />
Invaluable technical support was provi<strong>de</strong>d by Frank Broucke (VUZ). We are grateful to Katrien De<br />
Maeyer for sharing her knowledge about faecal analysis and creating the epi<strong>de</strong>rmal fragment<br />
reference collection. Luc Maertens (ILVO) provi<strong>de</strong>d interesting information and literature on rabbit<br />
feeding trials. The first author is supported by the Research Foundation - Flan<strong>de</strong>rs (Aspirant of the<br />
FWO-VIaan<strong>de</strong>ren).<br />
Refetences<br />
ALrpAyo, D., R. VATDEZ, J.L. HoLEcHEK & M. CARDENAs (1992). Evaluation of microhistological analysis for<br />
<strong>de</strong>termining ruminant diet botanical composition. Journal of Range Management45: 148-152.<br />
Evaluation of faecal analYsis<br />
r29
BARToLoME, J., J. FRANCH, M. GUTMAN & N.G. SEuGMAN (1995). physical factors that influence fecal<br />
analysis estimates of herbivore diets. lournal of Range Management4g: 267-270.<br />
BnnonEsn, R' (1977). Food preferences of rabbits Oryctolagus cuniculus L. at Holkam sand dunes,<br />
Norfof k. Jou rna I of Applied Eco logy t4 : 297 -29 I.<br />
Cenqaaruo, R. & J. PIQUER (1998). The digestive system of the rabbit. In: DE BrAs, C. & J. Wrserqnr'r<br />
(eds.), The nutrition of the rabbit. CABI publishing, Wallingford: 1-16.<br />
CAUr, S., E. ANGULo & F. CouncHeup (2008). Discrimination factors (A1sN and A13C; in an omnivorous<br />
consumer: effect of diet isotopic ratio. Functional Ecotogy22:255-263.<br />
DE JoNG, C.8., R.M.A. GILL, S.E. varu Wteneru & F.W.E. BuRLroN (1995). Diet selection by roe <strong>de</strong>er<br />
Gpreolus capreolus in Kiel<strong>de</strong>r Forest in relation to plant cover. Forest Ecology and Management<br />
79: 9L-97.<br />
DEARDEN, 8.1., R.E. PEGAU & R.M. HANsEN (1975). Precision of microhistological estimates of ruminant<br />
food habits. lournal of Wildlife Management 39: 402-407.<br />
DUFFY, S.G., l.S. FNRLY & G. O'DoNNELL (1996). Food of rabbits Oryctolagus cuniculus on upland<br />
grasslands in Connemara. Biology and Environmentg6(B): 69-75.<br />
DusI, l.L. (1949). Methods for the <strong>de</strong>termination of food habits by plant microtechniques and histology<br />
and their application to cottontail rabbit food hablts. lournal of Wldlife Management 13: 295-<br />
298.<br />
FERRETRA, L.M.M., M. owArrr, R. cELAyA, u. GARcrA, M.A.M. RoDRTGUES & K. osono (2007). The use of n<br />
alkanes to estimate diet composition of ruminants grazing on species diverse plant communities<br />
- Effect of feeding selectivity on diet composition estimates. Livestock Science 111: 114-123.<br />
FRet, J.C., R.M. Halsen & P.L. Stt',ts (1970). Estimating dryweights of foodplants in feces of herbivores.<br />
Journal of Range Management 23: 300-302.<br />
HAVSTAD, K.M. & G'8. DoNART (1978). The microhistological technique: testing two central assumptions<br />
in south-central New Mexico. Journal ofRange Management3L:469-470.<br />
HIMKAWA, H. (2001). Coprophagy in leporids and other mammalian herbivores. Mammal Review3L:<br />
61-80.<br />
HoLECHEK, J.L. & M. VAVM (1981). The effect of sli<strong>de</strong> and frequency observation numbers on the<br />
precision of microhistological analysis. Journal of Range Management 34: 337-33g.<br />
Holecxex, J.1., M. VAVRA & R.D. Prepen (1982). Botanical composition <strong>de</strong>termination of range herbivore<br />
diets: a review. Journal ofRange Management35: 309-315.<br />
HoLecHer, J.L. & R. Var-oez (1985). Evaluation of in vitro digestion for improving botanical estimates of<br />
mule <strong>de</strong>er fecal samples. Journal of Mammology 66l. 574-577.<br />
HoMoLKA, M' (1987). A comparison of the trophic niches of Lepus europaeus and Oryctotagus<br />
cuniculus. Folia zoologica 36: 307-377.<br />
HoMoLKA, M. (1986). Comparison of two methods applied to study the food of Lepus europaeus. Folia<br />
Zoologica35: 199-206.<br />
HoMoLKA, M. (1988). Diet of the wild rabbit (Oryctolagus cuniculus) in an agrocoenosis. Folia zoologia<br />
130<br />
37: L2I-L28.<br />
Chapter 5
HqMoLKA, M. (1982). The food of Lepus europ<strong>de</strong>us in a meadow and woodland complex' Foh?<br />
Zoologica3L:243-253.<br />
LESSE, D.M., M. VAVM, E.E. STARKEv & R. Surea (1983). Correcting for differential digestibility in<br />
microhistological analyses involving common coastal forages of the Pacific Northwest. lournal of<br />
Range Management 36:. 730-732'<br />
MAIA, M.J., F. REco & F.S. MACHADo (2003). Determining optimal sampling schemes to study red <strong>de</strong>er<br />
diets by fecal analysis. Silva Lusitana 11: 91-99.<br />
MARTTNS, H., D.A. ErsroN, R.W. Mnyes & J.A. MILNE (2002). Assessment of the use of n-alkanes as<br />
markers to <strong>de</strong>scribe the complex diets of herbivores. Journal of Agriculfural Science 138: 425-<br />
434.<br />
McINNrs, M.L., M. VAVM & W.C. KRUEGER (1983). A comparison of four methods used to <strong>de</strong>termine the<br />
diets of large herbivores. Journal ofRange Management36: 302-306'<br />
NETER, J., M.H. KurNER, C.J. NAcHrsHErv & W. WAssERMAN (1996). Applied linear statistical mo<strong>de</strong>ls.<br />
Fourth Edition. USA: WCB/McGraw-Hill.<br />
PUIG, S., F. VIDELA, M.I. CoNA & S.A. Molce (2007). Diet of the brown hare (Lepus europaeus ) and<br />
food availability in northern Patagonia (Mendoza, Argentina). Mammalian BiologyTZ:240-250'<br />
puLuAM, D.E. & NE66N, J.R. (1979). Determination of digestibility coefficients for quantification of fecal<br />
analysis with elk. In: BoYcE, M.S. & L.D. HAYDEN-WING (eds.), Nofth American elk: ecology,<br />
behaviour and management' University of Wyoming, Laramie: 240-246'<br />
PurMAN, R.J. (1984). Facts from fa*es. Mammal Review14:79-97'<br />
SAMUEL, M.J. & G.S. HowARD (1983). Disappearing forbs in microhistological analysis of diets. Journal of<br />
Ra nge Managemen t 36:. 132-L33.<br />
SANoERS, K.D., DAHL, B.E., Scorr, G. (1980). Bite-count vs Fecal Analysis for Range Animal Diets.<br />
Journal of Range Management33i I46-L49.<br />
SMffH, A.D. & L.l. SHANDRuT (1979). Comparison of fecal, rumen and utilization methods for<br />
ascertaining pronghorn diets. lournal of Range Management32: 275-279'<br />
SpARKs, D.R. & J.C. MALECHET (1968). Estimating percentage dry weight in diets using a microscopic<br />
technique. Jo u rna I of Ra nge Ma nage men t 2l'. 264 -265'<br />
STEWART, D.R.M. (1967). Analysis of plant epi<strong>de</strong>rmis in faeces: a technique for studying the food<br />
preferences of grazing herbivores' Journal ofApplied Ecology4: 83-111'<br />
TREYDTE, A.C., S.M. BERNAscoNr, M. KREUZER & P.l. EDWARDs (2006). Diet of the common warthog<br />
(phacochoerus africanus) on former cattle grounds in a Tanzanian savanna. Journal of<br />
MammalogyST: 889-898.<br />
VAVM, M. & J.L. HoLECHET (1980). Factors influencing microhistological analysis of herbivore diets.<br />
Journal of Range Management33: 37t-374-<br />
VAVM, M., R.W. RrcE & R.M. HANSEN (1978). A comparison of esophageal fistula and fecal material to<br />
<strong>de</strong>termine steer diets. Journal ofRange Management3l: 11-13.<br />
WALLAGE-DREES, J.M. (1988). Rabbits in coastal sand dunes; weighed and counted. PhD dissertation<br />
University of Lei<strong>de</strong>n, Lei<strong>de</strong>n, the Netherlands.<br />
Evaluation of faecal analYsis<br />
131
WRNER B, (1980). Verzorgingsgkb Konflrnn. Gr@, mid<strong>de</strong>n-, kleine- en drvergrassen. Zui6groep B.V.<br />
UiQarcrs, Best.<br />
wILtHMs, O.8., T.CE. Wa.s & D.A. Wer.ls (1974). Grazing management d Wmdyvalton ftn: seasonal<br />
cfnnges in the diet of cat<strong>de</strong> and rabtlits. ytt v21 6 @lid Mogty rt 4995 16.<br />
Yo*urnnnn Y., T.Y. Iro, B. lfiAcvAsuREr,l & S. TAKATsurc (2008). A omparison of fuod resources used by<br />
Mongolian gazelles and sympatric livestuck in three areas in Mongolia. -btrrral of Atid<br />
EnvirutmenbT2: .E-55.<br />
t32 CIBMS
Evaluation of faeca/ ana/ysis .TJJ
t34<br />
Dune Fossile <strong>de</strong> Ghyvel<strong>de</strong>, 2005 (Photographs by N. Somers)
CHAPTER 6<br />
The diet of the wild rabbit<br />
(Oryctolag us cu n icu lus L.) :<br />
selection of plant sPecies in<br />
an acid dune grassland<br />
Nele Somers, Beatrijs Bossuyt, Luc Lens & Maurice Hoffmann<br />
152213<br />
135
Abstract<br />
Rabbits (Oryctolagus cuniculusL.) are expected to forage on high quality food. Experimental<br />
research showed that they select for high quality forage within the same plant species.<br />
However, the spatial scale on which diet preferences are studied could influence the results,<br />
so it is not clear whether the same diet selection mechanisms are operating at the plant<br />
species level: little is known about plant species selection in the field, the seasonal pattern of<br />
this selection, and the mechanisms of this possible selection. Therefore, we studied the diet<br />
composition of wild rabbits in an acid dune grassland, and compared it to the avaitability of<br />
food throughout the different seasons ofthe year. Rabbits proved to select in<strong>de</strong>ed their food<br />
items: they do not just eat according to forage availability, and seasonality does influence<br />
the results. Plant quality did not prove to be the main trigger to select for certain species in<br />
field conditions. Although it has been proven that rabbits are able to select for the better<br />
quality of forage at the monospecific plant patch level, this study indicates that other triggers<br />
are at least equally impoftant in <strong>de</strong>termining the diet selection at the plant species level.<br />
135 dnpter 6
Introduction<br />
patterns and processes of diet selection of mammalian grazing herbivores have been<br />
extensively studied in ecological studies (e.g. BEL9VsKY, 19841 WILMSHURST et al', 2OOO). fhe<br />
twin goals of their diet selection are maximizing nutrient intake and minimizing toxin intake<br />
(Durvcan & Gonooru, 1999). PRovENzn (1995) proposes that these goals can be obtained by a<br />
postingestive feed-back system, by which herbivores relate the satiety or malaise after<br />
eating particular food items with the taste and smell of these items. Although PRovENzA<br />
(1995) states that ruminants and non-ruminants do not differ in the non-cognitive aspec[s of<br />
how feedback is processed, research about diet selection of medium-sized non-ruminant<br />
herbivores, such as the rabbit (Oryctotagus cunrCulus L.), is very limited. Based on the<br />
smaller volume of the digestive tract of medium-sized hindgut-fermenters, such as the<br />
rabbit, and the need for quickly digestible food to fulfil their high metabolic needs (Demurrur<br />
& VAN S9EST, 1985), smaller herbivores can be expected to need plants of higher quality than<br />
farger herbivores (Orr et a1.,2002).<br />
The outcome of food selection studies strongly <strong>de</strong>pend on the scale of the study: a<br />
natural hierarchy of selection processes can be i<strong>de</strong>ntified (JonruSOl't, 1980). For example, at<br />
first or<strong>de</strong>r, there is the geographical range in which the animal occurs; second or<strong>de</strong>r<br />
selection <strong>de</strong>termines the home range of a group of rabbits; third or<strong>de</strong>r selection is about<br />
which habitat components of the home range are being used for foraging and then there is<br />
fourth or<strong>de</strong>r selection of pafticular food items within one habitat patch (Jonnsoru, 1980). The<br />
prediction about food selection based on food quality by medium-sized herbivores, such as<br />
rabbits, was already shown by experimental research (Bnrren et al., 2005i SOMERS ef a/',<br />
2008), proving the important role of protein concentration for rabbits when selecting food<br />
patches, which can be consi<strong>de</strong>red as third or<strong>de</strong>r selection. However, little is known about<br />
selection of food plants by rabbits (fourth or<strong>de</strong>r). Many researchers <strong>de</strong>scribed the diet<br />
composition of the wild rabbit (WILuAMI et al., 1974; BHADRE;A, t977i CHAPUIS, 1979;<br />
HoMoLKA, 1987; Durpr et al., t996; WoLFE ef a/., 1996) and other lagomorphs (HoMoLKA'<br />
1982; PuIc et at., 2OO7i PAUPERIo & ALVES, 2008; SEccoMBE-HErT & TUnrurucroru, 2008), but<br />
only a few also tried to <strong>de</strong>termine diet preferences (e.g. BHADRESA, 1977; CHAPUIS, 1979)' To<br />
our knowledge, studies combining data about diet preferences with plant quality data (to<br />
test the role of plant quality when selecting food plants) are not available. Also other factors<br />
(such as toxicity of the plants) could influence diet preferences as well. Since none of the<br />
plant species consi<strong>de</strong>red in this comparative study of a selection of abundantly present plant<br />
species are known as species rich in toxic secondary compounds, we could entirely focus on<br />
Diet selection in the field
plant quality. Due to the seasonal aspect of plant characteristics, among which forage quality<br />
traits, diet selection could be influenced by seasonality (Cneeurs & F9RGEARD, 1982).<br />
Therefore, diet selection has to be studied in all seasons, in or<strong>de</strong>r to take into account these<br />
possible seasonal differences.<br />
In this study we try to answer the following questions: do rabbits select for specific<br />
plant species or do they just eat according to the plant availability? If they do select, is plant<br />
quality one of the criteria they use? To answer these questions we selected an acid coastal<br />
dune grassland situation as a mo<strong>de</strong>l in a coastal dune area richly populated by rabbits. Diet<br />
availability and diet composition were studied and compared during all four seasons. We<br />
hypothesized that rabbits have preferences at the plant species level, and that these<br />
preferences would vary among different seasons. We additionally hypothesized that forage<br />
quality would be an impoftant <strong>de</strong>terminant of forage selection by rabbits<br />
Materials and methods<br />
Study area and research plots<br />
The research was carried out in the French Nature Reserve 'Dune Fossile <strong>de</strong><br />
Ghyvel<strong>de</strong>' (Ghyvel<strong>de</strong>, France, sl"z'48" N,2033'02" E; managed by conseruatoire du Littoral).<br />
At this site, wiU rabbits comprise the dominant natural grazers, while large herbivores are<br />
used for grazing management (Haflinger horse, Equus caballus L.; LAMoor & Horrunrun,<br />
2004). More information about this dune area can be found in Chapter 1.<br />
Four similar grassland study plots (replicates) of 30 m x 30 m have been selected in<br />
the study area. In each study plot, 4 transects of 30 m were established, 10 m apart from<br />
each other (see Figure 1). Five permanent quadrates (pqs) of 0.25 m x 0.75 m were<br />
distributed evenly along each transect, so that there were 20 pqs in each of the four study<br />
plots, which resulted in a total of 80 pqs.<br />
Dbt auailability<br />
For every season, diet availability was estimated in all four study plots: 30s of<br />
November 2005 - 21st of December 2005 (further called 'Autumn 2005), 6h of February<br />
2006 - 3'd of March 2006 fwinter 2005-2006), 2nd of May 2006 - 2$h of May 2006 (spring<br />
2006) and 31$ of July 2006 - 10th of August 2006 fsummer 2006J. Although small, the size<br />
of the study plot represents a rabbit home range size similar to the one <strong>de</strong>scribed by Derrrn<br />
138<br />
Chapter 6
et al. (2006), so we consi<strong>de</strong>r plant availability in the study plots as a good estimate of what<br />
was available for the rabbits living in or near the study plots (within their home range). Since<br />
the distance between the individual plots always largely excee<strong>de</strong>d 100 m, and since normal<br />
home ranges of rabbit groups measured in Europe are mostly smaller than t ha (DEKKER ef<br />
a1.,2006), we gitn assume that all four plots were foraged by different rabbit groups.<br />
u<br />
3<br />
t<br />
I<br />
E<br />
10m<br />
30m<br />
PQ (0.75 m x 0.75 m)<br />
Figure 1: Schematic presentation of one study plot. In each plot, there are four transects of 30 m; the<br />
distance between two transects is 10 m. Along each transect, five pqs of 75 cm by 75 cm are marked<br />
off, distributed evenly over the transect.<br />
In each pq, all plant species (except for mosses and lichens) were i<strong>de</strong>ntified<br />
(following vAN DER MEUDEN (1996) and LAMBINoN et al. (1998)) and their estimated cover was<br />
noted using the Londo scale (LoNDo, tg75). Estimating plant cover is a method regulady<br />
used for estimating diet availability (e.S. DE loNG et al., 1995). This method is less<br />
<strong>de</strong>structive than clipping the plant species for <strong>de</strong>termining their biomass (BHADRESA, 1977)<br />
and was therefore more usable for our study, comparing diet availability in different seasons<br />
at the same place. Pnvrur (1974) confirms that using cover values alone as an in<strong>de</strong>x of<br />
herbage production differences is a very useful and less time-consuming method.<br />
Using pcord4, a TWINSPAN-table of the relevtis of spring 2006 was ma<strong>de</strong>, in or<strong>de</strong>r to<br />
distinguish between different vegetation types. On the 7s of August 2006, all study plots<br />
were visited, and a vegetation type was assigned to every point in a grid with distance 1 m<br />
between the points of the grid.<br />
Diet selection in the freld<br />
I<br />
I<br />
t<br />
c<br />
I<br />
I<br />
139
Combining the data of the vegetation relev6s and the spatial distribution of the<br />
vegetation types, we calculated the average presence (expressed as percentage of cover) of<br />
individual plant species per plot and per season. This measure was interDreted as the<br />
availability of these species as a food item.<br />
Diet composition<br />
In each season, synchronously with the vegetation relev6s, we collected 30 fresh<br />
rabbit pellets within (or maximal 5 m away from) each research plot. Fresh pellets can be<br />
distinguished from pellets which are several days old by their smooth, glossy, mucous<br />
coating (DusI, 1949). Pellets were collected from as many different latrines as possible and<br />
frozen after collection.<br />
The pellets were prepared for microhistological analysis based on DE loNG ef a/.<br />
(1995). The selected pellets were put in an autoclave (Certo Clav Multicontrol) with some<br />
distilled water, and sterilized for five minutes at a temperature of 125"C. After cooling down,<br />
the water was poured off, using a plankton screen (openings of 100pm), and thereafter the<br />
pellet sample was crushed. We weighed 59 of that sample and put it in a blen<strong>de</strong>r (Waring<br />
Blen<strong>de</strong>r ll, 120-240 volt) for being mixed during one minute. The water was poured off<br />
using the plankton screen again and the sample was put in a small pot, filled with ethanol<br />
70o/o and closed by a lid. The samples were conserved this way.<br />
For microscopical analysis, a drop of the sample was put on a microscopic sli<strong>de</strong> and<br />
covered by a cover slip. Per sample, 30 sli<strong>de</strong>s were ma<strong>de</strong>. Each sli<strong>de</strong> was examined using a<br />
microscope (Olympus 8X41) at magnification 10 x 10. Ten epi<strong>de</strong>rmal plant fragments where<br />
i<strong>de</strong>ntified per sli<strong>de</strong>, in at least two transects. (Pafticles smaller than 10pm x 10pm were<br />
discar<strong>de</strong>d.) Only monocotyledonous species were i<strong>de</strong>ntified and noted (see Chapter 5). In<br />
total, 150 plant fragments were i<strong>de</strong>ntified per pellet sample (see Chapter 5). I<strong>de</strong>ntification of<br />
the fragments was done by comparing the fragments with reference photographs (De<br />
MAEYER, unpublished) of epi<strong>de</strong>rmal fragments of the plant species growing in the study area,<br />
near or in five exclosures (see Chapter 2). Plant material was collected in the field; epi<strong>de</strong>rmal<br />
fragments were taken from the plants, cleared by household bleach and put on microscopic<br />
sli<strong>de</strong>s' Photographs of the fragments were taken, and the characteristics of the fragments<br />
were noted.<br />
The area of each plant fragment was measured and noted by using a grid of 100<br />
small squares, each square representing an area of 100 pm x 100 pm at the magnification<br />
used (see Chapter 5).<br />
L40 Chapter 6
Food quality<br />
To assess the food quality of the food plants, 63 food samples were taken from<br />
Ghyvel<strong>de</strong> in the summer of 2007. The following grass species have been sampled: Agrostis<br />
capillaris (6 samples), Aira praecox (1 sample), Anthoxanthum odoratum (22 samples),<br />
Carex arenaria (13 samples), Festuca rubra (9 samples) and Luzula campestris (12 samples).<br />
The average sample dry weight was 13 g. Plant species were collected by clipping<br />
aboveground vegetation and were separately dried at 60'C (WTB Bin<strong>de</strong>r with controller RD 2<br />
EED/FED; Bin<strong>de</strong>r, Tuttlingen, Germany) until no further mass loss was <strong>de</strong>tected, after which<br />
the dried plants were grin<strong>de</strong>d separately. The percentage of cru<strong>de</strong> protein (CP) and of cell<br />
wall constituents (cellulose, hemicellulose and lignin, which were <strong>de</strong>rived from NDF (neutral<br />
<strong>de</strong>tergent fibre), ADF (acid <strong>de</strong>tergent fibre) and ADL (acid <strong>de</strong>tergent lignin)) were obtained<br />
by Near Infrared Spectroscopy (NIRS - for more information see GIVENS et al. (L997)). A<br />
FOSS Feed and Forage Analyzer was used, combined with Winisi softtvare (FOSS, Brussels,<br />
Belgium). The calibration for the NIRS was carried out by performing wet analyses for<br />
approximately 10% of the samples, following the method of Kjeldahl for CP and GoERING &<br />
VAN SoEsr (1970) and VAN SoESr et al. (199L) for cell wall constituents. Seasonal changes in<br />
plant quality were studied using data of plant specimens sampled near Dune Fossile <strong>de</strong><br />
Ghyvef<strong>de</strong>, approximately 5 km from the study area (EeuHIur, 2007) following a procedure<br />
similar to the one <strong>de</strong>scribed above. Forage quality for rabbits was approximated by the<br />
amount of digestible protein (DP) and digestible energy (DE). Amounts of digestible protein<br />
were estimated by multiplying CP with the mean digestibility coefficient of CP for grasses<br />
(value of 0.70; MAFF, 1986). Digestible Energy was estimated by multiplying Gross Energy<br />
(based on MAFF, 1986) with a coefficient of digestibility, quantified as 0.867 - 0.0012 ADF<br />
(g/kg DM) (DE BLAS etal.,1992).<br />
Statistical analysis<br />
After discarding plant species covering less than 37o in each plot in every season, the<br />
folfowing six species were used in statistical analysis: Agrostis capillaris, Aira praecox'<br />
Anthoxanthum odoratum, Grex arenaria, Festuca rubra and Luzula campestris. There were<br />
no species occurring rarely in the vegetation, but abundantly in the pellets. Paired t-tests<br />
were used to analyse differences between the availability of a plant species in each 0.09 ha<br />
plot and in pellets collected within this plot. Whether the different plant species had a<br />
different food quality (DP and DE) and whether DP and DE were <strong>de</strong>pen<strong>de</strong>nt on the season<br />
Diet selection in the field<br />
t47
was tested by general linear mo<strong>de</strong>ls, followed by Tukey Post-hoc-tests. The statistical tests<br />
were performed using SAS 9.1 (SAS Instihrte Inc., Cary, North Carolina).<br />
Results<br />
When comparing plant availability with plant consumption, Andtoxanthum was<br />
sefected during autumn and winter, while Agrostiswas prefened during spring, summer and<br />
winter (Table I and Figure 2). Luzula cam@is, in contras! was avoi<strong>de</strong>d during spring,<br />
auhlmn and winter. Diet selection by rabbits during summer 2fi)6 <strong>de</strong>viated from that<br />
inferred in all other seasons, with selective preference of Muca rubn and selective<br />
avoidance of Carex arenanb.<br />
t42 Clrapter 6
*<br />
!<br />
50.m<br />
50.00<br />
; .o.oo<br />
!<br />
? 'o*<br />
c<br />
E<br />
$ro*<br />
4<br />
r0.m<br />
c4itlads<br />
Luzla @nqesf,E<br />
*-------{-------<br />
0.0a daryt? awPv4<br />
o.m lo,m 20.@ 30.00 ao.00 5000<br />
Cffilnng|n.rbo(*)<br />
*.,<br />
!<br />
45.00<br />
ro.m:<br />
SPRING2M<br />
^;ffi;;<br />
= -'- Antlpmthw<br />
€ so.oo i<br />
-5m<br />
!**i<br />
€ r.* #'"&'*Nry<br />
-e s.u i 1o**^*z'<br />
10.00:<br />
IAntlDxilthum<br />
I dffitun<br />
--r-<br />
tY|lfrER 200112006<br />
' -Lzulam96tis<br />
'N : z(. " | /'eAinprsE@x<br />
0.m7 t<br />
o.0o lo.m m.oo 30.00 4000 50m 0.m ro.m 20.m 30.00 {.m 50.00 60.00 70.00 00.00<br />
-i-..-<br />
Gffi in vlg.don {%}<br />
Cosr In vlg.don ('i()<br />
sutilER 2006<br />
00.m '<br />
^*,<br />
+S.O i<br />
3 50.m :<br />
!l<br />
3rc.mi<br />
oi<br />
-E **<br />
4 8;<br />
2o.m i<br />
Fioure 2: The relationship between the cover in the vegetation and the presence in the diet of six<br />
graminoid species, presend separately for four seasons. Error bars present the standard erors. The<br />
line y=x is drawn to <strong>de</strong>termine preference for individual plant species. Plants that are abve this line<br />
are positively selected by the rabbits; species un<strong>de</strong>r this line can be consi<strong>de</strong>red as avoidd' (Method<br />
adaptd from Kuurcn et al.,20OB)<br />
Dietrelection in the field<br />
143
o<br />
o<br />
N<br />
d<br />
IU<br />
E<br />
=l<br />
UI<br />
Agrostis capillaris<br />
Aira praeox<br />
Anthoxanthum odorafum<br />
&rex arenaria<br />
Fesfuca rubra<br />
Agrostis capillaris<br />
Aira praecox<br />
Anthoxanthum odorafum<br />
Qrex arenanb<br />
Fstuca rubra<br />
Agrofiis capillaris<br />
Aira pramx<br />
Anthoxanthum odorafum<br />
Qrex arenaria<br />
Fxtua rubra<br />
Agrostis capillaris<br />
Aira praecox<br />
Anthoxanthum odorafum<br />
Qrex arenaria<br />
Fstua rubra<br />
Average i standard error<br />
Cover in vegetation I Proportion of diet<br />
0.76 + 0.20<br />
0.04 + 0.04<br />
12.28 r 6.95<br />
36.77 L 7.76<br />
7.48 + I.75<br />
4I.M r 9.64<br />
1.76 * 0.55<br />
0.00 r 0.00<br />
11.76 + 4.88<br />
33.97 + 6.92<br />
4.0I + 2.29<br />
L7 + t0.LL<br />
5.00 r 2.00<br />
3..14 + 0.53<br />
25.16 r 7.25<br />
2230 + 4.64<br />
3.04 r 2.00<br />
35.88 r 7<br />
5.05 r 1.20<br />
4.03 r 0.65<br />
12.80 + 6.20<br />
67.29 * 6.21<br />
1.67 t t.24<br />
4.t8 r L7L<br />
0.00 r 0.00<br />
31.94 + 6.57<br />
31.11 a 10.61<br />
15.88 r 5.78<br />
12.06 r 1.44<br />
0.00 * 0.00<br />
3L.27 * 4.82<br />
23.95 * 5.32<br />
5.66 r 1.62<br />
20.11 + 3.89<br />
1.18 + 1.09<br />
26.64 + 2.97<br />
18.49 + 3.51<br />
11.51 i 3.86<br />
19.14 r 0.98<br />
5.94 * 3.98<br />
13.19 + 1.95<br />
12.58 + 3.69<br />
11.52 r 1.95<br />
3 -1.89 0.156<br />
3 1.00 0.391<br />
3 -3.87 0.031<br />
3 0.34 0.757<br />
3 -2.03 0.135<br />
3 -5.37 0.013<br />
3 n.a. n.a.<br />
3 -5.49 0.012<br />
3 0.94 0.416<br />
3 -2.06 0.131<br />
4.6r 0.019<br />
3 -6.84 0.q)6 *<br />
3 1.65 0.197<br />
3 -0.22 0.U2<br />
3 0.59 0.599<br />
3 -1.96 0.145<br />
4.67 0.019<br />
3 16.69 0.OO1 r,<br />
3 -0.42 0.701<br />
3 -0.08 0.938<br />
3 6.35 0.008 *<br />
3 -8.56 0.003 *<br />
3 -5.09 0.015 *<br />
Table 1: Averages and standard errors ofthe presence (percentage) ofthe grass species in vegetation<br />
cover and in rabbit pellets. The results of the paired t-tests are also presented. DF = <strong>de</strong>grees of<br />
freedom. T-value = test statistic obtained by the tes't. Prob = the significance level obtained by the<br />
test. n.a. = not applicable. * indicates that Prob is still significant after sequential Bonferroni<br />
correction.<br />
DP of the six plant species was slightly significantly different (Table 2), but the Tukey<br />
Post Hoc did not reveal significant differences between the species. Also, the season proved<br />
to have an important influence, with a significantly higher DP in springtime (see also Figure<br />
3). DE was not significantly different between plant species and seasons.<br />
t44 Chapter 6
Season 3 31.95<br />
4.U<br />
Autumn 2005<br />
Winter 2005-2006<br />
Spring 2006<br />
Autumn vs. Winter<br />
Autumn vs. Spring<br />
Autumn vs, Summer<br />
Winter vs. Spring<br />
Winter vs, Summer<br />
Agrdis capillaris(I)<br />
Aira pnmx(2)<br />
A nthoxa n th u m don tu n (3)<br />
Grer arenaria(4)<br />
ffita rubn(S)<br />
Luzula<br />
6.98<br />
6.90<br />
11.66<br />
6.86<br />
I 0.999<br />
-<br />
o.oo1<br />
0.996<br />
o.ool<br />
1.000<br />
6.92<br />
9.24<br />
6.4L<br />
8.15<br />
8.77<br />
11<br />
(1)<br />
(1)<br />
(2) 0.22s<br />
(3) o.eeo<br />
(4) 0.2s2<br />
(s) 0.077<br />
o.ooo4<br />
(2) (3)<br />
0.229 0.990<br />
- 0.194<br />
0.194<br />
0.811 0.459<br />
0.992 0.219<br />
1.000 0.<br />
(4) (s) (6)<br />
0.292 0.077 0.271<br />
0.811 0.992 1.000<br />
0.459 0.219 0.225<br />
- 0.821 0.875<br />
0.821 - 0.998<br />
0.998<br />
Table 2: Results of the general linear mo<strong>de</strong>l applied to DP and DE of the grass species' DF = <strong>de</strong>grees<br />
of freedom. F-value = test staustic obtained by the mo<strong>de</strong>l. Prob = the significance level obtained by<br />
the test. Least square means (Lsmean) and Tukey Post-Hoc-test-results for the significant variables<br />
are also shown.<br />
Diet relection in the freld<br />
145
1,60<br />
1.40<br />
't,20<br />
1,00<br />
s<br />
; 0,80<br />
o<br />
0.60<br />
0,40<br />
o,20<br />
0,00<br />
1,60<br />
1.40<br />
^ 1,2O<br />
o<br />
! r,oo<br />
-<br />
! o,ao<br />
:<br />
3 o,oo<br />
ut<br />
o o,4o<br />
0,20<br />
0,00<br />
DP<br />
DE<br />
ffi<br />
Autumn<br />
ffi<br />
Autumn<br />
Season<br />
lAgroslis capillaris<br />
ECarex arenaria<br />
D Festuca rubra<br />
E Luzula campestis<br />
@Aira praecox<br />
E Anthoxanth u m odoratu m<br />
Fioure 3: Average DP and DE for some grass species, for each season separately. Standard errors are<br />
shown. There were no measurements for Luzula campestris, Aira praecox and Anthoxanthum<br />
odontumin autumn, winter and spring.<br />
IAgrostls capillais<br />
lACarex arenaria<br />
lJJFestuca rubra<br />
lELuzula campestis<br />
iaAira praecox<br />
MSummer<br />
MSummer<br />
Chapter 6
Discussion<br />
Rabbits do not just eat what is availabb in their environment. Apart from preference<br />
for specific foraging patches (third or<strong>de</strong>r selection, see above - BAKKER et al',2005i S9MERS<br />
et a1.,2008), plant-specific traits also appear to affect diet selection (this study)' The extent<br />
of preference or avoidance of individual plant species thereby differed among seasons, with<br />
the weakest effects recor<strong>de</strong>d during autumn and winter.<br />
As the animals do not just eat what they find, there should be a selection<br />
mechanism. Our hypothesis holds plant quality responsible for this selection and avoidance'<br />
The data on plant quality that were collected do not confirm this hypothesis though: the<br />
different plant species did not really prove to have a significantly different plant quality'<br />
However, plant traits other than nutritional quality may trigger selection or avoidance as<br />
well. For instance, the hairy habitus of Luzula campestris may <strong>de</strong>ter rabbits' We do however<br />
not expect that this would in<strong>de</strong>ed be the case, because Luzula campestris proved to be a<br />
preferred species in one season. Might rabbit diet preferences then be influenced by factors<br />
that do not come from the plant species? This does not seem to be the case: factors as<br />
antipredator consi<strong>de</strong>rations (Korun & BLAUSTEIN, 1995; IAsoN et al', 2002), the distance<br />
between the food plants and the central-place (Hnnneenc & RosELL, 2006), the social rank of<br />
the animal (L9CKLEY, 1976; KnUcen & FLAUGER, 2008) do seem to be especially important<br />
when testing diet preferences at the patch level (when <strong>de</strong>ciding in which patch going to<br />
forage) and not on the species level. However, this consi<strong>de</strong>ration would not be true when<br />
different plant species are growing in different patches. This did not seem to be the case in<br />
our study area either, but studying spatial patterns of species in relation to feeding<br />
Dreferences of rabbits would be interesting. We recommend that the spatial distribution of<br />
plants should be explicitly incorporated in future studies on this topic' The distance between<br />
plant species could then also be inclu<strong>de</strong>d in analyses: when the previous plant you have<br />
eaten was very bad, the nearby plant will taste much better (negative contrasts, BERGVALL ef<br />
a1.,2007). We should however mention that the social status should not have influenced our<br />
results, since pellets were sufficiently wi<strong>de</strong>ly sampled to allow assuming that pellets of<br />
different rabbits were collected.<br />
Whatever might be the reason for plant species preferences, we should realise that<br />
different study scales do influence the outcome of a study, as mentioned before' Studies<br />
revealing the preference of rabbits for high qualiV food came from patch-based studies (e'9'<br />
BAKKER et al., 2005i SoMERS et al., 2008) or group-based studies (MARTINS et al', 2002)<br />
These last authors show a preference for high quality food items at group level: the group<br />
Diet selection in the field<br />
r47
"grasses and forbs" was preferred above other food items, because of its high quality. There<br />
may even be finer levels on which food selection takes place: rabbits are able to select for<br />
plant parts, because of their small statue (DREES, 1992).<br />
In conclusion, this study shows that the rabbits in our acid dune grassland system are<br />
selective grazers: they do not just eat what is available, but they do select for specific plant<br />
species, <strong>de</strong>pending on the season. Plant quality did not prove to be the reason for the diet<br />
selection, contrary to our hypothesis. We recommend that patchiness of plant species should<br />
be incorporated in future studies concerning this topic. Moreover, it should be realized that<br />
the scale on which a study is carried out could strongly influence the results.<br />
Acknowledgements<br />
We thank Conservatoire du Littoral for allowing access to the study area. Technical support<br />
was provi<strong>de</strong>d by Ward Vercruysse (INBO), Tanja Milotic (INBO) en Sam Provoost (INBO). We thank<br />
VLIZ and AWZ-VVWK for the use of their infrastructure. We are grateful to Katrien De Maeyer for<br />
sharing her knowledge about faecal analysis and creating the epi<strong>de</strong>rmal fragment reference collection.<br />
Ataollah Ebrahimi (UGent) gave us access to his plant quality data. Luc Maertens (ILV6) provi<strong>de</strong>d<br />
interesting information and literature on food quality for rabbits. The first author is supported by the<br />
Research Foundation - Flan<strong>de</strong>rs (Aspirant of the FWO-Vlaan<strong>de</strong>ren).<br />
References<br />
BAKKER, E.S., R.C. REIFFERS, H. OLFF & J.M. GrucHrurnru (2005). Experimental manipulation of predation<br />
risk and food quality: effect on grazing behaviour in a central-place foraging herbivore.<br />
Oecologia L46 : L57 -t67 .<br />
BELOVSKY, G.E. (1984). Herbivore optimal foraging: a comparative test of three mo<strong>de</strong>ls. The Amerian<br />
Natu ra list L24 : 97 - LtS.<br />
BERGVALL, U.A.' P. Retmo, T. LuoroLA & O. LETMAR (2007). A test of simultaneous and successive<br />
negative contrast in fallow <strong>de</strong>er foraging behaviour. Animal BehaviourT4:395-402.<br />
BHADRESA, R. (1977). Food preferences of rabbits Oryctotagus cuniculus L. at Holkam sand dunes.<br />
Norfolk. Journal of Applied Ecologyt4: 287-29L<br />
CHAPUIS, l.L. (1979). Evolution saisanniAre du r6gime alimentaire d'Oryctolagus cunttulus (1.) dans<br />
diff6rents types d'habitats en France. In: MvERS, K. & C.D. MAcINNEs (eds), proceedings of the<br />
world lagomorph conference, University of Guelph, ON, Canada: 743_760.<br />
CHneuIs, J.L. & F. Foncerno (1982). Liaisons entre les choix alimentaires du lapin du garenne,<br />
Orydolagus cuniculus (1.), et la ph6nologie <strong>de</strong> la veg6tation sur les pelouses et <strong>de</strong>s lan<strong>de</strong>s<br />
incendi6es. Acta Oecologica 3: 495-510.<br />
DE BLAS, C', J. Wtseual, M.J. FMGA & M.J. VtLler'4roe (1992). Prediction of the digestible energy and<br />
148 chaDter 6
digestibility of gross energy of feeds for rabbits. 2. Mixed diets. Animal Feed Science and<br />
Technology39: 39-59.<br />
DE JoNG, C.B., R.M.A. GrLL, S.E. vAN WIEREN & F.W.E. BuRLroN (1995). Diet selection by roe <strong>de</strong>er<br />
Gprolus caprolusin Kiel<strong>de</strong>r Forest in relation to plant cover. Forest Ecology and Management<br />
79, 9L-97.<br />
DEKKER. J.l.A., M. GR9ENEVELD & S.E. vAN WIEREN (2006). No effects of dominance rank or sex on spatial<br />
behaviour of rabbits. Lutra 49'- 59-66'<br />
DEMMEMT, M.W. & p.J. Vnru SoEsr (1985). A nutritional explanation for body-size patterns of ruminant<br />
and nonruminant herbivores. The American Naturalist I25: 641-672'<br />
DREES, M. (1992). Het Kon'rjn en zijn relaties' Duin15: ll-13'<br />
DUFFy, S.G., l.S. Frunr-y & G. O' D9NNELL (1996). Food of rabbits Oryctotagus cuniculus on upland<br />
grasslands in Connemara. Biotogy and Environment96 B: 69-75'<br />
DuNcAN, A.l. & I.J. GoRDoN (1999). Habitat selection according to the ability of animals to eat, digest<br />
and <strong>de</strong>toxifo foods' Procedings of the Nutrition SocieU5S:799-805'<br />
Dusr, J.L. (1949). Methods for the <strong>de</strong>termination of food habits by plant microtechniques and histology<br />
and their application to cottontail rabbit food habits. Journal of Wldlite Management 13: 295-<br />
298.<br />
EBMHIMI, A. (2007). Towards an integrated framework of <strong>de</strong>termining grazing capacity in low-<br />
productive, spatially heterogeneous landscapes. PhD dissertation, Ghent university, Gent,<br />
Belgium.<br />
GwelS, D.I., DE BoEVER, J.L. & DEAVILLE, E.R. (1997). The principles' practices and some future<br />
applications of near infrared spectroscopy for predicting the nutritive value of foods for animals<br />
and humans. Nutrition research reviews 10: 83-114'<br />
GoERING, H.K. & P.J. Van Sorsr (1970). Forage Fibre Analysis (Apparatus, Reagents, Procedures, and<br />
Some Applications). Agricultural Handbook No. 379, Agricultural Research Seruice, United States<br />
Department of Agriculture.<br />
HMRBERG, O. & F. Roseu- (2006). Selective foraging on woody plant species by the Eurasian beaver<br />
(Gstor fifu) in Telemark, Norway. Journal of Zoology2To:201-208'<br />
HSM9LKA, M. (1982). The food of Lepus europaeus in a meadow and woodland complex' Folia<br />
Zoologica 3l:243-253-<br />
HoMoLKA, M. (1987). A comparison of the trophic niches of Lepus europaeus and Oryctolagus<br />
cuniculus. fulia zoologica 36: 307 -3L7'<br />
IAS6N, G.R., T. Mnruso, D.A. SIM & F.G. HenruY (2002). The functional response does not predict the<br />
local distribution of European Rabbits (Oryctolagus cuniculus) on grass swards: experimental<br />
evi<strong>de</strong>nce. Functional Ecology 16: 394-402.<br />
JoHNSoN, D.H. (19g0). The comparison of usage and availability measurements for evaluating resource<br />
preference. EcologY 6l: 65-7 l.<br />
KorLER, B.p. & L. Buusrerru (1995). Titrating food and safety in a heterogeneous environment: when<br />
are the risky and safe patches of equal value? OikosT4:251-258'<br />
Diet selection in the field<br />
t49
KnUcrn, K. & B. FTAUGER (2008). Social feeding <strong>de</strong>cisions in horses (Equus cabaltu). Behavioural<br />
ProcesresTS:76-83.<br />
KUDPER, D'P.J', P. BEEK, S.E. vAN WTEREN & J.P. BAKKER (2008). Time-scale effects in the interaction<br />
between a large and a smail herbivore. fusic and Apptied Ecologyg: 126-t34.<br />
LAMBINON, J., J,-E. DE LANGHE, L. DELVoSALLE & ]. DUVIGNEAUD (1998). Flora van BeIgi€, het<br />
Groothertogdom Luxemburg, Noord-Frankrijk en <strong>de</strong> aangrenzen<strong>de</strong> gebie<strong>de</strong>n (fteridofuten en<br />
Spermatofirten). Nationale plantentuin van Belgi€, Meise.<br />
LAMoor, I. & M. HorrprnNN (2004). Do season and habitat influence the behaviour of Haflinger mares in<br />
a coastal dune area? Belgian Journal ofZoologyI34: 97_103.<br />
LocKLEy, R.M. (1976). The private life of the rabbit. Het Spectrum, Utrecht.<br />
LoNDo, G. (1975). De <strong>de</strong>cimale schaal <strong>voor</strong> vegetatiekundige opnamen van permanente kwadraten.<br />
Gorteria 7: 101-106.<br />
MAFF (1986). Feed Composition - UK Tables of Feed Composition and Nutritive Value of Ruminants.<br />
Chalcombe Publications, Marlow, Bucks, UK.<br />
MARTINS, H., J.A. MtLtlE & F. REGo (2002). seasonal and spatial variation in the diet of the wild rabbit<br />
(oryctolaguscuniculusL.) in portugal. Journal ofZoology, London25B:395-404.<br />
oLFF, H., M.E. Rrrcnte & H'H.T. PRINs (2002). Global environmental controls of diversity in large<br />
herbivores. Nature 4L5: 901-904.<br />
PrueEruo, J. & P.c. ALVES (2008). Diet of the Iberian hare (Lepus granatensts) in a mountain<br />
ecosystem. European Journal of Wdhfe Researchs4: 57t_579.<br />
PAvNE, G.F (1974). cover-weight relationships. Journal ofRange Management2T:403-404.<br />
PRovENzA, F.D. (1995). Postingestive feedback as an elementary <strong>de</strong>terminant of food preference and<br />
intake in ruminants. Journal of Range Management4\: 2_L7.<br />
PUIG, S., F. Vloeu, M.I. CoNA & S.A. Moruce (2007). Diet of the brown hare (Lepus europaeus) and food<br />
availability in northern Patagonia (Mendoza, Argentina). Mammalian BiologyT2: Z4O-250.<br />
Seccoptee-HEn, P. & R. TuRKINcToN (2008). Summer diet selection of snowshoe hares: a test of<br />
nutritional hypotheses. Oikos LL7 ; 1874-1894.<br />
StrucLaIR, A.R'E. & Nonroru-Gnrrrrrns, M. (1982). Does competition or facilitation regulate migrant<br />
ungulate populations in the serengeti? A test of hypotheses. oecologia53:3M-36g.<br />
soltRs, N., B. D',HAEsE, L. LeNs, B. Bossuyr & M. Horrvnnru (2008). Food quality affects diet preference<br />
of smafl herbivores: experimental evi<strong>de</strong>nce. Belgian Journal otZoologyL3g: t7o-t76.<br />
vAN DER MEUDEN, R. (1996). Heukels' Flora van Ne<strong>de</strong>rland. wolters-Noordhoff, Groningen.<br />
Vlru Soesr P'J., J'8. RoBERrsoN & B.A. LEwIS (1991). Methods for Dietary Fibre, Neutral Detergent Fibre,<br />
and Nonstarch Polysacchari<strong>de</strong>s in Relation to Animal Nutrition. Journal of Dairy *ience 74: 35g3-<br />
3597.<br />
WILUAMS, O.8., T'C.E. Wru-s & D.A. WEL6 (1974). Grazinq management of Woodwalton fen: seasonal<br />
changes in the diet of cattle and rabbits. Journal ofApplied EcologyLL:499-516.<br />
WlLNsnunst, J.F., J.M. FRYXELL & C.M. BERGMAN (2000). The allometry of patch selection in ruminants.<br />
Proceedings ofthe Royal Society ofLondon, Series 8267:345_349.<br />
150 Chapter 6
Worre, A., WHELAN, .J. & Hrvoen, T.J. (1996). Dietary overlap between the Irish mountain hare Lepus<br />
timidus hibernicus and the rabbrt Oryctolagus cuniculus on coastal grassland. Biology and<br />
Environment 96 B: 89-95.<br />
Diet selection in the field<br />
151
WiH rabbit, Puyenbroeck, 2006 (Phobgraphs by M. Pevercge)
CHAPTER 7<br />
General discussion<br />
153
The main hypothesis of the research is that introduced large herbivores facilitate<br />
rabbits (medium-sized herbivores) by modification of the vegetation. This modification<br />
involves creating short swards, creating <strong>de</strong>nser (more productive) swards, creating swards<br />
that have a high food quality for rabbits and influencing vegetation composition. We expect<br />
that these modifications are not completely in<strong>de</strong>pen<strong>de</strong>nt from each other: shofter swards are<br />
expected to have a higher food quality and to be more productive. We started from field<br />
observations un<strong>de</strong>r complex conditions to discover patterns and en<strong>de</strong>d up with semi-<br />
controlled field- and controlled experimental research to reveal some causal mechanisms. By<br />
combining these results, we will now discuss the partial hypotheses which were presented in<br />
Chapter 1 and finally, we will discuss the implications of our research results for the main<br />
hypothesis.<br />
Hypothesis 1: Large herbivores modify vegetation structure by grazing, thereby<br />
creating short and <strong>de</strong>nse swards.<br />
This research shows that large grazers modify vegetation structure, thereby creating<br />
short swards, but these were not <strong>de</strong>nser than the high, ungrazed swards.<br />
The combination of large grazers introduced in the study areas Dune Fossile <strong>de</strong><br />
Ghyvel<strong>de</strong> and Ilzermonding with rabbits keeps the vegetation structure in a more open<br />
state: vegetation height is lower and litter cover is significantly lower than in vegetation<br />
where the large grazers and rabbits were exclu<strong>de</strong>d (Chapter 2). Although we cannot ascribe<br />
these effects to the large grazers alone, the fact that grazing treatments with exclusion of<br />
only large grazers were intermediate between vegetation that was ungrazed and vegetation<br />
that was also grazed by large herbivores, suggests that the influence of large grazers was<br />
larger than the influence of the rabbits. We conclu<strong>de</strong> that large grazers are at least able to<br />
create the typical low-canopy structure of grazing lawns.<br />
The grazing did not result in <strong>de</strong>nser swards though. In August-September 2005<br />
(summer season), the aboveground vegetation of a random selection of pqs in the<br />
exclosures of Ghyvel<strong>de</strong> and lJzermonding was totally clipped and weighed (after drying)<br />
(Chapter 3). In Ghyvel<strong>de</strong> and IJzermonding, biomass concentration (i.e. the biomass per<br />
vertical layer of the vegetation; Table 1) was not significantly differing between the grazing<br />
treatments. A higher biomass concentration (dry weight divi<strong>de</strong>d by vegetation height -<br />
MCNAUGHToN, 1984) was predicted to be a second aspect of grazing lawns (v4rrt DER GRMF ef<br />
al', 2oo5): ungrazed plants grow taller, more robust and occupy a larger, but less <strong>de</strong>nsely<br />
packed space than plants in more heavily grazed grasslands (McNAUGHroN, 19g4). we<br />
t54 Chapter 7
cannot confirm this part of the hypothesis and thereby affirm the conclusions of Brsrv<br />
(1986), who doubts the existence of overcompensation in grazed plants' However, we<br />
should realize that overcompensation of plant tissue might be possible only at low levels of<br />
herbivory (McNAUGHroN, 1983) and that our study areas have a relatively low productivity'<br />
More productive areas might yield other results. Also, belowground biomass was not taken<br />
into account when testing for overcompensation (Br15rv, 1986), but it is reasonable to<br />
assume that belowground biomass is less useful for predicting sward use by rabbits' Results<br />
are also slightly contradictory to the findings of TAHMASEBI K9HYANI ef al (subm'), who found<br />
that grazing-tolerant grass species (Agrostis stolonifera, Poa pratensis) grew a larger number<br />
of tillers in grazed dune grassland than the same species in non-grazed dune grassland. On<br />
the other hand, they also found that two other - grazing intolerant - grass species (Holcus<br />
lanatu, Festuca arundinacea) showed a tiller number <strong>de</strong>crease phenomenon un<strong>de</strong>r grazing'<br />
All four species showed biomass <strong>de</strong>crease un<strong>de</strong>r grazing, which corroborates our findings in<br />
the exclosure experiment.<br />
Hypothesis 2: Rabbits preferentially forage in shoft swatds<br />
This hypothesis was experimentally affirmed by this thesis (chapter 3), proving that<br />
rabbits that could choose between unmown and shortly-mown vegetation strips (study area:<br />
Puyenbroeck) significantly preferred shortly-mown vegetation. We therefore conclu<strong>de</strong> that<br />
rabbits do not forage following the classical Type II response (HoLLJNG, 1959), opposite to<br />
expectations of Orsurru et al. (L981), LUNDBERG (1988), LUNDBERG A AsrnOu (1990) and<br />
GRoss ef a/. (1993). A unimodal, dome-shaped Type IV functional response (Ws et al', 2002;<br />
DUMNr et al., 2003; DEKKER & vAN LANGEVELDE, 2007i vAN LANGEVELDE et al., 2008) is more<br />
likely the case for the rabbit.<br />
However, the exclosure data from a less productive study area (Dune Fossile <strong>de</strong><br />
Ghyvel<strong>de</strong>, Chapter 3), in which rabbit activity in vegetation grazed by horses and vegetation<br />
not grazed by horses was compared, did not yield similar results. Rabbits did not show<br />
foraging preferences for the treatment with presence of large herbivores, but neither for the<br />
treatment without horses. Neveftheless, vegetation height was significantly different<br />
between these treatments. It should be mentioned though that the "low" vegetation in<br />
puyenbroeck was lower than the mean vegetation height in "low" swards in Ghyvel<strong>de</strong>, which<br />
were almost as high as the "long" swards in Puyenbroeck. So, in Ghyvel<strong>de</strong>, we have to<br />
conclu<strong>de</strong> that vegetation height did not influence foraging behaviour of the rabbits, or that<br />
General discussion<br />
155
Lr (-/o,l<br />
Cellulose (o/o)<br />
Hemicellulose (o/o)<br />
Lignin (o/o)<br />
DP (o/o)<br />
DE (MJ / ks DM)<br />
Dry weight (g)<br />
Biomass concentration folcm)<br />
L+R+S<br />
Averaqe + S.E,<br />
10.40 + 0.50<br />
23.24 r 2.28<br />
22.14 + 0.83<br />
8.66 + 0.47<br />
7.28 t 0.35<br />
9.01 t 0.44<br />
5.73 r t.u<br />
L+K+5<br />
R+S<br />
Averaqe t S.E,<br />
9.98 r 0.40<br />
27.67 r 0.93<br />
23.71 I 1,08<br />
7.67 t 0.26<br />
6.99 + 0.28<br />
8.24 r 0.23<br />
85.31 + 17.13<br />
3.56 I 1.09<br />
R+S<br />
s<br />
Averaqe + S.E.<br />
8.31 + 0.35<br />
29.87 t L20<br />
27.62 r 0.62<br />
7.27 r 0.26<br />
5.82 + 0.24<br />
7.84 r 0.23<br />
L44.99 + 72.22<br />
5.36 * 0.41<br />
s<br />
num <strong>de</strong>n F P<br />
d.f. d.f.<br />
2 22 5.18 0.014<br />
2 22 3.93 0,035<br />
2 22 7.30 0.004<br />
2 22 3.70 0.o4L<br />
2 22 5.18 0.014<br />
2 22 2.93 0.074<br />
2 22 6.81 0.005<br />
2 22 1.34 0.281<br />
num <strong>de</strong>n F P<br />
P Post Hoc Test<br />
P Post Hoc Test<br />
R+S vs<br />
Averaqe * S.E. Averaqe f S.E, Averase + S.E. d.f. d.f.<br />
CP (o/o)<br />
8.83 r 0.14 9.16 * 0.45 9.26 i 0.17 2 29 0.72 0.497<br />
Cellulose (o/o)<br />
26.46 t<br />
0.665<br />
L02 27,42 +<br />
0.966 0.504<br />
L.52 28.47 r 0.99 2 29 0.73 0.489<br />
Hemicellulose (o/o)<br />
23.93 +<br />
0.834<br />
0.54 24.36 r<br />
0.817 0.456<br />
L8 25.03 * 0.78 2 29 0.44 0.651<br />
Lignin (o/o)<br />
7q6 + nlo<br />
0.931<br />
7.69 r<br />
0.849 0.625<br />
0.28 8.86 + 0.49 2 29 4.66 0.018<br />
DP (%)<br />
6.18 +<br />
0.959 0.053 0.022<br />
0.10 6.41 + 0.32 6.48 I 0.12 2 29 0.72 0.497<br />
DE (MJ / k9 DM)<br />
8.53 *<br />
0.665 0.966 0.s04<br />
0.24 8.29 + 0.32 7.79 i 0.t8 2 29 2.20 0.129<br />
Dry weight (9)<br />
79.69 +<br />
0.778 0.387 0.113<br />
6.74 107.50 + 18.15 155.70 I 13.40 2 29 8.91 0,001<br />
Biomass concentration (q/cm) 1.89 +<br />
0.289<br />
0,19 1.92 r<br />
0.042 0.001<br />
0.31 1.92 + 0,30 2 30 0.01 0,99s 0.997 1.000 0.99s<br />
Table 1: Results of the plant analyses of Dune Fossile <strong>de</strong> Ghyvel<strong>de</strong> and lJzermonding. In August-September 2005 (summer r"ur*;, tt. uuo*gro,rno<br />
L+R+Svs R+S R+SvsS L+R+Svs. S<br />
0.755 0.047 0,013<br />
0.129 0.647 0.038<br />
0.442 0.030 0,003<br />
0.123 0.737 0,049<br />
0.755 0.047 0.013<br />
0.216 0.704 0.077<br />
0.7t7 0.020 0.005<br />
0.289 0.498 0.972<br />
L+R+Svs R+S S L+R+Svs. S<br />
vegetation of a random selection of pqs in the exclosures of Ghyvel<strong>de</strong> and lJzermonding was totally clipped, weighed (after drying) and food quality of these<br />
samples was analysed. Biomass is expressed in average total dry weight (g) in 75 x 75 cm plots; biomass concentration is an indication of the vertical<br />
distribution (expressed in cm) of biomass in the vegetation. Averages and standard errors are presented per treatment (L+R+S = accessible to all herbivores;<br />
R+S: accessible to rabbits and smaller herbivores, but not to large grazers; S: accessible to small herbivores but not to rabbits and larger herbivores), The<br />
results of the statistical tests (general linear mo<strong>de</strong>ls testing the effect of TREATMENT, followed by Tukey post Hoc Tests) are presented. Cp = o/o6ru<strong>de</strong> protein.<br />
DP = o/o Digestible Protein. DE = Digestible Energy (MJ per kg dry matter). num d.f. = numerator <strong>de</strong>grees of freedom. <strong>de</strong>n d.f. = <strong>de</strong>nominator <strong>de</strong>qrees of<br />
freedom. F = F-value, test statistic obtained by the GLM. P = the significance level obtained by the test.<br />
156<br />
Chapter 7
vegetation was simply not short enough for obtaining facilitation, or that it inteferes with<br />
other, unknown limiting factors.<br />
Hypothesis 3: The short swards created by large grazens are of a higher<br />
nutritional quality (for rabbits) than ungrazed swards (grazing lawns)<br />
Our results only partially indicate that large grazers create high quality swards. DP<br />
and DE were used as measures for food quality. DP was influenced in Ghyvel<strong>de</strong>: a lower DP<br />
concentration was observed when as well rabbits as large herbivores were exclu<strong>de</strong>d. There<br />
was however no influence when excluding only large herbivores (Table 1). DE was never<br />
positively influenced by grazing of large herbivores (Table 1) or by mowing (chapter 3)'<br />
Therefore, we cannot entirely confirm this hypothesis, which was predicted by results of e.g.<br />
coppocK et al. (1983) and Ruess (1984)'<br />
However, it is important to note that protein concentration in Ghyvel<strong>de</strong> is higher in<br />
vegetation grazd by all grazers or by rabbits, while fibre concentration is usually higher in<br />
exclosures without large grazers and rabbits. Also, we cannot exclu<strong>de</strong> that other results<br />
might have been obtained when focusing on individual plant species, plant pafts (Fox etal''<br />
199g) or belowground biomass (Brrsrv, 1986). We should realize that many environmental<br />
factors may influence and obscure the effect of grazing on plant productivity and quality,<br />
e.g. soil nutrient availability, shading, grazer <strong>de</strong>nsity, grazer species, grazing regime,<br />
intensity and frequency of <strong>de</strong>foliation (MILCHUNAS et al., 1995). More research, focussing on<br />
different levels (swards, plant species, plant part) in different (high and low productive)<br />
habitats is nee<strong>de</strong>d to gain more insight into this hypothesis.<br />
Hypothesis 4: When foraging, food quality is an important factor <strong>de</strong>termining the<br />
diet choices of the rabbit.<br />
We can partialry affirm this hypothesis: third or<strong>de</strong>r food selection (selection between<br />
plant patches - JoHNsoN, 1980) by rabbits was experimentally proven to be significantly<br />
influenced by food quality (Chapter 4). The small statue of the rabbit forced it to feed on<br />
high quality forage (DeNuENr & VAN SoESr, 1985; WILMSHURST et al., 2OO0; OLFF et al', 20OZ)'<br />
In our trial, we were really able to show a causal relationship between food quality and diet<br />
Selection, because we controlled for sward height or vegetation biomass, thereby avoiding<br />
the problem of interactions between food quality and food availability (e'g' Bnu- ef a/',<br />
General discussion<br />
t57
2000). We were not able to test the effect of food availability itself, so a tra<strong>de</strong>-off between<br />
food quality and food availability might still be possible.<br />
The hypothesis is not confirmed though, when consi<strong>de</strong>ring fourth or<strong>de</strong>r food selection<br />
(selection of particular food items within one habitat patch - JoHNSoN, 19g0). Rabbits do<br />
select between different plant species and they do not just eat according to forage<br />
availability, but this selectivity could not be related to plant quality (chapter 6). In<br />
conclusion, whether rabbits are selective for high quality forage <strong>de</strong>pends on the spatial scale<br />
of the study. other factors might be involved too, e.g. general quality of the phytomass<br />
(nutrient poor versus nutrient rich environments), and the accompanying grazer species.<br />
Hypothesis 5: Rabbits prefer the shoft swards created by large herbivores<br />
because of the higher nutritional value of these swards<br />
This hypothesis cannot be affirmed by our results. In Puyenbroeck, wih rabbits<br />
preferred short swards for grazing, although no significant forage quality differences<br />
between short and high swards have been observed (chapter 3). Therefore, we can<br />
conclu<strong>de</strong> that vegetation height really was the factor that encouraged the rabbits to graze in<br />
the mown strips' When short-grazed vegetation is of higher quality than ungrazed<br />
vegetation, this might be an additional trigger for the rabbits to prefer these short swards.<br />
But the results of Puyenbroeck suggest that there should be additional other reasons that<br />
cause the preference of the rabbit for short swaros.<br />
An alternative explanation could be that the large grazers make more grass<br />
accessible to the rabbits, by reducing grass height and removing stems (vnru DEKoppEL et a/.,<br />
1996; ARSENAuIT & oweru-SunH, 2002). For example, grass stems could be consi<strong>de</strong>red as<br />
foraging <strong>de</strong>terrents (DRESCHER et a/., 2O06). This alternative explanation has not <strong>de</strong>served<br />
much attention by researchers studying wild rabbits. We suggest that this path should at<br />
least be explored. Other authors address the preference of rabbits for short swards to<br />
predation-refated issues (IAsoN ef a/., 2002; BAKKER et a/., 2009): less time is nee<strong>de</strong>d for<br />
vigilance in short swards (so that more time can be spent to foraging). we might<br />
hypothesize that central place foragers as rabbits need low vegetation for facilitating their<br />
flee towards the safe burrow, when predators are observed (Bnrxen et al., 2o0g). However,<br />
this hypothesis has not really been tested (Berrel et a1.,2009) and the experiments of<br />
BAKKER et a/. (2005) and Drxren et a/. (2007) show that rabbits, although sensitive to<br />
perceived predation risk, do not alter the average spatial distribution of their grazing<br />
pressure as a consequence of an increased perceived predation risk. Rather, the rabbits<br />
158<br />
Chapter 7
shifted the time of foraging or did increase total foraging time (spending more time on<br />
vigilance).<br />
In conclusion, we found that rabbits are able to discriminate between forage of<br />
different food quality, that they do select for the most nutritious forage when this is the only<br />
differentiating factor and also that they possibly prefer a lower vegetation height for<br />
foraging. However, the reason why rabbits prefer short swards is not necessarily related to<br />
the expected high quality of these swards: selection for short swards may also occur when<br />
no differences in food quality are observed.<br />
Hypothesis 6: Also rabbits might be able to create shoft and high qualitative<br />
swards, thereby facilitating themselves<br />
Rabbits do have an important influence on vegetation, but nevertheless, they are not<br />
able to maintain a favourable vegetation structure themselves in Ilzermonding and Ghyvel<strong>de</strong><br />
(Chapter 2). When herbivores are able to maintain favourable grazing swards on their own'<br />
without the help of large herbivores, self facilitation (Ansrnnurr & OwEN-SMIH, 2002) would<br />
be occurring rather than interspecific feeding facilitation. The results of this thesis however<br />
show that rabbits at the present <strong>de</strong>nsity were not able to facilitate themselves sufficiently<br />
and therefore, we suppose that self facilitation will only play a secondary role in these<br />
coastal dune ecosystems.<br />
Hypothesis 7: Large herbivores can modify vegetation composition. This has an<br />
influence on rabbits as they prefer certain plants species above others when<br />
foraging.<br />
An alternative form of feeding facilitation (long term facilitation - KUUPER et a1.,2008)<br />
might be present in our study areas: in the long term, large herbivores may not only alter<br />
vegetation structure (and eventually forage quality) but also alter plant species composition<br />
of the vegetation, which has been encountered in several of the Flemish dune reserves<br />
where grazing was introduced in the nineties (PROV99ST, 2005). This could lead to a long<br />
term form of feeding facilitation: medium-sized grazers would be facilitated by large grazers<br />
because other plant species emerge, which was shown in a herbivore assemblage of cattle<br />
and hares (KuDpER et al., 2008). Possibly, this type of feeding facilitation could also occur in<br />
assemblages of rabbits and large herbivores. Our study showed that the rabbits in the acid<br />
dune grassland system are selective grazers: they do not just eat what is available, but they<br />
General discussion<br />
159
do select for specific plant species, <strong>de</strong>pending on the season (Chapter 6). Also, our results<br />
show that large herbivores influence plant species composition of dune grasslands (Chapter<br />
2). This was shown more explicitly in lJzermonding than in Ghyvel<strong>de</strong>, but we should realize<br />
that this project lasted for only six years, while the long term facilitation in the study of<br />
KUUPER et al. (2008) was observed in a 30-year period (see also pnovoosr (2005) for<br />
Westhoek and Houtsaeger Dunes). At least, in the coastal dune grasslands of our study,<br />
there is a potential for such long term feeding facilitation.<br />
The main hypothesis: Feeding facilitation by creation and preference of shoft,<br />
<strong>de</strong>nse, high quality vegetation?<br />
The main hypothesis of this thesis supposes that interspecific feeding facilitation<br />
would occur when grazing by large herbivore species reduces vegetation height and<br />
stimulates grass re-groMh, thereby enhancing the nutritional quality of forage for another<br />
species (Ansrneulr & OwEN-SMIrn, 2002; vAN LANGEVELDE et a/.,2008), while rabbits would<br />
preferably forage in these created grazing lawns. The results of our research show that parts<br />
of this hypothesis can be affirmed (creation of short swards by large grazers, preference of<br />
rabbits for short swards, preference of rabbits for high quality forage and swards), while<br />
other parts (creation of <strong>de</strong>nse high quality swards, preference for short swards because of<br />
quality consi<strong>de</strong>rations) could not be conclu<strong>de</strong>d. Also long term feeding facilitation by altering<br />
vegetation composition (Kuurrn et al., 2008) could not be affirmed completely, although<br />
there is a potential that this type of facilitation could occur in the future. So, although<br />
mentioned anecdotically by e.g. WTLLIAMS et al. (L974), M[nce_Dnees (19g2), Oosrenvem<br />
(1983), DREES (1989) and Dnees (1998), feeding facilitation between rabbits and large<br />
grazers is probably not present in the herbivore assemblage present in our study areas or<br />
could at least not be <strong>de</strong>tected and our global main hypothesis about this type of feeding<br />
facilitation is not confirmed.<br />
We could explain this by supposing that this type of feeding facilitation does not<br />
exist. However, feeding facilitation could be necessary for rabbit populations as they are not<br />
able to facilitate themselves and some mechanisms causing facilitation could effectively be<br />
<strong>de</strong>tected, indicating that there are at least strong indications that the mechanism of feeding<br />
facilitation does exist in this grazer assemblage. We should therefore consi<strong>de</strong>r the option<br />
that the existence of feeding facilitation is possible, but that it could not be present in our<br />
study system, perhaps due to masking effects of interfering environmental factors, different<br />
160<br />
Chapter 7
grazer <strong>de</strong>nsities (large herbivores as well as rabbits), relatively low productivity of the dune<br />
grasslands un<strong>de</strong>r consi<strong>de</strong>ration, etc.<br />
There are several reasons why feeding facilitation might not be <strong>de</strong>tected. As feeding<br />
facilitation in herbivore assemblages is an indirect interaction, causal relationships are hard<br />
to prove and we could say that feeding facilitation is a hid<strong>de</strong>n interaction' Also, we should be<br />
aware of the contrast between experimental results and field observations. In this study, the<br />
Dreference of rabbits for high quality swards and for short swards has been shown un<strong>de</strong>r<br />
simple, semi-controlled or entirely controlled experimental conditions (Chapter 3, 4), while<br />
field conditions (Chapter 3, second part) did not yield similar results. Also from this point of<br />
view, feeding facilitation could be consi<strong>de</strong>red as a hid<strong>de</strong>n interaction. Also, the conditions for<br />
feeding facilitation might not be fulfilled in our study system. Un<strong>de</strong>r complex field conditions,<br />
many factors may be mixed up with the mechanisms of feeding facilitation, so that the<br />
interaction might not be possible.<br />
First, the grazing behaviour of rabbits may be a tra<strong>de</strong>-off of food quality<br />
consi<strong>de</strong>rations (Chapter 3), food availability, anti-predator consi<strong>de</strong>rations (ImoN et a1.,2002;<br />
BAKKER et al., 2OO9), social factors (LocKLEy, 1976), food accessibility (vlru or K1PPEL et al.,<br />
1996) and distance from the burrow (Drxxen, 2007). Although rabbits might be selective for<br />
short swards, this could be masked on the moment that, for example, a high predation risk<br />
is perceived by the animals. Researchers should be aware that many factors influencing diet<br />
selection of rabbits could be operating at the same time un<strong>de</strong>r field conditions, which makes<br />
it impossible to un<strong>de</strong>rstand causal mechanisms. Several types of facilitation (Chapter 1)<br />
could be operating at the same time, which makes it har<strong>de</strong>r to <strong>de</strong>tect them when not<br />
excluding confou nding factors experimentally.<br />
Second, the balance of facilitation and competition may <strong>de</strong>pend on plant productivity<br />
(Kutem et a1.,20O4; CHENG & turcHIE, 2006; DEKKER & vAN LANGEVELDE, 2007)' We showed<br />
already differences in the foraging behaviour of rabbits in Ghyvel<strong>de</strong> and Puyenbroeck, two<br />
areas which are different in plant productivity (Chapter 3). Also, the impact of herbivores on<br />
vegetation parameters was different for Ghyvel<strong>de</strong> and Ilzermonding (Chapter 2), suggesting<br />
that also the creation of grazing lawns (McNnuGHroN, 1984) might be different between both<br />
areas differing in both abiotic conditions and herbivore species, <strong>de</strong>nsity and grazing regime.<br />
We could not <strong>de</strong>tect the creation of grazing lawns in our study areas but this does not mean<br />
that the mechanism of grazing lawns does not exist: it might be occurring in other types of<br />
study areas. Therefore, confronting experimental data with field observations is<br />
indispensable: it may reveal confounding factors and finally allow researchers to mo<strong>de</strong>l the<br />
feeding facilitation mechanisms along a gradient of productivity.<br />
General discussion<br />
161
Third, as well the <strong>de</strong>nsity of large herbivores as the <strong>de</strong>nsity of rabbits might influence<br />
whether feeding facilitation occurs or not. The hypothesis that facilitation is stronger at lower<br />
rabbit <strong>de</strong>nsities (Bnrxrn et a/., 2009) could be confirmed by comparing the data of Ghyvel<strong>de</strong><br />
with those of Bnxren (2003). Facilitation is occurring in the study area of the latter, with a<br />
lower rabbit <strong>de</strong>nsity than Ghyvel<strong>de</strong>, where facilitation is not occurring (Chapter 3). However,<br />
this hypothesis is contrasting to the finding that there is facilitation in puyenbroeck , an area<br />
with a much higher rabbit <strong>de</strong>nsity.<br />
Fourth, it is possible that facilitation is a seasonal phenomenon: there might be a<br />
temporal tra<strong>de</strong>-off of facilitation and competition between grazers, which could explain why<br />
population effects of facilitation are hardly ever observed (ARsENAULT & OwEN-SMrrn, 2002;<br />
DEKKER, 2007). The seasonal pattern of the rabbit diet selection (chapter 6) is supporting the<br />
possibility of seasonal facilitation, although not yet present.<br />
In conclusion, feeding facilitation is often a masked or even hid<strong>de</strong>n interaction in<br />
herbivore assemblages, because of its indirect nature and because of the many confounding<br />
factors that are arising un<strong>de</strong>r field conditions and that might prevent faciltation. Therefore,<br />
experimental research un<strong>de</strong>r simplified conditions is indispensable to unravel causal<br />
mechanisms and the conditions in which facilitation can occrlr, while additional field research<br />
is still nee<strong>de</strong>d to link experimental data to field reality.<br />
General conclusion<br />
By combining experimental research with field data, we were able to discover some<br />
causal relationships (food quality as well as vegetation height influence foraging <strong>de</strong>cisions of<br />
rabbits), meanwhile proving that more factors than these are involved in facilitative grazing<br />
interactions, so that the main hypothesis could not be unambiguously affirmed. From the<br />
combination of all our results, further questions are originating:<br />
i) Is plant accessibility playing a role in rabbit diet selection?<br />
ii) What is the role of predators in rabbit diet selection?<br />
iii) Are short, <strong>de</strong>nse, high quality swards ever realised in coastal dune areas?<br />
iv) What is the role of habitat productivity?<br />
v) What is the role of seasonality?<br />
r62 Chapter 7
Experimental research on these topics is nee<strong>de</strong>d to gain further insight in these mechanisms,<br />
while combining the results with field data will still be indispensable for un<strong>de</strong>rstanding the<br />
relationships and tra<strong>de</strong>-offs between the different mechanisms'<br />
Suggestions for fufther research<br />
The field results from this study are originating from two coastal dune areas with a<br />
relatively low productivity. As productivity might influence the outcome of interactions in<br />
herbivores assemblages (CnenC & RITcHIE, 2006; DEKKER & VAN LANGEVrroe, 2007), similar<br />
research in other, more productive study areas would be very informative. Topics that should<br />
be investigated in these areas are the formation and nature of grazing lawns un<strong>de</strong>r different<br />
biotic and abiotic conditions, the ability of rabbits to facilitate themselves, the role of the<br />
often strongly fluctuating rabbit population sizes in time, the selection of foraging patches by<br />
rabbits and the seasonal aspect of these topics. When this kind of research could be<br />
executed in a standardized way along a gradient of productivity, predictive mo<strong>de</strong>ls about the<br />
effect of productivity on grazer interactions might become possible'<br />
Further experimental research is necessary to un<strong>de</strong>rstand causal relationships that<br />
are operating in the herbivore assemblage of the wild rabbit and large grazers' Especially,<br />
more attention should be given to the ability of rabbits to cope with a less or more complex<br />
vegetation structure, and their reaction to different <strong>de</strong>grees of perceived vegetation risk.<br />
These topics should be tested separately and un<strong>de</strong>r circumstances where there is no<br />
variation in food quality and sward height. Afterwards, incorporation of distance from the<br />
central place (burrow) in these kinds of experiments would add extra value.<br />
Finally, combining these field data collected along a productivity gradient with<br />
experimental data unravelling causal relationships could lead to a coherent mo<strong>de</strong>l about<br />
feeding facilitation and other types of facilitation in this grazer assemblage. Knowledge about<br />
the true nature of the interactions between rabbits and large herbivores could then be an<br />
interesting stafting point for a global theory about feeding facilitation in herbivore<br />
assemblages in temperate grassland areas.<br />
References<br />
ARSENAULT, R. & N. OWEN-SMrH (2002). Facilitation versus competition in grazing herbivore<br />
assemblages. Oikos 97 : 313-318.<br />
BAKKER, E.S. (2003). Herbivores as mediators of their environment. The impact of large and small<br />
General discussion<br />
163
specles on vegetation dynamics. PhD dissertation, Wageningen Universiteit, Wageningen, the<br />
Netherlands.<br />
Barren, E.S., H. OLFF & l.M. GLEIcHMAN (2009). Contrasting effects of large herbivore grazing on smaller<br />
herbivores. hsic and Applied Ecology I0: 141-150.<br />
BAKKER, E.S., R.C. REIFFERS, H. Or-rr & J.M. GLEIcHMnn (2005). Experimental manipulation of predation<br />
risk and food quality: effect on grazing behaviour in a central-place foraging herbivore.<br />
Oecologia 146: I57 - 167 .<br />
Bell, J'P., K. DANELL & P. SUNESSoN (2000). Response of a herbivore community to increased food<br />
quality and quantity: an experiment with nitrogen fertilizer in a boreal forest.. Journal of Apph:ed<br />
Ecology37: 247-255.<br />
BesrY, A.J. (1986). Does herbivory benefit plants? A review of the evi<strong>de</strong>nce. The Amerian Naturalist<br />
127:870-892.<br />
Bos' D., J. vAN DE KoPPEL, & F.J. WEISSING (2002). Brent Geese aggregate to cope with increased levels<br />
of primary production. In Bos, D., Grazing in coastal grasslands, Brent Geese and facilitation by<br />
herbivory, PhD dissertation, Rijksuniversiteit Groningen, Groningen, the Netherlands: 85-106.<br />
CHeruc, E. & M.E. RrrcHIr (2006). Impacts of simulated livestock grazing on Utah prairie dogs (Cynomys<br />
parui<strong>de</strong>n) in a low productivity ecosystem. Oecotogia I47: 546_555.<br />
coPPocK, D.1., l.K. DFTLING, J.E. ELus & M.I. DyER (1983). Plant-herbivore interactions in a North-<br />
American mixed-grass prairie. I. Effects of black-tailed prairie dogs on intraseasonal<br />
aboveground plant biomass and nutrient dynamics and plant species diversity. Oeologia 56: L-<br />
9.<br />
DEKKER, J.J.A. & F. vAN LANGEVELoT (2007). Plant productivity and free-ranging herbivores impact spatial<br />
foraging patterns and population dynamics of refuge-living herbivores. In: DEKKER, J.l.A.,<br />
Rabbits, refuges and resources. How foraging of herbivores is affected by living in burrows. phD<br />
dissertation, wageningen universiteit, wageningen, the Netherlands: 65-g4.<br />
DEKKER, J.J.A. (2007). Rabbits, refuges and resources. How foraging of herbivores is affected by living<br />
in burrows. PhD disserbation, wageningen Universiteit, wageningen, the Netherlands.<br />
DEKKER, J.J.A., M.L.w.l. Bnoernursr, w.F. DE BoER, F. vAN LANGEVELDE, s.E. vAN WTEREN & H.H.T. pRrNS<br />
(2007). Grazing gradients around refuges of small herbivores are caused by spatial variation in<br />
vigilance. In: DEKKER, J.J.A., Rabbits, refuges and resources. How foraging of herbivores is<br />
affected by living in burrows. PhD dissertation, Wageningen Universiteit, Wageningen, the<br />
Netherlands: 19-31.<br />
DEMMENT, M.w. & P.J. Var soEsr (19g5). A nutritionar expranation for body-size patterns of ruminant<br />
and nonruminant herbivores. The Amerian Naturatist I25: 641_672.<br />
Dnees, M. (1989). Konijnen als grazers. Duin L2:156-158.<br />
Dnees, M. (1998). Langoor. over konijnen en vegetatie in <strong>de</strong> duinen. Duin2r:4-6.<br />
Dnescnen, M., I.M.A. HErKONIG, J.G. RAArs & H.H.T. Pnrrus (2006). The role of grass stems as structural<br />
foraging <strong>de</strong>terrents and their effects on the foraging behaviour of cattle. Applt'd Animal<br />
t64 Chapter 7
tuhaviour Science 101: 10-26.<br />
DURANT, D., H. FRrrz, S. BLats & P. Durucen (2003). The functional response in three species of<br />
herbivorous Anatidae: effects of sward height, body mass and bill size. Journal of Animal<br />
EcologyT2: 220-23L.<br />
Fox, A.D., l.N. KRI5nANSEN, D.A. SrRouD & H. Bovo (1998). The effect of simulated spring goose<br />
grazing on the growth rate and protein content of Phleum pratenseleaves. Otologia 116: 154-<br />
159.<br />
GROss, J.E., L.A. SHrpLEy, N.T. HoBBS, D.E. SPALINGER & B.A. WUNDER (1993). Functional response of<br />
herbivores in food-concentrated patches: tests of a mechanistic mo<strong>de</strong>l. EcologyT4:778-79L.<br />
HoLuNG, C.S. (1959). Some characteristics of simple types of predation and parasitism' Gnadian<br />
Entomologist 91 : 385-398.<br />
lAsoN, G.R., T. MANso, D.A. SIM & F.G. HARTLEY (2002)' The functional response does not predict the<br />
local distribution of European Rabbits (Oryctolagus cuniculu) on grass swards: experimental<br />
evi<strong>de</strong>nce. Functional Ecology 16'- 394-402.<br />
loHNSoN, D.H. (1980). The comparison of usage and availability measurements for evaluating resource<br />
preference. EcologY 6L" 65-7 I'<br />
KuDpER, D.P.J., D.l. NuHoFF & l.P. BAKKER (2004). Herbivory and competition slow down invasion of a<br />
tall grass along a productivity gradient. OecologiaI4L" 452-459'<br />
KuDpER, D.p.J., p. BEEK, S.E. vAN WTEREN & J.P. Bnrrrn (2008). Time-scale effects in the interaction<br />
betweena|argeandasma||herbivore'BasicandApp|iedEco|ogy9:I26-t34.<br />
LocKLEY, R.M. (1976). The private life of the rabbit. Het Spectrum, Utrecht'<br />
LUNoBERG, p. & M. Rsrnorq (1990). Functional response of optimally foraging herbivores. Journal of<br />
Theoretial EiologY 144: 367-377 '<br />
LSNDBERG, p. (1988). Functional response of a small mammalian herbivore: the disc equation revisited'<br />
lournal of Animal Ecology 57 : 999-1006.<br />
MqNAUGHT9N, S.l. (1983). Compensatory plant growth as a response to herbivory' Oikos 40l. 329-336'<br />
MCNAUGHToN, S.l. (1984). Grazing lawns: animals in herds, plant form and co-evolution' The Amertcan<br />
Na tu ra I ist 124 : 863-886'<br />
MTLcHUNAs, D.G., A.S. VARNAMKHAsTT, W.K. LAUENRoTH & H. GoErz (1995). Forage quality in relation to<br />
long-term grazing history, current-year <strong>de</strong>foliation, and water resource. Oecologia 101: 366-<br />
374.<br />
OKSANEN, 1., S.D. FRFIryELL, L ARRUDA & P. NI6I4eLA (1981). Exploitation ecosystems in gradients of<br />
primary productivity. The American Natu ralist lt8: 240-26I'<br />
Olrr, H., M.E. RrrcHrE & H.H.T. Pnrrus (2002). Global environmental controls of diversity in large<br />
herbivores. Nature 4I5'. 901-904.<br />
O9sTERVELD, P. (1983). Eight years of monitoring of rabbits and vegetation <strong>de</strong>velopment on<br />
abandoned arable fields grazed by ponies. Acta Zoologica Fennica I74:71-74.<br />
PRovoosr, S. (2005). Flora en vegetatieveran<strong>de</strong>ringen in permanente kwadraten in De Westhoek en<br />
General discussion<br />
165
Houtsaegerduinen. In HoFFMNN, M., D. BoNTE, E. cosyNs, p. cRrEL, J.-p. MAELFATT, s. pRovoosr,<br />
N. SoMERS & T. STRUWE, Evaluatie Begrazing Kustduinen, LggT-z}M. On<strong>de</strong>zoek en evaluatie<br />
van <strong>de</strong> biologische gevolgen van acht jaar begrazing in <strong>de</strong> <strong>Vlaams</strong>e Westkustreservaten, Ghent,<br />
Ghent University and Brussels, Institute of Nature Conservation, un<strong>de</strong>r the authority of AMI;r1q!<br />
Dept. Nature: L57-2I2.<br />
RuEss, R.W. (1984). Ntrtrient movement and grazing: experimental effects of clipping and nitrogen<br />
source on nutrient uptake in Kyllinga neruoa. Oikos43:193-1gg.<br />
TnHM$rsI KoHYANI, P., B. BossuYT, D. Bonrr & M. HoFFMANN (submitted). plant performance plasticity as<br />
a mechanism of grazing tolerance.<br />
vAN DE KoppEL, J., J. HursMAN, R. vAN DER wAL & H. or_rr (1996). patterns of herbivory along a<br />
productivity gradient: an empirical and theoretical investigation. EalogryTT:736-745.<br />
vAN DER GRMF, A.J., J. Srenl & J.P. BAKKER (2005). Compensatory plant growth of Mua rubn after<br />
grazing: can migratory herbivores increase their own harvest during staging? Fundbnal Eatogy<br />
19: 961-969.<br />
vAN I-ANGEVEI'-DE, F., M. DRESCHE& I.M.A. HEnKoNrc & H.H.T. Prurus (2008). Instantaneous intake rate of<br />
herbivores as function of forage quality and mass: effecG on facilitative and competitive<br />
interactions. Ealogical M<strong>de</strong>lling 2L3: 273-2g4.<br />
WALTAGE-DREEs, M.B. (1982) Konijnen als duinbeheer<strong>de</strong>rs. Duin5:7_LL<br />
WIlrLAMs, O.B', T.c.E' Weu-s & D.A. Wer-r-s (1974). Grazing management of Woodwalton fen: seasonal<br />
changes in the diet of cattle and rabbits. Joumal of Apptrtd Eolqy LL:499-516.<br />
WILMSHURST, J.F', FRnGLL, l.M. & BERGMAN, C.M. (2000). The allometry of patch selection in ruminants.<br />
166<br />
Procdings of the Royal fuiety of London, ftris B 267 345_349.<br />
dnpter 7
@nnldinsilat<br />
L67
168
Summary<br />
This thesis focuses on the positive interaction'feeding facilitation'which is predicted<br />
to occur in assemblages of large and small(er) herbivore species. The main hypothesis of the<br />
research is that introduced large herbivores facilitate rabbits (medium-sized herbivores) by<br />
modification of the vegetation. This modification involves creating short swards, creating<br />
<strong>de</strong>nser (more productive) swards, creating swards that have a high food quality for rabbits<br />
and influencing vegetation composition. We expect that these modifications are not<br />
completely in<strong>de</strong>pen<strong>de</strong>nt from each other: shofter swards are expected to have a higher food<br />
quality and to be more productive. Although several hypotheses about the causes and<br />
mechanisms of feeding facilitation can be mentioned, it is generally supposed that the high<br />
quality of swards previously grazed by large herbivores (grazing lawns) attract medium-<br />
sized herbivores. These medium-sized herbivores would prefer the grazing lawns because of<br />
their need for high quality forage. This main hypothesis was tested during this research, with<br />
as mo<strong>de</strong>l system: the wild rabbit(Oryctolagus cuniculus L.) and large grazers introduced in<br />
coastal dune grasslands. By conducting field observation, semi-controlled field experiments<br />
up to entirely controlled feeding experiments, we tried to test several aspects of the main<br />
hypothesis.<br />
In Chapter 2, we focus on modification of vegetation structure and composition by<br />
grazing and digging effects of rabbits, when in combination with large herbivores' An<br />
exclosure experiment was carried out to measure the effect of rabbits and the combination<br />
of large herbivores and rabbits on vegetation structure and composition in two different<br />
coastal dune areas. In all cases, the combination of rabbits and large grazers as well as<br />
rabbits without large grazers were able to reduce vegetation height and litter cover.<br />
Additionalry, rabbits created bare soil patches, giving extra structural diversity' Through<br />
these structural impacts, grazer activity maintained plant species diversity in only one of the<br />
study areas. The effect of rabbits on vegetation was smaller than the combined effect of<br />
rabbits and large grazers.<br />
In Chapter 3, we tested whether the wild rabbit is foraging according to a unimodal<br />
functional response curue, which means that they would prefer a short to intermediate<br />
vegetation height for foraging rather than a high vegetation where food availability is higher'<br />
By performing two different studies in two study areas, we tested whether rabbits in<strong>de</strong>ed<br />
prefer to graze in shofter vegetation, by comparing rabbit activity in short (grazed or mown)<br />
and ungrazed vegetation. Mown vegetation in the most productive grassland site proved to<br />
5ummary
e preferred by the animals, as indicated by an experimental set-up. There were no<br />
indications that this was due to a difference in forage quality. In a more complex, natural<br />
situation, rabbits were not facilitated by large grazers: they did not prefer to graze in the<br />
shorter vegetation. We suggest that experimental studies might reveal phenomena that are<br />
masked un<strong>de</strong>r more complex field conditions, for instance due to variation in productivity of<br />
the grassland or the occurrence of self-facilitation.<br />
In Chapter 4, it was tested whether rabbits are able to discriminate between plants of<br />
different nutritional value and whether they prefer the most nutritious. A feeding trial in<br />
which rabbits were offered two different types of grasses (fertilised and unfertilised) was<br />
executed un<strong>de</strong>r experimental conditions. The rabbits preferred the grasses with the highest<br />
protein percentage, when conditions were controlled for sward height/plant biomass. This<br />
observation is equivalent to results obtained in geese and provi<strong>de</strong>s experimental evi<strong>de</strong>nce<br />
about the capability of rabbits to select for plants with the highest nutritional quality.<br />
Chapter 5 is a methodological study on microhistological faecal analysis.<br />
Microhistological faecal analysis is a wi<strong>de</strong>ly used method in which the diet of the herbivore is<br />
qualified and quantified by i<strong>de</strong>ntifying plant epi<strong>de</strong>rmal fragments which can be found in the<br />
pellets of this animal. A clear consensus on the accuracy of this technique is lacking. So we<br />
performed a feeding trial with rabbits to compare the known diet with the results obtained<br />
by faecal analysis. The main goal of the study was to find out whether the diet composition<br />
can be reliably <strong>de</strong>rived from faecal analysis (<strong>de</strong>spite problems of differential digestion). It is<br />
conclu<strong>de</strong>d that only the composition of grass diets can be estimated from pellet analyses,<br />
due to a higher digestion intensity of forbs. We recommend the i<strong>de</strong>ntification of 150<br />
epi<strong>de</strong>rmal fragments and quantification by area measurements.<br />
In Chapter 6, we studied diet selection of rabbits at the plant species level: little is<br />
known about plant species selection in the field, the seasonal pattern of this selection, and<br />
the mechanisms of this possible selection. Therefore, we studied the diet composition of wild<br />
rabbits in an acid dune grassland, and compared it to the availability of food throughout the<br />
different seasons of the year. Rabbits proved to select in<strong>de</strong>ed their food items: they do not<br />
just eat according to forage availability, and seasonality does influence the results. plant<br />
quality did not prove to be the main trigger to select for certain species in field conditions.<br />
Although it has been proven that rabbits are able to select for the better quality of forage at<br />
the monospecific plant patch level, this study indicates that other triggers are at least equally<br />
important in <strong>de</strong>termining the diet selection at the plant species level.<br />
Finally, Chapter 7 synthesizes the results of the previous chapters. The results are<br />
commented within the framework of feeding facilitation. Vegetation structure was shown to<br />
t70 Summary
e influenced by large herbivores: grazing results in short swards' These swards were not<br />
<strong>de</strong>nser (which would be expected if overcompensation would occur)' It was experimentally<br />
proven that wiff rabbits prefer those short swards, although field observations showed that<br />
this is not the case in all study areas. The short swards created by large grazers did not have<br />
a higher nutritional quality than ungrazed swards. Rabbits are sensitive to food quality and<br />
prefer patches with high quality forage. Nevertheless, this was not related to sward height:<br />
the preference of rabbits for short swards is not necessarily related to forage quality issues'<br />
Also, we showed that rabbits in our study areas are not able to facilitate themselves. Long<br />
term feeding facilitation (by altering plant species composition of the vegetation) was not<br />
present yet, but could be possible in the long term' From all these results, we conclu<strong>de</strong> that<br />
the main hypothesis could not be affirmed, although some causal mechanisms of feeding<br />
facilitation have been affirmed. We suggest that feeding facilitation is not necessarily absent,<br />
but is hard to <strong>de</strong>tect or is not present un<strong>de</strong>r particular conditions. Experimental research is<br />
nee<strong>de</strong>d for further unravelling causal mechanisms about feeding facilitation and alternative<br />
approaches, while field observations remain necessary to gain insight into other variables<br />
(e.g. habitat productivity, predators, food accessibility, seasonality) that may shift the<br />
balance between the occurrence and absence of feeding facilitation.<br />
Summary<br />
t7r
Samenvatting<br />
Het centrale thema van dit proefschrift is'voedselfacilitatie', een positieve interactie<br />
die kan optre<strong>de</strong>n in gemeenschappen van grote en kleinere herbivoren. onze<br />
hoofdhypothese stelt dat grote grazers <strong>de</strong> vegetatie wijzigen op een zodanige manier dat<br />
mid<strong>de</strong>lgrote herbivoren erdoor aangetrokken wor<strong>de</strong>n. Mogelijke wijzigingen aan <strong>de</strong> vegetatie<br />
zijn: het korter maken van <strong>de</strong> vegetatiehoogte, het kwalitatief (op vlak van nutrieinten) beter<br />
maken van <strong>de</strong> vegetatie, <strong>de</strong> <strong>de</strong>nsiteit van <strong>de</strong> vegetatie verhogen en <strong>de</strong> soortensamenstelling<br />
van <strong>de</strong> vegetatie beinvloe<strong>de</strong>n. we verwachten dat <strong>de</strong> verschillen<strong>de</strong> wijzigingen aan <strong>de</strong><br />
vegetatie niet onafhankelijk zijn van elkaar: koftere graszo<strong>de</strong>n zou<strong>de</strong>n een hogere<br />
voedingswaar<strong>de</strong> en een hogere productiviteit hebben. De mid<strong>de</strong>lgrote herblvoren zou<strong>de</strong>n <strong>de</strong><br />
korte graszo<strong>de</strong>n verkiezen omdat ze een grote behoefte hebben aan hoogkwalitatief voedsel'<br />
De hoofdhypothese werd getest tij<strong>de</strong>ns ons on<strong>de</strong>rzoek in een mo<strong>de</strong>lsysteem van kon'tjnen<br />
(oryctolagus cuniculus L) en grote grazers die geintroduceerd wer<strong>de</strong>n in enkele<br />
kustduingraslan<strong>de</strong>n. we combineer<strong>de</strong>n veldobservaties, halfgecontroleer<strong>de</strong><br />
vel<strong>de</strong>xperimenten en volledig gecontroleerd experimenteel on<strong>de</strong>aoek om <strong>de</strong> verschillen<strong>de</strong><br />
asDecten van onze hoofdhypothese te testen.<br />
In Hoofdstuk 2 on<strong>de</strong>rzochten we <strong>de</strong> effecten van konijnen en <strong>de</strong> combinatie van<br />
konijnen en grote grazers op vegetatiestructuur en vegetatiesamenstelling in twee sterk<br />
verschillen<strong>de</strong> duingraslan<strong>de</strong>n. Zowel konijnen alleen als <strong>de</strong> combinatie van konijnen en grote<br />
grazers reduceer<strong>de</strong>n <strong>de</strong> hoogte van <strong>de</strong> vegetatie en verhoog<strong>de</strong>n strooiselbe<strong>de</strong>kking'<br />
Bovendien zorg<strong>de</strong>n <strong>de</strong> konijnen door hun graafactiviteit <strong>voor</strong> naakte bo<strong>de</strong>m' Dit gaf extra<br />
structurele diversiteit. Ten gevolge van hun structurele effecten waren <strong>de</strong> herbivoren indirect<br />
in staat om <strong>de</strong> plantendiversiteit te behou<strong>de</strong>n, hoewel dit slechts in 66n van <strong>de</strong> twee<br />
gebie<strong>de</strong>n het geval was. Het gecombineer<strong>de</strong> effect van grote grazers en konijnen bleek<br />
groter te zijn dan het effect van konijnen alleen.<br />
In Hoofdstuk 3 gingen we na of het graasgedrag van konijnen beantwoordt aan een<br />
unimodale functionele responscurve. Dit betekent dat konijnen een kofte tot mid<strong>de</strong>lmatige<br />
vegetatiehoogte zou<strong>de</strong>n verkiezen bij het foerageren, in plaats van een hoge vegetatie<br />
waarin <strong>de</strong> totale voedselbeschikbaarheid hoger is. We voer<strong>de</strong>n twee on<strong>de</strong>zoeken uit waarin<br />
het gebruik van korte (begraas<strong>de</strong> of gemaai<strong>de</strong>) vegetatie door konijnen werd vergeleken<br />
met het gebruik van onbegraas<strong>de</strong> vegetatie. De experimentele opzet in het meest<br />
productieve studiegebied wees op een <strong>voor</strong>keur <strong>voor</strong> gemaai<strong>de</strong> vegetatie. Er waren geen<br />
re<strong>de</strong>nen om aan te nemen dat voedselkwaliteit hierbij een rol speel<strong>de</strong>' In een meer<br />
Samenvatting<br />
t73
complexe veldsituatie bleken konijnen niet bij <strong>voor</strong>keur te grazen in een door grote<br />
herbivoren begraas<strong>de</strong> vegetatie. Fenomenen die dui<strong>de</strong>lijk zijn on<strong>de</strong>r experimentele<br />
omstandighe<strong>de</strong>n wor<strong>de</strong>n mogelijks verdoezeld in meer complexe veldsituaties, waarin<br />
bij<strong>voor</strong>beeld ook productiviteit of zelffacilitatie <strong>de</strong> situatie kunnen beinvloeoen.<br />
In Hoofdstuk 4 hebben we getest of konijnen on<strong>de</strong>rscheid maken tussen planten van<br />
verschillen<strong>de</strong> kwaliteit en of ze bij het foerageren <strong>de</strong> meest voedzame planten verkiezen. Dit<br />
werd getest in een zuiver experimentele opzet waarbij konijnen bemeste en onbemeste<br />
grassen (eenzelf<strong>de</strong> soort) aangebo<strong>de</strong>n kregen. De konijnen had<strong>de</strong>n een <strong>voor</strong>keur <strong>voor</strong> <strong>de</strong><br />
meest voedzame planten, met het hoogste eiwitgehalte, in omstandighe<strong>de</strong>n waarbij<br />
zo<strong>de</strong>hoogte of voedselbiomassa geen rol kon<strong>de</strong>n spelen.<br />
Hoofdstuk 5 is een methodologische studie over het gebruik van fecesanalyse <strong>voor</strong><br />
het bepalen van <strong>de</strong> dieetsamenstelling van wil<strong>de</strong> herbivoren. Epi<strong>de</strong>rmisfragmenten,<br />
afkomstig van geconsumeer<strong>de</strong> planten, die aangetroffen wor<strong>de</strong>n in feces wor<strong>de</strong>n<br />
ge'i<strong>de</strong>ntificeerd en gekwantificeerd. Er bestaan een aantal onzekerhe<strong>de</strong>n over <strong>de</strong> juistheid<br />
van <strong>de</strong>ze metho<strong>de</strong>. Daarom voer<strong>de</strong>n we een voe<strong>de</strong>rexperiment uit, waarbij het gevoe<strong>de</strong>r<strong>de</strong><br />
(en dus geken<strong>de</strong>) dieet van een aantal konijnen vergeleken werd met <strong>de</strong> resultaten van <strong>de</strong><br />
analyse van hun keutels. We zochten uit of er een goe<strong>de</strong> overeenkomst was. Dit tleek enkel<br />
het geval te zijn <strong>voor</strong> een dieet dat enkel uit grassen bestaat (ten gevolge van het feit dat<br />
grassen min<strong>de</strong>r goed verteren dan krui<strong>de</strong>n). Het is aan te ra<strong>de</strong>n om een 150-tal fragmenten<br />
te bekijken per keutelstaal en kwantificatie door oppervlakteschattingen van<br />
epi<strong>de</strong>rmisfragmenten geeft een beter resultaat dan tellingen van fragmenten.<br />
In Hoofdstuk 6 werd voedselkeuze door wil<strong>de</strong> konijnen bekeken op het niveau van<br />
plantensoorten. De kennis over hun preferenties <strong>voor</strong> plantensoorten in veldsituaties is<br />
immers beperkt, evenals <strong>de</strong> kennis over seizoenale patronen van en re<strong>de</strong>nen <strong>voor</strong> <strong>de</strong>ze<br />
selectie. In een zuur duingrasland vergeleken we <strong>de</strong> dieetsamenstelling van het konijn met<br />
<strong>de</strong> voedselbeschikbaarheid in dit gebied geduren<strong>de</strong> <strong>de</strong> vier seizoenen van het jaar. Konijnen<br />
bleken in<strong>de</strong>rdaad selectief te zijn in hun voedselkeuzei ze eten niet zomaar wat beschikbaar<br />
is. Seizoenaliteit heeft een invloed op <strong>de</strong> resultaten, maar plantenkwaliteit bleek niet relevant<br />
in dit opzicht. Uit dit on<strong>de</strong>zoek blijkt dat selectie van voedselplanten niet volgens <strong>de</strong>zelf<strong>de</strong><br />
criteria gebeurt als voedselkeuze op an<strong>de</strong>re niveaus.<br />
Het laatste hoofdstuk, Hoofdstuk 7, synthetiseert <strong>de</strong> resultaten van <strong>de</strong> <strong>voor</strong>gaan<strong>de</strong><br />
hoofdstukken en ka<strong>de</strong>rt ze binnen <strong>de</strong> theorie over voedselfacilitatie. we toon<strong>de</strong>n dat<br />
vegetatiestructuur beinvloed wordt door grote grazers (vermin<strong>de</strong>ren van vegetatiehoogte).<br />
Er trad echter geen overcompensatie via extra groei op in <strong>de</strong>ze zo<strong>de</strong>s. Konijnen bleken een<br />
<strong>voor</strong>keur te hebben <strong>voor</strong> <strong>de</strong>rgelijke korte graszo<strong>de</strong>n in experimentele omstandighe<strong>de</strong>n, maar<br />
t74<br />
Samenvatting
veldobseruaties bevestig<strong>de</strong>n dit beeld niet. De voedsell$aliteit van begraa<strong>de</strong> vegetatie<br />
bleek in veldomstandighe<strong>de</strong>n niet beter te z'rjn dan die van onbegraas<strong>de</strong> vegetatie. Konijnen<br />
bleken wel gevoelig te zijn <strong>voor</strong> zo<strong>de</strong>n met een hogere voedselkwaliteit, maar <strong>de</strong>sondanks<br />
bleek <strong>de</strong>ze eigenschap niet <strong>de</strong> re<strong>de</strong>n te zijn waarom korte vegetatie verkozen wordt' Ook<br />
bleek dat <strong>de</strong> invloed van konijnen op vegetatie te beperkt is om zichzelf te faciliteren'<br />
Tenslotte was facilitatie op lange termijn (b'rj veran<strong>de</strong>ren<strong>de</strong> soortensamenstelling van <strong>de</strong><br />
vegetatie) niet aanwezig, maar er is wel een mogelijkheid dat dit op langere termijn wel zal<br />
optre<strong>de</strong>n. Wanneer we al <strong>de</strong>ze resultaten gezamenlijk overschouwen, blijkt dat we onze<br />
hoofdhypothese niet kon<strong>de</strong>n bevestigen. W6l kon<strong>de</strong>n we een aantal on<strong>de</strong>rliggen<strong>de</strong><br />
oozakel'rjke mechanismen van voedselfacilitatie bevestigen. Het is dus niet noodzakelijk zo<br />
dat voedselfacilitatie niet bestaat: misschien is het gewoon moeilijk te <strong>de</strong>tecteren of is het<br />
niet aanwezig in <strong>de</strong> omstandighe<strong>de</strong>n waaron<strong>de</strong>r wij gewerkt hebben. Ver<strong>de</strong>r experimenteel<br />
on<strong>de</strong>zoek kan nog meer informatie opleveren over <strong>de</strong> mechanismen van voedselfacilitiatie<br />
en alternatieve verklaringen <strong>voor</strong> facilitatie. Daarnaast blijven veldstudies echter noodzakelijk<br />
om inzicht te krijgen in an<strong>de</strong>re variabelen (bij<strong>voor</strong>beeld productiviteit van het habitat,<br />
predatoren, voedseltoegankelijkheid, seizoenaliteit) die uitein<strong>de</strong>l'rjk zullen bepalen of<br />
voedselfacilitatie al of niet aanwezig is of kan zijn in bepaal<strong>de</strong> grazergemeenschappen'<br />
Samenvatting<br />
t75


