Causation and Research Design - The INCLEN Trust
Causation and Research Design - The INCLEN Trust
Causation and Research Design - The INCLEN Trust

You also want an ePaper? Increase the reach of your titles
YUMPU automatically turns print PDFs into web optimized ePapers that Google loves.
05-Bachman-45191.qxd 12/11/2006 8:21 PM Page 141<br />
C H A P T E R 5<br />
<strong>Causation</strong> <strong>and</strong> <strong>Research</strong> <strong>Design</strong><br />
Causal Explanation<br />
Nomothetic Causal Explanation<br />
Idiographic Causal Explanation<br />
<strong>Research</strong> <strong>Design</strong>s <strong>and</strong><br />
Criteria for Causal Explanations<br />
Association<br />
Time Order<br />
Nonspuriousness<br />
Mechanism<br />
Context<br />
141<br />
<strong>Research</strong> <strong>Design</strong>s <strong>and</strong> Causality<br />
True Experiments<br />
Causality <strong>and</strong> True Experimental <strong>Design</strong>s<br />
Nonexperimental <strong>Design</strong>s<br />
Cross-Sectional <strong>Design</strong>s<br />
Longitudinal <strong>Design</strong>s<br />
Repeated Cross-Sectional <strong>Design</strong>s<br />
Fixed-Sample Panel <strong>Design</strong>s<br />
Event-Based <strong>Design</strong>s<br />
Causality in Nonexperimental <strong>Design</strong>s<br />
Conclusion<br />
Identifying causes, figuring out why things happen, is the goal of most social science<br />
research. Unfortunately, valid explanations of the causes of social phenomena do not come<br />
easily. Since the 1990s, violent crime victimization rates according to the National Crime<br />
Victimization Survey have been declining steadily (Catalano 2006). However, decreases in<br />
homicide rates have not been uniform across race or ethnicity, age, or geographic location<br />
(Ousey & Lee 2004). And in some cities, rates of violence have begun to increase tremendously.<br />
For example, by June 1 of 2006, there had already been 803 shooting victims<br />
in Philadelphia, which compared to 697 shooting victims by the same time in 2005<br />
(Philadelphia Inquirer 2006). Similar increases have been observed in other small cities<br />
including Sacramento, CA, Syracuse, NY, <strong>and</strong> Boston, MA (Stone 2006).<br />
Is the recent rise in violence observed in some cities due to “anger over the Sept. 11 terrorist<br />
attack <strong>and</strong> the economic downturn” (Kershaw 2002:A10)? <strong>The</strong> release of hard-core<br />
convicts who had been imprisoned during the crime wave of the 1980s <strong>and</strong> early 1990s<br />
(Liptak 2004)? Simply a “crime-drop party is over” phenomenon, as criminologist James<br />
Alan Fox has suggested (cited in Lichtblau 2000:A2)? And why has the violent crime rate<br />
continued its downward trend in some cities like New York City (Dewan 2004a:A25)? Is it
05-Bachman-45191.qxd 12/11/2006 8:21 PM Page 142<br />
142<br />
THE PRACTICE OF RESEARCH IN CRIMINOLOGY AND CRIMINAL JUSTICE<br />
because of Compstat, the city’s computer program that identifies to police where crimes are<br />
clustering (Dewan 2004b:A1; Kaplan 2002:A3)? Or should credit be given to New York’s “Safe<br />
Streets, Safe Cities” program, which increased the ranks of police officers (Rashbaum 2002)?<br />
What about better emergency room care causing a decline in homicides (Harris et al. 2002)?<br />
And what about the decline in usage of crack cocaine on the streets of New York City (Dewan<br />
2004b:C16)? To determine which of these possibilities could contribute to the increase or<br />
decline of serious crime, we must design our research strategies carefully.<br />
In this chapter, we first discuss the meaning of causation from two different perspectives—<br />
nomothetic <strong>and</strong> idiographic—<strong>and</strong> then review the criteria for achieving causally valid explanations.<br />
During this review, we give special attention to several key distinctions in research<br />
design that are related to our ability to come to causal conclusions: the use of an experimental<br />
or nonexperimental design, <strong>and</strong> reliance on a cross-sectional or longitudinal design.<br />
By the end of the chapter, you should have a good grasp of the different meanings of causation<br />
<strong>and</strong> be able to ask the right questions to determine whether causal inferences are likely<br />
to be valid. You also may have a better answer about the causes of crime <strong>and</strong> violence.<br />
CAUSAL EXPLANATION<br />
A cause is an explanation for some characteristic, attitude, or behavior of groups, individuals,<br />
or other entities (such as families, organizations, or cities) or for events. Most social<br />
scientists seek causal explanations that reflect tests of the types of hypotheses with which<br />
you are familiar (see Chapter 3): <strong>The</strong> independent variable is the presumed cause, <strong>and</strong><br />
the dependent variable is the potential effect. For example, the study by Sampson <strong>and</strong><br />
Raudenbush (2001) tested whether disorder in urban neighborhoods (the independent variable)<br />
leads to crime (the dependent variable). (As you know, they concluded that it did not,<br />
at least not directly.) This type of causal explanation is termed nomothetic.<br />
A different type of cause is the focus of some qualitative research (see Chapter 8) <strong>and</strong><br />
our everyday conversations about causes. In this type of causal explanation, termed idiographic,<br />
individual events or the behaviors of individuals are explained with a series of<br />
related, prior events. For example, you might explain a particular crime as resulting from<br />
several incidents in the life of the perpetrator that resulted in a tendency toward violence,<br />
coupled with stress resulting from a failed marriage, <strong>and</strong> a chance meeting.<br />
Nomothetic Causal Explanation<br />
A nomothetic causal explanation is one involving the belief that variation in an independent<br />
variable will be followed by variation in the dependent variable, when all other things are<br />
equal (ceteris paribus). In this perspective, researchers who claim a causal effect have concluded<br />
that the value of cases on the dependent variable differs from what their value would<br />
have been in the absence of variation in the independent variable. For instance, researchers<br />
might claim that the likelihood of committing violent crimes is higher for individuals who<br />
were abused as children than it would be if these same individuals had not been abused as<br />
children. Or, researchers might claim that the likelihood of committing violent crimes is<br />
higher for individuals exposed to media violence than it would be if these same individuals
05-Bachman-45191.qxd 12/11/2006 8:21 PM Page 143<br />
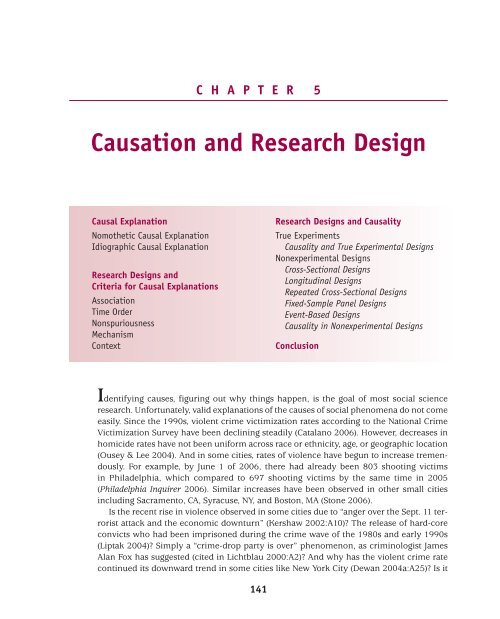
EXHIBIT 5.1 Association: Noise Intensity for Two Groups in an Experiment<br />
Mean noise intensity<br />
6<br />
5<br />
4<br />
3<br />
2<br />
1<br />
0<br />
Source: Adapted from Bushman, 1995.<br />
Students who viewed<br />
violent tape<br />
CHAPTER 5 <strong>Causation</strong> <strong>and</strong> <strong>Research</strong> <strong>Design</strong> 143<br />
Students who viewed<br />
nonviolent tape<br />
had not been exposed to media violence. <strong>The</strong> situation as it would have been in the absence<br />
of variation in the independent variable is termed the counterfactual (see Exhibit 5.1).<br />
Of course, the fundamental difficulty with this perspective is that we never really know what<br />
would have happened at the same time to the same people (or groups, cities, <strong>and</strong> so on) if the<br />
independent variable had not varied, because it did. We cannot rerun real-life scenarios (King,<br />
Keohane, & Verba 1994). We could observe the aggressiveness of people’s behavior before <strong>and</strong><br />
after they were exposed to media violence. But this comparison involves an earlier time period,<br />
when, by definition, the people <strong>and</strong> their circumstances were not exactly the same.<br />
But we do not need to give up hope! Far from it. We can design research to create conditions<br />
that are comparable indeed, so that we can confidently assert our conclusions ceteris
05-Bachman-45191.qxd 12/11/2006 8:21 PM Page 144<br />
144<br />
THE PRACTICE OF RESEARCH IN CRIMINOLOGY AND CRIMINAL JUSTICE<br />
paribus, other things being equal. We can examine the impact on the dependent variable<br />
of variation in the independent variable alone, even though we will not be able to compare<br />
the same people at the same time in exactly the same circumstances except for the variation<br />
in the independent variable. And by knowing the ideal st<strong>and</strong>ard of comparability, we<br />
can improve our research designs <strong>and</strong> strengthen our causal conclusions even when we<br />
cannot come so close to living up to the meaning of ceteris paribus.<br />
Quantitative researchers seek to test nomothetic causal explanations with either experimental<br />
or nonexperimental research designs. However, the way in which experimental <strong>and</strong><br />
nonexperimental designs attempt to identify causes differs quite a bit. It is very hard to<br />
meet some of the criteria for achieving valid nomothetic causal explanations using a nonexperimental<br />
design. Most of the rest of this chapter is devoted to a review of these causal<br />
criteria <strong>and</strong> a discussion of how experimental <strong>and</strong> nonexperimental designs can help to<br />
establish them.<br />
Causal effect (nomothetic perspective) When variation in one phenomenon, an independent<br />
variable, leads to or results, on average, in variation in another phenomenon, the<br />
dependent variable.<br />
Example of a nomothetic causal effect: Individuals arrested for domestic assault tend to<br />
commit fewer subsequent assaults than do similar individuals who are accused in the same<br />
circumstances but not arrested.<br />
Idiographic Causal Explanation<br />
<strong>The</strong> other meaning of the term cause is one that we have in mind very often in everyday<br />
speech. This is idiographic causal explanation: the concrete, individual sequence of events,<br />
thoughts, or actions that resulted in a particular outcome for a particular individual or that<br />
led to a particular event (Hage & Meeker 1988). An idiographic explanation also may be<br />
termed an individualist or a historicist explanation.<br />
Causal effect (idiographic perspective) When a series of concrete events, thoughts, or<br />
actions result in a particular event or individual outcome.<br />
Example of an idiographic causal effect: An individual is neglected by his parents.<br />
He comes to distrust others, has trouble maintaining friendships, has trouble in school,<br />
<strong>and</strong> eventually gets addicted to heroin. To support his habit, he starts selling drugs <strong>and</strong> is<br />
ultimately arrested <strong>and</strong> convicted for drug trafficking.<br />
A causal explanation that is idiographic includes statements of initial conditions <strong>and</strong><br />
then relates a series of events at different times that led to the outcome, or causal effect. This<br />
narrative or story, is the critical element in an idiographic explanation, which may therefore<br />
be classified as narrative reasoning (Richardson 1995:200–201). Idiographic explanations<br />
focus on particular social actors, in particular social places, at particular social times
05-Bachman-45191.qxd 12/11/2006 8:21 PM Page 145<br />
CHAPTER 5 <strong>Causation</strong> <strong>and</strong> <strong>Research</strong> <strong>Design</strong> 145<br />
(Abbott 1992). Idiographic explanations are also typically very concerned with context, with<br />
underst<strong>and</strong>ing the particular outcome as part of a larger set of interrelated circumstances.<br />
Idiographic explanations thus can be termed holistic.<br />
Idiographic explanation is deterministic, focusing on what caused a particular event to<br />
occur or what caused a particular case to change. As in nomothetic explanations, idiographic<br />
causal explanations can involve counterfactuals, by trying to identify what would have happened<br />
if a different circumstance had occurred. But unlike in nomothetic explanations, in<br />
idiographic explanations the notion of a probabilistic relationship, an average effect, does not<br />
really apply. A deterministic cause has an effect in every case under consideration.<br />
Anderson’s (1990) field research in a poor urban community produced a narrative<br />
account of how drug addiction can result in a downward slide into residential instability<br />
<strong>and</strong> crime:<br />
When addicts deplete their resources, they may go to those closest to them,<br />
drawing them into their schemes. ...<strong>The</strong> family may put up with the person for a<br />
while. <strong>The</strong>y provide money if they can. . . . <strong>The</strong>y come to realize that the person is<br />
on drugs. ...Slowly the reality sets in more <strong>and</strong> more completely, <strong>and</strong> the family<br />
becomes drained of both financial <strong>and</strong> emotional resources. ...Close relatives<br />
lose faith <strong>and</strong> begin to see the person as untrustworthy <strong>and</strong> weak. Eventually the<br />
addict begins to “mess up” in a variety of ways, taking furniture from the house<br />
[<strong>and</strong>] anything of value. ...Relatives <strong>and</strong> friends begin to see the person ...as<br />
“out there” in the streets. ...One deviant act leads to another. (Pp. 86–87)<br />
An idiographic explanation like Anderson’s (1990) pays close attention to time order <strong>and</strong><br />
causal mechanisms. Nonetheless, it is difficult to make a convincing case that one particular<br />
causal narrative should be chosen over an alternative narrative (Abbott 1992). Does low<br />
self-esteem result in vulnerability to the appeals of drug dealers, or does a chance drug<br />
encounter precipitate a slide in self-esteem? <strong>The</strong> prudent causal analyst remains open to<br />
alternative explanations.<br />
RESEARCH DESIGNS AND CRITERIA FOR CAUSAL EXPLANATIONS<br />
In the movie Money Train, two men spray the inside of a subway token booth with a flammable<br />
liquid, blowing up the toll booth <strong>and</strong> killing the collector. In 1995, while the movie was<br />
still showing in theaters, a similar incident actually occurred in a New York City subway. <strong>The</strong><br />
toll collector was hospitalized with widespread third-degree burns. <strong>The</strong> media violence, it was<br />
soon alleged, had caused the crime. How would you evaluate this claim? What evidence do<br />
we need to develop a valid conclusion about a hypothesized causal effect? Imagine a friend<br />
saying, after reading about the Money Train incident, “See, media violence causes people to<br />
commit crimes.” Of course, after reading Chapter, 1 you would not be so quick to jump to<br />
such a conclusion. “Don’t overgeneralize,” you would remind yourself. When your friend<br />
insists, “But I recall that type of thing happening before,” you might even suspect selective<br />
observation. As a blossoming criminological researcher, you now know that if we want to<br />
have confidence in the validity of our causal statements, we must meet a higher st<strong>and</strong>ard.
05-Bachman-45191.qxd 12/11/2006 8:21 PM Page 146<br />
146<br />
THE PRACTICE OF RESEARCH IN CRIMINOLOGY AND CRIMINAL JUSTICE<br />
How research is designed influences our ability to draw causal conclusions. In this<br />
section, we will introduce the features that need to be considered in a research design in<br />
order to evaluate how well it can support nomothetic causal conclusions.<br />
Five criteria must be considered when deciding whether a causal connection exists.<br />
When a research design leaves one or more of the criteria unmet, we may have some important<br />
doubts about causal assertions the researcher may have made. <strong>The</strong> first three of the<br />
criteria are generally considered the necessary <strong>and</strong> most important basis for identifying a<br />
nomothetic causal effect: empirical association, appropriate time order, <strong>and</strong> nonspuriousness.<br />
<strong>The</strong> other two criteria, identifying a causal mechanism <strong>and</strong> specifying the context in<br />
which the effect occurs, can also considerably strengthen causal explanations although<br />
many do not consider them as requirements for establishing a causal relationship.<br />
Conditions necessary for determining causality:<br />
1. empirical association<br />
2. appropriate time order<br />
3. nonspuriousness<br />
Conditions important in specifying causal relationships:<br />
1. mechanism<br />
2. context<br />
We will use Brad Bushman’s (1995) experiment on media violence <strong>and</strong> aggression<br />
to illustrate the five criteria for establishing causal relationships. Bushman’s study focused<br />
in part on this specific research question: Do individuals who view a violent videotape act<br />
more aggressively than individuals who view a nonviolent videotape?<br />
Undergraduate psychology students were recruited to watch a 15-minute videotape in<br />
a screening room, one student at a time. Half of the students watched a movie excerpt that<br />
was violent (from Karate Kid III), <strong>and</strong> half watched a nonviolent movie excerpt (from Gorillas<br />
in the Mist). After viewing the videotape, the students were told that they were to compete<br />
with another student, in a different room, on a reaction-time task. When the students saw<br />
a light cue, they were to react by trying to click a computer mouse faster than their opponent.<br />
On a computer screen, the students set a level of radio static that their opponents<br />
would hear when the opponents reacted more slowly. <strong>The</strong> students themselves heard this<br />
same type of noise when they reacted more slowly than their opponents, at the intensity<br />
level supposedly set by their opponents.<br />
Each student in the study participated in 25 trials, or competitions, with the unseen<br />
opponent. <strong>The</strong>ir aggressiveness was operationalized as the intensity of noise that they set<br />
for their opponents over the course of the 25 trials. <strong>The</strong> louder the noise level they set, the<br />
more aggressively they were considered to be behaving toward their opponents. <strong>The</strong> question<br />
that we will focus on first is whether students who watched the violent video behaved<br />
more aggressively than those who watched the nonviolent video.
05-Bachman-45191.qxd 12/11/2006 8:21 PM Page 147<br />
Association<br />
Time Order<br />
<strong>The</strong> results of Bushman’s (1995) experiment are represented in Exhibit 5.1. <strong>The</strong> average<br />
intensity of noise administered to the opponent was indeed higher for students who<br />
watched the violent videotape than for those who watched the nonviolent videotape. But<br />
is Bushman justified in concluding from these results that viewing a violent videotape<br />
increased aggressive behavior in his subjects? Would this conclusion have any greater claim<br />
to causal validity than the statement that your friend made in response to the Money Train<br />
incident? Perhaps it would.<br />
If for no other reason, we can have greater confidence in Bushman’s (1995) conclusion<br />
because he did not observe just one student who watched a violent video <strong>and</strong> then acted<br />
aggressively, as was true in the Money Train incident. Instead, Bushman observed a number<br />
of students, some of whom watched a violent video <strong>and</strong> some of whom did not. So his conclusion<br />
is based on finding an association between the independent variable (viewing of a<br />
violent videotape) <strong>and</strong> the dependent variable (likelihood of aggressive behavior).<br />
Association is a necessary criterion for establishing a causal effect, but it is not sufficient.<br />
Suppose you find in a survey that most people who have committed violent crimes have<br />
also watched the movie Money Train, <strong>and</strong> that most people who have not committed<br />
violent crimes have not watched the movie. You believe you have found an association<br />
between watching the movie <strong>and</strong> committing violent crimes. But imagine you learn that the<br />
movie was released after the crimes were committed. Thus, those people in your survey<br />
who said they had seen the movie had actually committed their crimes before the movie<br />
characters committed their crimes. Watching the movie, then, could not possibly have led<br />
to the crimes. Perhaps the criminals watched the movie because committing violent crimes<br />
made them interested in violent movies.<br />
This discussion points to the importance of the criterion of time order. To conclude<br />
that causation was involved, we must see that cases were exposed to variation in the independent<br />
variable before variation in the dependent variable. Bushman’s (1995) experiment<br />
satisfied this criterion because he controlled the variation in the independent variable: All<br />
the students saw the videotape excerpts (which varied in violent content) before their level<br />
of aggressiveness was measured.<br />
Nonspuriousness<br />
CHAPTER 5 <strong>Causation</strong> <strong>and</strong> <strong>Research</strong> <strong>Design</strong> 147<br />
Even when research establishes that two variables are associated <strong>and</strong> that variation in the<br />
independent variable precedes variation in the dependent variable, we cannot be sure we<br />
identified a causal relationship between the two variables. Have you heard the old adage<br />
“Correlation does not prove causation”? It is meant to remind us that an association<br />
between two variables might be caused by something else. If we measure children’s shoe<br />
sizes <strong>and</strong> their academic knowledge, for example, we will find a positive association.<br />
However, the association results from the fact that older children have larger feet as well as<br />
more academic knowledge. Shoe size does not cause knowledge or vice versa.
05-Bachman-45191.qxd 12/11/2006 8:21 PM Page 148<br />
148<br />
THE PRACTICE OF RESEARCH IN CRIMINOLOGY AND CRIMINAL JUSTICE<br />
Before we conclude that variation in an independent variable causes variation in a<br />
dependent variable, we must have reason to believe that the relationship is nonspurious.<br />
Nonspuriousness is a relationship between two variables that is not due to variation in a<br />
third variable. When this third variable, an extraneous variable, causes the variation, it<br />
is said to have created a spurious relationship between the independent <strong>and</strong> dependent<br />
variables. We must design our research so that we can see what happens to the dependent<br />
variable when only the independent variable varies. If we cannot do this, there are other statistical<br />
methods we must use to control the effects of other variables we also believe are<br />
related to our dependent variable. (You will be relieved to know that a discussion of these<br />
statistical techniques is way beyond the scope of this text!)<br />
In reality, then, the fact that someone blew up a toll booth after seeing the movie Money<br />
Train might be related to the fact that he was already feeling enraged against society. This<br />
led him to seek out a violent movie for entertainment purposes (see Exhibit 5.2). Thus, seeing<br />
the violent movie itself in no way led him to commit the crime. We must be sure that<br />
all three conditions of association, time order, <strong>and</strong> nonspuriousness are met before we make<br />
such claims.<br />
Does Bushman’s (1995) claim of a causal effect rest on any stronger ground? To evaluate<br />
nonspuriousness, you need to know about one more feature of his experiment. He<br />
assigned students to watch either the violent video or the nonviolent video r<strong>and</strong>omly, that<br />
is, by the toss of a coin. Because he used r<strong>and</strong>om assignment, the characteristics <strong>and</strong> attitudes<br />
that students already possessed when they were recruited for the experiment could<br />
EXHIBIT 5.2 A Spurious Relationship<br />
Spurious relationship<br />
View the movie<br />
Money Train<br />
<strong>The</strong> extraneous variable creates<br />
the spurious relationship<br />
Feel enraged<br />
against society<br />
Commit<br />
violent crime<br />
View the movie<br />
Money Train<br />
Commit<br />
violent crime
05-Bachman-45191.qxd 12/11/2006 8:21 PM Page 149<br />
not influence either of the two videos they watched. As a result, the students’ characteristics<br />
<strong>and</strong> attitudes could not explain why one group reacted differently from the other after<br />
watching the videos. In fact, because Bushman used 296 students in his experiment, it is<br />
highly unlikely that the violent video group <strong>and</strong> the nonviolent video group differed in any<br />
relevant way at the outset, even on the basis of chance. This experimental research design<br />
meets the criterion of nonspuriousness. Bushman’s conclusion that viewing video violence<br />
causes aggressive behavior thus rests on firm ground indeed.<br />
Causal (internal) validity is achieved by meeting the criteria of association, time order,<br />
<strong>and</strong> nonspuriousness. Others, however, believe that two additional criteria should also be<br />
considered: mechanism <strong>and</strong> context.<br />
Mechanism<br />
CHAPTER 5 <strong>Causation</strong> <strong>and</strong> <strong>Research</strong> <strong>Design</strong> 149<br />
Confidence in a conclusion that two variables have a causal connection will be strengthened<br />
if a mechanism, some discernable means of creating a connection, can be identified (Cook<br />
& Campbell 1979:35; Marini & Singer 1988). Many social scientists (<strong>and</strong> scientists in other<br />
fields) argue that a causal explanation is not adequate until a causal mechanism is identified.<br />
What process or mechanism actually is responsible for the relationship between the<br />
independent <strong>and</strong> dependent variables?<br />
Bushman (1995) did not empirically identify a causal mechanism in his experiment, but<br />
he did suggest a possible causal mechanism for the effect of watching violent videos. Before<br />
we can explain this causal mechanism, we have to tell you about one more aspect of his<br />
research. He just was not interested in whether viewing violent films resulted in aggressive<br />
behavior. Actually, his primary hypothesis was that individuals who are predisposed to<br />
aggression before the study began would be more influenced by a violent film than individuals<br />
who were not aggressive at the outset. And that is what happened: Individuals who were<br />
predisposed to aggression became more aggressive after watching Bushman’s violent video,<br />
but individuals who were not predisposed to aggression did not become more aggressive.<br />
After the experiment, Bushman (1995) proposed a causal mechanism to explain why<br />
aggressive individuals became even more aggressive after watching the film:<br />
High trait aggressive individuals [people predisposed to aggression] are more<br />
susceptible to the effects of violent media than are low trait aggressive individuals<br />
because they possess a relatively large network of aggressive associations that can<br />
be activated by violent cues. Habitual exposure to television violence might be<br />
partially responsible. (P. 959)<br />
Note that this explanation relies more on speculation than on the actual empirical evidence<br />
from this particular experiment. Nonetheless, by proposing a reasonable causal<br />
mechanism that connects the variation in the independent <strong>and</strong> dependent variables,<br />
Bushman (1995) strengthens the argument for the causal validity of his conclusions.<br />
It is often possible to go beyond speculation by designing research to test one or more possible<br />
causal mechanisms. Perhaps other researchers will design a new study to measure<br />
directly the size of individuals’ networks of aggressive associations that Bushman (1995) contends<br />
are part of the mechanism by which video violence influences aggressive behavior.
05-Bachman-45191.qxd 12/11/2006 8:21 PM Page 150<br />
150<br />
Context<br />
THE PRACTICE OF RESEARCH IN CRIMINOLOGY AND CRIMINAL JUSTICE<br />
In the social world, it is virtually impossible to claim that one <strong>and</strong> only one independent<br />
variable is responsible for causing or affecting a dependent variable. Stated another way,<br />
no cause can be separated from the larger context in which it occurs. A cause is really only<br />
one of a set of interrelated factors required for the effect (Hage & Meeker 1988; Papineau<br />
1978). When relationships among variables differ across geographic units like counties<br />
or across other social settings, researchers say there is a contextual effect. Identification<br />
of the context in which a causal relationship occurs can help us to underst<strong>and</strong> that<br />
relationship.<br />
Some researchers argue that we do not fully underst<strong>and</strong> the causal effect of media violence<br />
on behavioral aggression unless we have identified these other related factors. As we<br />
have just seen, Bushman (1995) proposed at the outset of his research at least one other condition:<br />
Media violence would increase aggression only among individuals who were already<br />
predisposed to aggression.<br />
Identification of the context in which a causal effect occurs is not a criterion for a valid<br />
causal conclusion. Some contextual factors may not turn out to be causes of the effect being<br />
investigated. <strong>The</strong> question for researchers is, “How many contexts should we investigate?”<br />
In a classic study of children’s aggressive behavior in response to media violence, B<strong>and</strong>ura,<br />
Ross, <strong>and</strong> Ross (1963) examined several contextual factors. <strong>The</strong>y found that effects varied<br />
with the children’s gender <strong>and</strong> with the gender of the opponent toward whom they acted<br />
aggressively, but not with whether they saw a real (acted) or filmed violent incident. For<br />
example, children reacted more aggressively after observing men committing violent acts<br />
than after observing women committing these same acts. But B<strong>and</strong>ura et al. did not<br />
address the role of violence within the children’s families or the role of participation in<br />
sports or many other factors that could be involved in children’s responses to media violence.<br />
B<strong>and</strong>ura et al. strengthened their conclusions by focusing on a few likely contextual<br />
factors.<br />
Specifying the context for a causal effect helps us to underst<strong>and</strong> that effect, but it is a<br />
process that can never really be complete. We can always ask what else might be important:<br />
In which country was the study conducted? What are the ages of the study participants? We<br />
need to carefully review the results of prior research <strong>and</strong> the implications of relevant theory<br />
to determine what contextual factors are likely to be important in a causal relationship. Our<br />
confidence in causal conclusions will be stronger when we know these factors are taken into<br />
account.<br />
In summary, before researchers can infer a causal relationship between two variables,<br />
three criteria are essential: empirical association, appropriate time order, <strong>and</strong> nonspuriousness.<br />
After these three conditions have been met, two other criteria are also important:<br />
causal mechanism <strong>and</strong> context.<br />
RESEARCH DESIGNS AND CAUSALITY<br />
How research is designed influences our ability to draw causal conclusions. Obviously, if<br />
you conclude that playing violent video games causes violent behavior after watching your
05-Bachman-45191.qxd 12/11/2006 8:21 PM Page 151<br />
8-year-old nephew playing a violent video game <strong>and</strong> then hitting his 4-year-old brother,<br />
you would be on shaky empirical ground. In this section, we will introduce features that<br />
need to be considered in a research design in order to evaluate how well it can support<br />
nomothetic causal conclusions.<br />
True Experiments<br />
In a true experiment, the time order is determined by the researcher. <strong>The</strong> experimental<br />
design provides the most powerful design for testing causal hypotheses about the effect of<br />
a treatment or some other variable whose values can be manipulated by the researchers.<br />
It is so powerful for testing causal hypotheses because it allows us to establish the three criteria<br />
for causality with a great deal of confidence. <strong>The</strong> Bushman (1995) study we examined<br />
in the last section was a true experiment.<br />
True experiments must have at least three things:<br />
1. Two comparison groups, one receiving the experimental condition (e.g., treatment<br />
or intervention) termed the experimental group <strong>and</strong> the other receiving no<br />
treatment or intervention or another form thereof, termed the control group.<br />
2. R<strong>and</strong>om assignment to the two (or more) comparison groups.<br />
3. Assessment of change in the dependent variable for both groups after the<br />
experimental condition has been received.<br />
<strong>The</strong> combination of these features permits us to have much greater confidence in the<br />
validity of causal conclusions than is possible in other research designs. Confidence in<br />
the validity of an experiment’s findings is further enhanced by identification of the causal<br />
mechanism <strong>and</strong> control over the context of an experiment. We will discuss a experimental<br />
designs in more detail in the next chapter (see Chapter 6). For now, we want to highlight<br />
how true experimental designs lend themselves to meeting the criteria necessary for<br />
causality.<br />
Causality <strong>and</strong> True Experimental <strong>Design</strong>s<br />
CHAPTER 5 <strong>Causation</strong> <strong>and</strong> <strong>Research</strong> <strong>Design</strong> 151<br />
A prerequisite for meeting each of the three criteria to identify causal relations is<br />
maintaining control over the conditions subjects are exposed to after they are assigned<br />
to the experimental <strong>and</strong> comparison groups. If these conditions begin to differ, the<br />
variation between the experimental <strong>and</strong> comparison groups will not be what was<br />
intended. Even a subsequent difference in the distribution of cases on the dependent<br />
variable will not provide clear evidence of the effect of the independent variable. Such<br />
unintended variation is often not much of a problem in laboratory experiments where the<br />
researcher has almost complete control over the conditions <strong>and</strong> can ensure that these<br />
conditions are nearly identical for both groups. But control over conditions can become<br />
a very big concern for experiments that are conducted in the field in real-world settings,<br />
such as Sherman <strong>and</strong> Berk’s (1984) study of the deterrent effects of arrest on intimate<br />
partner assaults.
05-Bachman-45191.qxd 12/11/2006 8:21 PM Page 152<br />
152<br />
THE PRACTICE OF RESEARCH IN CRIMINOLOGY AND CRIMINAL JUSTICE<br />
Let us examine how well true experiments meet the criteria necessary for establishing<br />
causality in greater detail:<br />
Association between the hypothesized independent <strong>and</strong> dependent variables. As you have seen,<br />
experiments can provide unambiguous evidence of association by r<strong>and</strong>omly assigning<br />
subjects to experimental <strong>and</strong> comparison groups.<br />
Time order of effects of one variable on the others. Unquestionably, the independent variable<br />
(treatment of condition) preceded the posttest measures the experiments described so far.<br />
For example, arrest for partner abuse preceded recidivism in the Sherman <strong>and</strong> Berk (1984)<br />
study, <strong>and</strong> the exposure to media violence preceded the aggression in the Bushman (1995)<br />
experiment. In experiments with a pretest, time order can be established by comparing<br />
posttest to pretest scores. In experiments with r<strong>and</strong>om assignment of subjects to the<br />
experimental <strong>and</strong> comparison groups, time order can be established by comparison of<br />
posttest scores only.<br />
Nonspurious relationships between variables. Nonspuriousness is difficult to establish; some<br />
would say it is impossible to establish in nonexperimental designs. <strong>The</strong> r<strong>and</strong>om assignment<br />
of subjects to experimental <strong>and</strong> comparison groups makes true experiments powerful<br />
designs for testing causal hypotheses. R<strong>and</strong>om assignment controls a host of possible extraneous<br />
influences that can create misleading, spurious relationships in both experimental<br />
<strong>and</strong> nonexperimental data. If we determine that a design has used r<strong>and</strong>omization successfully,<br />
we can be much more confident in the causal conclusions.<br />
Mechanism that creates the causal effect. <strong>The</strong> features of true experiment do not, in themselves,<br />
allow identification of causal mechanisms; as a result there can be some ambiguity<br />
about how the independent variable influenced the dependent variable <strong>and</strong> the causal<br />
conclusions.<br />
Context in which change occurs. Control over conditions is more feasible in many experimental<br />
designs than it is in nonexperimental designs, but it is often difficult to control conditions<br />
in field experiments. In the next chapter, you will learn how the lack of control over<br />
experimental conditions can threaten internal validity.<br />
Nonexperimental <strong>Design</strong>s<br />
Nonexperimental research designs can be either cross-sectional or longitudinal. In a<br />
cross-sectional research design, all data are collected at one point in time. Identifying the<br />
time order of effects—what happened first, <strong>and</strong> so on—is critical for developing a causal<br />
analysis, but can be an insurmountable problem with a cross-sectional design. In longitudinal<br />
research designs, data are collected at two or more points in time, <strong>and</strong> so identification<br />
of the time order of effects can be quite straightforward. An experiment, of<br />
course, is a type of longitudinal design because subjects are observed at 2 or more points<br />
in time.
05-Bachman-45191.qxd 12/11/2006 8:21 PM Page 153<br />
Cross-Sectional <strong>Design</strong>s<br />
Much of the research you have encountered so far in this text has been cross-sectional.<br />
Although each of surveys <strong>and</strong> interviews take some time to carry out, if they measure the<br />
actions, attitudes, <strong>and</strong> characteristics of respondents at only one time, they are considered<br />
cross-sectional. <strong>The</strong> name comes from the idea that a snapshot from a cross-section of the<br />
population is obtained at one point in time.<br />
As you learned in chapter 3, Sampson <strong>and</strong> Raudenbush (1999) used a very ambitious crosssectional<br />
design to study the effect of visible public social <strong>and</strong> physical disorder on the crime<br />
rate in Chicago neighborhoods. <strong>The</strong>ir theoretical framework focused on the concept of informal<br />
social control: the ability of residents to regulate social activity in their neighborhoods<br />
through their collective efforts according to desired principles. <strong>The</strong>y believed that informal<br />
social control would vary between neighborhoods, <strong>and</strong> they hypothesized that it was the<br />
strength of informal social control that would explain variation in crime rates rather than just<br />
the visible sign of disorder. <strong>The</strong>y contrasted this prediction to the “broken windows” theory: the<br />
belief that signs of disorder themselves cause crime. <strong>The</strong>ir findings supported their hypothesis:<br />
both visible disorder <strong>and</strong> crime were consequences of low levels of informal social control<br />
(measured with an index of “collective efficacy”). One did not cause the other (see Exhibit 5.3).<br />
EXHIBIT 5.3 <strong>The</strong> Effect of Informal Social Control<br />
“Broken windows” theory<br />
Social<br />
Disorder<br />
Informal social control theory<br />
Source: Based on Sampson & Raudenbush 1999:635.<br />
Collective<br />
Efficacy<br />
CHAPTER 5 <strong>Causation</strong> <strong>and</strong> <strong>Research</strong> <strong>Design</strong> 153<br />
Crime<br />
Social<br />
Disorder<br />
Crime<br />
In spite of these compelling findings (see Exhibit 5.4), Sampson <strong>and</strong> Raudenbush’s (1999)<br />
cross-sectional design could not establish directly that the variation in the crime rate<br />
occurred after variation in informal social control. Maybe it was a high crime rate that led<br />
residents to stop trying to exert much control over deviant activities in the neighborhood,<br />
perhaps because of fear of crime. It is difficult to discount such a possibility when only<br />
cross-sectional data are available.
05-Bachman-45191.qxd 12/11/2006 8:21 PM Page 154<br />
154<br />
THE PRACTICE OF RESEARCH IN CRIMINOLOGY AND CRIMINAL JUSTICE<br />
EXHIBIT 5.4 Effect of Social Disorder <strong>and</strong> Collective Efficacy on Personal Violent Crimes<br />
Size<br />
of<br />
Effect<br />
on<br />
Crime<br />
Rate<br />
1.0<br />
0.5<br />
0.0<br />
−0.5<br />
−1.0<br />
Source: Adapted from Sampson & Raudenbush 1999.<br />
Social disorder Collective efficacy<br />
<strong>The</strong>re are four special circumstances in which we can be more confident in drawing conclusions<br />
about time order on the basis of cross-sectional data. Because in these special circumstances<br />
the data can be ordered in time, they might even be thought of as longitudinal<br />
designs (Campbell 1992).<br />
<strong>The</strong> independent variable is fixed at some point prior the variation in the dependent variable.<br />
So-called demographic variables that are determined at birth—such as sex, race, <strong>and</strong> age—<br />
are fixed in this way. So are variables like education <strong>and</strong> marital status, if we know when<br />
the value of cases on these variables was established <strong>and</strong> if we know that the value of cases<br />
on the dependent variable was set some time afterward. For example, say we hypothesize<br />
that educational opportunities in prison affect recidivism rates. Let us say we believe those<br />
inmates who are provided with greater educational <strong>and</strong> vocational opportunities in prison<br />
will be less likely to reoffend after release from prison. If we know that respondents completed<br />
their vocational or other educational training before leaving prison, we would satisfy<br />
the time order requirement even if we were to measure education at the same time we<br />
measure recidivism after release. However, if some respondents possibly went back to<br />
school after prison release, the time order requirement would not be satisfied.<br />
We believe that respondents can give us reliable reports of what happened to them or what they<br />
thought at some earlier point in time. Horney, Osgood, <strong>and</strong> Marshall (1995) provide an interesting<br />
example of the use of such retrospective data. <strong>The</strong> researchers wanted to identify how<br />
criminal activity varies in response to changes in life circumstances. <strong>The</strong>y interviewed 658<br />
newly convicted male offenders sentenced to a Nebraska state prison. In a 45- to 90-minute<br />
interview, they recorded each inmate’s report of his life circumstances <strong>and</strong> of his criminal<br />
activities for the preceding 2 to 3 years. <strong>The</strong>y then found that criminal involvement was<br />
related strongly to adverse changes in life circumstances, such as marital separation or drug<br />
use. Retrospective data are often inadequate for measuring variation in past psychological<br />
states or behaviors, however, because what we recall about our feeling or actions in the past
05-Bachman-45191.qxd 12/11/2006 8:21 PM Page 155<br />
is likely to influenced by what we feel in the present. For example, retrospective reports by<br />
both adult alcoholics <strong>and</strong> their parents appear to greatly overestimate the frequency of<br />
childhood problems (Vaillant 1995). People cannot report reliably the frequency <strong>and</strong><br />
timing of many past events, from hospitalization to hours worked. However, retrospective data<br />
tend to be reliable when it concerns major, persistent experiences in the past, such as what<br />
type of school someone went to or how a person’s family was structured (Campbell 1992).<br />
Our measures are based on records that contain information on cases in earlier periods.<br />
Government, agency, <strong>and</strong> organizational records are an excellent source of time-ordered<br />
data after the fact. However, sloppy record keeping <strong>and</strong> changes in data-collection policies<br />
can lead to inconsistencies, which must be taken into account. Another weakness of such<br />
archival data is that they usually contain measures of only a fraction of the variables that<br />
we think are important.<br />
We know that the value of the dependent variable was similar for all cases prior to the treatment.<br />
For example, we may hypothesize that an anger management program (independent<br />
variable) improves the conflict resolution abilities (dependent variable) of individuals<br />
arrested for intimate partner assault. If we know that none of the arrested individuals could<br />
employ verbal techniques for resolving conflict prior to the training program, we can be<br />
confident that any subsequent variation in their ability do so did not precede exposure to<br />
the training program. This is one way that traditional experiments establish time order: Two<br />
or more equivalent groups are formed prior to exposing one of them to some treatment.<br />
Longitudinal <strong>Design</strong>s<br />
CHAPTER 5 <strong>Causation</strong> <strong>and</strong> <strong>Research</strong> <strong>Design</strong> 155<br />
In longitudinal research, data are collected at 2 or more points in time <strong>and</strong>, as such, data<br />
can be ordered in time. By measuring the value of cases on an independent variable <strong>and</strong> a<br />
dependent variable at different times, the researcher can determine whether variation in the<br />
independent variable precedes variation in the dependent variable.<br />
In some longitudinal designs, the same sample (or panel) is followed over time; in other<br />
designs, sample members are rotated or completely replaced. <strong>The</strong> population from which<br />
the sample is selected may be defined broadly, as when a longitudinal survey of the general<br />
population is conducted. Or the population may be defined narrowly, as when members of<br />
a specific age group are sampled at multiple points in time. <strong>The</strong> frequency of follow-up measurement<br />
can vary, ranging from a before-<strong>and</strong>-after design with just one follow-up to studies<br />
in which various indicators are measured every month for many years.<br />
Certainly it is more difficult to collect data at two or more points in time than at one time.<br />
Quite frequently researchers simply cannot, or are unwilling to, delay completion of a study<br />
for even 1 year in order to collect follow-up data. But think of the many research questions<br />
that really should involve a much longer follow-up period: Does community-oriented policing<br />
decrease rates of violent crime? What is the impact of job training in prison on recidivism<br />
rates? How effective are batterer-treatment programs for individuals convicted of<br />
intimate partner assault? Do parenting programs for young mothers <strong>and</strong> fathers reduce the<br />
likelihood of their children becoming delinquent? It is safe to say that we will never have<br />
enough longitudinal data to answer many important research questions. Nonetheless, the<br />
value of longitudinal data is so great that every effort should be made to develop longitudinal<br />
research designs when they are appropriate for the research question asked. <strong>The</strong>
05-Bachman-45191.qxd 12/11/2006 8:21 PM Page 156<br />
156<br />
THE PRACTICE OF RESEARCH IN CRIMINOLOGY AND CRIMINAL JUSTICE<br />
EXHIBIT 5.5 Three Types of Longitudinal <strong>Design</strong><br />
Repeated<br />
Cross-Sectional<br />
<strong>Design</strong><br />
(Trend Study)<br />
Fixed-Sample<br />
Panel <strong>Design</strong><br />
(Panel Study)<br />
Event-Based<br />
<strong>Design</strong><br />
(Cohort Study)<br />
Time 1 Time 2<br />
Class of . . . Class of . . .<br />
2004 2005 2006 2004 2005 2006<br />
following discussion of the three major types of longitudinal designs will give you a sense<br />
of the possibilities (see Exhibit 5.5).<br />
Repeated Cross-Sectional <strong>Design</strong>s<br />
Studies that use a repeated cross-sectional design, also known as trend studies, have<br />
become fixtures of the political arena around election time. Particularly in presidential election<br />
years, we have all become accustomed to reading weekly, even daily, reports on the percentage<br />
of the population that supports each c<strong>and</strong>idate. Similar polls are conducted to track<br />
sentiment on many other social issues. For example, a 1993 poll reported that 52% of adult<br />
Americans supported a ban on the possession of h<strong>and</strong>guns, compared to 41% in a similar<br />
poll conducted in 1991. According to pollster Louis Harris, this increase indicated a “sea<br />
change” in public attitudes (cited in Barringer 1993). Another researcher said, “It shows that<br />
peoples are responding to their experience [of an increase in h<strong>and</strong>gun-related killings]”<br />
(cited in Barringer 1993:A14).<br />
Repeated cross-sectional design (trend study) A type of longitudinal study in which data<br />
are collected at two or more points in time from different samples of the same population.
05-Bachman-45191.qxd 12/11/2006 8:21 PM Page 157<br />
Repeated cross-sectional surveys are conducted as follows:<br />
1. A sample is drawn from a population at Time 1, <strong>and</strong> data are collected from the<br />
sample.<br />
2. As time passes, some people leave the population <strong>and</strong> others enter it.<br />
3. At Time 2, a different sample is drawn from this population.<br />
<strong>The</strong>se features make the repeated cross-sectional design appropriate when the goal is to<br />
determine whether a population has changed over time. Has racial tolerance increased<br />
among Americans in the past 20 years? Are prisons more likely to have drug-treatment programs<br />
available today than they were in the 1950s? <strong>The</strong>se questions concern changes in the<br />
population as a whole, not changes in individuals within the population. We want to know<br />
whether racial tolerance increased in society, not whether this change was due to migration<br />
that brought more racially tolerant people into the country or to individual U.S. citizens<br />
becoming more tolerant. We are asking whether state prisons overall are more likely to have<br />
drug-treatment programs available today than they were a decade or two decades ago, not<br />
whether any such increase was due to an increase in prisoner needs or to individual prisons<br />
changing their program availability. When we do need to know whether individuals in<br />
the population changed, we must turn to a panel design.<br />
Fixed-Sample Panel <strong>Design</strong>s<br />
CHAPTER 5 <strong>Causation</strong> <strong>and</strong> <strong>Research</strong> <strong>Design</strong> 157<br />
Panel designs allow us to identify changes in individuals, groups, or whatever we are studying.<br />
This is the process for conducting fixed-sample panel designs:<br />
1. A sample (called a panel) is drawn from a population at Time 1, <strong>and</strong> data are<br />
collected from the sample.<br />
2. As time passes, some panel members become unavailable for follow-up, <strong>and</strong> the<br />
population changes.<br />
3. At time 2, data are collected from the same people as at Time 1 (the panel), except<br />
for those people who cannot be located.<br />
Fixed-sample panel design (panel study) A type of longitudinal study in which data are<br />
collected from the same individuals—the panel—at two or more points in time. In another<br />
type of panel design, panel members who leave are replaced with new members.<br />
Because a panel design follows the same individuals, it is better than a repeated crosssectional<br />
design for testing causal hypotheses. For example, Sampson <strong>and</strong> Laub (1990) used<br />
a fixed-sample panel design to investigate the effect of childhood deviance on adult crime.<br />
<strong>The</strong>y studied a sample of white males in Boston when the subjects were between 10 <strong>and</strong><br />
17 years old <strong>and</strong> then followed up when the subjects were in their adult years. Data were<br />
collected from multiple sources, including the subjects themselves <strong>and</strong> criminal justice
05-Bachman-45191.qxd 12/11/2006 8:21 PM Page 158<br />
158<br />
THE PRACTICE OF RESEARCH IN CRIMINOLOGY AND CRIMINAL JUSTICE<br />
records. Sampson <strong>and</strong> Laub (p. 614) found that children who had been committed to a<br />
correctional school for persistent delinquency were much more likely than other children<br />
in the study to commit crimes as adults: 61% were arrested between the ages of 25 <strong>and</strong> 32,<br />
compared to 14% of those who had not been in correctional schools as juveniles. In this<br />
study, juvenile delinquency unquestionably occurred before adult criminality. If the<br />
researchers had used a cross-sectional design to study the past of adults, the juvenile delinquency<br />
measure might have been biased by memory lapses, by self-serving recollections<br />
about behavior as juveniles, or by loss of agency records.<br />
If you now wonder why every longitudinal study is not designed as a panel study, you have<br />
understood the advantages of panel designs. However, remember that this design does not<br />
in itself establish causality. Variation in both the independent variable <strong>and</strong> the dependent<br />
variables may be due to some other variable, even to earlier variation in what is considered<br />
the dependent variable. In the example in Exhibit 5.6, there is a hypothesized association<br />
between delinquency in the 11th grade <strong>and</strong> grades obtained in the 12th grade (the dependent<br />
variable). <strong>The</strong> time order is clear. However, both variables are consequences of grades<br />
obtained in the 7th grade. <strong>The</strong> apparent effect of 11th-grade delinquency on 12th-grade<br />
grades is spurious because of variation in the dependent variable (grades) at an earlier time.<br />
Panel designs are also a challenge to implement successfully, <strong>and</strong> often are not even<br />
attempted, because of two major difficulties:<br />
Expense <strong>and</strong> attrition. It can be difficult, <strong>and</strong> very expensive, to keep track of individuals<br />
over a long period, <strong>and</strong> inevitably the proportion of panel members who can be located<br />
for follow-up will decline over time. Panel studies often lose more than one quarter of<br />
their members through attrition (Miller 1991:170), <strong>and</strong> those who are lost are often not<br />
EXHIBIT 5.6 Causality in Panel Studies<br />
Panel’s grades<br />
in 7th grade<br />
Panel’s<br />
delinquency<br />
in 8th grade<br />
Panel’s<br />
delinquency<br />
in 11th grade<br />
Hypothesized<br />
Independent<br />
Variable<br />
Dependent Variable<br />
Panel’s grades<br />
in 12th grade<br />
Although delinquency in the 11th grade <strong>and</strong> grades in the 12th grade<br />
are clearly associated <strong>and</strong> the time order is clear, causality cannot be<br />
assumed. In reality, grades in the 7th grade also play a role.<br />
Spurious Effect
05-Bachman-45191.qxd 12/11/2006 8:21 PM Page 159<br />
necessarily like those who remain in the panel. As a result, a high rate of subject attrition<br />
may mean that the follow-up sample will no longer be representative of the population from<br />
which it was drawn <strong>and</strong> may no longer provide a sound basis for estimating change.<br />
Subjects who were lost to follow-up may have been those who changed the most, or the<br />
least, over time. For example, between 5% <strong>and</strong> 66% of subjects are lost in substance abuse<br />
prevention studies, <strong>and</strong> the dropouts typically had begun the study with higher rates of<br />
tobacco <strong>and</strong> marijuana use (Snow, Tebes, & Arthur 1992:804).<br />
It does help to compare the baseline characteristics of those who are interviewed at<br />
follow-up with characteristics of those lost to follow-up. If these two groups of panel<br />
members were not very different at baseline, it is less likely that changes had anything to<br />
do with characteristics of the missing panel members. Even better, subject attrition can be<br />
reduced substantially if sufficient staff can be used to keep track of panel members. In their<br />
panel study, Sampson <strong>and</strong> Laub (1990) lost only 12% of the juveniles in the original<br />
sample (8% if you do not count those who had died).<br />
Subject fatigue. Panel members may grow weary of repeated interviews <strong>and</strong> drop out of the<br />
study, or they may become so used to answering the st<strong>and</strong>ard questions in the survey that<br />
they start giving stock answers rather than actually thinking about their current feelings or<br />
actions (Campbell 1992). This is called the problem of subject fatigue. Fortunately, subjects<br />
do not often seem to become fatigued in this way, particularly if the research staff have<br />
maintained positive relations with the subjects. For example, at the end of an 18-month-long<br />
experimental study of housing alternatives for persons with mental illness who had been<br />
homeless, only 3 or 4 individuals (out of 93 who could still be located) refused to participate<br />
in the fourth <strong>and</strong> final round of interviews. <strong>The</strong> interviews took a total of about 5 hours<br />
to complete, <strong>and</strong> participants received about $50 for their time (Schutt, Goldfinger, &<br />
Penk 1997).<br />
Because panel studies are so useful, social researchers have developed increasingly effective<br />
techniques for keeping track of individuals <strong>and</strong> overcoming subject fatigue. But when<br />
resources do not permit use of these techniques to maintain an adequate panel, repeated<br />
cross-sectional designs usually can be employed at a cost that is not a great deal higher than<br />
that of a one-time-only cross-sectional study. <strong>The</strong> payoff in explanatory power should be<br />
well worth the cost.<br />
Event-Based <strong>Design</strong>s<br />
CHAPTER 5 <strong>Causation</strong> <strong>and</strong> <strong>Research</strong> <strong>Design</strong> 159<br />
In an event-based design, often called a cohort study, the follow-up samples (at one or more<br />
times) are selected from the same cohort: people who all have experienced a similar event<br />
or a common starting point. Examples include the following:<br />
• Birth cohorts: those who share a common period of birth (those born in the 1940s,<br />
1950s, 1960s, etc.)<br />
• Seniority cohorts: those who have worked at the same place for about 5 years,<br />
about 10 years, <strong>and</strong> so on<br />
• School cohorts: freshmen, sophomores, juniors, <strong>and</strong> seniors
05-Bachman-45191.qxd 12/11/2006 8:21 PM Page 160<br />
160<br />
THE PRACTICE OF RESEARCH IN CRIMINOLOGY AND CRIMINAL JUSTICE<br />
Event-based design (cohort study) A type of longitudinal study in which data are collected<br />
at two or more points in time from individuals in a cohort.<br />
Cohort Individuals or groups with a common starting point. Examples include college class<br />
of 1997, people who graduated from high school in the 1980s, Federal Bureau of Prisons’<br />
employees who started work between the years 1990 <strong>and</strong> 2000, <strong>and</strong> people who were born<br />
in the late 1940s or the 1950s (the “baby boom generation”).<br />
An event-based design can be a type of repeated cross-sectional design or a type of panel<br />
design. In an event-based repeated cross-sectional design, separate samples are drawn from<br />
the same cohort at two or more different times. In an event-based panel design, the same<br />
individuals from the same cohort are studies at two or more different times.<br />
Causality in Nonexperimental <strong>Design</strong>s<br />
How well do the research designs just described satisfy the criteria necessary to determine<br />
causality? Although it is relatively easy to establish that an empirical association exists<br />
between an independent <strong>and</strong> dependent variable in these designs, the other criteria are<br />
much more difficult to assess.<br />
Let us first illustrate the importance of time-order <strong>and</strong> nonspuriousness using research<br />
that has examined the factors related to the gender <strong>and</strong> crime relationship. Based on both<br />
victimization data <strong>and</strong> official police reports, data indicate that males commit the majority<br />
of all crime. Why is this? Gottfredson <strong>and</strong> Hirschi’s General <strong>The</strong>ory of Crime (GTC) contends<br />
that the reason males engage in more criminality is because they have lower levels of selfcontrol<br />
than females. <strong>The</strong>y also contend that socialization of children by parents is the primary<br />
factor in the development of self-control. However, based on a critique of the GTC by<br />
Miller <strong>and</strong> Burack (1993) <strong>and</strong> the power-control theory (Hagan, Gillis, <strong>and</strong> Simpson 1985),<br />
Blackwell <strong>and</strong> Piquero (2005) hypothesized that the power relationships that exist between<br />
parents in a household (e.g., patriarchy) would also affect the socialization experiences of<br />
boys <strong>and</strong> girls, <strong>and</strong> ultimately their levels of self-control. To summarize briefly, Blackwell<br />
<strong>and</strong> Piquero examined the factors related to self-control acquisition in childhood using a<br />
sample of adults. Using this same sample of adults, they then examined the extent to which<br />
low-self control predicted the propensity of for criminal offending. In a nutshell, they sought<br />
to explain the origins of self-control as well as the effects of self-control on criminal offending,<br />
<strong>and</strong> how all this may be different for males <strong>and</strong> females from patriarchal families <strong>and</strong><br />
for males <strong>and</strong> females from more egalitarian families. Using a r<strong>and</strong>om sample of 350 adults<br />
from Oklahoma City in 1994, they found that there were indeed differences in the way<br />
power relationships between parents affected the acquisition of self-control for males <strong>and</strong><br />
females. <strong>The</strong>y also found, however, that there were essentially no differences in the ability<br />
of self-control to predict criminal aspirations; males <strong>and</strong> females with low self-control were<br />
more likely to self-report that they would engage in criminal behavior than their higher selfcontrol<br />
counterparts.
05-Bachman-45191.qxd 12/11/2006 8:21 PM Page 161<br />
CHAPTER 5 <strong>Causation</strong> <strong>and</strong> <strong>Research</strong> <strong>Design</strong> 161<br />
Do these findings establish that low self-control leads to crime through poor socialization<br />
of children by parents? Well, there are many assumptions being made here that<br />
we hope you can see right away. First, this study relied on the recollections of adults about<br />
their childhood socialization. It also assumed that levels of low self-control were subsequent<br />
to parental socialization <strong>and</strong> preceded individuals’ aspirations to offend (time<br />
order). This may very well be the case. It may be that those adults who were more likely<br />
to offend had inadequate socialization, which created low self-control. However, it may<br />
be that offending behavior during their adolescence led to weak attachments to family<br />
<strong>and</strong> high attachments to other delinquent peers like themselves, which also decreased<br />
levels of self-control. In this case, the delinquent offending <strong>and</strong> peer associations would<br />
be a third variable responsible for both the low self-control <strong>and</strong> the criminal aspirations<br />
in adulthood (e.g., spurious relationship). <strong>The</strong> problem, of course, is that with cross-sectional<br />
data like this, the correct time-order cannot be established <strong>and</strong> it is difficult to<br />
control for the effects of all important factors. Blackwell <strong>and</strong> Piquero (2005) stated this<br />
limitation well when they concluded, “Future research should attempt to examine the<br />
changing nature of parental socialization <strong>and</strong> self-control across gender in longitudinal<br />
studies” (p. 15).<br />
To reduce the risk of spuriousness, Blackwell <strong>and</strong> Piquero (2005) used the technique of<br />
statistical control. Exhibit 5.7 represents the important concept of statistical control with a<br />
hypothetical study of the relationship between attending a boot camp in prison (a highly<br />
regimented, discipline-focused rehabilitation program) <strong>and</strong> the likelihood of committing<br />
crimes after prison (the recidivism rate). In Exhibit 5.7, the data for all prisoners show that<br />
prisoners who attended boot camp were less likely to return to committing crimes after they<br />
left prison. However, as the more detailed data show, more female prisoners attended boot<br />
camp than male prisoners, so gender may have played a significant role in recidivism. <strong>The</strong><br />
researchers, however, reduced the risk of spuriousness by using two statistical control methods:<br />
<strong>The</strong>y examined the association between attending boot camp <strong>and</strong> post-prison criminality<br />
for men <strong>and</strong> for women. After doing this, researchers determine that boot camp did<br />
not reduce recidivism. It just appeared to do so, because women were more likely to attend<br />
boot camp <strong>and</strong> less likely to commit crimes after prison, regardless of whether they<br />
attended boot camp.<br />
Similarly, Sampson <strong>and</strong> Raudenbush (1999) designed their study, in part, to determine<br />
whether the apparent effect of visible disorder on crime—the “broken windows” thesis—<br />
was spurious due to the effect of informal social control (see Exhibit 5.3). Exhibit 5.8 shows<br />
how statistical control was used to test this possibility. <strong>The</strong> data for all neighborhoods show<br />
that neighborhoods with much visible disorder had higher crime rates than those with less<br />
visible disorder. However, when we examine the relationship between visible disorder <strong>and</strong><br />
neighborhood crime rate separately for neighborhoods with high <strong>and</strong> low levels of informal<br />
social control, that is, when we statistically control for social control level, we see that<br />
the crime rate no longer varies with visible disorder. <strong>The</strong>refore, we must conclude that the<br />
apparent effect of “broken windows” was spurious due to level of informal social control.<br />
Neighborhoods with low levels of social control were more likely to have high levels of visible<br />
social <strong>and</strong> physical disorder, <strong>and</strong> they were also more likely to have a high crime rate,<br />
but the visible disorder itself did not alter the crime rate.
05-Bachman-45191.qxd 12/11/2006 8:21 PM Page 162<br />
162<br />
recidivate<br />
Did not<br />
recidivate<br />
THE PRACTICE OF RESEARCH IN CRIMINOLOGY AND CRIMINAL JUSTICE<br />
EXHIBIT 5.7 <strong>The</strong> Use of Statistical Control to Reduce Spuriousness<br />
recidivated<br />
Did not<br />
recidivate<br />
Female prisoners<br />
n = 150<br />
Attended<br />
boot camp<br />
n = 100<br />
40<br />
60<br />
Attended<br />
boot camp<br />
n = 160<br />
All prisoners<br />
n = 350<br />
75 105<br />
85 85<br />
Old not attend<br />
boot camp<br />
n = 50<br />
20<br />
30<br />
Old not attend<br />
boot camp<br />
n = 190<br />
Male Prisoners<br />
n = 200<br />
Attended<br />
boot camp<br />
n = 50<br />
30 90<br />
20<br />
Old not attend<br />
boot camp<br />
n = 150<br />
60<br />
Recidivism rate<br />
Recidivism rate<br />
40%<br />
40 or 100<br />
female<br />
prisoners<br />
Attended<br />
boot camp<br />
47%<br />
75 or 150<br />
prisoners<br />
Attended<br />
boot camp<br />
40%<br />
20 or 50<br />
female<br />
prisoners<br />
Old not attend<br />
boot camp<br />
55%<br />
105 or 190<br />
prisoners<br />
Old not attend<br />
boot camp<br />
60% 60%<br />
30 or 50<br />
male<br />
prisoners<br />
90 or150<br />
male<br />
prisoners<br />
Attended Old not attend<br />
boot camp boot camp<br />
Female prisoners Male prisoners<br />
Statistical control A technique used in nonexperimental research to reduce the risk of<br />
spuriousness. One variable is held constant so the relationship between two or more other<br />
variables can be assessed without the influence of variation in the control variable.<br />
Example of statistical control: Sampson (1987) found that the relationship between rates<br />
of family disruption <strong>and</strong> violent crimes held true for cities with similar levels of<br />
joblessness (the control variable). So the rate of joblessness could not have caused the<br />
association between family disruption <strong>and</strong> violent crime.<br />
Our confidence in causal conclusions based on nonexperimental research also increases<br />
with identification of a causal mechanism. <strong>The</strong>se mechanisms are called intervening variables<br />
in nonexperimental research, <strong>and</strong> help us to underst<strong>and</strong> how variation in the independent variable<br />
results in variation in the dependent variable. For example, in a study that reanalyzed data<br />
from Glueck <strong>and</strong> Glueck’s (1950) pathbreaking study of juvenile delinquency, Sampson <strong>and</strong>
05-Bachman-45191.qxd 12/11/2006 8:21 PM Page 163<br />
EXHIBIT 5.8 <strong>The</strong> Use of Statistical Control to Reduce Spuriousness<br />
Crime<br />
Rate<br />
Independent<br />
Variable<br />
Structural<br />
disadvantage<br />
Family poverty<br />
Geographic<br />
mobility<br />
Low High<br />
Amount of Visible<br />
Disorder<br />
Source: Based on Sampson & Raudenbush 1999.<br />
Crime<br />
Rate<br />
Low<br />
Low<br />
Intervening Variable<br />
(causal mechanism)<br />
Informal<br />
social control:<br />
Low parent-child<br />
attachment<br />
Low maternal supervison<br />
More erratic or harsh<br />
discipline<br />
CHAPTER 5 <strong>Causation</strong> <strong>and</strong> <strong>Research</strong> <strong>Design</strong> 163<br />
High<br />
Amount of Visible<br />
Disorder<br />
Crime<br />
Rate<br />
Social Control<br />
Low High<br />
Amount of Visible<br />
Disorder<br />
Laub (1994) found that children who grew up with such structural disadvantages as family<br />
poverty <strong>and</strong> geographic mobility were more likely to become juvenile delinquents. Why did this<br />
occur? <strong>The</strong>ir analysis indicated that these structural disadvantages led to lower levels of informal<br />
social control in the family (less parent-child attachment, less maternal supervision, <strong>and</strong><br />
more erratic or harsh discipline). Lower levels of informal social control resulted in a higher<br />
probability of delinquency (see Exhibit 5.9). Informal social control intervened in the relationship<br />
between structural context <strong>and</strong> delinquency.<br />
Of course, identification of one (or two or three) intervening variables does not<br />
end the possibilities for clarifying the causal mechanisms. You might ask why structural<br />
EXHIBIT 5.9 Intervening Variables in Nonexperimental <strong>Research</strong>: Structural Disadvantage<br />
<strong>and</strong> Juvenile Delinquency<br />
Source: Based on Sampson & Laub 1994.<br />
High<br />
Dependent<br />
Variable<br />
Juvenile<br />
delinquency
05-Bachman-45191.qxd 12/11/2006 8:21 PM Page 164<br />
164<br />
THE PRACTICE OF RESEARCH IN CRIMINOLOGY AND CRIMINAL JUSTICE<br />
disadvantage tends to result in lower levels of family social control or how family social<br />
control influences delinquency. You could then conduct research to identify the mechanisms<br />
that link, for example, family social control <strong>and</strong> juvenile delinquency. (Perhaps the<br />
children feel they are not cared for, so they become less concerned with conforming to<br />
social expectations.) This process could go on <strong>and</strong> on. <strong>The</strong> point is that identification of a<br />
mechanism through which the independent variable influences the dependent variable<br />
increases our confidence in the conclusion that a causal connection does indeed exist.<br />
When you think about the role of variables in causal relationships, do not confuse variables<br />
that cause spurious relationships with variables that intervene in causal relationships,<br />
even though both are third variables that do not appear in the initial hypothesis. Intervening<br />
variables help explain the relationship between the independent variable (juvenile delinquency)<br />
<strong>and</strong> the dependent variable (adult criminality).<br />
Nonexperimental research can be a very effective tool for exploring the context in which<br />
causal effects occur. Administering surveys in many different settings <strong>and</strong> to different types<br />
of individuals is usually much easier than administering various experiments. <strong>The</strong> difficulty<br />
of establishing nonspuriousness does not rule out using nonexperimental data to evaluate<br />
causal hypotheses. In fact, when enough nonexperimental data are collected to allow tests<br />
of multiple implications of the same causal hypothesis, the results can be very convincing<br />
(Freedman 1991).<br />
In any case, nonexperimental tests of causal hypotheses will continue to be popular<br />
because the practical <strong>and</strong> ethical problems in r<strong>and</strong>omly assigning people to different<br />
conditions preclude the test of many important hypotheses with an experimental design.<br />
Just remember to carefully consider possible sources of spuriousness <strong>and</strong> other problems<br />
when evaluating causal claims based on individual nonexperimental studies. In general,<br />
conclusions about causal effects based on nonexperimental studies are more likely to<br />
be valid if the comparison group is very similar to the group receiving the treatment of<br />
interest or if many potentially important variables are statistically controlled.<br />
CONCLUSION<br />
In this chapter, you have learned about two alternative meanings of causation (nomothetic<br />
<strong>and</strong> idiographic). You have studied the five criteria used to evaluate the extent to which<br />
particular research designs may achieve causally valid findings. You have learned how our<br />
ability to meet these criteria is shaped by research design features including the use of true<br />
experimental designs, the use of a cross-sectional or longitudinal designs, <strong>and</strong> use statistical<br />
control to deal with the problem of spuriousness. You have also seen why the distinction<br />
between experimental <strong>and</strong> nonexperimental designs has so many consequences for<br />
how, <strong>and</strong> how well, we are able to meet nomothetic criteria for causation.<br />
It is important to remember that the results of any particular study are part of an alwayschanging<br />
body of empirical knowledge about social reality. Thus, our underst<strong>and</strong>ings of<br />
causal relationships are always partial. <strong>Research</strong>ers always wonder whether they have omitted<br />
some relevant variables from their controls, whether their experimental results would<br />
differ if the experiment were conducted in another setting, or whether they have overlooked<br />
a critical historical event. But by using consistent definitions of terms <strong>and</strong> maintaining clear
05-Bachman-45191.qxd 12/11/2006 8:21 PM Page 165<br />
st<strong>and</strong>ards for establishing the validity of research results, <strong>and</strong> by expecting the same of<br />
others who do research, social researchers can contribute to a growing body of knowledge<br />
that can reliably guide social policy <strong>and</strong> social underst<strong>and</strong>ing.<br />
When you read the results of a social scientific study, you should now be able to evaluate<br />
critically the validity of the study’s findings. If you plan to engage in social research, you<br />
should now be able to plan an approach that will lead to valid findings. And with a good<br />
underst<strong>and</strong>ing of three dimensions of validity (measurement validity, generalizability, <strong>and</strong><br />
causal validity) under your belt, <strong>and</strong> with sensitivity also to the goal of “authenticity,” you<br />
are ready to focus on the major methods of data collection used by social scientists.<br />
KEY TERMS<br />
Association<br />
Causal effect (idiographic perspective)<br />
Causal effect (nomothetic perspective)<br />
Ceteris paribus<br />
Cohort<br />
Cohort study<br />
Context<br />
Contextual effect<br />
Counterfactual<br />
Cross-sectional research design<br />
Event-based design (cohort study)<br />
Extraneous variable<br />
Fixed-sample panel design (panel study)<br />
HIGHLIGHTS<br />
CHAPTER 5 <strong>Causation</strong> <strong>and</strong> <strong>Research</strong> <strong>Design</strong> 165<br />
Idiographic causal explanation<br />
Intervening variable<br />
Longitudinal research design<br />
Mechanism<br />
Nomothetic causal explanation<br />
Nonspuriousness<br />
R<strong>and</strong>om assignment<br />
Repeated cross-sectional design (trend study)<br />
Spurious relationship<br />
Statistical control<br />
Subject fatigue<br />
Time order<br />
Trend study<br />
• <strong>Causation</strong> can be defined in either nomothetic or idiographic terms. Nomothetic causal<br />
explanations deal with effects on average. Idiographic causal explanations deal with the<br />
sequence of events that led to a particular outcome.<br />
• <strong>The</strong> concept of nomothetic causal explanation relies on a comparison. <strong>The</strong> value of cases<br />
on the dependent variable is measured after they have been exposed to variation in an<br />
independent variable. This measurement is compared to what the value of cases on the<br />
dependent variable would have been if they had not been exposed to the variation in the<br />
independent variable (the counterfactual). <strong>The</strong> validity of nomothetic causal conclusions<br />
rests on how closely the comparison group comes to the ideal counterfactual.<br />
• From a nomothetic perspective, three criteria are generally viewed as necessary for<br />
identifying a causal relationship: association between the variables, proper time order, <strong>and</strong><br />
nonspuriousness of the association. In addition, the basis for concluding that a causal<br />
relationship exists is strengthened by identification of a causal mechanism <strong>and</strong> the<br />
context for the relationship.<br />
• Association between two variables is in itself insufficient evidence of a causal relationship.<br />
This point is commonly made with the expression “Correlation does not prove causation.”<br />
• Experiments use r<strong>and</strong>om assignment to make comparison groups as similar as possible<br />
at the outset of an experiment in order to reduce the risk of spurious effects due to<br />
extraneous variables.
05-Bachman-45191.qxd 12/11/2006 8:21 PM Page 166<br />
166<br />
THE PRACTICE OF RESEARCH IN CRIMINOLOGY AND CRIMINAL JUSTICE<br />
• Nonexperimental designs use statistical controls to reduce the risk of spuriousness.<br />
A variable is controlled when it is held constant so that the association between the<br />
independent <strong>and</strong> dependent variables can be assessed without being influenced by the<br />
control variable.<br />
• Ethical <strong>and</strong> practical constraints often preclude the use of experimental designs.<br />
• Idiographic causal explanations can be difficult to identify, because the starting <strong>and</strong><br />
ending points of particular events <strong>and</strong> the determination of which events act as causes in<br />
particular sequences may be ambiguous.<br />
• Longitudinal designs are usually preferable to cross-sectional designs for establishing<br />
the time order of effects. Longitudinal designs vary in terms of whether the same<br />
people are measured at different times, how the population of interests is defined,<br />
<strong>and</strong> how frequently follow-up measurements are taken. Fixed-sample panel<br />
designs provide the strongest test for the time order of effects, but they can be difficult<br />
to carry out successfully because of their expense as well as subject attrition <strong>and</strong><br />
fatigue.<br />
EXERCISES<br />
1. Review articles in several newspapers, copying down all causal assertions. <strong>The</strong>se might<br />
range from assertions that community policing was related to decreasing rates of<br />
violence, that the stock market declined because of uncertainty in the Middle East, or to<br />
explanations about why a murder was committed. Inspect the articles carefully, noting<br />
all evidence used to support the causal assertions. Are the explanations nomothetic,<br />
idiographic, or a combination of both? Which criteria for establishing casualty in a<br />
nomothetic framework are met? How satisfactory are the idiographic explanations?<br />
What other potentially important influences on the reported outcome have been<br />
overlooked?<br />
2. Select several research articles in professional journals that assert, or imply, that they have<br />
identified a causal relationship between two or more variables. Are all the criteria for<br />
establishing the existence of a causal relationship met? Find a study in which subjects<br />
were assigned r<strong>and</strong>omly to experimental <strong>and</strong> comparison groups to reduce the risk of<br />
spurious influences on the supposedly causal relationship. How convinced are you by the<br />
study? Find a survey study that makes causal assertions based on the relationships, or<br />
correlations, among variables. What variables have been statistically controlled? List other<br />
variables that might be influencing the relationship but that have not been controlled.<br />
How convinced are you by the study?<br />
3. Search Sociological Abstracts or another index to the social literature for several articles on<br />
studies using any type of longitudinal design. You will be searching for article titles that<br />
use words like “longitudinal,” “panel,” “trend,” or “over time.” How successful were the<br />
researchers in carrying out the design? What steps did the researchers who used a panel<br />
design take to minimize panel attrition? How convinced are you by those using repeated<br />
cross-sectional designs that they have identified a process of change in individuals? Did<br />
any researchers use retrospective questions? How did they defend the validity of these<br />
measures?<br />
5. Go to the book’s Study Site, http://www.pineforge.com/isw5/learning.htm, <strong>and</strong> choose two<br />
research articles that include some attention to causality (as indicated by a check in that
05-Bachman-45191.qxd 12/11/2006 8:21 PM Page 167<br />
column of the article matrix). Describe the approach taken in each article to establishing<br />
causality. How do the approaches differ from each other? Which approach seems stronger<br />
to you?<br />
6. To assist you in completing the Web Exercises, please access the Study Site at<br />
http://www.pineforge.com/isw5 where you will find the Web Exercises with accompanying<br />
links. You will find other useful study materials like self-quizzes <strong>and</strong> e-flashcards for each<br />
chapter, along with a group of carefully selected articles from research journals that<br />
illustrate the major concepts <strong>and</strong> techniques presented in the book.<br />
DEVELOPING A RESEARCH PROPOSAL<br />
How will you try to establish the causal effects you hypothesize?<br />
1. Identify at least one hypothesis involving what you expect is a causal relationship.<br />
2. Identify key variables that should be controlled in your survey design in order to increase<br />
your ability to avoid arriving at a spurious conclusion about the hypothesized causal<br />
effect. Draw on relevant research literature <strong>and</strong> social theory to identify these variables.<br />
3. Add a longitudinal component to your research design. Explain why you decided to use<br />
this particular longitudinal design.<br />
4. Review the criteria for establishing a nomothetic causal effect <strong>and</strong> discuss your ability to<br />
satisfy each one. Include in your discussion some consideration of how well your design<br />
will avoid each of the threats to experimental validity.<br />
Student Study Site<br />
<strong>The</strong> Companion Website for <strong>The</strong> Practice of <strong>Research</strong> in Criminology <strong>and</strong> Criminal Justice, Third<br />
Edition<br />
http://www.sagepub.com/prccj3<br />
Visit the Web-based student study site to enhance your underst<strong>and</strong>ing of the chapter content<br />
<strong>and</strong> to discover additional resources that will take your learning one step further. You can<br />
enhance your underst<strong>and</strong>ing of the chapters by using the comprehensive study material,<br />
which includes e-flashcards, web exercises, practice self-tests, <strong>and</strong> more. You will also find special<br />
features, such as Learning from Journal Articles, which incorporates SAGE’s online journal<br />
collection, <strong>and</strong> Russ Schutt’s popular Interactive Exercises.<br />
WEB EXERCISES<br />
CHAPTER 5 <strong>Causation</strong> <strong>and</strong> <strong>Research</strong> <strong>Design</strong> 167<br />
1. Go to the Disaster Center website, http://www.disastercenter.com/crime/. Review the crime<br />
rate nationally, <strong>and</strong>, by picking out links to state reports, compare the recent crime rates<br />
in two states. Report on the prevalence of the crimes you have examined. Propose a<br />
causal explanation for variation in crime between states, over time, or both. What<br />
research design would you propose to test this explanation? Explain.<br />
2. Go to Crime Stoppers USA’s Web site at http:/www.crimestopusa.com/. Check out “About<br />
Us” <strong>and</strong> “Crime Stoppers.” How is CSUSA “fighting crime?” What does CSUSA’s approach
05-Bachman-45191.qxd 12/11/2006 8:21 PM Page 168<br />
168<br />
THE PRACTICE OF RESEARCH IN CRIMINOLOGY AND CRIMINAL JUSTICE<br />
assume about the cause of crime? Do you think CSUSA’s approach to fighting crime is<br />
based on valid conclusions about causality? Explain.<br />
3. What are the latest trends in crime? Write a short statement after inspecting the FBI’s<br />
Uniform Crime Reports at www.fbi.gov (go to the “statistics” section under “reports <strong>and</strong><br />
publications”). You will need to use Adobe Acrobat Reader to access some of these reports<br />
(those in PDF format). Follow the instructions on the site if you are not familiar with this<br />
program.<br />
ETHICS EXERCISES<br />
1. Bushman (1995) tested the impact of watching a violent video on students’ level of<br />
aggressiveness. He found that watching the violent video increased aggressiveness.<br />
Do you consider it ethical to expose subjects to an intervention that might increase<br />
their aggressiveness? Are there any situations in which you would not approve of such<br />
research? Any types of subjects you would exclude from such research? Any limits you<br />
would draw on the type of intervention that could be tested? Would you impose any<br />
requirements for debriefing?<br />
2. Horney, Osgood, <strong>and</strong> Marshall (1995) surveyed inmates in a state prison. Federal<br />
regulations require special safeguards for research on prisoners. Do you think special<br />
safeguards are necessary? Why or why not? What type of research would you allow with<br />
prisoners: Experiments, surveys, observational studies? Do you think it is possible for<br />
prisoners to give “voluntary consent” to research participation? What procedures might<br />
help to make prisoners’ consent to research truly voluntary?<br />
SPSS EXERCISES<br />
We can use the GSS2004mini data to learn how causal hypotheses can be evaluated with<br />
nonexperimental data.<br />
1. Specify four hypotheses in which CAPPUN is the dependent variable <strong>and</strong> the independent<br />
variable is also measured with a question in the GSS2004. <strong>The</strong> independent variables<br />
should have no more than 10 valid values (check the variable list).<br />
a. Inspect the frequency distributions of each independent variable in your hypotheses.<br />
If it appears at any have little valid data or were coded with more than 10 categories,<br />
substitute another independent variable.<br />
b. Generate crosstabulations that show the association between CAPPUN <strong>and</strong> each of the<br />
independent variables. Make sure that CAPPUN is the row variable <strong>and</strong> that you select<br />
“Column Percents.”<br />
c. Does support for capital punishment vary across the categories of any of the<br />
independent variables. By how much? Would you conclude that there is an association,<br />
as hypothesized, for any pairs of variables?<br />
d. Might one of the associations you have just identified be spurious due to the effect<br />
of a third variable? What might such an extraneous variable be? Look through the<br />
variable list <strong>and</strong> find a variable that might play this role. If you cannot think of any<br />
possible extraneous variables, or if you did not find an association in support of any of<br />
your hypotheses, try this: Examine the association between CAPPUN <strong>and</strong> WRKSTAT2.<br />
In the next step, control for sex (gender).
05-Bachman-45191.qxd 12/11/2006 8:21 PM Page 169<br />
CHAPTER 5 <strong>Causation</strong> <strong>and</strong> <strong>Research</strong> <strong>Design</strong> 169<br />
<strong>The</strong> idea is that there is an association between work status <strong>and</strong> support for capital<br />
punishment that might be spurious due to the effect of sex (gender). Proceed with the<br />
following steps:<br />
(1) Select Analyze/Descriptive statistical/Crosstabs.<br />
(2) In the Crosstabs window, highlight CAPPUN <strong>and</strong> then click the right arrow to move<br />
it into Rows, Move WRKSTAT2 into Columns <strong>and</strong> SEX into Layer 1 of 1.<br />
(3) Select Cells/Percentages Column/Continue/OK.<br />
Is the association between employment status <strong>and</strong> support for capital punishment affected<br />
by gender? Do you conclude that the association between CAPPUN <strong>and</strong> WRKSTSAT2 seems<br />
to be spurious due to the effect of SEX?<br />
2. Does the association between support for capital punishment <strong>and</strong> any of your<br />
independent variables vary with social context? Marian Borg (1997) concluded that it<br />
did. Test this by reviewing the association between attitude toward African Americans<br />
(RACPUSH2) <strong>and</strong> CAPPUN. Follow the procedures in SPSS Exercise 1d, but click<br />
RACPUSH2 into columns <strong>and</strong> REGION4 into Layer 1 of 1. (You must first return the<br />
variables used previously to the variables list.) Take a while to study this complex threevariable<br />
table. Does the association between CAPPUN <strong>and</strong> RACPUSH2 vary with region?<br />
How would you interpret this finding?<br />
3. Now, how about the influence of an astrological sign on support for capital punishment?<br />
Create a crosstabulation in which ZODIAC is the independent (column) variable <strong>and</strong><br />
CAPPUN is the dependent (row) variable (with column percents). What do you make of<br />
the results?