harris corporation
harris corporation
harris corporation

You also want an ePaper? Increase the reach of your titles
YUMPU automatically turns print PDFs into web optimized ePapers that Google loves.
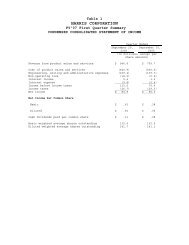
Unallocated Corporate Expense and Corporate Eliminations<br />
2011 2010<br />
2011/2010<br />
Percent<br />
Increase/<br />
(Decrease) 2009<br />
2010/2009<br />
Percent<br />
Increase/<br />
(Decrease)<br />
(Dollars in millions)<br />
Unallocated corporate expense . .................. $87.8 $90.4 (2.9)% $81.4 11.1%<br />
Corporate eliminations ......................... 26.2 16.9 55.0% 17.7 (4.5)%<br />
Fiscal 2011 Compared With Fiscal 2010: Unallocated corporate expense decreased in fiscal 2011 compared<br />
with fiscal 2010, primarily due to a charge associated with a contract termination, recorded in fiscal 2010, and lower<br />
benefit plan expenses. Corporate eliminations increased in fiscal 2011 from fiscal 2010, primarily due to higher<br />
intersegment activity between the Government Communications Systems and Integrated Network Solutions<br />
segments.<br />
Fiscal 2010 Compared With Fiscal 2009: Unallocated corporate expense increased in fiscal 2010 compared<br />
with fiscal 2009, primarily due to investments made in pursuit of new growth opportunities, increased charitable<br />
contributions and a charge associated with a contract termination.<br />
Discontinued Operations<br />
In the fourth quarter of fiscal 2009, in connection with the May 27, 2009 Spin-off to our shareholders of all the<br />
shares of HSTX common stock owned by us, we eliminated our former HSTX operating segment. Our historical<br />
financial results have been restated to account for HSTX as discontinued operations for all periods presented in this<br />
Report. See Note 3: Discontinued Operations for additional information regarding discontinued operations.<br />
LIQUIDITY, CAPITAL RESOURCES AND FINANCIAL STRATEGIES<br />
Cash Flows<br />
2011<br />
Fiscal Years Ended<br />
2010<br />
(Dollars in millions)<br />
2009<br />
Net cash provided by operating activities ........................ $ 833.1 $ 802.7 $ 666.8<br />
Net cash used in investing activities ............................ (1,417.5) (250.1) (864.6)<br />
Net cash provided by (used in) financing activities ................. 492.8 (380.9) 117.1<br />
Effect of exchange rate changes on cash and cash equivalents ......... 3.3 2.3 (8.1)<br />
Net increase (decrease) in cash and cash equivalents. ............... (88.3) 174.0 (88.8)<br />
Cash and cash equivalents, beginning of year ..................... 455.2 281.2 370.0<br />
Cash and cash equivalents, end of year. ......................... $ 366.9 $ 455.2 $ 281.2<br />
Cash and cash equivalents: Our Consolidated Statement of Cash Flows includes the results of HSTX through<br />
the May 27, 2009 Spin-off date. Accordingly, for fiscal 2009, our Consolidated Statement of Cash Flows, and the<br />
following analysis, includes approximately eleven months of cash flows from HSTX.<br />
The decrease in cash and cash equivalents from fiscal 2010 to fiscal 2011 was primarily due to<br />
$1,082.6 million of cash paid for acquired businesses, $324.9 million of additions of property, plant and equipment<br />
and capitalized software, $256.1 million used to repurchase shares of our common stock, and $127.0 million used to<br />
pay cash dividends, partially offset by $833.1 million of net cash provided by operating activities and $851.4 million<br />
of net proceeds from borrowings.<br />
Our financial position remained strong at July 1, 2011. We ended the fiscal year with cash and cash equivalents<br />
of $366.9 million; we have no long-term debt maturing until fiscal 2016; we have a senior unsecured $750 million<br />
revolving credit facility that expires in September 2013 ($570 million of which was available to us as of July 1,<br />
2011 as a result of $180 million of short-term debt outstanding under our commercial paper program, that was<br />
supported by such senior unsecured revolving credit facility); we have a senior unsecured $300 million 364-day<br />
revolving credit facility that expires on September 28, 2011 (all of which was available to us as of July 1, 2011);<br />
and we do not have any material defined benefit pension plan obligations.<br />
Given our current cash position, outlook for funds generated from operations, credit ratings, available credit<br />
facilities, cash needs and debt structure, we have not experienced to date, and do not expect to experience, any<br />
45