harris corporation
harris corporation
harris corporation

You also want an ePaper? Increase the reach of your titles
YUMPU automatically turns print PDFs into web optimized ePapers that Google loves.
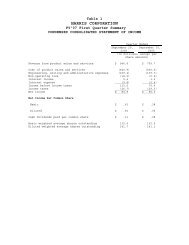
financial highlights<br />
5.0<br />
09<br />
5.2<br />
5.9<br />
10 11<br />
3.85<br />
09<br />
4.43<br />
4.89<br />
10 11<br />
<strong>harris</strong> <strong>corporation</strong> ( nYsE:hrs) is an international communications and information technology company serving<br />
government and commercial markets in more than 150 countries. Headquartered in Melbourne, Florida, the company has approximately<br />
$6 billion of annual revenue and more than 16,000 employees – including about 7,000 engineers and scientists. Harris is<br />
dedicated to developing best-in-class assured communications ® products, systems and services. Additional information about Harris<br />
Corporation is available at www.<strong>harris</strong>.com.<br />
* Amounts used in this Annual Report that are considered non-GAAP financial measures are defined and reconciled to the most directly comparable GAAP financial measures on<br />
page 9 of this Annual Report. GAAP refers to U.S. generally accepted accounting principles.<br />
0.80<br />
09<br />
0.88<br />
1.00<br />
10 11<br />
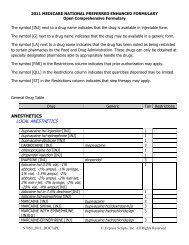
fiscal YEar EndEd<br />
dollars in millions, ExcEpt pEr sharE amounts julY 1, 2011 julY 2, 2010 julY 3, 2009<br />
Revenue $5,924.6 $5,206.1 $5,005.0<br />
GAAP Income from Continuing Operations 588.0 561.6 312.4<br />
Non-GAAP Income from Continuing Operations* 624.8 581.5 515.5<br />
GAAP Income Per Diluted Share from Continuing Operations 4.60 4.28 2.33<br />
Non-GAAP Income Per Diluted Share from Continuing Operations* 4.89 4.43 3.85<br />
GAAP Return on Average Assets 10.8% 12.2% 6.9%<br />
GAAP Return on Average Equity 25.0% 27.7% 14.0%<br />
Diluted Weighted Average Shares Outstanding (Millions) 126.3 130.0 133.0<br />
Worldwide Employment 16,900 15,800 15,400<br />
rEvEnuE<br />
in billions<br />
non-gaap<br />
Earnings pEr<br />
sharE*<br />
in dollars<br />
dividEnds paid<br />
pEr common<br />
sharE<br />
in dollars<br />
nEt cash<br />
from opErating<br />
activitiEs<br />
in Millions<br />
667<br />
09<br />
803<br />
833<br />
10 11<br />
fiscal years fiscal years fiscal years fiscal years