harris corporation
harris corporation
harris corporation

Create successful ePaper yourself
Turn your PDF publications into a flip-book with our unique Google optimized e-Paper software.
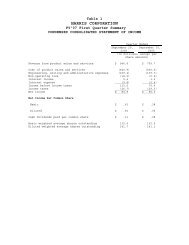
QUARTERLY FINANCIAL DATA (UNAUDITED)<br />
SUPPLEMENTARY FINANCIAL INFORMATION<br />
Selected quarterly financial data is summarized below.<br />
Quarter Ended<br />
10-1-10(2) 12-31-10(3) 4-1-11(4) 7-1-11(5)<br />
(In millions, except per share amounts)<br />
Fiscal 2011<br />
Revenue .................................... $1,405.4 $1,438.5 $1,413.3 $1,667.4 $5,924.6<br />
Gross profit ................................. 524.3 498.0 517.0 574.8 2,114.1<br />
Income from continuing operations before income<br />
taxes .................................... 251.5 221.9 206.4 200.9 880.7<br />
Income from continuing operations (1) . ............ 163.9 151.1 139.5 133.5 588.0<br />
Per share data:<br />
Basic — income from continuing operations (1) ..... 1.28 1.19 1.10 1.07 4.63<br />
Diluted — income from continuing operations (1) . . . 1.27 1.18 1.09 1.06 4.60<br />
Cash dividends ............................. 0.25 0.25 0.25 0.25 1.00<br />
Stock prices — High ......................... 48.95 47.42 51.27 53.39<br />
Low......................... 41.13 43.02 43.14 43.75<br />
Quarter Ended<br />
10-2-09(6) 1-1-10(7) 4-2-10(8) 7-2-10(9)<br />
(In millions, except per share amounts)<br />
Fiscal 2010<br />
Revenue .................................... $1,203.0 $1,217.7 $1,329.5 $1,455.9 $5,206.1<br />
Gross profit .................................. 390.9 439.1 509.5 532.2 1,871.7<br />
Income from continuing operations before income<br />
taxes ..................................... 160.8 205.2 246.3 228.0 840.3<br />
Income from continuing operations (1) .............. 104.5 139.5 166.2 151.4 561.6<br />
Per share data:<br />
Basic — income from continuing operations (1) ..... 0.79 1.07 1.27 1.17 4.31<br />
Diluted — income from continuing operations (1) .... 0.79 1.06 1.26 1.16 4.28<br />
Cash dividends. ............................. 0.22 0.22 0.22 0.22 0.88<br />
Stock prices — High ......................... 39.42 48.25 49.67 54.50<br />
Low.......................... 26.11 35.88 42.67 40.24<br />
(1) For this line item, “income from continuing operations” refers to income from continuing operations attributable to Harris Corporation<br />
common shareholders.<br />
(2) Income from continuing operations before income taxes included a $2.0 million ($1.5 million after-tax) charge for costs associated with<br />
acquisitions.<br />
(3) Income from continuing operations before income taxes included a $4.2 million ($3.5 million after-tax) charge for costs associated with<br />
acquisitions.<br />
(4) Income from continuing operations before income taxes included a $10.8 million ($9.1 million after-tax) charge for costs associated with<br />
acquisitions.<br />
(5) Income from continuing operations before income taxes included a $29.6 million ($22.7 million after-tax) charge for costs associated with<br />
acquisitions.<br />
(6) Income from continuing operations before income taxes included a $7.2 million ($4.5 million after-tax) charge for costs associated with<br />
acquisitions.<br />
(7) Income from continuing operations before income taxes included a $3.5 million ($2.3 million after-tax) charge for costs associated with<br />
acquisitions.<br />
(8) Income from continuing operations before income taxes included a $5.3 million ($3.3 million after-tax) charge for costs associated with<br />
acquisitions.<br />
(9) Income from continuing operations before income taxes included a $10.1 million ($9.8 million after-tax) charge for costs associated with<br />
acquisitions.<br />
95<br />
Total<br />
Year<br />
Total<br />
Year