harris corporation
harris corporation
harris corporation

You also want an ePaper? Increase the reach of your titles
YUMPU automatically turns print PDFs into web optimized ePapers that Google loves.
<strong>harris</strong> <strong>corporation</strong><br />
2011 annual report<br />
now
financial highlights<br />
5.0<br />
09<br />
5.2<br />
5.9<br />
10 11<br />
3.85<br />
09<br />
4.43<br />
4.89<br />
10 11<br />
<strong>harris</strong> <strong>corporation</strong> ( nYsE:hrs) is an international communications and information technology company serving<br />
government and commercial markets in more than 150 countries. Headquartered in Melbourne, Florida, the company has approximately<br />
$6 billion of annual revenue and more than 16,000 employees – including about 7,000 engineers and scientists. Harris is<br />
dedicated to developing best-in-class assured communications ® products, systems and services. Additional information about Harris<br />
Corporation is available at www.<strong>harris</strong>.com.<br />
* Amounts used in this Annual Report that are considered non-GAAP financial measures are defined and reconciled to the most directly comparable GAAP financial measures on<br />
page 9 of this Annual Report. GAAP refers to U.S. generally accepted accounting principles.<br />
0.80<br />
09<br />
0.88<br />
1.00<br />
10 11<br />
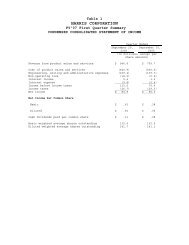
fiscal YEar EndEd<br />
dollars in millions, ExcEpt pEr sharE amounts julY 1, 2011 julY 2, 2010 julY 3, 2009<br />
Revenue $5,924.6 $5,206.1 $5,005.0<br />
GAAP Income from Continuing Operations 588.0 561.6 312.4<br />
Non-GAAP Income from Continuing Operations* 624.8 581.5 515.5<br />
GAAP Income Per Diluted Share from Continuing Operations 4.60 4.28 2.33<br />
Non-GAAP Income Per Diluted Share from Continuing Operations* 4.89 4.43 3.85<br />
GAAP Return on Average Assets 10.8% 12.2% 6.9%<br />
GAAP Return on Average Equity 25.0% 27.7% 14.0%<br />
Diluted Weighted Average Shares Outstanding (Millions) 126.3 130.0 133.0<br />
Worldwide Employment 16,900 15,800 15,400<br />
rEvEnuE<br />
in billions<br />
non-gaap<br />
Earnings pEr<br />
sharE*<br />
in dollars<br />
dividEnds paid<br />
pEr common<br />
sharE<br />
in dollars<br />
nEt cash<br />
from opErating<br />
activitiEs<br />
in Millions<br />
667<br />
09<br />
803<br />
833<br />
10 11<br />
fiscal years fiscal years fiscal years fiscal years
more<br />
than<br />
ever<br />
Businesses and governments worldwide face<br />
the same daunting challenge: how to provide the<br />
right information, to the right place, to make<br />
the right decisions. often, the success of their<br />
organization — even lives — depends on it. with<br />
<strong>harris</strong>, customers trust that the information<br />
they receive and the technology that delivers it<br />
are reliaBle and secure. we are one of the only<br />
companies focused exclusively on developing the<br />
most trusted voice, data and video networks —<br />
networks that are important now more than ever.
letter to shareholders<br />
i am pleased to report that fiscal year 2011 was another successful year for <strong>harris</strong><br />
<strong>corporation</strong>. the company produced strong financial results amid challenging global<br />
economic conditions and despite difficult year-to-year comparisons. at the same time,<br />
we realigned our operating segments and significantly increased investments in new vertical<br />
market initiatives that we believe will be major drivers of long-term growth and higher<br />
earnings in the future.<br />
2<br />
results<br />
Revenue in fiscal 2011 increased 14 percent to $5.92 billion. Non-GAAP income per diluted common share*<br />
increased 10 percent to $4.89, compared with $4.43 in fiscal 2010. GAAP income per diluted common share<br />
was $4.60 in fiscal 2011 and $4.28 in fiscal 2010. Cash flow from operations for the company increased to<br />
$833 million and adjusted EBITDA (non-GAAP earnings before interest, taxes, depreciation and amortization)<br />
grew 11 percent to $1.23 billion.<br />
The RF Communications segment – including Tactical Communications and Public Safety and<br />
Professional Communications – continued its record of success in fiscal 2011. Segment revenue grew 11 percent<br />
to $2.29 billion, with income increasing to $787 million for the year. The segment’s growth was driven<br />
by the continued adoption of its industry leading Falcon ® family of tactical radios at all branches of the U.S.<br />
Department of Defense and by international governments, including Iraq, Pakistan, Australia, the United<br />
Kingdom, Mexico and the United Arab Emirates, as well as the expanded use of its advanced interoperable<br />
radio systems among first responders throughout the U.S.<br />
The Integrated Network Solutions segment – which includes IT Services, Managed Satellite and Terrestrial<br />
Communications Solutions, Healthcare Solutions, Cyber Integrated Solutions, and Broadcast and New<br />
Media Solutions – reported revenue of $1.99 billion, an increase of 34 percent, with non-GAAP income of<br />
$117 million, or $70 million on a GAAP basis. The significant increase in revenue was due to revenue from the<br />
CapRock Communications and Schlumberger Global Connectivity Services acquisitions completed in fiscal<br />
2011, and also strong revenue growth in Broadcast and New Media Solutions. During the year, the company<br />
accelerated efforts to expand its integrated solutions offerings while continuing to serve its core customers.<br />
Revenue in the Government Communications Systems segment – including Civil, Defense and National<br />
Intelligence Programs – was $1.78 billion, 2 percent above the previous year. Income was $227 million. The<br />
segment overcame the effects of an extended U.S. government continuing budget resolution by continuing to<br />
win new contracts and extending its track record of successfully executing complex, long-term programs for<br />
a wide range of customers, including the Department of Defense, Federal Aviation Administration, National<br />
Oceanic and Atmospheric Administration, National Geospatial-Intelligence Agency, National Reconnaissance<br />
Office and Federal Bureau of Investigation.
ealigned segments focus on strategic vertical markets<br />
During fiscal 2011, we realigned our operating segments to further expand into adjacent markets and global<br />
regions that are growing faster and have higher margins than some of our traditional government markets.<br />
The new Integrated Network Solutions segment combines the resources and capabilities of several existing<br />
and recently acquired businesses targeting the fast-growing, global market for highly reliable, secure – and<br />
integrated – communications and IT networks.<br />
Our operating segments are focused on an expanded set of global vertical markets where Harris technologies<br />
can provide compelling, value-added solutions – defense and homeland security, national intelligence,<br />
civilian government, international government systems, public safety, energy, maritime, new media and<br />
healthcare.<br />
The realignment and vertical markets focus builds on our strong foundation as an aerospace and defense<br />
company, and is helping to transform Harris into a broader technology company with differentiated solutions<br />
for both global government and high-growth commercial markets.<br />
investments for future growth<br />
Combined with the realigned segments, Harris invested significantly in new initiatives to build its core<br />
capabilities and expand its presence in strategic vertical markets. Key fiscal 2011 investments included:<br />
• Creating a state-of-the-art, centralized manufacturing facility in greater Rochester, New York, for the<br />
RF Communications segment’s tactical and public safety radio systems.<br />
• Opening the 100,000-square-foot Harris Cyber Integration Center – the nation’s first specialized facility<br />
to provide government and commercial customers with secure, managed cloud application hosting<br />
services within a trusted environment.<br />
• Combining the acquisitions of CapRock Communications, Schlumberger’s Global Connectivity Services<br />
business, and the terrestrial network infrastructure assets from Core180 to form the premier global<br />
provider of managed satellite and terrestrial communications solutions specifically designed for customers<br />
in remote and harsh environments.<br />
howard l. lance<br />
Harris Chairman, President and<br />
Chief Executive Officer Howard<br />
L. Lance (left/front), at the<br />
Miami-Dade County emergency<br />
communications bureau with<br />
(left to right) Capt. Jorge Guerra,<br />
Miami-Dade Police Department;<br />
Angel Petisco, CIO & Director<br />
for Miami-Dade’s Enterprise<br />
Technology Service Department<br />
(ETSD); and Felix Perez, Assistant<br />
Director for ETSD. Harris provides<br />
the communications backbone<br />
for the Miami-Dade bureau,<br />
one of the largest public safety<br />
systems in North America,<br />
serving 2.5 million people.<br />
3
“Our operating segments<br />
are focused on an<br />
expanded set of global<br />
vertical markets where<br />
Harris technologies can<br />
provide compelling,<br />
value-added solutions –<br />
defense and homeland<br />
security, national<br />
intelligence, civilian<br />
government, international<br />
government systems,<br />
public safety, energy,<br />
maritime, new media<br />
and healthcare.”<br />
howard l. lance<br />
4<br />
• Expanding our Healthcare Solutions portfolio by acquiring Carefx Corporation, a leading provider<br />
of interoperability workflow solutions for government and commercial healthcare providers.<br />
• Leveraging approximately $1 billion in government and company-funded research activities to develop<br />
new technologies and introduce new products and services in each of the company’s segments.<br />
We will continue to use acquisitions, investments in new technology and other internal initiatives<br />
to expand our addressable markets and drive future growth.<br />
share repurchase and dividend increase<br />
On August 2, 2011, the company announced a new $1 billion share repurchase authorization and its plans<br />
to repurchase up to $500 million in shares by the end of calendar 2011. The Board also increased the quarterly<br />
cash dividend rate by 12 percent, from 25 cents per share to 28 cents per share, raising the annualized<br />
cash dividend rate to $1.12 per share. It marked the company’s tenth consecutive annual dividend increase.<br />
Both of these actions reflect our continuing commitment to create shareholder value, confidence in<br />
our financial strength, and positive long-term outlook.<br />
corporate citizenship<br />
Last year also exemplified Harris’ commitment to being a trusted citizen in the communities where we have<br />
operations and in the world at large. We contributed millions of dollars to community organizations and<br />
nonprofits, while our employees volunteered more than 52,000 hours of their time to various charities and<br />
educational initiatives. The largest portion of our contributions remains focused on higher education,<br />
targeted to the science, math and engineering programs that are so critical to developing the technology<br />
workforce of tomorrow.<br />
ceo succession plan<br />
On a personal note, I announced in May that I will be retiring in fiscal 2012. We have accomplished a<br />
tremendous amount since I joined Harris in January 2003, and I am very proud of our entire team.<br />
We continue to post solid financial results and are well positioned across our diversified served markets<br />
with strong customer relationships, leading technologies and deep management talent. With Harris<br />
on a strong footing, I believe that this is the right time for me to move on to the next chapter of my life.<br />
I am confident the Board will select a world-class leader to continue to grow the company and build<br />
on the strong base we have in place today.<br />
Sincerely,<br />
howard l. lance<br />
Chairman, President and Chief Executive Officer<br />
August 26, 2011<br />
* Amounts used in this Annual Report that are considered non-GAAP financial measures are defined and reconciled to the most directly<br />
comparable GAAP financial measures on page 9 of this Annual Report. GAAP refers to U.S. generally accepted accounting principles.
fiscal 2011 highlights<br />
7.19.10 $97 million federal aviation administration award continues company’s legacy as leading<br />
provider of trusted weather products.<br />
7.20.10 $130 million ground antenna system award from national oceanic and atmospheric<br />
administration to enable weather data processing 40 times faster than today.<br />
7.30.10 <strong>harris</strong> completes acquisition of caprock communications, leader in providing managed<br />
satellite services for energy, maritime and government markets.<br />
9.30.10 innovation award presented by wall street journal for connect open-source software<br />
that enables quick and secure exchange of patient information.<br />
10.18.10 $276 million contract awarded by government of canada for cf-18 avionics optimized<br />
2011<br />
weapon system support program.<br />
1.4.11 potential $100 million contract as the radio system and service provider for state<br />
of oregon.<br />
1.6.11 potential $475 million contract to provide tactical and land mobile radios to interna-<br />
tional partners of united states.<br />
1.13.11 $300 million contract from international customer to provide military radios and other<br />
equipment as part of tactical communications modernization program.<br />
2.23.11 <strong>harris</strong> partners with digital display networks to design and deploy one of largest<br />
digital out-of-home advertising networks — 7-eleven® tv.<br />
3.4.11 $293 million contract to design and deploy alberta, canada’s first responders radio<br />
communications system.<br />
3.10.11 <strong>harris</strong> acquires infrastructure assets from core180, expanding company’s terrestrial<br />
networking capabilities.<br />
4.4.11 <strong>harris</strong> completes acquisition of carefx <strong>corporation</strong>, leading provider of interoperability<br />
workflow solutions for commercial and government healthcare markets.<br />
4.5.11 <strong>harris</strong> completes acquisition of schlumberger global connectivity services business,<br />
leading provider of satellite services in the international energy market.<br />
5.27.11 <strong>harris</strong> opens cyber integration center, offering advanced security, trust and perfor-<br />
mance for government and commercial cloud computing applications.<br />
6.29.11 potential $57 million contract from federal aviation administration for alaska flight<br />
services system.<br />
5
eliaBle and secure technology will get<br />
<strong>harris</strong><br />
6<br />
our more than 16,000<br />
employees design, deliver and manage<br />
networks that touch millions of lives every<br />
day. our solutions address the toughest<br />
technology challenges faced By Businesses<br />
and governments. they trust that our ultra-<br />
the right information, to the right place, at<br />
the right time. we serve customers in more<br />
than 150 countries in markets where network<br />
solutions are critical to success: defense,<br />
national intelligence, civilian and<br />
international government, puBlic safety and<br />
puBlic service, energy and maritime, Broadcast<br />
and new media, healthcare and enterprise.<br />
open this page to discover why customers<br />
trust <strong>harris</strong>.
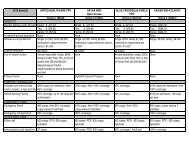
usiness segments at-a-glance<br />
fiscal 2011 revenue:<br />
$2,289 Million<br />
business units:<br />
• U.S. DoD and International<br />
Tactical Communications<br />
• Public Safety and Professional<br />
Communications<br />
fiscal 2011 revenue:<br />
$1,986 Million<br />
business units:<br />
• IT Services<br />
• Managed Satellite and<br />
Terrestrial Communications<br />
• Healthcare Solutions<br />
• Cyber Integrated Solutions<br />
• Broadcast and New Media<br />
Solutions<br />
fiscal 2011 revenue:<br />
$1,777 Million<br />
business units:<br />
• Defense Programs<br />
• National Intelligence Programs<br />
• Civil Programs<br />
RF CommuniCations<br />
RF Communications is the leading global supplier of secure radio communications<br />
and embedded high-grade encryption solutions for military, government<br />
and commercial organizations. The Falcon ® family of software-defined tactical<br />
radio systems encompasses manpack, handheld and vehicular applications.<br />
Falcon III ® is the next generation of radios supporting the U.S. military’s Joint<br />
Tactical Radio System (JTRS) requirements, as well as network-centric operations<br />
worldwide. RF Communications also is a leading supplier of secure communications<br />
systems and equipment for public safety, utility and transportation markets,<br />
with products ranging from the most advanced IP voice and data networks to<br />
portable and mobile single and multiband radios.<br />
integRated netwoRk solutions<br />
Integrated Network Solutions addresses the fast-growing global market for<br />
integrated communications and information technology and services. It provides<br />
a variety of trusted networking capabilities to support government, energy,<br />
healthcare, enterprise and broadcast customers. These include mission-critical,<br />
end-to-end IT services, managed satellite and terrestrial communications<br />
solutions, standards-based healthcare interoperability and image management<br />
solutions, cyber integration and cloud application hosting, and digital media<br />
management solutions. Harris is unique in its ability to integrate advanced<br />
technology and services to capture, aggregate, distribute and analyze any type of<br />
communications or information – including voice, video, data and imaging.<br />
goveRnment CommuniCations systems<br />
Government Communications Systems develops, produces, integrates and<br />
supports systems that solve the mission-critical challenges of its defense, national<br />
intelligence, federal and civil customers. It serves a diverse customer base,<br />
including the U.S. Department of Defense and national intelligence agencies,<br />
as well as federal civilian agencies such as the Federal Aviation Administration<br />
and the National Oceanic and Atmospheric Administration. Government<br />
Communications Systems also serves as the advanced technology engine for<br />
the company’s diverse business portfolio.<br />
7
<strong>harris</strong><br />
tactical<br />
communications<br />
Harris tactical radios create a truly<br />
networked battlefield, where warfighters<br />
are always connected, never alone.<br />
From critical voice communications to<br />
real-time streaming reconnaissance video,<br />
Harris radios deliver unprecedented<br />
situational awareness that saves lives.<br />
Spotlight: Harris is the world’s number<br />
one supplier of tactical radios to NATO<br />
and the U.S. Department of Defense.<br />
More than 300,000 of its flagship<br />
Falcon® radios — including vehicular,<br />
manpack and handheld models —<br />
have been delivered to military forces<br />
in 150 nations.<br />
defense programs<br />
The U.S. Department of Defense turns to<br />
Harris to provide integrated communications<br />
and intelligence products, systems<br />
and network solutions for military<br />
applications. The company is a leading<br />
provider of advanced avionics, data<br />
links, battlespace networks, satellite<br />
payloads and ground terminal systems.<br />
Spotlight: Harris is developing next-<br />
generation military satellite communications<br />
terminals for the U.S. Army’s<br />
Modernization of Enterprise Terminals<br />
(MET) program, which will create a<br />
worldwide backbone for high-priority<br />
military communications and missile<br />
defense systems.<br />
network solutions<br />
rF CommuniCations<br />
public safety<br />
and professional<br />
communications<br />
First responders rely on advanced Harris<br />
radio systems when lives and property<br />
are at stake. Harris delivers the highestreliability<br />
communications solutions for<br />
public safety personnel and for federal,<br />
utility, commercial and transportation<br />
applications.<br />
Spotlight: One of the largest public<br />
safety systems in North America,<br />
Miami-Dade County in Florida, uses a<br />
Harris system to support more than<br />
80 agencies and 32,000 users serving<br />
2.5 million people.<br />
national<br />
intelligence<br />
programs<br />
With proven solutions for all phases of<br />
the intelligence cycle, Harris technology<br />
integrates, analyzes and distributes<br />
extremely large volumes of video, voice<br />
and data — enabling intelligence analysts<br />
and military commanders to make<br />
critical decisions faster.<br />
Spotlight: Harris’ unique Full-Motion<br />
Video Asset Management Engine<br />
is used by agencies around the world<br />
to aggregate, manage and analyze<br />
critical intelligence content in a single<br />
dashboard.<br />
government CommuniCations systems<br />
civil programs<br />
Civilian U.S. government agencies<br />
trust highly reliable, secure, high-speed<br />
communications and information<br />
networks from Harris to help carry out<br />
their missions. Harris designed and<br />
manages the largest and most reliable<br />
non-DoD U.S. government communications<br />
network, and is developing<br />
the world’s most advanced weather<br />
tracking system.<br />
Spotlight: The Harris-developed FAA<br />
Telecommunications Infrastructure<br />
network provides managed communications<br />
services for nearly 50,000 FAA<br />
employees at more than 4,000 facilities —<br />
supporting more than 2 million<br />
passengers a day.<br />
it services<br />
Integrating and operating complex<br />
technology across mission-critical<br />
networks is Harris’ expertise. Welltrained<br />
professionals with multiple<br />
clearances leverage capabilities from<br />
across Harris to deliver end-to-end<br />
solutions.<br />
Spotlight: Harris is delivering comprehensive<br />
support for data, video and<br />
voice communications to the U.S. Navy<br />
on the Navy Marine Corps Intranet —<br />
the largest managed network in the<br />
world, connecting more than 700,000<br />
users and supporting 100 million<br />
emails per month.<br />
managed satellite<br />
and terrestrial<br />
communications<br />
Harris provides fully managed, end-toend<br />
communications solutions for<br />
mission-critical operations in remote<br />
and harsh environments, including<br />
those in the energy, government and<br />
maritime industries. Its robust, selfowned<br />
and operated infrastructure<br />
includes teleports on six continents,<br />
five 24/7 Network Operations Centers<br />
and a local presence in 23 countries.<br />
Spotlight: Other than the U. S. government,<br />
Harris is the world’s single<br />
largest buyer of satellite bandwidth —<br />
some 4GHz across 60+ satellites.<br />
healthcare<br />
solutions<br />
Harris is transforming healthcare,<br />
ensuring that the right information<br />
travels, with security and privacy, to the<br />
right person, at the right time, on the<br />
right device, at the point of care. Harris’<br />
full range of interoperability solutions<br />
enables federal and commercial healthcare<br />
providers to share patient<br />
information, improving healthcare<br />
quality, safety, efficiency and outcomes.<br />
Spotlight: More than 800 hospitals,<br />
health systems and health information<br />
exchanges around the world are<br />
supported by Harris’ healthcare interoperability<br />
platform.<br />
integrated network solutions<br />
cyber integrated<br />
solutions<br />
Trust in the cloud is essential. Government<br />
and commercial customers depend on<br />
Harris’ expertise in managing and protecting<br />
the world’s most secure networks to<br />
provide them cloud application hosting<br />
services in a trusted environment.<br />
Spotlight: Harris launched the Trusted<br />
Enterprise Cloud™, a patented, enterprise-grade,<br />
cloud computing system,<br />
and opened the Cyber Integration<br />
Center, a 100,000-square-foot cloud<br />
node. Together with its industry-leading<br />
solutions partners, Harris has received<br />
awards for innovation, design,<br />
availability and energy efficiency.<br />
broadcast<br />
and new media<br />
solutions<br />
Harris is one of the largest suppliers of<br />
broadcast and new media technology<br />
to radio and television stations around<br />
the world. It also is the number one<br />
provider of retail video networks and<br />
digital signage solutions to companies<br />
such as 7-Eleven and McDonald’s.<br />
Spotlight: Harris teamed with the<br />
Orlando Magic to create the Amway<br />
Center — the most technologically<br />
advanced sports and entertainment<br />
venue in North America, with 1,100<br />
high-definition video screens and<br />
more than 800 broadcast devices.
oard committees<br />
1 Audit Committee<br />
2 Business Conduct and Corporate<br />
Responsibility Committee<br />
3 Corporate Governance Committee<br />
4 Finance Committee<br />
5 Management Development and<br />
Compensation Committee<br />
Information presented as of August 26, 2011.<br />
8<br />
directors and officers<br />
board of directors<br />
thomas a. dattilo<br />
Advisor/Consultant to<br />
Private Investment Firms<br />
Former Chairman,<br />
President and CEO,<br />
Cooper Tire & Rubber<br />
Company<br />
3, 5<br />
2, 5<br />
terry d. growcock<br />
Retired Chairman and CEO,<br />
The Manitowoc Company, Inc.<br />
1, 3<br />
lewis hay iii<br />
Chairman and CEO,<br />
NextEra Energy, Inc.<br />
2, 3<br />
karen katen<br />
Senior Advisor,<br />
Essex Woodlands Health Ventures<br />
Retired Vice Chairman,<br />
Pfizer, Inc.<br />
stephen p. kaufman<br />
Senior Lecturer,<br />
Harvard Business School<br />
Retired Chairman and CEO,<br />
Arrow Electronics, Inc.<br />
4, 5<br />
2, 3<br />
leslie f. kenne<br />
Lieutenant General USAF (Ret.)<br />
howard l. lance<br />
Chairman, President and CEO,<br />
Harris Corporation<br />
1, 4<br />
david b. rickard<br />
Retired Executive Vice President,<br />
Chief Financial Officer and<br />
Chief Administrative Officer,<br />
CVS Caremark Corporation<br />
james c. stoffel, ph.d.<br />
General Partner,<br />
Trillium International<br />
Retired Senior Vice President<br />
and Chief Technical Officer,<br />
Eastman Kodak Company<br />
gregory t. swienton<br />
Chairman and CEO,<br />
Ryder System, Inc.<br />
hansel e. tookes ii<br />
Former Chairman and CEO,<br />
Raytheon Aircraft Company<br />
1, 2<br />
1, 4<br />
4, 5<br />
executive officers<br />
howard l. lance<br />
Chairman, President and<br />
Chief Executive Officer<br />
daniel r. pearson<br />
Executive Vice President and<br />
Chief Operating Officer<br />
gary l. mcarthur<br />
Senior Vice President and<br />
Chief Financial Officer<br />
jeffrey s. shuman<br />
Senior Vice President,<br />
Chief Human Resources and<br />
Administrative Officer<br />
sheldon j. fox<br />
Group President,<br />
Government Communications<br />
Systems<br />
dana a. mehnert<br />
Group President,<br />
RF Communications<br />
scott t. mikuen<br />
Vice President,<br />
General Counsel and Secretary<br />
lewis a. schwartz<br />
Vice President,<br />
Principal Accounting Officer<br />
corporate officers<br />
andrea r. bortner<br />
Vice President,<br />
Global Talent Solutions<br />
r. kent buchanan<br />
Vice President,<br />
Engineering and<br />
Chief Technology Officer<br />
peter h. challan<br />
Vice President,<br />
Government Relations<br />
wesley b. covell<br />
Vice President,<br />
Strategy and Chief Growth Officer<br />
anthony d. deglomine iii<br />
Vice President,<br />
Deputy General Counsel<br />
john l. draheim<br />
Vice President,<br />
Global Shared Services and<br />
Assistant Treasurer<br />
tom eaton<br />
President,<br />
Harris CapRock Communications<br />
terry l. feiser<br />
Vice President,<br />
Internal Audit and Compliance<br />
charles j. greene<br />
Vice President,<br />
Tax and Treasurer<br />
john e. heller<br />
President,<br />
Harris IT Services<br />
ted hengst<br />
Vice President,<br />
Chief Information Officer<br />
robert a. johnson jr.<br />
Managing Counsel,<br />
M&A, SEC & Corporate and<br />
Assistant Secretary<br />
janice m. lindsay<br />
Vice President,<br />
Supply Chain Management and<br />
Operations<br />
stephen marschilok<br />
President,<br />
Public Safety and Professional<br />
Communications<br />
<strong>harris</strong> morris, jr.<br />
President,<br />
Broadcast Communications<br />
ricardo a. navarro<br />
Vice President,<br />
Corporate Development<br />
brendan f. o’connell<br />
President,<br />
DoD Tactical Radio<br />
Communications<br />
pamela padgett<br />
Vice President,<br />
Investor Relations<br />
leon v. shivamber<br />
Vice President,<br />
Managing Director<br />
Harris International Abu Dhabi<br />
andrew p. start<br />
President,<br />
International Tactical Radio<br />
Communications
RECONCILIATION OF NON-GAAP FINANCIAL MEASURES AND REGULATION G DISCLOSURE<br />
To supplement our consolidated financial statements presented in accordance with U.S. generally accepted accounting principles (GAAP), we provide<br />
additional measures of income from continuing operations, income from continuing operations per diluted share, earnings before interest, taxes,<br />
depreciation and amortization (“EBITDA”) and segment operating income, adjusted to exclude certain costs, charges, expenses, gains and losses. Harris<br />
management believes that these non-GAAP financial measures, when considered together with the GAAP financial measures, provide information that<br />
is useful to investors in understanding period-over-period operating results separate and apart from items that may, or could, have a disproportionately<br />
positive or negative impact on results in any particular period. Harris management also believes that these non-GAAP financial measures enhance<br />
the ability of investors to analyze Harris’ business trends and to understand Harris’ performance. In addition, Harris may utilize non-GAAP financial<br />
measures as a guide in its forecasting, budgeting and long-term planning process and to measure operating performance for some management<br />
compensation purposes. Any analysis of non-GAAP financial measures should be used only in conjunction with results presented in accordance with<br />
GAAP. A reconciliation of these non-GAAP financial measures with the most directly comparable financial measures calculated in accordance with<br />
GAAP follows:<br />
INCOME FROM CONTINUING OPERATIONS AND INCOME FROM CONTINUING OPERATIONS<br />
PER DILUTED SHARE<br />
INCOME FROM PER DILUTED<br />
DOLLARS IN MILLIONS, EXCEPT PER SHARE AMOUNTS CONTINUING OPERATIONS SHARE<br />
Fiscal 2011 GAAP $ 588.0 $ 4.60<br />
Adjustments 36.8 (a) .29 (a)<br />
Fiscal 2011 non-GAAP $ 624.8 $ 4.89<br />
Fiscal 2010 GAAP $ 561.6 $ 4.28<br />
Adjustments 19.9 (b) .15 (b)<br />
Fiscal 2010 non-GAAP $ 581.5 $ 4.43<br />
% increase from fiscal 2010 non-GAAP to fiscal 2011 non-GAAP 7.4% 10.4%<br />
Fiscal 2009 GAAP $ 312.4 $ 2.33<br />
Adjustments 203.1 (c) 1.52 (c)<br />
Fiscal 2009 non-GAAP $ 515.5 $ 3.85<br />
ADJUSTED EBITDA<br />
FISCAL YEAR ENDED<br />
DOLLARS IN MILLIONS JULY 2, 2010 JULY 1, 2011<br />
GAAP income from continuing operations attributable to Harris Corporation $ 561.6 $ 588.0<br />
Noncontrolling interests, net of income taxes — (0.9)<br />
GAAP income from continuing operations 561.6 587.1<br />
Income taxes 278.7 293.6<br />
GAAP income from continuing operations before income taxes 840.3 880.7<br />
Net interest expense 70.6 87.6<br />
Depreciation and amortization 165.7 212.0<br />
EBITDA 1,076.6 1,180.3<br />
Non-GAAP adjustments 26.1 (b) 46.6 (a)<br />
Adjusted EBITDA $ 1,102.7 $ 1,226.9<br />
% increase from fiscal 2010 adjusted EBITDA to fiscal 2011 adjusted EBITDA 11.3%<br />
SEGMENT PERFORMANCE<br />
DOLLARS IN MILLIONS<br />
FISCAL YEAR ENDED<br />
JULY 1, 2011<br />
INTEGRATED NETWORK SOLUTIONS<br />
GAAP segment operating income $ 70.2<br />
Adjustments 46.6 (a)<br />
Non-GAAP segment operating income $ 116.8<br />
(a) Adjustments for fiscal 2011 included: a $46.6 million ($36.8 million after-tax, or $.29 per diluted share) charge for integration and other costs in our Integrated Network<br />
Solutions segment associated with our acquisitions of CapRock Communications (“CapRock”), the Global Connectivity Services business of the Schlumberger group,<br />
the infrastructure assets of the government business of Core180, Inc. and Carefx Corporation.<br />
(b) Adjustments for fiscal 2010 included: a $19.3 million ($14.5 million after-tax, or $.11 per diluted share) charge for integration and other costs in our RF Communications segment<br />
associated with our acquisition of the Tyco Electronics Wireless Systems business (“Wireless Systems”); a $4.4 million ($3.6 million after-tax, or $.03 per diluted share) charge<br />
for integration and other costs in our Integrated Network Solutions segment associated with our acquisitions of Patriot Technologies, LLC, SignaCert, Inc. and CapRock; and a<br />
$2.4 million ($1.8 million after-tax, or $.01 per diluted share) charge for integration and other costs in our Government Communications Systems segment associated with our<br />
acquisitions of Crucial Security, Inc. (“Crucial”) and the Air Traffic Control business unit of SolaCom Technologies, Inc.<br />
(c) Adjustments for fiscal 2009 included: a $196.7 million after-tax ($1.48 per diluted share) non-cash charge for impairment of goodwill and other long-lived assets in our<br />
Integrated Network Solutions segment; a $6.0 million after-tax ($.04 per diluted share) charge for integration and other costs in our RF Communications segment associated<br />
with our acquisition of Wireless Systems; and a $0.4 million after-tax charge in our Government Communications Systems segment for integration costs associated with our<br />
acquisition of Crucial.<br />
9
HARRIS CORPORATION<br />
2011 FORM 10-K
UNITED STATES<br />
SECURITIES AND EXCHANGE COMMISSION<br />
WASHINGTON, D.C. 20549<br />
FORM 10-K<br />
(Mark One)<br />
¥ ANNUAL REPORT PURSUANT TO SECTION 13 OR 15(d) OF THE SECURITIES<br />
EXCHANGE ACT OF 1934<br />
For the fiscal year ended July 1, 2011<br />
OR<br />
n TRANSITION REPORT PURSUANT TO SECTION 13 OR 15(d) OF THE SECURITIES<br />
EXCHANGE ACT OF 1934<br />
For the transition period from to<br />
Commission File Number 1-3863<br />
Delaware<br />
(State or other jurisdiction of in<strong>corporation</strong> or organization)<br />
1025 West NASA Boulevard<br />
Melbourne, Florida<br />
(Address of principal executive offices)<br />
HARRIS CORPORATION<br />
(Exact name of registrant as specified in its charter)<br />
34-0276860<br />
(I.R.S. Employer Identification No.)<br />
32919<br />
(Zip Code)<br />
Registrant’s telephone number, including area code: (321) 727-9100<br />
Securities Registered Pursuant to Section 12(b) of the Act:<br />
Title of each class Name of each exchange on which registered<br />
Common Stock, par value $1.00 per share New York Stock Exchange<br />
Securities Registered Pursuant to Section 12(g) of the Act: None<br />
Indicate by check mark if the registrant is a well-known seasoned issuer, as defined in Rule 405 of the Securities<br />
Act. Yes „ No<br />
Indicate by check mark if the registrant is not required to file reports pursuant to Section 13 or Section 15(d) of the<br />
Act. Yes No „<br />
Indicate by check mark whether the registrant (1) has filed all reports required to be filed by Section 13 or 15(d) of the<br />
Securities Exchange Act of 1934 during the preceding 12 months (or for such shorter period that the registrant was required to<br />
file such reports), and (2) has been subject to such filing requirements for the past 90 days. Yes „ No<br />
Indicate by check mark whether the registrant has submitted electronically and posted on its corporate Web site, if any,<br />
every Interactive Data File required to be submitted and posted pursuant to Rule 405 of Regulation S-T during the preceding<br />
12 months (or for such shorter period that the registrant was required to submit and post such files). Yes „ No<br />
Indicate by check mark if disclosure of delinquent filers pursuant to Item 405 of Regulation S-K is not contained herein,<br />
and will not be contained, to the best of registrant’s knowledge, in definitive proxy or information statements incorporated by<br />
reference in Part III of this Form 10-K or any amendment to this Form 10-K. „<br />
Indicate by check mark whether the registrant is a large accelerated filer, an accelerated filer, a non-accelerated filer, or a<br />
smaller reporting company. See the definitions of “large accelerated filer,” “accelerated filer” and “smaller reporting company”<br />
in Rule 12b-2 of the Exchange Act.<br />
Large accelerated filer „ Accelerated filer<br />
Non-accelerated filer (Do not check if a smaller reporting company) Smaller reporting company<br />
Indicate by check mark whether the registrant is a shell company (as defined in Rule 12b-2 of the Exchange<br />
Act). Yes No „<br />
The aggregate market value of the voting common equity held by non-affiliates of the registrant was $5,760,729,154 (based<br />
upon the quoted closing sale price per share of the stock on the New York Stock Exchange) on the last business day of the<br />
registrant’s most recently completed second fiscal quarter (December 31, 2010). For purposes of this calculation, the registrant<br />
has assumed that its directors and executive officers as of December 31, 2010 are affiliates.<br />
The number of outstanding shares of the registrant’s common stock as of August 26, 2011 was 120,208,465.<br />
Documents Incorporated by Reference:<br />
Portions of the registrant’s definitive Proxy Statement for the 2011 Annual Meeting of Shareholders scheduled to be held on<br />
October 28, 2011, which will be filed with the Securities and Exchange Commission within 120 days after the end of the<br />
registrant’s fiscal year ended July 1, 2011, are incorporated by reference into Part III of this Annual Report on Form 10-K to the<br />
extent described therein.
Part I:<br />
Part II:<br />
Part III:<br />
HARRIS CORPORATION<br />
ANNUAL REPORT ON FORM 10-K FOR THE FISCAL YEAR ENDED JULY 1, 2011<br />
TABLE OF CONTENTS<br />
Page No.<br />
ITEM 1. Business ....................................................... 1<br />
ITEM 1A. Risk Factors .................................................... 18<br />
ITEM 1B. Unresolved Staff Comments ......................................... 25<br />
ITEM 2. Properties ...................................................... 26<br />
ITEM 3. Legal Proceedings . . . ............................................. 26<br />
ITEM 4. (Removed and Reserved) ........................................... 28<br />
Executive Officers of the Registrant. ............................................ 28<br />
ITEM 5. Market for Registrant’s Common Equity, Related Stockholder Matters and Issuer<br />
Purchases of Equity Securities ....................................... 30<br />
ITEM 6. Selected Financial Data ............................................ 33<br />
ITEM 7. Management’s Discussion and Analysis of Financial Condition and Results of<br />
Operations ...................................................... 34<br />
ITEM 7A. Quantitative and Qualitative Disclosures About Market Risk ................. 57<br />
ITEM 8. Financial Statements and Supplementary Data ........................... 58<br />
ITEM 9. Changes in and Disagreements with Accountants on Accounting and Financial<br />
Disclosure ...................................................... 96<br />
ITEM 9A. Controls and Procedures. ........................................... 96<br />
ITEM 9B. Other Information . . . ............................................. 96<br />
ITEM 10. Directors, Executive Officers and Corporate Governance .................... 97<br />
ITEM 11. Executive Compensation ........................................... 97<br />
ITEM 12. Security Ownership of Certain Beneficial Owners and Management and Related<br />
Stockholder Matters . . ............................................. 98<br />
ITEM 13. Certain Relationships and Related Transactions, and Director Independence. ..... 98<br />
ITEM 14. Principal Accountant Fees and Services ................................ 98<br />
Part IV:<br />
ITEM 15. Exhibits, Financial Statement Schedules ................................ 99<br />
Signatures. ....................................................................... 107<br />
Exhibits<br />
This Annual Report on Form 10-K contains trademarks, service marks and registered marks of Harris<br />
Corporation and its subsidiaries. Bluetooth» is a registered trademark of Bluetooth SIG, Inc. 7-Eleven» is a<br />
registered trademark of 7-Eleven, Inc. All other trademarks are the property of their respective owners.
Cautionary Statement Regarding Forward-Looking Statements<br />
This Annual Report on Form 10-K (this “Report”), including “Item 7. Management’s Discussion and Analysis<br />
of Financial Condition and Results of Operations,” contains forward-looking statements that involve risks and<br />
uncertainties, as well as assumptions that, if they do not materialize or prove correct, could cause our results to<br />
differ materially from those expressed in or implied by such forward-looking statements. All statements other than<br />
statements of historical fact are statements that could be deemed forward-looking statements, including, but not<br />
limited to, statements concerning: our plans, strategies and objectives for future operations; new products, services<br />
or developments; future economic conditions, performance or outlook; the outcome of contingencies; the potential<br />
level of share repurchases; the value of our contract awards and programs; expected cash flows or capital<br />
expenditures; our beliefs or expectations; activities, events or developments that we intend, expect, project, believe<br />
or anticipate will or may occur in the future; and assumptions underlying any of the foregoing. Forward-looking<br />
statements may be identified by their use of forward-looking terminology, such as “believes,” “expects,” “may,”<br />
“should,” “would,” “will,” “intends,” “plans,” “estimates,” “anticipates,” “projects” and similar words or expressions.<br />
You should not place undue reliance on these forward-looking statements, which reflect our management’s opinions<br />
only as of the date of the filing of this Report and are not guarantees of future performance or actual results. Factors<br />
that might cause our results to differ materially from those expressed in or implied by these forward-looking<br />
statements include, but are not limited to, those discussed in “Item 1A. Risk Factors” of this Report. All forwardlooking<br />
statements are qualified by, and should be read in conjunction with, those risk factors. Forward-looking<br />
statements are made in reliance upon the safe harbor provisions of Section 27A of the Securities Act of 1933, as<br />
amended (the “Securities Act”), and Section 21E of the Securities Exchange Act of 1934, as amended (the<br />
“Exchange Act”), and we undertake no obligation, other than imposed by law, to update forward-looking statements<br />
to reflect further developments or information obtained after the date of filing of this Report or, in the case of any<br />
document incorporated by reference, the date of that document, and disclaim any obligation to do so.<br />
ITEM 1. BUSINESS.<br />
PART I<br />
HARRIS<br />
Harris Corporation, together with its subsidiaries, is an international communications and information<br />
technology company serving government and commercial markets in more than 150 countries. We are dedicated to<br />
developing best-in-class assured communications» products, systems and services for global markets, including RF<br />
communications, integrated network solutions and government communications systems.<br />
Harris Corporation was incorporated in Delaware in 1926 as the successor to three companies founded in the<br />
1890s. Our principal executive offices are located at 1025 West NASA Boulevard, Melbourne, Florida 32919, and<br />
our telephone number is (321) 727-9100. Our common stock is listed on the New York Stock Exchange under the<br />
symbol “HRS.” On July 1, 2011, we employed approximately 16,900 people. Unless the context otherwise requires,<br />
the terms “we,” “our,” “us,” “Company” and “Harris” as used in this Report refer to Harris Corporation and its<br />
subsidiaries.<br />
General<br />
We structure our operations primarily around the products and services we sell and the markets we serve, and<br />
we report the financial results of our operations in the following three reportable operating segments:<br />
• Our RF Communications segment, comprised of (i) U.S. Department of Defense and International Tactical<br />
Communications and (ii) Public Safety and Professional Communications;<br />
• Our Integrated Network Solutions segment, comprised of (i) IT Services, (ii) Managed Satellite and<br />
Terrestrial Communications Solutions, (iii) Healthcare Solutions, (iv) Cyber Integrated Solutions and<br />
(v) Broadcast and New Media Solutions; and<br />
• Our Government Communications Systems segment, comprised of (i) Civil Programs, (ii) Defense Programs<br />
and (iii) National Intelligence Programs.<br />
As previously reported and as discussed further in Note 25: Business Segments in the Notes to Consolidated<br />
Financial Statements in this Report (the “Notes”), our reportable operating segment structure reflects that, in the<br />
third quarter of fiscal 2011, we realigned our operations to provide increased market focus and address the fastgrowing<br />
global market for integrated communications and information technology and services. As a result of the<br />
realignment of our operations, effective for the third quarter of fiscal 2011, we formed our Integrated Network<br />
Solutions segment as a new segment. The new segment realigns IT Services, Managed Satellite and Terrestrial<br />
1
Communications Solutions, Healthcare Solutions and Cyber Integrated Solutions (all of which were formerly under<br />
our Government Communications Systems segment) with Broadcast and New Media Solutions (formerly a separate<br />
reportable segment called Broadcast Communications). Our RF Communications segment did not change. The<br />
historical results, discussion and presentation of our operating segments as set forth in this Report have been<br />
adjusted to reflect the impact of these changes to our reportable operating segment structure for all periods<br />
presented in this Report.<br />
In the fourth quarter of fiscal 2009, in connection with the May 27, 2009 spin-off (the “Spin-off”) in the form<br />
of a taxable pro rata dividend to our shareholders of all the shares of Harris Stratex Networks, Inc. (now known as<br />
Aviat Networks, Inc.) (“HSTX”) common stock owned by us, we eliminated our former HSTX operating segment.<br />
Our historical financial results have been restated to account for HSTX as discontinued operations for all periods<br />
presented in this Report, and unless otherwise specified, disclosures in this Report relate solely to our continuing<br />
operations. For additional information regarding discontinued operations, see Note 3: Discontinued Operations in the<br />
Notes.<br />
Financial information with respect to all of our other activities, including corporate costs not allocated to the<br />
operating segments or discontinued operations, is reported as part of the “Unallocated corporate expense” or “Nonoperating<br />
loss” line items in our Consolidated Financial Statements and accompanying Notes.<br />
Recent Acquisitions<br />
Acquisition of CapRock. On July 30, 2010, we acquired privately held CapRock Holdings, Inc. and its<br />
subsidiaries, including CapRock Communications, Inc. (collectively, “CapRock”), a global provider of missioncritical,<br />
managed satellite communications services for the government, energy and maritime industries. CapRock’s<br />
solutions include broadband Internet access, voice over Internet Protocol (“VOIP”) telephony, wideband networking<br />
and real-time video, delivered to nearly 2,000 customer sites around the world. The acquisition of CapRock<br />
increased the breadth of our assured communications» capabilities, while enabling us to enter new vertical markets<br />
and increase our international presence. The total net purchase price for CapRock was $517.5 million. We report<br />
CapRock as part of Managed Satellite and Terrestrial Communications Solutions under our Integrated Network<br />
Solutions segment.<br />
Acquisition of Schlumberger GCS. On April 4, 2011, we acquired from Schlumberger B.V. and its affiliates<br />
(“Schlumberger”) substantially all of the assets of the Schlumberger group’s Global Connectivity Services business<br />
(“Schlumberger GCS”), a provider of satellite and terrestrial communications services for the worldwide energy<br />
industry. The total net purchase price for Schlumberger GCS was $380.6 million, subject to post-closing<br />
adjustments. We report Schlumberger GCS as part of Managed Satellite and Terrestrial Communications Solutions<br />
under our Integrated Network Solutions segment.<br />
Acquisition of Carefx. Also on April 4, 2011, we acquired privately held Carefx Corporation (“Carefx”), a<br />
provider of interoperability workflow solutions for government and commercial healthcare providers. Carefx’s<br />
solution suite is used by more than 800 hospitals, healthcare systems and health information exchanges across<br />
North America, Europe and Asia. This acquisition expanded our presence in government healthcare, provided entry<br />
into the commercial healthcare market, and is expected to leverage the healthcare interoperability workflow products<br />
offered by Carefx and the broader scale of enterprise intelligence solutions and services that we provide. The total<br />
net purchase price for Carefx was $152.6 million, subject to post-closing adjustments. We report Carefx as part of<br />
Healthcare Solutions under our Integrated Network Solutions segment.<br />
Subsequent Event — Share Repurchase Program<br />
On July 30, 2011, our Board of Directors approved a new $1 billion share repurchase program (the “New<br />
Repurchase Program”) and increased the quarterly cash dividend rate on our common stock from $0.25 per share to<br />
$0.28 per share. The New Repurchase Program replaced our prior share repurchase program (the “2009 Repurchase<br />
Program”), which had a remaining, unused authorization of approximately $200 million. The New Repurchase<br />
Program does not have a stated expiration date. We currently expect to repurchase up to $500 million in shares<br />
under the New Repurchase Program by the end of calendar year 2011. The New Repurchase Program is expected to<br />
result in repurchases well in excess of the dilutive effect of shares issued under our share-based incentive plans.<br />
However, the level of our repurchases depends on a number of factors, including our financial condition, capital<br />
requirements, results of operations, future business prospects and other factors our Board of Directors may deem<br />
relevant. Share repurchases are expected to be funded with available cash and commercial paper. Repurchases under<br />
the New Repurchase Program may be made through open market purchases, private transactions, transactions<br />
structured through investment banking institutions, or any combination thereof. The timing, volume and nature of<br />
2
share repurchases are subject to market conditions, applicable securities laws and other factors and are at our<br />
discretion and may be suspended or discontinued at any time.<br />
Financial Information About Our Business Segments<br />
Financial information with respect to our business segments, including revenue, operating income or loss and<br />
total assets, and with respect to our operations outside the United States, is contained in Note 25: Business Segments<br />
in the Notes and is incorporated herein by reference.<br />
Description of Business by Segment<br />
RF Communications<br />
RF Communications is a global supplier of secure tactical radio communications and embedded high-grade<br />
encryption solutions for military, government and commercial organizations and also of secure communications<br />
systems and equipment for public safety, utility and transportation markets. RF Communications is comprised of<br />
(i) U.S. Department of Defense and International Tactical Communications and (ii) Public Safety and Professional<br />
Communications.<br />
U.S. Department of Defense and International Tactical Communications: We design, develop and manufacture<br />
a comprehensive line of secure radio communications products and systems for manpack, handheld, soldier-worn,<br />
vehicular, strategic fixed-site and shipboard applications that operate in various radio frequency bands — highfrequency<br />
(“HF”), very high-frequency (“VHF”) and ultra high-frequency (“UHF”) — as well as in multiband mode<br />
and over satellite communications (“SATCOM”). These radio systems are highly flexible, interoperable and capable<br />
of supporting diverse mission requirements. Our Falcon» family of tactical radios is built on a software-defined<br />
radio platform that is reprogrammable to add features or software upgrades. Our Falcon radios also have the highest<br />
grade embedded encryption and provide highly mobile, secure and reliable network communications capability<br />
without relying on a fixed infrastructure. This capability allows warfighters, for example, to remain connected with<br />
each other, their command structures and support organizations, and provides them the ability to communicate<br />
information and maintain situational awareness of both friendly and opposing forces, which are critical to both the<br />
safety and success of their missions. Our Falcon radio systems have been widely deployed in multiple variants of<br />
Mine Resistant Ambush-Protect (“MRAP”) vehicles for the U.S. Department of Defense (“DoD”).<br />
Unlike many of our competitors in the U.S. Government market, we operate this business on a “commercial”<br />
customer-driven business model, as opposed to a government programs-driven business model. This means that we<br />
anticipate market needs, invest our internal research and development resources, build to our internal forecast, and<br />
provide ready-to-ship, commercial, off-the-shelf (“COTS”) products to customers more quickly than customers can<br />
typically obtain similar products under government-funded programs.<br />
Our Falcon III» family of radios is the next generation of multiband, multi-mission tactical radios supporting<br />
the U.S. military’s Joint Tactical Radio System (“JTRS”) requirements as well as network-centric operations<br />
worldwide. Our Falcon III radios address the full range of current mission and interoperability requirements and are<br />
fully upgradeable to address changing technical standards and mission requirements of the future. Advances in our<br />
Falcon III radios include extended frequency range, significant reductions in weight and size compared with<br />
previous generations and programmable encryption.<br />
Our Falcon III multiband handheld radio, the AN/PRC-152(C) (“152C”), is the world’s most widely deployed<br />
JTRS-approved software-defined handheld radio and was our first Falcon III radio to be fielded. We have<br />
successfully fielded more than 100,000 152Cs, which are widely fielded by all branches of the DoD, many allies<br />
worldwide and U.S. Federal agencies. The 152C offers users a wide range of capabilities, such as legacy Single<br />
Channel Ground and Airborne System (“SINCGARS”) interoperability; UHF ground-to-ground line-of-sight<br />
communications; close-air support; tactical SATCOM; and the Association of Public Safety Communications<br />
Officials — International (“APCO”) P25 waveform to provide direct communications with first responders. The<br />
152C also serves as the handheld-based transceiver of our Falcon III AN/VRC-110, a high-performance, multiband<br />
vehicular system that offers the added feature of easy vehicle dismount — a “grab-and-go” feature that delivers<br />
continuous communications when removed from the vehicle, an important capability in urban environments.<br />
Our Falcon III multiband manpack radio, the AN/PRC-117G (“117G”), is the first JTRS Software<br />
Communications Architecture (“SCA”)-certified and National Security Agency (“NSA”) Type-1 certified manpack<br />
radio system providing wideband networking capability, enabling the transition to a networked battlefield<br />
communications environment and high-bandwidth applications, including streaming video, simultaneous voice and<br />
data feeds, intelligence reporting and analysis, collaborative chat, route planning, convoy tracking, checkpoint<br />
biometrics and connectivity to secure networks (“SIPRNet”). The 117G uses the Harris-developed Adaptive<br />
3
Networking Wideband Waveform (“ANW2”) for high bandwidth data operation and is designed for future upgrade<br />
to the JTRS Soldier Radio Waveform (“SRW”). The 117G’s wideband network access capabilities give warfighters<br />
and field commanders critical real-time information. The 117G has been deployed to all branches of the DoD and is<br />
being used in a wide variety of ground, vehicular and airborne applications, including intelligence, surveillance and<br />
reconnaissance (“ISR”). The 117G includes a Remote Operated Video Enhanced Receiver (“ROVER”) interoperable<br />
mode that provides warfighters on the battlefield with the ability to receive live video directly from unmanned aerial<br />
vehicles (“UAVs”). This capability allows users to receive video feeds directly from UAVs without an intermediary<br />
or having to pass that information from a base station.<br />
Our cryptographic solutions encompass NSA-certified products and systems that range from single integrated<br />
circuits to major communications systems, including our Sierra» and Citadel» embedded encryption solutions and<br />
KGV-72 blue force tracking programmable encryption devices and our SecNet 11» and SecNet 54 TM Internet<br />
Protocol (“IP”) communications families of communications security (“COMSEC”) terminals.<br />
In the international market, our tactical radios are the standard of NATO and Partnership for Peace countries<br />
and have been sold to more than 100 countries through our strong, longstanding international distribution channels<br />
consisting of regional sales offices and a broad dealer network. International tactical radio demand is being driven<br />
by continuing tactical communications modernization and standardization programs to provide more sophisticated<br />
communications capabilities to address traditional and emerging threats and to provide interoperability. In fiscal<br />
2011, we received tactical radio orders from, and/or made deliveries to, a wide range of international customers,<br />
including Afghanistan, Australia, Brazil, Canada, Mexico and various countries in Africa, Asia and Southeast Asia<br />
that we are not permitted to name. Additionally, we are providing integrated communications systems for the<br />
international market. Our integrated systems offerings are largely based on our products, but include other<br />
companies’ products, as well as a wide variety of applications, in order to implement integrated command, control,<br />
communications, computers, intelligence, surveillance and reconnaissance (“C4ISR”) systems for many different<br />
types of platforms, including command post and transit case systems, vehicular and shelter communications systems<br />
and specialized airborne applications, which are frequently used in border security and surveillance systems.<br />
Public Safety and Professional Communications: We supply assured communications» systems and equipment<br />
for public safety, federal, utility, commercial and transportation markets, with products ranging from complete<br />
end-to-end wireless network infrastructure solutions, including advanced IP voice and data networks, that support<br />
multiple platforms and provide interoperability among disparate systems, to portable and mobile single-band and<br />
multiband, multimode radios, to public safety-grade broadband voice, video and data solutions. On May 29, 2009,<br />
we acquired substantially all of the assets of the Tyco Electronics wireless systems business (“Wireless Systems”)<br />
(formerly known as M/A-COM). Our acquisition of Wireless Systems served to form our Public Safety and<br />
Professional Communications business. This business has more than 80 years of experience and supports over<br />
500 systems around the world.<br />
As part of our business of designing, building, distributing, maintaining and supplying wireless communications<br />
systems, we offer our Voice, Interoperability, Data and Access (“VIDA”) network platform — a unified IP-based<br />
voice and data communication system based on APCO P25 industry standards that provides network-level<br />
interoperable communications among public safety agencies and that supports a full line of communications<br />
systems, including OpenSky», NetworkFirst, P25 IP and Enhanced Digital Access Communication System<br />
(“EDACS”), allowing seamless interconnection of diverse systems. Our VIDA network solutions currently serve as<br />
the backbone in some of the largest and most advanced statewide and regional communications networks in North<br />
America, including the Commonwealth of Pennsylvania and State of Florida.<br />
In addition to a full range of single-band land mobile radio terminals, we offer our Unity TM family of multiband<br />
radios, including the Unity XG-100P handheld radio and the new Unity XG-100M full-spectrum mobile radio for<br />
vehicles. Our Unity multiband radios cover all public safety frequency bands in a single radio; operate on APCO<br />
P25 conventional and trunked systems; are backwards compatible with analog FM systems; and include advanced<br />
capabilities, such as an internal Global Positioning System (“GPS”) receiver for situational awareness, internal<br />
secure Bluetooth» wireless technology, and background noise suppression features. They also include true softwaredefined<br />
radio architecture that allows flexibility for future growth, including a software-only upgrade to APCO P25<br />
Phase 2, the next-generation emerging standard for mission-critical communications. Our Unity radios’ multiband,<br />
multi-mode capabilities enable a single radio to communicate with multiple organizations, jurisdictions and agencies<br />
operating on different frequencies and systems, thus providing a significant improvement over most current radio<br />
systems for U.S. public safety, which are not interoperable and thus require users to carry multiple radios or route<br />
transmissions through ad-hoc network bridges, often configured at the time of an emergency, and resulting in<br />
instances where agencies responding to a common incident cannot talk to each other.<br />
4
We received two large, multi-year program awards in fiscal 2011, both in the third quarter:<br />
• A contract by the Government of Alberta, Canada to design and build the Alberta First Responders Radio<br />
Communications System that will provide public safety communications within the Province’s<br />
256,000 square-mile area, including an initial order of CAD289 million; and<br />
• A 10-year price agreement requirements contract by the State of Oregon for the Oregon State Radio Project<br />
(“OSRP”) program designed to improve voice and data interoperability among state, local, county, tribal and<br />
federal agencies, under which Oregon state and local agencies may purchase public safety communication<br />
systems, radios and other equipment. We received an initial order of $50 million under the OSRP contract<br />
vehicle in the fourth quarter of fiscal 2011 that includes 4,200 of our new Unity XG-100M multiband mobile<br />
radios.<br />
Revenue, Operating Income and Backlog: Revenue for the RF Communications segment increased<br />
10.7 percent to $2,289 million in fiscal 2011 compared with $2,067 million in fiscal 2010, and was $1,761 million<br />
in fiscal 2009. Segment operating income increased 11.3 percent to $787.0 million in fiscal 2011 compared with<br />
$707.4 million in fiscal 2010, and was $571.5 million in fiscal 2009. The RF Communications segment contributed<br />
39 percent of our total revenue in fiscal 2011 compared with 40 percent in fiscal 2010 and 35 percent in fiscal 2009.<br />
The percentage of this segment’s revenue that was derived outside of the United States was 31 percent in fiscal<br />
2011 compared with 20 percent in fiscal 2010 and 39 percent in fiscal 2009. In fiscal 2011, fiscal 2010 and fiscal<br />
2009, U.S. Government customers, including the DoD and intelligence and civilian agencies, as well as foreign<br />
military sales through the U.S. Government, whether directly or through prime contractors, accounted for<br />
approximately 63 percent of this segment’s total revenue. For a general description of our U.S. Government<br />
contracts and subcontracts, including a discussion of revenue generated from cost-reimbursable versus fixed-price<br />
contracts, see “Item 1. Business — Principal Customers; Government Contracts” of this Report.<br />
In general, this segment’s domestic products are sold and serviced directly to customers through its sales<br />
organization and through established distribution channels. Internationally, this segment markets and sells its<br />
products and services through regional sales offices and established distribution channels. See “Item 1. Business —<br />
International Business” of this Report.<br />
The funded backlog of unfilled orders for this segment was $1,503 million at July 1, 2011 compared with<br />
$1,764 million at July 2, 2010 and $922 million at July 3, 2009. We expect to fill approximately 62 percent of this<br />
funded backlog during fiscal 2012, but we can give no assurance of such fulfillment. Additional information<br />
regarding funded backlog is provided under “Item 1. Business — Funded and Unfunded Backlog” of this Report.<br />
For a discussion of certain risks affecting this segment, including risks relating to our U.S. Government contracts<br />
and subcontracts, see “Item 1. Business — Principal Customers; Government Contracts,” “Item 1A. Risk Factors”<br />
and “Item 3. Legal Proceedings” of this Report.<br />
Integrated Network Solutions<br />
Our Integrated Network Solutions segment addresses the fast-growing global market for integrated<br />
communications and information technology and services and provides a variety of trusted networking capabilities<br />
to support government, energy, healthcare, enterprise and broadcast customers. These capabilities include missioncritical<br />
end-to-end information technology (“IT”) services; managed satellite and terrestrial communications<br />
solutions; standards-based healthcare interoperability and image management solutions; cyber integration and cloud<br />
application hosting solutions; and digital media management solutions.<br />
IT Services: We provide end-to-end solutions in mission-critical IT transformation, IT services and information<br />
assurance. With over 3,000 professionals performing to the highest industry standards, we offer demonstrated past<br />
performance, proven technical expertise and innovative solutions in supporting large-scale IT programs that encompass<br />
the full technology lifecycle, including network design, deployment, operations and ongoing support. Our distributed<br />
workforce and extensive experience in performance-based contracting and IT services are key factors in delivering<br />
results to our defense, intelligence, homeland security, civil and commercial customers.<br />
Our IT transformation solutions use a holistic approach built on proven methodologies to design, implement<br />
and manage enterprise-wide architectures that align IT goals with customers’ business and mission goals. Our<br />
standards-based, repeatable IT transformation solutions unify, streamline and modernize unwieldy and disparate<br />
networks and systems across distributed environments, resulting in highly simplified, flexible, secure and<br />
manageable network infrastructures.<br />
Our IT services solutions include outsourced staffing and infrastructure, sustained by comprehensive operations<br />
and maintenance offerings, and are based on a flexible, scalable and repeatable service level agreement (“SLA”)<br />
5
performance-driven business model, frequently in a fixed-price environment. Our IT services solutions use an<br />
Information Technology Infrastructure Library (“ITIL”)-based best-practices approach for optimizing and supporting<br />
IT and communications environments, improving efficiencies, lowering operational costs and allowing customers to<br />
focus on mission performance.<br />
Our information assurance solutions include architecture analysis; attack warning and defense; identity<br />
management; security assessments; certification and accreditation process support; forensics analysis and<br />
vulnerability remediation; system anomaly monitoring, detection and management; and physical security<br />
countermeasures. Our information assurance solutions safeguard the confidentiality, integrity and availability of<br />
enterprise infrastructures, systems and critical business data over the full IT lifecycle, from infrastructure design to<br />
integration and testing to operations and maintenance. Those solutions meet widely used certification and<br />
accreditation standards, including the Federal Information Security Management Act (“FISMA”), the National<br />
Security Agency/Central Security Service Information System Certification and Accreditation Process (“NISCAP”)<br />
and the Department of Defense Information Assurance Certification and Accreditation Process (“DIACAP”).<br />
We design, deploy, operate and support customer-centric, secure communications systems and information<br />
networks for high-profile customers, and examples include the following:<br />
• We provide operations and maintenance support at locations around the world for the communications<br />
functions for the U.S. Air Force 50th Space Wing’s Satellite Control Network (“AFSCN”), a global,<br />
continuously operational network of ground stations, operational control nodes and communications links that<br />
support launch and command and control of various space programs managed by the DoD and other national<br />
security space organizations, under the Network and Space Operations and Maintenance (“NSOM”) program;<br />
• We provide the U.S. Navy with comprehensive, end-to-end support for data, video and voice communications<br />
for over 700,000 users as a Tier One subcontractor under the Navy/Marine Corps Intranet (“NMCI”)<br />
program;<br />
• We provide operations, maintenance and support services for the global communications and information<br />
systems network for the National Reconnaissance Office (“NRO”) under a program called “Patriot”;<br />
• We provide IT integration of installation, training, help desk, passport and configuration management services<br />
for the U.S. Department of State, Bureau of Consular Affairs in support of more than 230 U.S. embassies and<br />
consulates around the world;<br />
• We provide system maintenance and engineering for the Defense Information Systems Agency (“DISA”)<br />
Crisis Management System;<br />
• We design and manage systems that combine IP television (“IPTV”) and digital signage and IT infrastructure<br />
to create an advanced media workflow for an in-arena network for the Orlando Magic’s new basketball<br />
arena; and<br />
• We provide IT services, content delivery, hardware and software for a project in collaboration with Digital<br />
Display Networks, Inc. and ABC to create one of the largest digital out-of-home advertising networks in the<br />
world, 7-Eleven» TV, which has been installed in over 3,000 7-Eleven stores.<br />
Examples of awards we received in fiscal 2011 include a contract, with a potential value of $77 million, by the<br />
U.S. Army Materiel Command (“AMC”) to provide IT infrastructure and follow-on operations and maintenance<br />
support for the relocation of the AMC Headquarters building to Huntsville, Alabama and a nine-year follow-on<br />
contract, with a potential value of CAD 273 million, by the Government of Canada to provide engineering services<br />
to support the avionics systems on the CF-18 Hornet fighter aircraft under the CF-18 Avionics Optimized Weapon<br />
System Support (“OWSS”) program. We also received a contract to install an advanced, digital, out-of-home and<br />
IPTV network for the new Madison Square Garden Transformation project that will include 1,100 arena displays to<br />
deliver a dynamic viewing experience to fans.<br />
We also have key positions on a number of Indefinite Delivery/Indefinite Quantity (“IDIQ”) contracts for IT<br />
services, including as a prime contractor under the U.S. Air Force Network Centric Solutions (“NETCENTS”)<br />
contract and as a prime contractor under the U.S. Army ITES-2S contract. Our ITES-2S task orders include the<br />
AMC Headquarters relocation example above and the migration and consolidation of the communications systems<br />
for nine U.S. Southern Command (“USSOUTHCOM”) buildings into a new headquarters complex.<br />
Managed Satellite and Terrestrial Communications Solutions: We are a global provider of managed satellite<br />
and terrestrial communications solutions, specifically for remote and harsh environments including the energy,<br />
government and maritime industries. We own and operate a robust global infrastructure that includes teleports on six<br />
continents; five network operations centers running 24 hours per day, seven days per week; local presence in 23<br />
countries; and over 275 global field service personnel supporting customer locations across North America, Central<br />
and South America, Europe, West Africa and Asia-Pacific. Our customers include Chevron, Diamond Offshore,<br />
6
ExxonMobil, Halliburton, MODEC, Shell, Transocean, KBR, Green Reefers, Gulf Offshore, Seatrans, Oceaneering,<br />
Subsea 7, the DoD, the Department of Homeland Security and other Federal civilian U.S. Government agencies, and<br />
in addition, we are a preferred supplier to the Schlumberger group. Our solutions include broadband Internet access,<br />
VOIP telephony, wideband networking and real-time video, delivered to customer sites around the world.<br />
Our managed satellite and terrestrial communications solutions operations are the result of our combination in<br />
fiscal 2011 of (i) CapRock, a global provider of mission-critical, managed satellite communications services for the<br />
government, energy and maritime industries, which we acquired on July 30, 2010; (ii) Schlumberger GCS, a provider<br />
of satellite and terrestrial communications services for the worldwide energy industry, which we acquired on April 4,<br />
2011; and (iii) the terrestrial network infrastructure assets of the government business of Core180, Inc. (the “Core180<br />
Infrastructure”) that we acquired in the third quarter of fiscal 2011, with (iv) our existing Maritime Communications<br />
Services operations.<br />
Examples of awards we received in fiscal 2011 include the following:<br />
• Four contracts to provide managed network services and more than 400 MHz of commercial satellite capacity<br />
to four separate U.S. Government agencies, under which the services provided will be used to support a<br />
range of missions, including airborne ISR, tactical field-deployed communications and continuity of<br />
operations;<br />
• An option-year extension, with a potential value of $80 million, on the Defense Information Systems<br />
Network Access Transport Services (“DATS”) contract with the DISA;<br />
• Three contracts from intelligence agency customers to provide satellite bandwidth, logistics and related<br />
communications services;<br />
• A five-year contract with Schahin Brazil to provide data, voice and Internet service to three drilling ships<br />
operating in the Campos Basin;<br />
• 14 task orders on the DISN Satellite Transmission Services — Global (“DSTS-G”) and Future Commercial<br />
SATCOM Acquisition (“FCSA”) contracts, with a potential value of $150 million, to provide C-, Ku-, and<br />
X-band space segment capacity, monitoring and control, teleport services, and operations and maintenance to<br />
DoD agency customers operating in Asia, Europe, the United States and all major ocean regions;<br />
• A three-year master service agreement, with a potential value of $58 million, to operate the Offshore<br />
Communications Backbone (“OCB”), a modular system of seafloor communications equipment for deepocean<br />
observation located in the eastern Mediterranean Sea; and<br />
• A two-year contract from Odfjell Drilling in Norway for offshore satellite communications.<br />
Healthcare Solutions: We provide enterprise intelligence solutions and services for government and<br />
commercial customers — including systems integration, intelligent infrastructure, interoperability, imaging and other<br />
IT solutions. We are a leader in Federal healthcare IT integration, and we also offer commercial providers a full<br />
range of interoperability solutions, including IT infrastructure and management, clinical workflow and analytics,<br />
health information exchange, and imaging. Our products, systems and services help improve healthcare quality,<br />
safety, efficiency, cost and outcomes by ensuring that the right information travels, with security and privacy, to the<br />
right person, at the right time, on the right device, at the point of care.<br />
For example, we developed under a contract from the Department of Health and Human Services (“HHS”) an<br />
open-source National Health Information Network (“NHIN”) CONNECT Gateway solution designed to enable<br />
seamless health information sharing among multiple Federal agencies and regional healthcare providers. We<br />
developed a multi-hospital military health network with image-sharing capabilities under the DoD Military Health<br />
System global Healthcare Artifact and Image Management Solution (“HAIMS”) program.<br />
In fiscal 2011, we were one of eight companies in the large business category awarded the five-year<br />
Transformation Twenty-One Total Technology (“T4”) IDIQ contracting vehicle from the Department of Veterans Affairs<br />
(“VA”) designed to upgrade the VA’s IT system and covering services that will streamline and modernize VA<br />
operations, including patient care delivery at more than 150 VA hospitals. We also were awarded a second VA contract<br />
vehicle, the Enhance the Veteran Experience and Access to HealthCare (“EVEAH”) blanket purchase agreement with a<br />
ceiling value of $199 million, and received initial task orders. After the close of fiscal 2011, we were awarded a<br />
contract from the VA for the Enterprise Management Foundation Federated Data Repository (“EMF FDR”) program to<br />
create a centralized network monitoring system that will provide the VA with a unified view of its critical infrastructure.<br />
In addition, we have provided interoperability solutions for large-scale health information exchange enterprises<br />
such as the VA, the DoD and the Social Security Administration. We also have extended Federal interoperability<br />
solutions to the private sector where over half of all care is provided for active duty and retired service members. In<br />
7
fiscal 2011, we were awarded a four-year contract by the State of Florida Agency for Health Care Administration<br />
(“AHCA”) to implement a statewide health information exchange (“HIE”) that will improve the delivery and<br />
coordination of healthcare. As described under “Item 1. Business — Recent Acquisitions” of this Report, we<br />
acquired Carefx during the fourth quarter of fiscal 2011. Carefx is a provider of interoperability workflow solutions<br />
for government and commercial healthcare providers, and its solution suite, Fusionfx, gives care providers a unified<br />
look at patient data and closes data gaps to ensure a more consistent, higher quality experience for the patient,<br />
reducing clinical errors and increasing individual productivity.<br />
Also in fiscal 2011, we received an option year extension from the VA for healthcare imaging software and<br />
systems engineering services for the VistA imaging application, and we announced a joint venture with Johns<br />
Hopkins Medicine to focus on developing next-generation medical image management solutions to be deployed by<br />
the Johns Hopkins Health System and later, to hospitals and healthcare providers around the United States.<br />
Cyber Integrated Solutions: We are working closely with government and commercial organizations in<br />
introducing a new offering to help them move part or all of their operations to a trusted cloud computing<br />
environment in an effective and efficient manner by using our cyber integration capabilities to bring together an<br />
innovative combination of patented trust methodologies, industry-leading technologies, partnerships with market<br />
leaders and world-class infrastructure.<br />
For example, the Harris Trusted Enterprise Cloud TM is a newly launched cloud application hosting system that<br />
we offer as a unique Infrastructure-as-a-Service (“IaaS”) designed to enable clients to extend and enhance their IT<br />
operations in order to improve operational agility and reduce costs. Our Trusted Enterprise Cloud solution is<br />
delivered via The Harris Cyber Integration Center TM , located in our over 100,000-square-foot advanced data center<br />
facility in the Mid-Atlantic region. The center is an innovative cloud node that was designed from the ground up to<br />
offer technology and services that meet the highest industry and government standards for reliability and security.<br />
Key differentiators in these offerings are our proprietary trust enablement technologies, including the Global<br />
Trust Repository and the Enterprise Trust Server, which provide continuous monitoring, assurance, and attestation<br />
that the software and configurations in the cloud computing environment are deployed and operating according to<br />
specification and have not been compromised, and which we also may license to partners and customers. In fiscal<br />
2011, we announced a strategic alliance with EMC Corporation and the Virtual Computing Environment Company<br />
(“VCE”) to jointly develop and market new trusted multi-tenant cloud solutions to further accelerate the adoption of<br />
cloud computing IaaS by government and commercial enterprises.<br />
In pursuing these new, high-value applications for our capabilities and technologies, we are seeking to leverage<br />
our experience as an industry leader in cyber security. For example, we have been using state-of-the-art technology<br />
assessment techniques and architecture engineering for decades to define and operate secure networks supporting<br />
nationally critical programs, including three of the U.S.’s largest, secure mission-critical networks — the Federal<br />
Aviation Administration Telecommunications Infrastructure (“FTI”) program network, the Patriot program network<br />
and the NMCI program network. Our technology, countermeasures and monitoring capabilities safeguard vital<br />
information systems that support the critical missions of U.S. military, intelligence and Federal law enforcement<br />
customers.<br />
Broadcast and New Media Solutions: We offer hardware and software products, systems and services that<br />
provide interoperable workflow solutions for broadcast, cable, satellite and out-of-home networks worldwide. The<br />
Harris ONE TM solution brings together highly integrated and cost-effective products that enable advanced media<br />
workflows for emerging content delivery business models. We are supporting customers as they upgrade media<br />
operations to digital and high definition (“HD”) services from analog and standard definition (“SD”) services and as<br />
they expand services for HD television (“HDTV”), IPTV, video-on-demand and interactive TV. We serve the global<br />
digital and analog media markets, providing infrastructure and networking products and solutions; media and server<br />
systems; and television and radio transmission equipment and systems.<br />
Our infrastructure and networking solutions offerings enable media companies to streamline workflow from<br />
production through transmission. We offer a portfolio of advanced products, including signal processors, routers,<br />
master control and branding systems, network monitoring and control software, test and measurement instruments,<br />
multi-image display processors, broadcast graphics, and highly differentiated network access and multiplex<br />
platforms.<br />
Our media and server systems offerings enable customers to manage their digital media workflow and storage,<br />
as well as other key facets of an increasingly file-based broadcast environment, through our portfolio of software<br />
solutions for advertising, media management (traffic, billing and program scheduling), digital signage, broadband,<br />
digital asset management and play-out automation, and our family of scalable, interoperable video servers.<br />
8
We develop, manufacture and supply television and radio transmission systems for delivery of rich media over<br />
wireless broadcast terrestrial networks on a worldwide basis, including mobile TV applications. We can provide<br />
single products or end-to-end systems, including nationwide networks with hundreds of transmitters.<br />
In addition, supporting digital out-of-home advertising is an emerging growth area, and our solutions enable<br />
advertisers to reach consumers on the move. We believe new systems will be increasingly deployed to deliver rich<br />
media content in live sports and entertainment venues and in retail establishments. For example, we helped design<br />
the system of IPTV, digital signage and IT infrastructure to create an in-arena network for the Orlando Magic’s new<br />
basketball arena, and we are providing hardware and software supporting content delivery for a project in<br />
collaboration with Digital Display Networks, Inc. and ABC to create one of the largest digital out-of-home<br />
advertising networks in the world, 7-Eleven TV, which has been installed in over 3,000 7-Eleven stores. In fiscal<br />
2011, we installed our first digital signage system in the United Kingdom at Harrods, a luxury department store, and<br />
began designing an advanced, digital, out-of-home and IPTV network for the new Madison Square Garden<br />
Transformation project that will include 1,100 arena displays to deliver a dynamic viewing experience to fans.<br />
Revenue, Operating Income and Backlog: Revenue for the Integrated Network Solutions segment increased<br />
33.7 percent to $1,986 million in fiscal 2011 compared with $1,485 million in fiscal 2010, and was $1,476 million<br />
in fiscal 2009. Segment operating income decreased 18 percent to $70.2 million in fiscal 2011 compared with<br />
$85.3 million in fiscal 2010, and there was an operating loss of $133.6 million in fiscal 2009, which included a<br />
$255.5 million non-cash charge for impairment of goodwill and other long-lived assets. The Integrated Network<br />
Solutions segment contributed 34 percent of our total revenue in fiscal 2011 compared with 29 percent in both fiscal<br />
2010 and fiscal 2009. The percentage of this segment’s revenue that was derived outside of the United States was<br />
approximately 30 percent in fiscal 2011 compared with 24 percent in both fiscal 2010 and fiscal 2009.<br />
The following information pertains to the portions of this segment’s IT services, managed satellite and<br />
terrestrial communications solutions and healthcare solutions operations in connection with U.S. Government<br />
programs (“Integrated Network Solutions’ government business”):<br />
• Some of the more significant programs in fiscal 2011 included NETCENTS, Patriot, NMCI, DATS and<br />
NSOM;<br />
• The largest program by revenue in a particular fiscal year represented approximately 7 percent of this<br />
segment’s total revenue in fiscal 2011 compared with approximately 10 percent in fiscal 2010 and fiscal<br />
2009;<br />
• The five largest programs by revenue in a particular fiscal year represented approximately 27 percent of this<br />
segment’s total revenue in fiscal 2011 compared with approximately 37 percent in fiscal 2010 and<br />
approximately 36 percent in fiscal 2009;<br />
• U.S. Government customers, including the DoD and intelligence and civilian agencies, whether directly or<br />
through prime contractors, accounted for approximately 55 percent of this segment’s total revenue in fiscal<br />
2011 compared with approximately 64 percent in fiscal 2010 and approximately 57 percent in fiscal 2009.<br />
• For Integrated Network Solutions’ government business, in fiscal 2011, approximately 78 percent of revenue<br />
was under direct contracts with customers and approximately 22 percent of revenue was under contracts with<br />
prime contractors, compared with approximately 61 percent of revenue under direct contracts with customers<br />
and approximately 39 percent of revenue under contracts with prime contractors in fiscal 2010 and<br />
approximately 58 percent of revenue under direct contracts with customers and approximately 42 percent of<br />
revenue under contracts with prime contractors in fiscal 2009.<br />
For a general description of our U.S. Government contracts and subcontracts, including a discussion of revenue<br />
generated from cost-reimbursable versus fixed-price contracts, see “Item 1. Business — Principal Customers;<br />
Government Contracts” of this Report.<br />
In general, this segment’s domestic products are sold and serviced directly to customers through its sales<br />
organization and through established distribution channels. Internationally, this segment markets and sells its<br />
products and services through regional sales offices and established distribution channels. See “Item 1. Business —<br />
International Business” of this Report.<br />
The funded backlog of unfilled orders for this segment was $1,064 million at July 1, 2011 compared with<br />
$649 million at July 2, 2010 and $632 million at July 3, 2009. Unfunded backlog for this segment was<br />
$1,295 million at July 1, 2011 compared with $772 million at July 2, 2010 and $780 million at July 3, 2009. We<br />
expect to fill approximately 87 percent of this funded backlog during fiscal 2012, but we can give no assurance of<br />
such fulfillment. Additional information regarding funded and unfunded backlog is provided under “Item 1.<br />
Business — Funded and Unfunded Backlog” of this Report. For a discussion of certain risks affecting this segment,<br />
9
including risks relating to our U.S. Government contracts and subcontracts, see “Item 1. Business — Principal<br />
Customers; Government Contracts,” “Item 1A. Risk Factors” and “Item 3. Legal Proceedings” of this Report.<br />
Government Communications Systems<br />
Government Communications Systems conducts advanced research and produces, integrates and supports highly<br />
reliable, net-centric communications and information technology that solve the mission-critical challenges of our<br />
civilian, defense and intelligence government customers, primarily the U.S. Government, and is comprised of<br />
(i) Civil Programs, (ii) Defense Programs and (iii) National Intelligence Programs.<br />
Civil Programs: We provide highly reliable, mission-critical communications and information processing<br />
systems that meet the most demanding needs of customers in the U.S. civilian Federal market, including the Federal<br />
Aviation Administration (“FAA”) and the National Oceanic and Atmospheric Administration (“NOAA”). We use our<br />
ability to implement and manage large, complex programs that integrate secure, advanced communications and<br />
information processing technologies in order to improve productivity and information processing and to achieve cost<br />
savings for our customers. Our networks and information systems for large-scale, geographically dispersed<br />
enterprises offer advanced capabilities for collecting, processing, analyzing, interpreting, displaying, distributing,<br />
storing and retrieving data. We are a leader in satellite ground data processing and mission command-and-control<br />
(“C2”) systems. Our ground data processing systems consist of complex suites of hardware and software that receive<br />
sensor data from satellites, turning it into useable information. Our C2 systems feature COTS design and high levels<br />
of flexibility, are designed for government and commercial applications, and support single-satellite missions as well<br />
as some of the largest and most complex satellite fleets deployed.<br />
For example, we are the prime contractor and system architect under a 15-year contract awarded in July 2002,<br />
with a potential value of $3.5 billion, for the FTI program to integrate, modernize, operate and maintain the<br />
communications infrastructure for the U.S. air traffic control system. FTI is a modern, secure and efficient network<br />
providing voice, data and video communications deployed at more than 4,500 FAA sites across the United States to<br />
enhance network efficiency, reliability and security and to improve service while reducing operating costs. We<br />
designed and deployed the FTI network and it is fully operational. The FTI network consists of the Operations<br />
Network, the Mission Support Network, the Satellite Network and the Microwave Network. The supporting<br />
infrastructure includes the Network Operations Control Centers (“NOCCs”) and Security Operations Control Centers<br />
(“SOCCs”). The FTI program has completed its equipment build-out phase and is transitioning to its<br />
telecommunication services and maintenance phase.<br />
Other FAA programs under which we have developed solutions include the following:<br />
• The Operational and Supportability Implementation System (“OASIS”), for which we are the prime<br />
contractor and which provides integrated weather briefing and flight planning capabilities for preflight<br />
weather briefings and in-flight updates for Alaska’s general aviation community. In fiscal 2011, we were<br />
awarded a follow-on contract by the FAA to upgrade and manage the OASIS system;<br />
• The Weather and Radar Processor (“WARP”) system, a meteorological data processing system serving the<br />
en-route air traffic control environment that generates radar mosaic data for air traffic controller displays and<br />
delivers weather data to critical subsystems within the National Airspace System (“NAS”). In fiscal 2010, we<br />
were awarded a six-year contract, with a potential value of $97 million, by the FAA under the WARP<br />
Maintenance and Sustainment Services II program to continue to maintain the WARP system by providing<br />
hardware and software maintenance, depot support, on-site field support and engineering services at<br />
22 operational FAA facilities in the United States;<br />
• The Voice Switching and Control System (“VSCS”), which provides the critical air-to-ground<br />
communications links between en-route aircraft and air traffic controllers throughout the continental<br />
United States.; and<br />
• The satellite-based Alaskan NAS Interfacility Communications System (“ANICS”), which links the Alaskan<br />
Air Route Traffic Control Center in Anchorage with 64 FAA facilities throughout the region. After the close<br />
of fiscal 2011, we were selected as the prime contractor under the Alaska Satellite Telecommunications<br />
Infrastructure (“ASTI”) program for a 10-year contract, with a potential value of $85 million, from the FAA<br />
to upgrade the ANICS network by replacing and upgrading components and providing a new network<br />
management system, system security enhancements, logistics support and training in order to increase<br />
network performance and availability while reducing the FAA’s operating and maintenance costs.<br />
Another example of our capabilities relates to NOAA’s Geostationary Operational Environmental Satellite —<br />
Series R (“GOES-R”) Ground and Antenna Segment weather programs. Under two ten-year contracts, with an<br />
aggregate potential value of approximately $1 billion (including change orders), we are providing a complete,<br />
10
end-to-end solution in which we will design, develop, deploy and operate the ground segment system that will<br />
receive and process satellite data and generate and distribute weather data to more than 10,000 direct users, as well<br />
as providing the command and control of operational satellites. We also are supplying antennas and control systems<br />
that will provide communications links for command, telemetry and sensor data, as well as the communications link<br />
to direct data users. The new antennas will operate with next-generation GOES-R satellites and will be compatible<br />
with existing GOES-N through GOES-P satellites.<br />
Defense Programs: We develop, supply and integrate communications and information processing products,<br />
systems and networks for a diverse base of aerospace, terrestrial and maritime applications supporting DoD<br />
missions, and we are committed to delivering leading-edge technologies that support the ongoing transformations of<br />
military communications for U.S. and international customers. Our technologies are providing advanced mobile<br />
wideband networking capabilities to assure timely and secure network-centric capabilities across strategic,<br />
operational and tactical boundaries in support of the DoD’s full spectrum of warfighting, intelligence and logistics<br />
missions. Our major technology capabilities include advanced ground control systems and SATCOM terminals for<br />
transportable ground, fixed-site and shipboard applications; flat-panel, phased-array and single-mission antennas;<br />
advanced aviation electronics for military jets, including digital maps, modems, sensors, data buses, fiber optics and<br />
microelectronics; and high-speed data links and data networks for wireless communications.<br />
For example, our mobile ad hoc networking capability allows the military to take its communications<br />
infrastructure with it, creating mobile, robust, self-forming and self-healing networks across the battlefield. Our<br />
Highband Networking Radio TM (“HNR”) provides secure, wireless, high-bandwidth, on-the-move communications<br />
among users of widely dispersed local area networks (“LANs”) by establishing line-of-sight connectivity using<br />
directive beam antenna technology and a Harris-developed waveform that automatically selects the best<br />
communications path available, allowing seamless communication of voice, video and data to all levels of<br />
command. We announced in fiscal 2009 that our HNR system was deployed to the U.S. Army 101st Airborne<br />
Division (Air Assault) 2nd Brigade Combat Team in Iraq, which was the first combat deployment of the HNR<br />
system. In fiscal 2010, we were awarded a contract to provide HNRs to form the communications backbone of the<br />
U.S. Army’s new Integrated Air and Missile Defense Battle Command System (“IBCS”). We are currently<br />
producing and delivering HNRs under the U.S. Army’s Warfighter Information Network-Tactical (“WIN-T”)<br />
program, and also we were awarded a contract in the fourth quarter of fiscal 2011 from the U.S. Army for rapid<br />
deployment of HNRs into Afghanistan.<br />
In fiscal 2011, we also introduced Knighthawk TM 3G, a ruggedized, highly mobile tactical base station that<br />
enables warfighters on the move to maintain third generation (“3G”) cellular services in locations with limited or no<br />
cellular connectivity. Knighthawk 3G is a customizable cellular network in a box compatible with COTS equipment,<br />
including smartphones and tablets.<br />
Examples of ongoing programs for us include the following:<br />
• The U.S. Army Modernization of Enterprise Terminals (“MET”) program, for which we are developing,<br />
under a ten-year contract, with a potential value of $600 million, awarded to us in fiscal 2009, nextgeneration<br />
large satellite earth stations to provide the worldwide backbone for high-priority military<br />
communications and missile defense systems and to support IP and Dedicated Circuit Connectivity within the<br />
Global Information Grid (“GIG”), providing critical reach-back capability for the warfighter;<br />
• The F-35 Joint Strike Fighter (“F-35”), F-22 Raptor and F/A-18E/F Super Hornet aircraft platform programs,<br />
for which we provide high-performance, advanced avionics such as high-speed fiber optic networking and<br />
switching, intra-flight data links, image processing, digital map software and other electronic components,<br />
including Multifunction Advanced Data Link (“MADL”) communications subsystems primarily intended for<br />
stealth platform air-to-air communications and which allow F-35s to communicate in a stealth fashion with<br />
other network nodes without revealing their positions;<br />
• The WIN-T program for the U.S. Army, for which we are designing and testing the wireless transmission<br />
system architecture, applying our proven enabling technologies for wireless on-the-move communications,<br />
including phased arrays and high-speed secure wireless network solutions such as our HNR system; and<br />
• The Commercial Broadband Satellite Program (“CBSP”) for the U.S. Navy, for which we supply broadband<br />
multiband SATCOM terminals that support essential mission requirements and provide enhanced moralerelated<br />
communications services such as high-speed Internet access and video communications.<br />
National Intelligence Programs: A significant portion of this business involves classified programs. While<br />
classified programs generally are not discussed in this Report, the operating results relating to classified programs<br />
are included in our Consolidated Financial Statements. We believe that the business risks associated with those<br />
programs do not differ materially from the business risks of other U.S. Government programs.<br />
11
We are a major developer, supplier and integrator of communications and information processing products,<br />
systems and networks for a diverse base of U.S. Intelligence Community programs, and we support the ongoing<br />
transformation of the Intelligence Community into a more collaborative enterprise. Serving primarily national<br />
intelligence and security agency customers, including NSA, NRO and the National Geospatial-Intelligence Agency<br />
(“NGA”), we provide integrated ISR solutions that improve situational awareness, data collection accuracy and<br />
product analysis by correlating near real-time mission data and intelligence reference data for display and analysis<br />
by strategic and tactical planners and decision makers. Our ISR systems help to integrate information across the<br />
analyst workflow, accelerating the movement of information that has been collected and processed. We strive to<br />
produce innovative ISR solutions that provide our customers with information dominance for battle-space<br />
superiority.<br />
For example, our image processing capabilities extend from algorithm development through delivery of<br />
operations systems, and we are providing advanced image exploitation and dissemination solutions for ISR<br />
applications by advancing image processing, image data fusion, display technologies and digital product generation<br />
techniques. Those technologies range from new techniques for merging and displaying imagery to automated<br />
techniques for image screening, cueing and remote visualization. Also, our mapping and visualization capabilities<br />
provide complete, accurate and timely knowledge about the threat, the terrain, the status and the location of single<br />
or multiple opposing and friendly forces and their support by utilizing data, pictures, voice and video drawn from<br />
vast storage banks or from real-time input which can be transmitted around the world in fractions of a second. In<br />
addition, we have industry-leading capabilities in the architecture, design and development of highly specialized<br />
satellite antennas, structures, phased arrays and on-board processors, which are used to enable next-generation<br />
satellite systems to provide the U.S. military and intelligence communities with strategic and tactical advantages.<br />
We are also a leader in the design and development of antenna and reflector technologies for commercial space<br />
telecommunications applications. Further, our capabilities include developing and supplying state-of-the-art wireless<br />
voice and data products and solutions, including surveillance and tracking equipment, spanning vehicular, manportable,<br />
airborne and system-level applications for the U.S. Intelligence Community and law enforcement<br />
community. We also offer cyber security solutions and enterprise analytics, including an array of mission-enabling<br />
engineering solutions that address both offensive and defensive IT security challenges, providing critical support to<br />
Federal law enforcement and other U.S. Government agencies.<br />
During fiscal 2011, we were awarded a number of new contracts and follow-on contracts under classified<br />
programs. We also were awarded a 30-month contract by Sierra Nevada Corporation to design, build and integrate<br />
the synthetic aperture radar (“SAR”) satellite payload as part of NASA’s Rapid Response Space Works and Modular<br />
Space Vehicles program; a three-year contract from Boeing Space and Intelligence Systems to build Ka-band<br />
antennas for three Inmarsat-5 satellites; and a three-year contract from Boeing Space and Intelligence Systems for a<br />
22-meter deployable L-band reflector to support military and civil communications in Mexico.<br />
In addition, our full motion video (“FMV”) initiatives support the ISR market for FMV products and systems,<br />
including all U.S. Government, international military and Federal law enforcement activities for the Harris Full<br />
Motion Video Asset Management Engine (“FAME TM ”) architecture and related technologies. FAME is a COTSbased<br />
collaborative platform that provides video, audio and metadata coding, video analytics, and archive<br />
capabilities — all within a unified digital asset management solution — giving our customers greater visibility and<br />
better access to increasing amounts of digital ISR information, including higher-resolution FMV, motion imagery<br />
and visual imagery, such as that collected from manned and unmanned aircraft and ground-based sensors.<br />
Revenue, Operating Income and Backlog: Revenue for the Government Communications Systems segment<br />
increased 1.7 percent to $1,777 million in fiscal 2011 compared with $1,747 million in fiscal 2010, and was<br />
$1,864 million in fiscal 2009. Segment operating income was $227.0 million in fiscal 2011 compared with<br />
$227.4 million in fiscal 2010 and $199.2 million in fiscal 2009. This segment contributed 30 percent of our total<br />
revenue in fiscal 2011 compared with 34 percent in fiscal 2010 and 37 percent in fiscal 2009. In fiscal 2011,<br />
approximately 70 percent of revenue for this segment was under direct contracts with customers and approximately<br />
30 percent of revenue was under contracts with prime contractors, compared with approximately 73 percent of<br />
revenue under direct contracts with customers and approximately 27 percent of revenue under contracts with prime<br />
contractors in fiscal 2010 and approximately 72 percent of revenue under direct contracts with customers and<br />
approximately 28 percent of revenue under contracts with prime contractors in fiscal 2009. Some of this segment’s<br />
more significant programs in fiscal 2011 included FTI, GOES-R, F-35, MET, WIN-T and various classified and<br />
space communications systems programs. This segment’s largest program by revenue in a particular fiscal year<br />
represented approximately 14 percent of this segment’s revenue in fiscal 2011 compared with approximately<br />
14 percent in fiscal 2010 and approximately 19 percent in fiscal 2009. This segment’s ten largest programs by<br />
revenue in a particular fiscal year represented approximately 46 percent of this segment’s revenue in fiscal 2011,<br />
12
compared with approximately 46 percent in fiscal 2010 and approximately 50 percent in fiscal 2009. In fiscal 2011,<br />
this segment had a diverse portfolio of approximately 200 programs. U.S. Government customers, including the<br />
DoD and intelligence and civilian agencies, as well as foreign military sales through the U.S. Government, whether<br />
directly or through prime contractors, accounted for approximately 97 percent of this segment’s total revenue in<br />
fiscal 2011 compared with approximately 94 percent in both fiscal 2010 and fiscal 2009. For a general description<br />
of our U.S. Government contracts and subcontracts, including a discussion of revenue generated from costreimbursable<br />
versus fixed-price contracts, see “Item 1. Business — Principal Customers; Government Contracts” of<br />
this Report.<br />
The funded backlog of unfilled orders for this segment was $800 million at July 1, 2011 compared with<br />
$848 million at July 2, 2010 and $762 million at July 3, 2009. Unfunded backlog for this segment was<br />
$3,193 million at July 1, 2011 compared with $2,504 million at July 2, 2010 and $3,223 million at July 3, 2009. We<br />
expect to fill approximately 81 percent of this funded backlog during fiscal 2012, but we can give no assurance of<br />
such fulfillment. Additional information regarding funded and unfunded backlog is provided under “Item 1.<br />
Business — Funded and Unfunded Backlog” of this Report. For a discussion of certain risks affecting this segment,<br />
including risks relating to our U.S. Government contracts and subcontracts, see “Item 1. Business — Principal<br />
Customers; Government Contracts,” “Item 1A. Risk Factors” and “Item 3. Legal Proceedings” of this Report.<br />
International Business<br />
Revenue from products and services exported from the United States (including foreign military sales) or<br />
manufactured or rendered abroad was $1,307.1 million (22 percent of our total revenue) in fiscal 2011 compared<br />
with $724.6 million (14 percent of our total revenue) in fiscal 2010 and $1,016.6 million (20 percent of our total<br />
revenue) in fiscal 2009. Essentially all of the international sales are derived from our RF Communications and<br />
Integrated Network Solutions segments. Direct export sales are primarily denominated in U.S. Dollars, whereas sales<br />
from foreign subsidiaries are generally denominated in the local currency of the subsidiary. Financial information<br />
regarding our domestic and international operations is contained in Note 25: Business Segments in the Notes and is<br />
incorporated herein by reference.<br />
Our principal international manufacturing facilities are located in Canada and the United Kingdom. The<br />
majority of our international marketing activities are conducted through subsidiaries which operate in Canada,<br />
Europe, Central and South America, and Asia. We have also established international marketing organizations and<br />
several regional sales offices. Reference is made to Exhibit 21 “Subsidiaries of the Registrant” of this Report for<br />
further information regarding our international subsidiaries.<br />
We utilize indirect sales channels, including dealers, distributors and sales representatives, in the marketing and<br />
sale of some lines of products and equipment, both domestically and internationally. These independent<br />
representatives may buy for resale or, in some cases, solicit orders from commercial or governmental customers for<br />
direct sales by us. Prices to the ultimate customer in many instances may be recommended or established by the<br />
independent representative and may be above or below our list prices. Our dealers and distributors generally receive<br />
a discount from our list prices and may mark up those prices in setting the final sales prices paid by the customer.<br />
Revenue from indirect sales channels in fiscal 2011 represented 10 percent of our total revenue and approximately<br />
40 percent of our international revenue, compared with revenue from indirect sales channels in fiscal 2010<br />
representing 6 percent of our total revenue and approximately 35 percent of our international revenue, and revenue<br />
from indirect sales channels in fiscal 2009 representing 11 percent of our total revenue and approximately<br />
55 percent of our international revenue.<br />
Fiscal 2011 international revenue came from a large number of countries, and no such single country accounted<br />
for more than 4 percent of our total revenue. Some of our exports are paid for by letters of credit, with the balance<br />
carried either on an open account or installment note basis. Advance payments, progress payments or other similar<br />
payments received prior to or upon shipment often cover most of the related costs incurred. Significant foreign<br />
government contracts generally require us to provide performance guarantees. In order to stay competitive in<br />
international markets, we also sometimes enter into recourse and vendor financing arrangements to facilitate sales to<br />
certain customers.<br />
The particular economic, social and political conditions for business conducted outside the United States differ<br />
from those encountered by domestic businesses. Our management believes that the overall business risk for the<br />
international business as a whole is somewhat greater than that faced by our domestic operations as a whole. A<br />
description of the types of risks to which we are subject in international business is contained in “Item 1A. Risk<br />
Factors” of this Report. Nevertheless, in the opinion of our management, these risks are partially mitigated by the<br />
diversification of the international business and the protection provided by letters of credit and advance payments.<br />
13
Competition<br />
We operate in highly competitive markets that are sensitive to technological advances. Although successful<br />
product and systems development is not necessarily dependent on substantial financial resources, many of our<br />
competitors in each of our businesses are larger than we are and can maintain higher levels of expenditures for<br />
research and development. In each of our businesses we concentrate on the market opportunities that our<br />
management believes are compatible with our resources, overall technological capabilities and objectives. Principal<br />
competitive factors in these businesses are product quality and reliability; technological capabilities; service; past<br />
performance; ability to develop and implement complex, integrated solutions; ability to meet delivery schedules; the<br />
effectiveness of third-party sales channels in international markets; and cost-effectiveness. Within the IT services<br />
market, there is intense competition among many companies. The ability to compete in the IT services market<br />
depends on a number of factors, including the capability to deploy skilled professionals at competitive prices across<br />
the diverse spectrum of the IT services market.<br />
In the RF Communications segment, principal competitors include European Aeronautic Defence and Space<br />
Company N.V. (“EADS”), General Dynamics, ITT Industries, Motorola Solutions, Raytheon, Rohde & Schwarz,<br />
Tadiran and Thales.<br />
In the Integrated Network Solutions segment, principal competitors include Avid, Computer Sciences<br />
Corporation, Evertz, EVS Corporation, General Dynamics, Globecomm, Harmonic, Hewlett Packard, Lockheed<br />
Martin, ManTech, Miranda, MTN, NCI Information Systems, NEC, Northrop Grumman, Omnibus, Raytheon,<br />
RigNet, Rohde & Schwarz, Sony Broadcast, Stratos, TCS, Technicolor, Tektronix/Danaher, Telos Corporation,<br />
Thomson, and Vizada, as well as other smaller companies and divisions of large companies.<br />
In the Government Communications Systems segment, principal competitors include BAE Systems, Boeing,<br />
General Dynamics, L-3 Communications, Lockheed Martin, Northrop Grumman, Raytheon and Rockwell Collins.<br />
We frequently “partner” or are involved in subcontracting and teaming relationships with companies that are, from<br />
time to time, competitors on other programs.<br />
Principal Customers; Government Contracts<br />
Sales to U.S. Government customers, including the DoD and intelligence and civilian agencies, as well as<br />
foreign military sales through the U.S. Government, whether directly or through prime contractors, were 72 percent<br />
of our total revenue in fiscal 2011 compared with 75 percent in fiscal 2010 and 74 percent in fiscal 2009. No other<br />
customer accounted for more than 1 percent of our total revenue in fiscal 2011. Additional information regarding<br />
customers for each of our segments is provided under “Item 1. Business — Description of Business by Segment” of<br />
this Report. Our U.S. Government sales are predominantly derived from contracts with agencies of, and prime<br />
contractors to, the U.S. Government. Most of the sales of our Government Communications Systems segment and of<br />
the portions of our Integrated Networks Solutions segment’s IT services, managed satellite and terrestrial<br />
communications solutions and healthcare solutions operations in connection with U.S. Government programs are<br />
made directly or indirectly to the U.S. Government under contracts or subcontracts containing standard government<br />
contract clauses providing for redetermination of profits, if applicable, and for termination for the convenience of<br />
the U.S. Government or for default based upon performance.<br />
Our U.S. Government contracts and subcontracts include both cost-reimbursable and fixed-price contracts.<br />
Governmentwide Acquisition Contracts (“GWACs”) and IDIQ contracts, which can include task orders for each<br />
contract type, require us to compete both for the initial contract and then for individual task or delivery orders under<br />
such contracts.<br />
Our U.S. Government cost-reimbursable contracts provide for the reimbursement of allowable costs plus the<br />
payment of a fee. Our U.S. Government cost-reimbursable contracts fall into three basic types: (i) cost-plus fixed-fee<br />
contracts, which provide for the payment of a fixed fee irrespective of the final cost of performance; (ii) cost-plus<br />
incentive-fee contracts, which provide for increases or decreases in the fee, within specified limits, based upon<br />
actual results compared with contractual targets relating to factors such as cost, performance and delivery schedule;<br />
and (iii) cost-plus award-fee contracts, which provide for the payment of an award fee determined at the discretion<br />
of the customer based upon the performance of the contractor against pre-established performance criteria. Under<br />
our U.S. Government cost-reimbursable contracts, we are reimbursed periodically for allowable costs and are paid a<br />
portion of the fee based on contract progress. Some overhead costs have been made partially or wholly unallowable<br />
for reimbursement by statute or regulation. Examples are certain merger and acquisition costs, lobbying costs,<br />
charitable contributions and certain litigation defense costs.<br />
Our U.S. Government fixed-price contracts are either firm fixed-price contracts or fixed-price incentive<br />
contracts. Under our U.S. Government firm fixed-price contracts, we agree to perform a specific scope of work for a<br />
14
fixed price and, as a result, benefit from cost savings and carry the burden of cost overruns. Under our<br />
U.S. Government fixed-price incentive contracts, we share with the U.S. Government both savings accrued from<br />
contracts performed for less than target costs as well as costs incurred in excess of targets up to a negotiated ceiling<br />
price (which is higher than the target cost), but carry the entire burden of costs exceeding the negotiated ceiling<br />
price. Accordingly, under such incentive contracts, profit may also be adjusted up or down depending upon whether<br />
specified performance objectives are met. Under our U.S. Government firm fixed-price and fixed-price incentive<br />
contracts, we usually receive either milestone payments equaling 100 percent of the contract price or monthly<br />
progress payments from the U.S. Government in amounts equaling 80 percent of costs incurred under the contract.<br />
The remaining amounts, including profits or incentive fees, are billed upon delivery and final acceptance of end<br />
items and deliverables under the contract. Our U.S. Government fixed-price contracts generally have higher profit<br />
margins than our U.S. Government cost-reimbursable contracts. Our production contracts are mainly fixed-price<br />
contracts, and development contracts are generally cost-reimbursable contracts.<br />
As stated above, U.S. Government contracts are terminable for the convenience of the U.S. Government, as<br />
well as for default based on performance. Companies supplying goods and services to the U.S. Government are<br />
dependent on Congressional appropriations and administrative allotment of funds and may be affected by changes in<br />
U.S. Government policies resulting from various military, political, economic and international developments. Longterm<br />
U.S. Government contracts and related orders are subject to cancellation if appropriations for subsequent<br />
performance periods become unavailable. Under contracts terminable for the convenience of the U.S. Government, a<br />
contractor is entitled to receive payments for its allowable costs and, in general, the proportionate share of fees or<br />
earnings for the work done. Contracts that are terminable for default generally provide that the U.S. Government<br />
pays only for the work it has accepted and may require the contractor to pay for the incremental cost of<br />
reprocurement and may hold the contractor liable for damages. In many cases, there is also uncertainty relating to<br />
the complexity of designs, necessity for design improvements and difficulty in forecasting costs and schedules when<br />
bidding on developmental and highly sophisticated technical work. Under many U.S. Government contracts, we are<br />
required to maintain facility and personnel security clearances complying with DoD and other Federal agency<br />
requirements. For further discussion of risks relating to U.S. Government contracts, see “Item 1A. Risk Factors” and<br />
“Item 3. Legal Proceedings” of this Report.<br />
Funded and Unfunded Backlog<br />
Our total company-wide funded and unfunded backlog was approximately $7,786 million at July 1, 2011<br />
compared with approximately $6,526 million at July 2, 2010 and $6,317 million at July 3, 2009. The funded portion<br />
of this backlog was approximately $3,358 million at July 1, 2011 compared with approximately $3,250 million at<br />
July 2, 2010 and $2,315 million at July 3, 2009. The determination of backlog involves substantial estimating,<br />
particularly with respect to customer requirements contracts and development and production contracts of a costreimbursable<br />
or incentive nature.<br />
We define funded backlog as unfilled firm orders for products and services for which funding has been<br />
authorized and, in the case of U.S. Government agencies, appropriated. We define unfunded backlog as primarily<br />
unfilled firm contract value for which funding has not yet been authorized or, in the case of U.S. Government<br />
agencies, appropriated, including the value of contract options in cases of material contracts that have options we<br />
believe are probable of being exercised. We do not include potential task or delivery orders under IDIQ contracts in<br />
our backlog. In fiscal 2012, we expect to fill approximately 75 percent of our total funded backlog as of July 1,<br />
2011. However, we can give no assurance of such fulfillment or that our funded backlog will become revenue in any<br />
particular period, if at all. Backlog is subject to delivery delays and program cancellations, which are beyond our<br />
control. Additional information with regard to the backlog of each of our segments is provided under “Item 1.<br />
Business — Description of Business by Segment” of this Report.<br />
Research, Development and Engineering<br />
Research, development and engineering expenditures totaled approximately $983 million in fiscal 2011,<br />
$1,047 million in fiscal 2010 and $1,003 million in fiscal 2009. Company-sponsored research and product<br />
development costs, which included research and development for commercial products and services and independent<br />
research and development related to government products and services, as well as concept formulation studies and<br />
bid and proposal efforts, were approximately $336 million in fiscal 2011, $326 million in fiscal 2010 and<br />
$244 million in fiscal 2009. A portion of our independent research and development costs are allocated among<br />
contracts and programs in process under U.S. Government contractual arrangements. Company-sponsored research<br />
and product development costs not otherwise allocable are charged to expense when incurred. The portion of total<br />
research, development and engineering expenditures that was not company-sponsored was funded by the<br />
U.S. Government and is included in our revenue. Customer-sponsored research and development was $647 million<br />
15
in fiscal 2011, $721 million in fiscal 2010 and $759 million in fiscal 2009. Company-sponsored research is directed<br />
to the development of new products and services and to building technological capability in selected<br />
communications and electronic systems markets. U.S. Government-funded research helps strengthen and broaden<br />
our technical capabilities. All of our segments maintain their own engineering and new product development<br />
departments, with scientific assistance provided by advanced-technology departments. As of July 1, 2011, we<br />
employed approximately 7,100 engineers and scientists and are continuing efforts to make the technologies<br />
developed in any of our operating segments available for all other operating segments.<br />
Patents and Other Intellectual Property<br />
We consider our patents and other intellectual property, in the aggregate, to constitute an important asset. We<br />
routinely apply for and own a large and valuable portfolio of patents, trade secrets, know-how, confidential<br />
information, trademarks, copyrights and other intellectual property. We also license intellectual property to and from<br />
third parties. As of July 1, 2011, we held approximately 950 U.S. patents and 850 foreign patents, and had<br />
approximately 500 U.S. patent applications pending and 1,140 foreign patent applications pending. Unpatented<br />
research, development and engineering skills also make an important contribution to our business. While our<br />
intellectual property rights in the aggregate are important to our business and the operations of our operating<br />
segments, we do not consider our business or any operating segment to be materially dependent upon any single<br />
patent, license or other intellectual property right, or any group of related patents, licenses or other intellectual<br />
property rights. We are engaged in a proactive patent licensing program and have entered into a number of licenses<br />
and cross-license agreements, some of which generate royalty income. Although existing license agreements have<br />
generated income in past years and may do so in the future, there can be no assurances we will enter into additional<br />
income-producing license agreements. From time to time we engage in litigation to protect our patents and other<br />
intellectual property. Any of our patents, trade secrets, trademarks, copyrights and other proprietary rights could be<br />
challenged, invalidated or circumvented, or may not provide competitive advantages. For further discussion of risks<br />
relating to intellectual property, see “Item 1A. Risk Factors” of this Report. With regard to patents relating to our<br />
Government Communications Systems segment, the U.S. Government often has an irrevocable, non-exclusive,<br />
royalty-free license, pursuant to which the U.S. Government may use or authorize others to use the inventions<br />
covered by such patents. Pursuant to similar arrangements, the U.S. Government may consent to our use of<br />
inventions covered by patents owned by other persons. Numerous trademarks used on or in connection with our<br />
products are also considered to be a valuable asset.<br />
Environmental and Other Regulations<br />
Our facilities and operations are subject to numerous domestic and international laws and regulations designed<br />
to protect the environment, particularly with regard to wastes and emissions. The applicable environmental laws and<br />
regulations are common within the industries and markets in which we operate and serve. We believe that we have<br />
complied with these requirements and that such compliance has not had a material adverse effect on our results of<br />
operations, financial condition or cash flows. Based upon currently available information, we do not expect<br />
expenditures over the next several years to protect the environment and to comply with current environmental laws<br />
and regulations, as well as to comply with current and pending climate control legislation, regulation, treaties and<br />
accords, to have a material impact on our competitive position or financial condition, but we can give no assurance<br />
that such expenditures will not exceed current expectations. If future treaties, laws and regulations contain more<br />
stringent requirements than presently anticipated, actual expenditures may be higher than our present estimates of<br />
those expenditures. We have installed waste treatment facilities and pollution control equipment to satisfy legal<br />
requirements and to achieve our waste minimization and prevention goals. We did not spend material amounts on<br />
environmental capital projects in fiscal 2011, fiscal 2010 or fiscal 2009. A portion of our environmental<br />
expenditures relates to discontinued operations for which we have retained certain environmental liabilities. We<br />
currently expect that amounts to be spent for environmental-related capital projects will not be material in fiscal<br />
2012. These amounts may increase in future years. Additional information regarding environmental and regulatory<br />
matters is set forth in “Item 3. Legal Proceedings” of this Report and in Note 1: Significant Accounting Policies in<br />
the Notes.<br />
Electronic products are subject to governmental environmental regulation in a number of jurisdictions.<br />
Equipment produced by our Integrated Network Solutions segment, in particular, is subject to domestic and<br />
international requirements requiring end-of-life management and/or restricting materials in products delivered to<br />
customers, including the European Union’s Directive 2002/96/EC on Waste Electrical and Electronic Equipment<br />
(“WEEE”) and Directive 2002/95/EC on the Restriction of the use of certain Hazardous Substances in Electrical and<br />
Electronic Equipment (“RoHS”), as amended. Other jurisdictions have adopted similar legislation. Such<br />
requirements typically are not applicable to most equipment produced by our Government Communications Systems<br />
16
and RF Communications segments. We believe that we have complied with such rules and regulations, where<br />
applicable, with respect to our existing products sold into such jurisdictions. We intend to comply with such rules<br />
and regulations with respect to our future products.<br />
Broadcast and wireless communications (whether TV, radio, satellite or telecommunications) are also subject to<br />
governmental regulation. Equipment produced by our Integrated Network Solutions and RF Communications<br />
segments, in particular, is subject to domestic and international requirements to avoid interference among users of<br />
radio and television frequencies and to permit interconnection of telecommunications equipment. Additionally, our<br />
managed satellite and terrestrial communications solutions operations hold licenses for very small aperture terminals<br />
(“VSATs”) and satellite earth stations, which authorize operation of networks and teleports. We are also required to<br />
comply with technical operating and licensing requirements that pertain to our wireless licenses and operations. We<br />
believe that we have complied with such rules and regulations and licenses with respect to our existing products and<br />
services, and we intend to comply with such rules and regulations and licenses with respect to our future products<br />
and services. Governmental reallocation of the frequency spectrum also could impact our business, financial<br />
condition and results of operations.<br />
Raw Materials and Supplies<br />
Because of the diversity of our products and services, as well as the wide geographic dispersion of our<br />
facilities, we use numerous sources for the wide array of raw materials (such as electronic components, printed<br />
circuit boards, metals and plastics) needed for our operations and for our products. We are dependent upon suppliers<br />
and subcontractors for a large number of components and subsystems and the ability of our suppliers and<br />
subcontractors to adhere to customer or regulatory materials restrictions and to meet performance and quality<br />
specifications and delivery schedules. In some instances, we are dependent upon one or a few sources, either<br />
because of the specialized nature of a particular item or because of local content preference requirements pursuant<br />
to which we operate on a given project. While we have been affected by financial and performance issues of some<br />
of our suppliers and subcontractors, we have not been materially adversely affected by the inability to obtain raw<br />
materials or products. On occasion, we have experienced component shortages from vendors as a result of natural<br />
disasters, or the RoHS environmental regulations in the European Union or similar regulations in other jurisdictions.<br />
These events or regulations may cause a spike in demand for certain electronic components (such as lead-free<br />
components), resulting in industry-wide supply chain shortages. To date, these component shortages have not had a<br />
material adverse effect on our business. For further discussion of risks relating to subcontractors and suppliers, see<br />
“Item 1A. Risk Factors” of this Report.<br />
Seasonality<br />
We do not consider any material portion of our business to be seasonal. Various factors can affect the<br />
distribution of our revenue between accounting periods, including the timing of contract awards and the timing and<br />
availability of U.S. Government funding, as well as the timing of product deliveries and customer acceptance.<br />
Employees<br />
We employed approximately 16,900 employees at the end of fiscal 2011 compared with approximately<br />
15,800 employees at the end of fiscal 2010. Approximately 88 percent of our employees as of the end of fiscal 2011<br />
were located in the United States. A significant number of employees in our Government Communications Systems<br />
segment possess a U.S. Government security clearance. We also utilize a number of independent contractors. None<br />
of our employees in the United States is represented by a labor union. In certain international subsidiaries, our<br />
employees are represented by workers’ councils or statutory labor unions. In general, we believe that our relations<br />
with our employees are good.<br />
Website Access to Harris Reports; Available Information<br />
General. We maintain an Internet website at http://www.<strong>harris</strong>.com. Our annual reports on Form 10-K,<br />
quarterly reports on Form 10-Q, current reports on Form 8-K and amendments to such reports, filed or furnished<br />
pursuant to Section 13(a) or 15(d) of the Exchange Act, are available free of charge on our website as soon as<br />
reasonably practicable after these reports are electronically filed with or furnished to the Securities and Exchange<br />
Commission (the “SEC”). We also will provide the reports in electronic or paper form free of charge upon request.<br />
We also make available free of charge on our website our annual report to shareholders and proxy statement. Our<br />
website and the information posted thereon are not incorporated into this Report or any current or other periodic<br />
report that we file with or furnish to the SEC. All reports we file with or furnish to the SEC also are available free<br />
of charge via the SEC’s electronic data gathering and retrieval (“EDGAR”) system available through the SEC’s<br />
website at http://www.sec.gov.<br />
17
Additional information relating to our businesses, including our operating segments, is set forth in “Item 7.<br />
Management’s Discussion and Analysis of Financial Condition and Results of Operations” of this Report.<br />
Corporate Governance Principles and Committee Charters. We previously adopted Corporate Governance<br />
Principles, which are available on the Corporate Governance section of our website at www.<strong>harris</strong>.com/<strong>harris</strong>/cg/. In<br />
addition, the charters of each of the standing committees of our Board, namely, the Audit Committee, Business<br />
Conduct and Corporate Responsibility Committee, Corporate Governance Committee, Finance Committee and<br />
Management Development and Compensation Committee, are also available on the Corporate Governance section of<br />
our website. A copy of the charters is also available free of charge upon written request to our Secretary at Harris<br />
Corporation, 1025 West NASA Boulevard, Melbourne, Florida 32919.<br />
Certifications. We have filed with the SEC the certifications required by Section 302 of the Sarbanes-Oxley<br />
Act of 2002 as exhibits to this Report. In addition, an annual CEO certification was submitted by our Chief<br />
Executive Officer to the New York Stock Exchange (“NYSE”) in November 2010 in accordance with the NYSE’s<br />
listing standards, which included a certification that he was not aware of any violation by Harris of the NYSE’s<br />
corporate governance listing standards.<br />
ITEM 1A. RISK FACTORS.<br />
We have described many of the trends and other factors that we believe could impact our business and future<br />
results in “Item 7. Management’s Discussion and Analysis of Financial Condition and Results of Operations” of this<br />
Report. In addition, our business, operating results, cash flows and financial condition are subject to, and could be<br />
materially adversely affected by, various risks and uncertainties, including, without limitation, those set forth below,<br />
any one of which could cause our actual results to vary materially from recent results or our anticipated future<br />
results.<br />
We depend on U.S. Government customers for a significant portion of our revenue, and the loss of this<br />
relationship or a shift in U.S. Government funding priorities could have adverse consequences on our future<br />
business.<br />
We are highly dependent on sales to U.S. Government customers. The percentage of our net revenue that was<br />
derived from sales to U.S. Government customers, including the DoD and intelligence and civilian agencies, as well<br />
as foreign military sales through the U.S. Government, whether directly or through prime contractors, was<br />
approximately 72 percent in fiscal 2011, 75 percent in fiscal 2010 and 74 percent in fiscal 2009. Therefore, any<br />
significant disruption or deterioration of our relationship with the U.S. Government would significantly reduce our<br />
revenue. Our U.S. Government programs must compete with programs managed by other government contractors for<br />
limited resources and for uncertain levels of funding. Our competitors continuously engage in efforts to expand their<br />
business relationships with the U.S. Government and will continue these efforts in the future, and the<br />
U.S. Government may choose to use other contractors. We expect that a majority of the business that we seek in the<br />
foreseeable future will be awarded through competitive bidding. The U.S. Government has increasingly relied on<br />
certain types of contracts that are subject to a competitive bidding process, including IDIQ, GWAC, General<br />
Services Administration (“GSA”) Schedule and other multi-award contracts, which has resulted in greater<br />
competition and increased pricing pressure. We operate in highly competitive markets and our competitors may have<br />
more extensive or more specialized engineering, manufacturing and marketing capabilities than we do in some<br />
areas, and we may not be able to continue to win competitively awarded contracts or to obtain task orders under<br />
multi-award contracts. Further, the competitive bidding process involves significant cost and managerial time to<br />
prepare bids and proposals for contracts that may not be awarded to us, and the risk that we may fail to accurately<br />
estimate the resources and costs required to fulfill any contract awarded to us. Following any contract award, we<br />
may experience significant expense or delay, contract modification or contract rescission as a result of our<br />
competitors protesting or challenging contracts awarded to us in competitive bidding. Budget decisions made by the<br />
U.S. Government are outside of our control and have long-term consequences for our business. A shift in<br />
U.S. Government spending priorities or an increase in non-procurement spending at the expense of our programs<br />
(for example, through “in-sourcing”), or a reduction in total U.S. Government spending, could have material adverse<br />
consequences on our future business.<br />
We depend significantly on U.S. Government contracts, which often are only partially funded, subject to<br />
immediate termination, and heavily regulated and audited. The termination or failure to fund one or more of<br />
these contracts could have an adverse impact on our business.<br />
Over its lifetime, a U.S. Government program may be implemented by the award of many different individual<br />
contracts and subcontracts. The funding of U.S. Government programs is subject to Congressional appropriations.<br />
18
Although multi-year contracts may be authorized and appropriated in connection with major procurements, Congress<br />
generally appropriates funds on a fiscal year basis. Procurement funds are typically made available for obligation<br />
over the course of three years. Consequently, programs often receive only partial funding initially, and additional<br />
funds are obligated only as Congress authorizes further appropriations. The termination of funding for a<br />
U.S. Government program would result in a loss of anticipated future revenue attributable to that program, which<br />
could have an adverse impact on our operations. In addition, the termination of a program or the failure to commit<br />
additional funds to a program that already has been started could result in lost revenue and increase our overall<br />
costs of doing business.<br />
Generally, U.S. Government contracts are subject to oversight audits by U.S. Government representatives. Such<br />
audits could result in adjustments to our contract costs. Any costs found to be improperly allocated to a specific<br />
contract will not be reimbursed, and such costs already reimbursed must be refunded. We have recorded contract<br />
revenues based upon costs we expect to realize upon final audit. However, we do not know the outcome of any<br />
future audits and adjustments and we may be required to materially reduce our revenues or profits upon completion<br />
and final negotiation of audits. Negative audit findings could also result in termination of a contract, forfeiture of<br />
profits, suspension of payments, fines and suspension or prohibition from doing business with the U.S. Government.<br />
In addition, U.S. Government contracts generally contain provisions permitting termination, in whole or in part,<br />
without prior notice at the U.S. Government’s convenience upon the payment only for work done and commitments<br />
made at the time of termination. We can give no assurance that one or more of our U.S. Government contracts will<br />
not be terminated under these circumstances. Also, we can give no assurance that we would be able to procure new<br />
contracts to offset the revenue or backlog lost as a result of any termination of our U.S. Government contracts.<br />
Because a significant portion of our revenue is dependent on our performance and payment under our<br />
U.S. Government contracts, the loss of one or more large contracts could have a material adverse impact on our<br />
financial condition.<br />
Our government business also is subject to specific procurement regulations and a variety of socio-economic<br />
and other requirements. These requirements, although customary in U.S. Government contracts, increase our<br />
performance and compliance costs. These costs might increase in the future, thereby reducing our margins, which<br />
could have an adverse effect on our financial condition. Failure to comply with these regulations and requirements<br />
could lead to fines, penalties, repayments, or compensatory or treble damages, or suspension or debarment from<br />
U.S. Government contracting or subcontracting for a period of time. Among the causes for debarment are violations<br />
of various laws, including those related to procurement integrity, export control, U.S. Government security<br />
regulations, employment practices, protection of the environment, accuracy of records, proper recording of costs and<br />
foreign corruption. The termination of a U.S. Government contract or relationship as a result of any of these acts<br />
would have an adverse impact on our operations and could have an adverse effect on our standing and eligibility for<br />
future U.S. Government contracts.<br />
We enter into fixed-price contracts that could subject us to losses in the event of cost overruns or a significant<br />
increase in inflation.<br />
We have a number of firm fixed-price contracts. These contracts allow us to benefit from cost savings, but they<br />
carry the risk of potential cost overruns because we assume all of the cost burden. If our initial estimates are<br />
incorrect, we can lose money on these contracts. U.S. Government contracts can expose us to potentially large<br />
losses because the U.S. Government can hold us responsible for completing a project or, in certain circumstances,<br />
paying the entire cost of its replacement by another provider regardless of the size or foreseeability of any cost<br />
overruns that occur over the life of the contract. Because many of these contracts involve new technologies and<br />
applications and can last for years, unforeseen events, such as technological difficulties, fluctuations in the price of<br />
raw materials, problems with our suppliers and cost overruns, can result in the contractual price becoming less<br />
favorable or even unprofitable to us over time. The United States also may experience a significant increase in<br />
inflation. A significant increase in inflation rates could have a significant adverse impact on the profitability of these<br />
contracts. Furthermore, if we do not meet contract deadlines or specifications, we may need to renegotiate contracts<br />
on less favorable terms, be forced to pay penalties or liquidated damages or suffer major losses if the customer<br />
exercises its right to terminate. In addition, some of our contracts have provisions relating to cost controls and audit<br />
rights, and if we fail to meet the terms specified in those contracts we may not realize their full benefits. Our results<br />
of operations are dependent on our ability to maximize our earnings from our contracts. Cost overruns could have<br />
an adverse impact on our financial results. The potential impact of such risk on our financial results would increase<br />
if the mix of our contracts and programs shifted toward a greater percentage of firm fixed-price contracts.<br />
19
We could be negatively impacted by a security breach, through cyber attack, cyber intrusion or otherwise, or<br />
other significant disruption of our IT networks and related systems or of those we operate for certain of our<br />
customers.<br />
We face the risk, as does any company, of a security breach, whether through cyber attack or cyber intrusion<br />
over the Internet, malware, computer viruses, attachments to e-mails, persons inside our organization or persons<br />
with access to systems inside our organization, or other significant disruption of our IT networks and related<br />
systems. We face an added risk of a security breach or other significant disruption of the IT networks and related<br />
systems that we develop, install, operate and maintain for certain of our customers, which may involve managing<br />
and protecting information relating to national security and other sensitive government functions. The risk of a<br />
security breach or disruption, particularly through cyber attack or cyber intrusion, including by computer hackers,<br />
foreign governments and cyber terrorists, has increased as the number, intensity and sophistication of attempted<br />
attacks and intrusions from around the world have increased. As a communications and IT company, and<br />
particularly as a government contractor, we face a heightened risk of a security breach or disruption from threats to<br />
gain unauthorized access to our and our customers’ proprietary or classified information on our IT networks and<br />
related systems and to the IT networks and related systems that we operate and maintain for certain of our<br />
customers. These types of information and IT networks and related systems are critical to the operation of our<br />
business and essential to our ability to perform day-to-day operations, and, in some cases, are critical to the<br />
operations of certain of our customers. Although we make significant efforts to maintain the security and integrity<br />
of these types of information and IT networks and related systems, and we have implemented various measures to<br />
manage the risk of a security breach or disruption, there can be no assurance that our security efforts and measures<br />
will be effective or that attempted security breaches or disruptions would not be successful or damaging. Even the<br />
most well protected information, networks, systems and facilities remain potentially vulnerable because attempted<br />
security breaches, particularly cyber attacks and intrusions, or disruptions will occur in the future, and because the<br />
techniques used in such attempts are constantly evolving and generally are not recognized until launched against a<br />
target, and in some cases are designed not be detected and, in fact, may not be detected. In some cases, the<br />
resources of foreign governments may be behind such attacks. Accordingly, we may be unable to anticipate these<br />
techniques or to implement adequate security barriers or other preventative measures, and thus it is virtually<br />
impossible for us to entirely mitigate this risk. A security breach or other significant disruption involving these types<br />
of information and IT networks and related systems could:<br />
• Disrupt the proper functioning of these networks and systems and therefore our operations and/or those of<br />
certain of our customers;<br />
• Result in the unauthorized access to, and destruction, loss, theft, misappropriation or release of proprietary,<br />
confidential, sensitive or otherwise valuable information of ours or our customers, including trade secrets,<br />
which others could use to compete against us or for disruptive, destructive or otherwise harmful purposes and<br />
outcomes;<br />
• Compromise national security and other sensitive government functions;<br />
• Require significant management attention and resources to remedy the damages that result;<br />
• Subject us to claims for contract breach, damages, credits, penalties or termination; or<br />
• Damage our reputation among our customers (particularly agencies of the U.S. Government and potential<br />
customers of Cyber Integrated Solutions) and the public generally,<br />
Any or all of which could have a negative impact on our results of operations, financial condition and cash<br />
flows.<br />
We derive a significant portion of our revenue from international operations and are subject to the risks of doing<br />
business internationally, including fluctuations in currency exchange rates.<br />
We are dependent on sales to customers outside the United States. In fiscal 2011, fiscal 2010 and fiscal 2009,<br />
revenue from products and services exported from the U.S. or manufactured or rendered abroad was 22 percent,<br />
14 percent and 20 percent, respectively, of our total revenue. Approximately 33 percent of our international business<br />
in fiscal 2011 was transacted in local currency. Losses resulting from currency rate fluctuations can adversely affect<br />
our results. We expect that international revenue will continue to account for a significant portion of our total<br />
revenue. Also, a significant portion of our international revenue is from, and an increasing portion of our business<br />
activity is being conducted in, less-developed countries. We are subject to risks of doing business internationally,<br />
including:<br />
• Currency exchange controls, fluctuations of currency and currency revaluations;<br />
• The laws, regulations and policies of foreign governments relating to investments and operations, as well as<br />
U.S. laws affecting the activities of U.S. companies abroad, including the Foreign Corrupt Practices Act;<br />
20
• Changes in regulatory requirements, including business or operating license requirements, imposition of<br />
tariffs or embargoes, export controls and other trade restrictions;<br />
• Uncertainties and restrictions concerning the availability of funding, credit or guarantees;<br />
• The complexity and necessity of using international dealers, distributors, sales representatives and<br />
consultants;<br />
• The difficulties of managing a geographically dispersed organization and culturally diverse workforces,<br />
including compliance with local laws and practices;<br />
• Difficulties associated with repatriating cash generated or held abroad in a tax-efficient manner and changes<br />
in tax laws;<br />
• Import and export licensing requirements and regulations, as well as unforeseen changes in export<br />
regulations;<br />
• Uncertainties as to local laws and enforcement of contract and intellectual property rights and occasional<br />
requirements for onerous contract clauses; and<br />
• Rapid changes in government, economic and political policies, political or civil unrest, acts of terrorism or<br />
the threat of international boycotts or U.S. anti-boycott legislation.<br />
Our reputation and ability to do business may be impacted by the improper conduct of our employees, agents or<br />
business partners.<br />
We have implemented compliance controls, policies and procedures designed to prevent reckless or criminal<br />
acts from being committed by our employees, agents or business partners that would violate the laws of the<br />
jurisdictions in which we operate, including laws governing payments to government officials (such as the Foreign<br />
Corrupt Practices Act), and to detect any such reckless or criminal acts committed. We cannot ensure, however, that<br />
our controls, policies and procedures will prevent or detect all such reckless or criminal acts. If not prevented, such<br />
reckless or criminal acts could subject us to civil or criminal investigations and monetary and non-monetary<br />
penalties and could have a material adverse effect on our ability to conduct business, our results of operations and<br />
our reputation.<br />
We may not be successful in obtaining the necessary export licenses to conduct certain operations abroad, and<br />
Congress may prevent proposed sales to certain foreign governments.<br />
We must first obtain export and other licenses and authorizations from various U.S. Government agencies<br />
before we are permitted to sell certain products and technologies outside of the United States. For example, the<br />
U.S. Department of State must notify Congress at least 15-60 days, depending on the size and location of the sale,<br />
prior to authorizing certain sales of defense equipment and services to foreign governments. During that time,<br />
Congress may take action to block the proposed sale. We can give no assurance that we will continue to be<br />
successful in obtaining the necessary licenses or authorizations or that Congress will not prevent or delay certain<br />
sales. Any significant impairment of our ability to sell products or technologies outside of the United States could<br />
negatively impact our results of operations and financial condition.<br />
The continued effects of the general downturn in the global economy and the U.S. Government’s budget deficits<br />
and national debt could have an adverse impact on our business, operating results or financial condition.<br />
There has been a general downturn in the global economy and the economies of the United States and many<br />
foreign countries in which we do business continue to show weakness. Although governments worldwide, including<br />
the U.S. Government, have initiated sweeping economic plans, we are unable to predict the impact, severity and<br />
duration of these economic events. The continuing effects of the general downturn in the global economy and the<br />
U.S. Government’s budget deficits and national debt could have an adverse impact on our business, operations<br />
results or financial condition in a number of ways. Possible effects of these economic conditions include the<br />
following:<br />
• The U.S. Government could reduce or delay its spending on, reprioritize its spending away from, the<br />
government programs in which we participate;<br />
• The U.S. Government may be unable complete its budget process before the end of its fiscal year on<br />
September 30 and thus would be required either to shut down or to be funded pursuant to a “continuing<br />
resolution” that authorizes agencies of the U.S. Government to continue operations but does not authorize<br />
new spending initiatives, either of which could result in reduced or delayed orders or payments for products<br />
and services we provide. While this historically has not had a material adverse impact on our business,<br />
operating results or financial condition, if the U.S. Government budget process results in a shutdown or<br />
prolonged operation under a continuing resolution, it may decrease our revenues, profitability or cash flows<br />
or otherwise have a material adverse effect on our business, operating results or financial condition.<br />
21
• We may experience declines in revenues, profitability and cash flows as a result of reduced or delayed orders<br />
or payments or other factors caused by the economic problems of our customers and prospective customers<br />
(including U.S. Federal, state and local governments);<br />
• We may experience supply chain delays, disruptions or other problems associated with financial constraints<br />
faced by our suppliers and subcontractors; and<br />
• We may incur increased costs or experience difficulty with future borrowings under our commercial paper<br />
program or credit facilities or in the debt markets, or otherwise with financing our operating, investing<br />
(including any future acquisitions) or financing activities.<br />
Our future success will depend on our ability to develop new products, services and technologies that achieve<br />
market acceptance in our current and future markets.<br />
Both our commercial and government businesses are characterized by rapidly changing technologies and<br />
evolving industry standards. Accordingly, our performance depends on a number of factors, including our ability to:<br />
• Identify emerging technological trends in our current and target markets;<br />
• Develop and maintain competitive products and services;<br />
• Enhance our offerings by adding innovative hardware, software or other features that differentiate our<br />
products and services from those of our competitors; and<br />
• Develop, manufacture and bring cost-effective offerings to market quickly.<br />
We believe that, in order to remain competitive in the future, we will need to continue to develop new<br />
products, services and technologies, requiring the investment of significant financial resources. The need to make<br />
these expenditures could divert our attention and resources from other projects, and we cannot be sure that these<br />
expenditures ultimately will lead to the timely development of new products, services or technologies. Due to the<br />
design complexity of some of our products, services and technologies, we may experience delays in completing<br />
development and introducing new products, services or technologies in the future. Any delays could result in<br />
increased costs of development or redirect resources from other projects. In addition, we cannot provide assurances<br />
that the markets for our products, services or technologies will develop as we currently anticipate. The failure of our<br />
products, services or technologies to gain market acceptance could significantly reduce our revenue and harm our<br />
business. Furthermore, we cannot be sure that our competitors will not develop competing products, services or<br />
technologies that gain market acceptance in advance of our products, services or technologies, or that our<br />
competitors will not develop new products, services or technologies that cause our existing products, services or<br />
technologies to become non-competitive or obsolete, which could adversely affect our results of operations. The<br />
future direction of the domestic and global economies, including its impact on customer demand, also will have a<br />
significant impact on our overall performance.<br />
We participate in markets that are often subject to uncertain economic conditions, which makes it difficult to<br />
estimate growth in our markets and, as a result, future income and expenditures.<br />
We participate in U.S. and international markets that are subject to uncertain economic conditions. As a result,<br />
it is difficult to estimate the level of growth in the markets in which we participate. Because all components of our<br />
budgeting and forecasting are dependent upon estimates of growth in the markets we serve, the uncertainty renders<br />
estimates of or guidance relating to future revenue, income and expenditures even more difficult. As a result, we<br />
may make significant investments and expenditures but never realize the anticipated benefits.<br />
We cannot predict the consequences of future geo-political events, but they may adversely affect the markets in<br />
which we operate, our ability to insure against risks, our operations or our profitability.<br />
Ongoing instability and current conflicts in the Middle East and Asia and the potential for further conflicts and<br />
future terrorist activities and other recent geo-political events throughout the world have created economic and<br />
political uncertainties that could have a material adverse effect on our business, operations and profitability. These<br />
matters cause uncertainty in the world’s financial and insurance markets and may increase significantly the political,<br />
economic and social instability in the geographic areas in which we operate. These matters also have caused the<br />
premiums charged for our insurance coverages to increase and may cause further increases or some coverages to be<br />
unavailable altogether.<br />
22
We have made, and may continue to make, strategic acquisitions that involve significant risks and uncertainties.<br />
We have made, and we may continue to make, strategic acquisitions that involve significant risks and<br />
uncertainties. These risks and uncertainties include:<br />
• Difficulty in identifying and evaluating potential acquisitions, including the risk that our due diligence does<br />
not identify or fully assess valuation issues, potential liabilities or other acquisition risks;<br />
• Difficulty in integrating newly acquired businesses and operations, including combining product and service<br />
offerings, and in entering into new markets in which we are not experienced, in an efficient and cost-effective<br />
manner while maintaining adequate standards, controls and procedures, and the risk that we encounter<br />
significant unanticipated costs or other problems associated with integration;<br />
• Difficulty in consolidating and rationalizing IT infrastructure, which may include multiple legacy systems<br />
from various acquisitions and integrating software code;<br />
• Challenges in achieving strategic objectives, cost savings and other benefits expected from acquisitions;<br />
• Risk that our markets do not evolve as anticipated and that the strategic acquisitions do not prove to be those<br />
needed to be successful in those markets;<br />
• Risk that we assume significant liabilities that exceed the limitations of any applicable indemnification<br />
provisions or the financial resources of any indemnifying parties;<br />
• Potential loss of key employees or customers of the acquired businesses; and<br />
• Risk of diverting the attention of senior management from our existing operations.<br />
Disputes with our subcontractors and the inability of our subcontractors to perform, or our key suppliers to<br />
timely deliver our components, parts or services, could cause our products or services to be produced or delivered<br />
in an untimely or unsatisfactory manner.<br />
On many of our contracts, we engage subcontractors. We may have disputes with our subcontractors, including<br />
disputes regarding the quality and timeliness of work performed by the subcontractor, customer concerns about the<br />
subcontract, our failure to extend existing task orders or issue new task orders under a subcontract, our hiring of the<br />
personnel of a subcontractor or vice versa or the subcontractor’s failure to comply with applicable law. In addition,<br />
there are certain parts, components and services for many of our products and services which we source from other<br />
manufacturers or vendors. Some of our suppliers, from time to time, experience financial and operational<br />
difficulties, which may impact their ability to supply the materials, components, subsystems and services that we<br />
require. Any inability to develop alternative sources of supply on a cost-effective and timely basis could materially<br />
impair our ability to manufacture and deliver products and services to our customers. We can give no assurances<br />
that we will be free from disputes with our subcontractors, material supply problems or component, subsystems or<br />
services problems in the future. Also, our subcontractors and other suppliers may not be able to acquire or maintain<br />
the quality of the materials, components, subsystems and services they supply, which might result in greater product<br />
returns, service problems and warranty claims and could harm our business, financial condition and results of<br />
operations.<br />
Third parties have claimed in the past and may claim in the future that we are infringing directly or indirectly<br />
upon their intellectual property rights, and third parties may infringe upon our intellectual property rights.<br />
Many of the markets we serve are characterized by vigorous protection and pursuit of intellectual property<br />
rights, which often has resulted in protracted and expensive litigation. Third parties have claimed in the past and<br />
may claim in the future that we are infringing directly or indirectly upon their intellectual property rights, and we<br />
may be found to be infringing or to have infringed directly or indirectly upon those intellectual property rights.<br />
Claims of intellectual property infringement might also require us to enter into costly royalty or license agreements.<br />
Moreover, we may not be able to obtain royalty or license agreements on terms acceptable to us, or at all. We also<br />
may be subject to significant damages or injunctions against development and sale of certain of our products,<br />
services and solutions. Our success depends in large part on our proprietary technology. We rely on a combination<br />
of patents, copyrights, trademarks, trade secrets, know-how, confidentiality provisions and licensing arrangements to<br />
establish and protect our intellectual property rights. If we fail to successfully protect and enforce these rights, our<br />
competitive position could suffer. Our pending patent and trademark registration applications may not be allowed, or<br />
competitors may challenge the validity or scope of our patents or trademark registrations. In addition, our patents<br />
may not provide us a significant competitive advantage. We may be required to spend significant resources to<br />
monitor and police our intellectual property rights. We may not be able to detect infringement and our competitive<br />
position may be harmed before we do so. In addition, competitors may design around our technology or develop<br />
competing technologies.<br />
23
The outcome of litigation or arbitration in which we are involved is unpredictable and an adverse decision in any<br />
such matter could have a material adverse effect on our financial condition and results of operations.<br />
We are defendants in a number of litigation matters and, from time to time, are involved in a number of<br />
arbitrations. These actions may divert financial and management resources that would otherwise be used to benefit<br />
our operations. No assurances can be given that the results of these or new matters will be favorable to us. An<br />
adverse resolution of lawsuits or arbitrations could have a material adverse effect on our financial condition and<br />
results of operations.<br />
We face certain significant risk exposures and potential liabilities that may not be covered adequately by<br />
insurance or indemnity.<br />
We are exposed to liabilities that are unique to the products and services we provide. A significant portion of<br />
our business relates to designing, developing and manufacturing advanced defense, technology and communications<br />
systems and products. New technologies associated with these systems and products may be untested or unproven.<br />
Components of certain of the defense systems and products we develop are inherently dangerous. Failures of<br />
satellites, missile systems, air traffic control systems, homeland security applications and aircraft have the potential<br />
to cause loss of life and extensive property damage. In most circumstances, we may receive indemnification from<br />
the U.S. Government. While we maintain insurance for certain risks, the amount of our insurance coverage may not<br />
be adequate to cover all claims or liabilities, and we may be forced to bear substantial costs from an accident or<br />
incident. It also is not possible to obtain insurance to protect against all operational risks and liabilities. Substantial<br />
claims resulting from an incident in excess of U.S. Government indemnity and our insurance coverage could harm<br />
our financial condition, operating results and cash flows. Moreover, any accident or incident for which we are liable,<br />
even if fully insured, could negatively affect our standing among our customers and the public, thereby making it<br />
more difficult for us to compete effectively, and could significantly impact the cost and availability of adequate<br />
insurance in the future.<br />
Changes in our effective tax rate may have an adverse effect on our results of operations.<br />
Our future effective tax rate may be adversely affected by a number of factors including:<br />
• The jurisdictions in which profits are determined to be earned and taxed;<br />
• Adjustments to estimated taxes upon finalization of various tax returns;<br />
• Increases in expenses not fully deductible for tax purposes, including write-offs of acquired in-process<br />
research and development and impairment of goodwill in connection with acquisitions;<br />
• Changes in available tax credits;<br />
• Changes in share-based compensation expense;<br />
• Changes in the valuation of our deferred tax assets and liabilities;<br />
• Changes in domestic or international tax laws or the interpretation of such tax laws; and<br />
• The resolution of issues arising from tax audits with various tax authorities.<br />
Any significant increase in our future effective tax rates could adversely impact our results of operations for<br />
future periods.<br />
We have significant operations in Florida and other locations that could be materially and adversely impacted in<br />
the event of a natural disaster or other significant disruption.<br />
Our corporate headquarters and significant operations of our Government Communications Systems segment<br />
are located in Florida, where major hurricanes have occurred. Our worldwide operations and operations of our<br />
suppliers could be subject to natural disasters or other significant disruptions, including hurricanes, typhoons,<br />
tsunamis, floods, earthquakes, fires, water shortages, other extreme weather conditions, medical epidemics, acts of<br />
terrorism, power shortages and blackouts, telecommunications failures, cyber attacks and other natural and manmade<br />
disasters or disruptions. In the event of such a natural disaster or other disruption, we could experience disruptions<br />
or interruptions to our operations or the operations of our suppliers, subcontractors, distributors, resellers or<br />
customers; destruction of facilities; and/or loss of life, all of which could materially increase our costs and expenses<br />
and materially adversely affect our business, financial condition and results of operations.<br />
Changes in the regulatory framework under which our managed satellite and terrestrial communications<br />
solutions operations are operated could adversely affect our business, results of operations and financial<br />
condition.<br />
Our domestic satellite and terrestrial communications solutions are currently provided on a private carrier basis<br />
and are therefore subject to lighter regulation by the Federal Communications Commission (the “FCC”) and other<br />
Federal, state and local agencies than if provided on a common carrier basis. Our international satellite and<br />
24
terrestrial communications solutions operations are regulated by governments of various countries other than the<br />
United States and by other international authorities. The regulatory regimes applicable to our international satellite<br />
and terrestrial communications solutions operations frequently require that we obtain and maintain licenses for our<br />
operations and conduct our operations in accordance with prescribed standards. Compliance with such requirements<br />
may inhibit our ability to quickly expand our operations into new countries, including in circumstances in which<br />
such expansion is required in order to provide uninterrupted service to existing customers with mobile operations as<br />
they move to new locations on short notice. Failure to comply with such regulatory requirements could subject us to<br />
various penalties or sanctions. The adoption of new laws or regulations, changes to the existing domestic or<br />
international regulatory framework, new interpretations of the laws that apply to our operations, or the loss of, or a<br />
material limitation on, any of our material licenses could materially harm our business, results of operations and<br />
financial condition.<br />
We rely on third parties to provide satellite bandwidth for our managed satellite and terrestrial communications<br />
solutions, and any bandwidth constraints could harm our business, financial condition and results of operations.<br />
In our managed satellite and terrestrial communications solutions operations, we compete for satellite<br />
bandwidth with other commercial entities, such as other satellite communications services providers and<br />
broadcasting companies, and with governmental entities, such as the military. In certain markets and at certain<br />
times, satellite bandwidth may be limited and/or pricing of satellite bandwidth could be subject to competitive<br />
pressure. In such cases, we may be unable to secure sufficient bandwidth needed to provide our managed satellite<br />
communications services, either at favorable rates or at all. This inability could harm our business, financial<br />
condition and results of operations.<br />
Changes in future business conditions could cause business investments and/or recorded goodwill to become<br />
impaired, resulting in substantial losses and write-downs that would reduce our results of operations.<br />
As part of our overall strategy, we will, from time to time, acquire a minority or majority interest in a business.<br />
These investments are made upon careful analysis and due diligence procedures designed to achieve a desired return<br />
or strategic objective. These procedures often involve certain assumptions and judgment in determining acquisition<br />
price. After acquisition, unforeseen issues could arise which adversely affect the anticipated returns or which are<br />
otherwise not recoverable as an adjustment to the purchase price. Even after careful integration efforts, actual<br />
operating results may vary significantly from initial estimates. Goodwill accounts for approximately 39 percent of<br />
our recorded total assets as of July 1, 2011. We evaluate the recoverability of recorded goodwill amounts annually,<br />
as well as when we change reportable segments and when events or circumstances indicate there may be an<br />
impairment. The annual impairment test is based on several factors requiring judgment. Principally, a decrease in<br />
expected reportable segment cash flows or changes in market conditions may indicate potential impairment of<br />
recorded goodwill. For additional information on accounting policies we have in place for goodwill impairment, see<br />
our discussion under “Critical Accounting Policies and Estimates” in “Item 7. Management’s Discussion and<br />
Analysis of Financial Condition and Results of Operations” of this Report and Note 1: Significant Accounting<br />
Policies and Note 22: Impairment of Goodwill and Other Long-Lived Assets in the Notes.<br />
We must attract and retain key employees, and failure to do so could seriously harm us.<br />
Our business has a continuing need to attract significant numbers of skilled personnel, including personnel<br />
holding security clearances, to support our growth and to replace individuals who have terminated employment due<br />
to retirement or for other reasons. To the extent that the demand for qualified personnel exceeds supply, as has been<br />
the case from time to time in recent years, we could experience higher labor, recruiting or training costs in order to<br />
attract and retain such employees, or could experience difficulties in performing under our contracts if our needs for<br />
such employees were unmet.<br />
In addition, we are currently undertaking a search for a successor chief executive officer, which is a critical<br />
management position. The search for and transition to a successor chief executive officer may result in disruptions<br />
to our business and uncertainty among investors, employees and others concerning our future direction and<br />
performance. It also may be more difficult for us to recruit and retain other personnel until a successor chief<br />
executive officer is identified and the transition is completed. Any such disruptions and uncertainty, as well as the<br />
failure to successfully identify, attract and/or retain a successor chief executive officer or other executives and key<br />
employees could have an adverse effect on our business, results of operations and financial condition.<br />
ITEM 1B. UNRESOLVED STAFF COMMENTS.<br />
We have no unresolved comments from the SEC.<br />
25
ITEM 2. PROPERTIES.<br />
Our principal executive offices are located at owned facilities in Melbourne, Florida. As of July 1, 2011, we<br />
operated approximately 170 locations in the United States, Canada, Europe, Central and South America and Asia,<br />
consisting of about 8.1 million square feet of manufacturing, administrative, research and development,<br />
warehousing, engineering and office space, of which approximately 5.1 million square feet were owned and<br />
approximately 3.0 million square feet were leased. There are no material encumbrances on any of our facilities. Our<br />
leased facilities are, for the most part, occupied under leases for remaining terms ranging from one month to<br />
10 years, a majority of which can be terminated or renewed at no longer than five-year intervals at our option. As of<br />
July 1, 2011, we had major operations at the following locations:<br />
RF Communications — Rochester, New York; Lynchburg, Virginia; Forest, Virginia; Chelmsford,<br />
Massachusetts; Columbia, Maryland; and San Diego, California.<br />
Integrated Network Solutions — Houston, Texas; Scottsdale, Arizona; Aberdeen, Scotland; Quincy, Illinois;<br />
Englewood, Colorado; Herndon, Virginia; Singapore; Dulles, Virginia; Pottstown, Pennsylvania; Alexandria,<br />
Virginia; Harrisonburg, Virginia; Mason, Ohio; Melbourne, Florida; Colorado Springs, Colorado; Calgary,<br />
Canada; Wokingham, United Kingdom; Waterloo, Canada; Los Angeles, California; Bellevue, Nebraska;<br />
Chesapeake, Virginia; and Toronto, Canada.<br />
Government Communications Systems — Palm Bay, Florida; Melbourne, Florida; Malabar, Florida; Chantilly,<br />
Virginia; Falls Church, Virginia; Annapolis Junction, Maryland; Seabrook, Maryland; Washington, D.C.; and<br />
Largo, Maryland.<br />
Corporate — Melbourne, Florida and Winnersh, United Kingdom.<br />
The following is a summary of the approximate floor space of our offices and facilities in productive use, by<br />
segment, at July 1, 2011 (in millions):<br />
Segment<br />
Approximate<br />
Total Sq. Ft.<br />
Owned<br />
Approximate<br />
Total Sq. Ft.<br />
Leased Total<br />
RF Communications ...................................... 1.4 0.8 2.2<br />
Integrated Network Solutions ............................... 0.6 1.6 2.2<br />
Government Communications Systems ........................ 2.7 0.5 3.2<br />
Corporate .............................................. 0.4 0.1 0.5<br />
Total ................................................. 5.1 3.0 8.1<br />
In the opinion of management, our facilities, whether owned or leased, are suitable and adequate for their<br />
intended purposes and have capacities adequate for current and projected needs. While we have some unused or<br />
under-utilized facilities, they are not considered significant. The facilities owned by our RF Communications<br />
segment include a new manufacturing facility located in Rochester, New York. The facilities owned by our<br />
Integrated Network Solutions segment include our new Cyber Integration Center located in Harrisonburg, Virginia.<br />
We frequently review our anticipated requirements for facilities and will, from time to time, acquire additional<br />
facilities, expand existing facilities, and dispose of existing facilities or parts thereof, as management deems<br />
necessary. For more information about our lease obligations, see Note 18: Lease Commitments in the Notes. Our<br />
facilities and other properties are generally maintained in good operating condition.<br />
ITEM 3. LEGAL PROCEEDINGS.<br />
General. From time to time, as a normal incident of the nature and kind of businesses in which we are, and<br />
were, engaged, various claims or charges are asserted and litigation or arbitration is commenced by or against us<br />
arising from or related to matters, including, but not limited to: product liability; personal injury; patents,<br />
trademarks, trade secrets or other intellectual property; labor and employee disputes; commercial or contractual<br />
disputes; the prior sale or use of products containing asbestos or other restricted materials; breach of warranty; or<br />
environmental matters. Claimed amounts against us may be substantial but may not bear any reasonable relationship<br />
to the merits of the claim or the extent of any real risk of court or arbitral awards. We record accruals for losses<br />
related to those matters against us that we consider to be probable and that can be reasonably estimated. Gain<br />
contingencies, if any, are recognized when they are realized and legal costs generally are expensed when incurred.<br />
While it is not feasible to predict the outcome of these matters with certainty, and some lawsuits, claims or<br />
proceedings may be disposed of or decided unfavorably to us, based upon available information, in the opinion of<br />
management, settlements, arbitration awards and final judgments, if any, which are considered probable of being<br />
26
endered against us in litigation or arbitration in existence at July 1, 2011 are reserved against, covered by insurance<br />
or would not have a material adverse effect on our financial condition, results of operations or cash flows.<br />
U.S. Government Business. U.S. Government contractors, such as us, are engaged in supplying goods and<br />
services to the U.S. Government and its various agencies. We are therefore dependent on Congressional<br />
appropriations and administrative allotment of funds and may be affected by changes in U.S. Government policies.<br />
U.S. Government contracts typically involve long lead times for design and development, are subject to significant<br />
changes in contract scheduling and may be unilaterally modified or cancelled by the U.S. Government. Often these<br />
contracts call for successful design and production of complex and technologically advanced products or systems.<br />
We may participate in supplying goods and services to the U.S. Government as either a prime contractor or as a<br />
subcontractor to a prime contractor. Disputes may arise between the prime contractor and the U.S. Government and<br />
the prime contractor and its subcontractors and may result in litigation or arbitration between the contracting parties.<br />
Generally, U.S. Government contracts are subject to procurement laws and regulations, including the Federal<br />
Acquisition Regulation (“FAR”), which outline uniform policies and procedures for acquiring goods and services by<br />
the U.S. Government, and specific agency acquisition regulations that implement or supplement the FAR, such as<br />
the Defense Federal Acquisition Regulation Supplement. As a U.S. Government contractor, our contract costs are<br />
audited and reviewed on a continuing basis by the Defense Contract Audit Agency (“DCAA”). The DCAA also<br />
reviews the adequacy of, and a U.S. Government contractor’s compliance with, the contractor’s internal control<br />
systems and policies, including the contractor’s accounting, purchasing, property, estimating, compensation and<br />
management information systems. In addition to these routine audits, from time to time, we may, either individually<br />
or in conjunction with other U.S. Government contractors, be the subject of audits and investigations by other<br />
agencies of the U.S. Government. These audits and investigations are conducted to determine if our performance<br />
and administration of our U.S. Government contracts are compliant with applicable contractual requirements and<br />
procurement and other applicable Federal laws and regulations. These investigations may be conducted without our<br />
knowledge. We are unable to predict the outcome of such investigations or to estimate the amounts of resulting<br />
claims or other actions that could be instituted against us, our officers or employees. Under present<br />
U.S. Government procurement laws and regulations, if indicted or adjudged in violation of procurement or other<br />
Federal laws, a contractor, such as us, or one or more of our operating divisions or subdivisions, could be subject to<br />
fines, penalties, repayments, or compensatory or treble damages. U.S. Government regulations also provide that<br />
certain findings against a contractor may lead to suspension or debarment from eligibility for awards of new<br />
U.S. Government contracts for up to three years. Suspension or debarment would have a material adverse effect on<br />
us because of our reliance on U.S. Government contracts. In addition, our export privileges could be suspended or<br />
revoked. Suspension or revocation of our export privileges also would have a material adverse effect on us. For<br />
further discussion of risks relating to U.S. Government contracts, see “Item 1A. Risk Factors” of this Report.<br />
International. As an international company, we are, from time to time, the subject of investigations relating to<br />
our international operations, including under the U.S. export control laws, the U.S. Foreign Corrupt Practices Act<br />
and similar U.S. and international laws.<br />
Environmental. We are subject to numerous U.S. Federal, state and international environmental laws and<br />
regulatory requirements and are involved from time to time in investigations or litigation of various potential<br />
environmental issues concerning activities at our facilities or former facilities or remediation as a result of past<br />
activities (including past activities of companies we have acquired). From time to time, we receive notices from the<br />
U.S. Environmental Protection Agency or equivalent state or international environmental agencies that we are a<br />
potentially responsible party under the Comprehensive Environmental Response, Compensation and Liability Act<br />
(commonly known as the “Superfund Act”) and/or equivalent laws. Such notices assert potential liability for cleanup<br />
costs at various sites, which include sites owned by us, sites we previously owned and treatment or disposal sites not<br />
owned by us, allegedly containing hazardous substances attributable to us from past operations. We own, previously<br />
owned or are currently named as a potentially responsible party at 14 such sites, excluding sites as to which our<br />
records disclose no involvement or as to which our liability has been finally determined. While it is not feasible to<br />
predict the outcome of many of these proceedings, in the opinion of our management, any payments we may be<br />
required to make as a result of such claims in existence at July 1, 2011 will not have a material adverse effect on<br />
our financial condition, results of operations or cash flows. Additional information regarding environmental matters<br />
is set forth in Note 1: Significant Accounting Policies in the Notes, which information is incorporated herein by<br />
reference, and in “Item 1. Business — Environmental and Other Regulations” of this Report.<br />
HSTX Securities Litigation. HSTX and certain of its current and former officers and directors, including<br />
certain current Harris officers, were named as defendants in a federal securities class action complaint filed on<br />
September 15, 2008 in the United States District Court (the “Court”) for the District of Delaware by plaintiff<br />
27
Norfolk County Retirement System on behalf of an alleged class of purchasers of HSTX securities from January 29,<br />
2007 to July 30, 2008, including shareholders of Stratex Networks, Inc. (“Stratex”) who exchanged shares of Stratex<br />
for shares of HSTX as part of the combination between Stratex and our former Microwave Communications<br />
Division to form HSTX. Similar complaints were filed in the Court on October 6, 2008 and October 30, 2008. The<br />
complaints were consolidated in a slightly expanded complaint filed on July 29, 2009 that, among other things,<br />
added Harris Corporation as a defendant. This action relates to public disclosures made by HSTX on January 30,<br />
2007 and July 30, 2008, which included the restatement of HSTX’s financial statements for the first three fiscal<br />
quarters of its fiscal 2008 (the quarters ended March 28, 2008, December 28, 2007 and September 28, 2007) and for<br />
its fiscal years ended June 29, 2007, June 30, 2006 and July 1, 2005 due to accounting errors. The consolidated<br />
complaint alleged violations of Section 10(b) and Section 20(a) of the Exchange Act and of Rule 10b-5 promulgated<br />
thereunder, as well as violations of Section 11 and Section 15 of the Securities Act, and sought, among other relief,<br />
determinations that the action is a proper class action, unspecified compensatory damages and reasonable attorneys’<br />
fees and costs. On June 21, 2011, the Court issued an order preliminarily approving a settlement between the<br />
parties. A settlement fairness hearing is scheduled for September 16, 2011. We do not expect the settlement to have<br />
a material impact on our results of operations, financial condition or cash flows.<br />
ITEM 4. (REMOVED AND RESERVED).<br />
EXECUTIVE OFFICERS OF THE REGISTRANT<br />
The name, age, position held with us, and principal occupation and employment during at least the past 5 years<br />
for each of our executive officers as of August 26, 2011, were as follows:<br />
Name and Age Position Currently Held and Past Business Experience<br />
Howard L. Lance, 55 ...... Chairman of the Board, President and Chief Executive Officer since June 2003.<br />
President and Chief Executive Officer from February 2003 to June 2003. Formerly<br />
President of NCR Corporation and Chief Operating Officer of its Retail and<br />
Financial Group from July 2001 to October 2002. Prior to July 2001, Mr. Lance<br />
served for 17 years with Emerson Electric Company, where he held increasingly<br />
senior management positions with different divisions of the company, and was<br />
named Executive Vice President for Emerson’s Electronics and Telecommunications<br />
businesses in 1999. Mr. Lance is a director of Stryker Corporation and Eastman<br />
Chemical Company.<br />
Daniel R. Pearson, 59 ..... Executive Vice President and Chief Operating Officer and Acting Group President,<br />
Integrated Network Solutions since March 2011. Executive Vice President and Chief<br />
Operating Officer from June 2010 to March 2011. Group President, Government<br />
Communications Systems from July 2008 to May 2010. Group President, Defense<br />
Communications and Electronics from May 2007 to June 2008. Group President —<br />
Defense Communications from July 2006 to May 2007. President — Department of<br />
Defense Programs, Government Communications Systems Division from November<br />
2003 to July 2006. President — Network Support Division from June 2000 to<br />
November 2003. Mr. Pearson joined Harris in 1977.<br />
Gary L. McArthur, 51 ..... Senior Vice President and Chief Financial Officer since September 2008. Vice<br />
President and Chief Financial Officer from March 2006 to September 2008. Vice<br />
President — Finance and Treasurer from January 2005 to March 2006. Vice<br />
President — Corporate Development from January 2001 to January 2005. Director —<br />
Corporate Development from March 1997 to December 2000. Formerly, Chief<br />
Financial Officer of 3D/EYE Inc. from 1996 to 1997. Executive Director — Mexico,<br />
Nextel from 1995 to 1996. Director — Mergers and Acquisitions, Nextel from 1993<br />
to 1995. Prior to 1993, Mr. McArthur held various positions with Lehman Brothers,<br />
Inc., Cellcom Corp. and Deloitte & Touche.<br />
28
Name and Age Position Currently Held and Past Business Experience<br />
Jeffrey S. Shuman, 57 ..... Senior Vice President, Chief Human Resources and Administrative Officer since<br />
February 2011. Senior Vice President, Human Resources and Corporate Relations<br />
from June 2010 to February 2011. Vice President, Human Resources and Corporate<br />
Relations from August 2005 to May 2010. Formerly with Northrop Grumman as<br />
Vice President of Human Resources and Administration, Information Technology<br />
Sector from March 2001 to August 2005; and Senior Vice President of Human<br />
Resources Information Systems Group, Litton Inc. from September 1999 to March<br />
2001. Prior to that, with Honeywell International/Allied Signal Corporation as Vice<br />
President — Human Resources for Allied Signal’s technical services business from<br />
February 1997 to September 1999 and Director, Human Resources, Allied Signal<br />
from January 1995 to February 1997. President, Management Recruiters<br />
International of Orange County from 1994 to 1995. Prior to 1994, Mr. Shuman held<br />
various positions with Avon Products, Inc.<br />
Scott T. Mikuen, 49 ....... VicePresident, General Counsel and Secretary since October 2010. Vice President,<br />
Associate General Counsel and Secretary from October 2004 to October 2010. Vice<br />
President — Counsel, Corporate and Commercial Operations and Assistant Secretary<br />
from November 2000 to October 2004. Mr. Mikuen joined Harris in 1996 as<br />
Finance Counsel.<br />
Sheldon J. Fox, 52 ........ Group President, Government Communications Systems since June 2010. President,<br />
National Intelligence Programs, Government Communications Systems from<br />
December 2007 to May 2010. President, Defense Programs, Government<br />
Communications Systems from May 2007 to December 2007. Vice President and<br />
General Manager, Department of Defense Programs, Government Communications<br />
Systems Division from July 2006 to April 2007. Vice President of Programs,<br />
Department of Defense Communications Systems, Government Communications<br />
Systems Division from July 2005 to June 2006. Mr. Fox joined Harris in 1984.<br />
Dana A. Mehnert, 49 ...... Group President, RF Communications since May 2009. President, RF<br />
Communications from July 2006 to May 2009. Vice President and General<br />
Manager — Government Products Business, RF Communications from July 2005 to<br />
July 2006. Vice President and General Manager — Business Development and<br />
Operations, RF Communications from January 2005 to July 2005. Vice President —<br />
Defense Operations, RF Communications from January 2004 to January 2005. Vice<br />
President — International Operations, RF Communications from November 2001 to<br />
January 2004. Vice President/Managing Director — International Government Sales<br />
Operations for Harris’ regional sales organization from September 1999 to<br />
November 2001. Vice President — Marketing and International Sales, RF<br />
Communications from August 1997 to September 1999. Vice President —<br />
Worldwide Marketing, RF Communications from July 1996 to July 1997. Vice<br />
President — International Sales, RF Communications from November 1995 to June<br />
1996. Mr. Mehnert joined Harris in 1984.<br />
Lewis A. Schwartz, 48 ..... VicePresident, Principal Accounting Officer since October 2006. Principal<br />
Accounting Officer from October 2005 to October 2006. Assistant Controller from<br />
October 2003 to October 2005. Director, Corporate Accounting from August 1999 to<br />
October 2003. Director, Corporate Planning from January 1997 to August 1999. Mr.<br />
Schwartz joined Harris in 1992. Formerly, Mr. Schwartz was with Ernst & Young<br />
LLP from 1986 to 1992.<br />
There is no family relationship between any of our executive officers or directors, and there are no<br />
arrangements or understandings between any of our executive officers or directors and any other person pursuant to<br />
which any of them was appointed or elected as an officer or director, other than arrangements or understandings<br />
with our directors or officers acting solely in their capacities as such. All of our executive officers are elected<br />
annually and serve at the pleasure of our Board of Directors.<br />
29
PART II<br />
ITEM 5. MARKET FOR REGISTRANT’S COMMON EQUITY, RELATED STOCKHOLDER MATTERS<br />
AND ISSUER PURCHASES OF EQUITY SECURITIES.<br />
Market Information and Price Range of Common Stock<br />
Our common stock, par value $1.00 per share, is listed and traded on the NYSE, under the ticker symbol<br />
“HRS.” According to the records of our transfer agent, as of August 26, 2011, there were approximately<br />
5,860 holders of record of our common stock. The high and low sales prices of our common stock as reported on<br />
the NYSE consolidated transactions reporting system and the dividends paid on our common stock for each<br />
quarterly period in our last two fiscal years are reported below:<br />
High Low<br />
Cash<br />
Dividends<br />
Fiscal 2011<br />
First Quarter ...... $48.95 $41.13 $0.25<br />
Second Quarter .... $47.42 $43.02 0.25<br />
Third Quarter. ..... $51.27 $43.14 0.25<br />
Fourth Quarter ..... $53.39 $43.75 0.25<br />
$1.00<br />
High Low<br />
Cash<br />
Dividends<br />
Fiscal 2010<br />
First Quarter ...... $39.42 $26.11 $0.22<br />
Second Quarter .... $48.25 $35.88 0.22<br />
Third Quarter. ..... $49.67 $42.67 0.22<br />
Fourth Quarter ..... $54.50 $40.24 0.22<br />
$0.88<br />
On August 26, 2011, the last sale price of our common stock as reported in the NYSE consolidated<br />
transactions reporting system was $37.69 per share.<br />
Dividends<br />
The cash dividends paid on our common stock for each quarter in our last two fiscal years are set forth in the<br />
tables above. On July 30, 2011, our Board of Directors increased the quarterly cash dividend rate on our common<br />
stock from $.25 per share to $.28 per share, for an annualized cash dividend rate of $1.12 per share and declared a<br />
quarterly cash dividend of $.28 per share, which will be paid on September 16, 2011 to holders of record on<br />
September 7, 2011. Our annualized cash dividend rate was $1.00 per share, $.88 per share and $.80 per share in<br />
fiscal 2011, fiscal 2010 and fiscal 2009, respectively. Quarterly cash dividends are typically paid in March, June,<br />
September and December. We currently expect that cash dividends will continue to be paid in the near future, but<br />
we can give no assurances. The declaration of dividends and the amount thereof will depend on a number of factors,<br />
including our financial condition, capital requirements, results of operations, future business prospects and other<br />
factors that our Board of Directors may deem relevant.<br />
Harris Stock Performance Graph<br />
The following performance graph and table do not constitute soliciting material and the performance graph<br />
and table should not be deemed filed or incorporated by reference into any other previous or future filings by us<br />
under the Securities Act or the Exchange Act, except to the extent that we specifically incorporate the performance<br />
graph and table by reference therein.<br />
The performance graph and table below compare the five-year cumulative total return of our common stock<br />
with the comparable five-year cumulative total returns of the Standard & Poor’s 500 Composite Stock Index (“S&P<br />
500”), the Standard & Poor’s 500 Information Technology Sector Index (“S&P 500 Information Technology”) and<br />
the Standard & Poor’s 500 Aerospace & Defense Index (“S&P 500 Aerospace & Defense”). The figures in the<br />
performance graph and table below assume an initial investment of $100 at the close of business on June 30, 2006<br />
in Harris, the S&P 500, the S&P 500 Information Technology and the S&P 500 Aerospace & Defense and the<br />
reinvestment of all dividends, including, with respect to our common stock, the Spin-off dividend. For purposes of<br />
calculating the cumulative total return of our common stock, the then-current market value of the HSTX shares<br />
distributed in the Spin-off was deemed to have been reinvested on the May 27, 2009 Spin-off date in shares of our<br />
common stock.<br />
We have included the S&P 500 because we are a company within the S&P 500, and we have included the S&P<br />
500 Information Technology as a relevant published industry index. In addition, we have included the S&P 500<br />
Aerospace & Defense because we believe that this index is representative of certain other companies competing<br />
with us or otherwise participating in markets we serve, and therefore may also provide a fair basis for comparison<br />
with us and be relevant to an assessment of our performance.<br />
30
COMPARISON OF FIVE-YEAR CUMULATIVE TOTAL RETURN AMONG<br />
HARRIS, S&P 500, S&P 500 INFORMATION TECHNOLOGY AND S&P 500 AEROSPACE & DEFENSE<br />
$200<br />
$150<br />
$100<br />
$50<br />
$0<br />
2006 2007 2008 2009 2010 2011<br />
HARRIS<br />
S&P 500<br />
S&P 500 Aerospace & Defense<br />
S&P 500 Information Technology<br />
HARRIS FISCAL YEAR END 2006 2007 2008 2009 2010 2011<br />
Harris $100 133 126 75 111 125<br />
S&P 500 $100 121 104 75 88 117<br />
S&P 500 Information Technology $100 126 118 93 110 141<br />
S&P 500 Aerospace &Defense $100 124 110 81 102 138<br />
Sales of Unregistered Securities<br />
During fiscal 2011, we did not issue or sell any unregistered securities.<br />
Issuer Purchases of Equity Securities<br />
During fiscal 2011, we repurchased 5,325,690 shares of our common stock under our repurchase program at an<br />
average price per share of $46.92, excluding commissions. During fiscal 2010, we repurchased 4,779,411 shares of<br />
our common stock under our repurchase program at an average price per share of $41.81, excluding commissions.<br />
The level of our repurchases depends on a number of factors, including our financial condition, capital requirements,<br />
results of operations, future business prospects and other factors that our Board of Directors may deem relevant. The<br />
timing, volume and nature of share repurchases are subject to market conditions, applicable securities laws and other<br />
factors and are at our discretion and may be suspended or discontinued at any time. Shares repurchased by us are<br />
cancelled and retired.<br />
31
The following table sets forth information with respect to repurchases by us of our common stock during the<br />
fiscal quarter ended July 1, 2011:<br />
Period*<br />
Total number of<br />
shares purchased<br />
Average price<br />
paid per share<br />
Total number of<br />
shares purchased as<br />
part of publicly<br />
announced plans or<br />
programs (1)<br />
Maximum<br />
approximate<br />
dollar value<br />
of shares that may<br />
yet be purchased<br />
under the plans or<br />
programs (1)<br />
Month No. 1<br />
(April 2, 2011-April 29, 2011)<br />
Repurchase Programs (1) ........ None n/a None $300,592,325<br />
Employee Transactions (2). ......<br />
Month No. 2<br />
(April 30, 2011-May 27, 2011)<br />
34,831 $50.94 n/a n/a<br />
Repurchase Programs (1) ........ 1,912,460 $48.83 1,912,460 $207,208,781<br />
Employee Transactions (2). ......<br />
Month No. 3<br />
(May 28, 2011-July 1, 2011)<br />
65,961 $48.56 n/a n/a<br />
Repurchase Programs (1) ........ 135,450 $48.50 135,450 $200,639,551<br />
Employee Transactions (2). ...... 34,961 $46.50 n/a n/a<br />
Total ......................... 2,183,663 $48.80 2,047,910 $200,639,551<br />
* Periods represent our fiscal months.<br />
(1) On March 2, 2009, we announced that on February 27, 2009, our Board of Directors approved the 2009 Repurchase Program authorizing us<br />
to repurchase up to $600 million in shares of our stock through open-market transactions, private transactions, transactions structured through<br />
investment banking institutions or any combination thereof. The 2009 Repurchase Program did not have a stated expiration date and has<br />
resulted in repurchases in excess of the dilutive effect of shares issued under our share-based incentive plans. The approximate dollar amount<br />
of our stock that may yet be purchased under the 2009 Repurchase Program as of July 1, 2011 was $200,639,551 (as reflected in the table<br />
above). On August 2, 2011, we announced that on July 30, 2011, our Board of Directors approved the New Repurchase Program authorizing<br />
us to repurchase up to $1 billion in shares of our stock through open-market transactions, private transactions, transactions structured through<br />
investment banking institutions or any combination thereof. The New Repurchase Program replaced the 2009 Repurchase Program as of<br />
July 30, 2011 and does not have a stated expiration date. We currently expect to repurchase up to $500 million in shares of our stock under<br />
the New Repurchase Program by the end of calendar year 2011 and to fund share repurchases with available cash and commercial paper. The<br />
New Repurchase Program is expected to result in repurchases well in excess of the dilutive effect of shares issued under our share-based<br />
incentive plans. However, the level of our repurchases depends on a number of factors, including our financial condition, capital<br />
requirements, results of operations, future business prospects and other factors our Board of Directors may deem relevant. The timing,<br />
volume and nature of repurchases are subject to market conditions, applicable securities laws and other factors and are at our discretion and<br />
may be suspended or discontinued at any time. As a matter of policy, we do not repurchase shares during the period beginning on the 15th<br />
day of the third month of a fiscal quarter and ending two days following the public release of earnings and financial results for such fiscal<br />
quarter.<br />
(2) Represents a combination of (a) shares of our common stock delivered to us in satisfaction of the exercise price and/or tax withholding<br />
obligation by holders of employee stock options who exercised stock options, (b) shares of our common stock delivered to us in satisfaction<br />
of the tax withholding obligation of holders of performance shares or restricted shares that vested during the quarter, (c) performance shares<br />
or restricted shares returned to us upon retirement or employment termination of employees or (d) shares of our common stock purchased by,<br />
or sold to us by, the Harris Corporation Master Rabbi Trust, with the trustee thereof acting at our direction, to fund obligations of the Rabbi<br />
Trust under our deferred compensation plans. Our equity incentive plans provide that the value of shares delivered to us to pay the exercise<br />
price of options or to cover tax withholding obligations shall be the closing price of our common stock on the date the relevant transaction<br />
occurs.<br />
The information required by this Item with respect to securities authorized for issuance under our equity<br />
compensation plans is included in “Item 12. Security Ownership of Certain Beneficial Owners and Management and<br />
Related Stockholder Matters — Equity Compensation Plan Information” of this Report. See Note 14: Stock Options<br />
and Other Share-Based Compensation in the Notes for a general description of our stock and equity incentive plans.<br />
32
ITEM 6. SELECTED FINANCIAL DATA.<br />
The following table summarizes our selected historical financial information for each of the last five fiscal<br />
years. All amounts presented have been restated on a continuing operations basis. Discontinued operations are more<br />
fully discussed in Note 3: Discontinued Operations in the Notes. The selected financial information shown below<br />
has been derived from our audited Consolidated Financial Statements, which for data presented for fiscal years 2011<br />
and 2010 are included elsewhere in this Report. This table should be read in conjunction with our other financial<br />
information, including “Item 7. Management’s Discussion and Analysis of Financial Condition and Results of<br />
Operations” and the Consolidated Financial Statements and accompanying Notes, included elsewhere in this Report.<br />
2011 (1) 2010 (2)<br />
Fiscal Years Ended<br />
2009 (3) 2008 (4) 2007 (5)<br />
(In millions, except per share amounts)<br />
Results of Operations:<br />
Revenue from product sales and services ............ $5,924.6 $5,206.1 $5,005.0 $4,596.1 $3,737.9<br />
Cost of product sales and services ................. 3,810.5 3,334.4 3,420.2 3,145.6 2,519.8<br />
Interest expense ............................... 90.4 72.1 52.8 53.1 38.9<br />
Income from continuing operations before income<br />
taxes ..................................... 880.7 840.3 485.3 667.5 518.1<br />
Income taxes ................................. 293.6 278.7 172.9 214.0 170.9<br />
Income from continuing operations. ................ 587.1 561.6 312.4 453.5 347.2<br />
Discontinued operations, net of income taxes ......... — — (437.0) (16.5) 122.7<br />
Net income (loss) ............................. 587.1 561.6 (124.6) 437.0 469.9<br />
Noncontrolling interests, net of income taxes ......... 0.9 — 162.5 7.2 10.5<br />
Net income attributable to Harris Corporation ......... 588.0 561.6 37.9 444.2 480.4<br />
Average shares outstanding (diluted). ............... 126.3 130.0 133.0 136.2 141.1<br />
Per Share Data (Diluted) Attributable to Harris<br />
Corporation Common Shareholders:<br />
Income from continuing operations. ................ $ 4.60 $ 4.28 $ 2.33 $ 3.31 $ 2.49<br />
Income (loss) from discontinued operations, net of<br />
income taxes ............................... — — (2.05) (0.07) 0.94<br />
Net income .................................. 4.60 4.28 0.28 3.24 3.43<br />
Cash dividends ............................... 1.00 0.88 0.80 0.60 0.44<br />
Financial Position at Fiscal Year-End:<br />
Net working capital ............................ $ 786.3 $ 952.8 $ 749.7 $ 814.5 $ 23.5<br />
Net property, plant and equipment ................. 872.8 609.7 543.2 407.2 379.2<br />
Long-term debt ............................... 1,887.2 1,176.6 1,177.3 828.0 400.1<br />
Total assets .................................. 6,172.8 4,743.6 4,465.1 4,627.5 4,406.0<br />
Equity ...................................... 2,512.0 2,190.1 1,869.1 2,604.3 2,230.7<br />
Book value per share ........................... 20.40 17.18 14.23 19.49 17.22<br />
(1) Results for fiscal 2011 included a $36.8 million after-tax ($.29 per diluted share) charge for integration and other costs in our Integrated<br />
Network Solutions segment associated with our acquisitions of CapRock, Schlumberger GCS, the Core180 Infrastructure and Carefx.<br />
(2) Results for fiscal 2010 included: a $14.5 million after-tax ($.11 per diluted share) charge for integration and other costs in our RF<br />
Communications segment associated with our acquisition of Wireless Systems; a $3.6 million after-tax ($.03 per diluted share) charge for<br />
integration and other costs in our Integrated Network Solutions segment associated with our acquisitions of Patriot Technologies, LLC<br />
(“Patriot”), SignaCert, Inc. (“SignaCert”) and CapRock; and a $1.8 million after-tax ($.01 per diluted share) charge for integration and other<br />
costs in our Government Communications Systems segment associated with our acquisitions of Crucial Security, Inc. (“Crucial”) and the Air<br />
Traffic Control business unit (“SolaCom ATC”) of SolaCom Technologies, Inc.<br />
(3) Results for fiscal 2009 included: a $196.7 million after-tax ($1.48 per diluted share) non-cash charge for impairment of goodwill and other<br />
long-lived assets in our Integrated Network Solutions segment related to Broadcast and New Media Solutions; a $6.0 million after-tax ($.04<br />
per diluted share) charge for integration and other costs in our RF Communications segment associated with our acquisition of Wireless<br />
Systems; an $18.0 million after-tax ($.14 per diluted share) charge, net of government cost reimbursement, for company-wide cost-reduction<br />
actions; and a $6.5 million after-tax ($.05 per diluted share) favorable impact from the settlement of the U.S. Federal income tax audit of<br />
fiscal year 2007.<br />
(4) Results for fiscal 2008 included: a $47.1 million after-tax ($.34 per diluted share) charge for schedule and cost overruns on commercial<br />
satellite reflector programs in our Government Communications Systems segment; a $6.2 million after-tax ($.05 per diluted share) increase to<br />
income related to the renegotiation of pricing on an IT services contract in our Integrated Network Solutions segment; and an $11.0 million<br />
after-tax ($.08 per diluted share) favorable impact from the settlement of U.S. Federal income tax audits of fiscal years 2004 through 2006.<br />
33
(5) Results for fiscal 2007 included: a $6.0 million after-tax ($.04 per diluted share) charge for cost-reduction actions and a $12.3 million aftertax<br />
($.09 per diluted share) write-down of capitalized software associated with our decision to discontinue an automation software<br />
development effort in our Integrated Network Solutions segment; a $12.9 million after-tax ($.09 per diluted share) write-down of our<br />
investment in Terion, Inc. (“Terion”) due to an other-than-temporary impairment; and a $12.0 million after-tax ($.09 per diluted share)<br />
favorable impact from the settlement of a tax audit.<br />
ITEM 7. MANAGEMENT’S DISCUSSION AND ANALYSIS OF FINANCIAL CONDITION AND<br />
RESULTS OF OPERATIONS.<br />
OVERVIEW<br />
The following Management’s Discussion and Analysis (“MD&A”) is intended to assist in an understanding of<br />
Harris. MD&A is provided as a supplement to, should be read in conjunction with, and is qualified in its entirety by<br />
reference to, our Consolidated Financial Statements and accompanying Notes appearing elsewhere in this Report.<br />
Except for the historical information contained herein, the discussions in MD&A contain forward-looking statements<br />
that involve risks and uncertainties. Our future results could differ materially from those discussed herein. Factors<br />
that could cause or contribute to such differences include, but are not limited to, those discussed below in MD&A<br />
under “Forward-Looking Statements and Factors that May Affect Future Results.”<br />
The following is a list of the sections of MD&A, together with our perspective on the contents of these sections<br />
of MD&A, which we hope will assist in reading these pages:<br />
• Business Considerations — a general description of our businesses; the value drivers of our businesses and<br />
our strategy for achieving value; fiscal 2011 results of operations and liquidity and capital resources key<br />
indicators; and industry-wide opportunities, challenges and risks that are relevant to us in the defense,<br />
government and commercial markets.<br />
• Operations Review — an analysis of our consolidated results of operations and of the results in each of our<br />
three operating segments, to the extent the segment operating results are helpful to an understanding of our<br />
business as a whole, for the three years presented in our financial statements. In this section of MD&A,<br />
“income from continuing operations” refers to income from continuing operations attributable to Harris<br />
Corporation common shareholders.<br />
• Liquidity, Capital Resources and Financial Strategies — an analysis of cash flows, common stock<br />
repurchases, dividends, capital structure and resources, contractual obligations, off-balance sheet<br />
arrangements, commercial commitments, financial risk management, impact of foreign exchange and impact<br />
of inflation.<br />
• Critical Accounting Policies and Estimates — a discussion of accounting policies and estimates that require<br />
the most judgment and a discussion of accounting pronouncements that have been issued but not yet<br />
implemented by us and their potential impact on our financial position, results of operations and cash flows.<br />
• Forward-Looking Statements and Factors that May Affect Future Results — cautionary information about<br />
forward-looking statements and a description of certain risks and uncertainties that could cause our actual<br />
results to differ materially from our historical results or our current expectations or projections.<br />
BUSINESS CONSIDERATIONS<br />
General<br />
We are an international communications and information technology company serving government and<br />
commercial markets in more than 150 countries. We are dedicated to developing best-in-class assured<br />
communications» products, systems and services for global markets. Our company generates revenue, income and<br />
cash flows by developing, manufacturing and selling communications products and software as well as providing<br />
related services. We sell directly to our customers, the largest of which are U.S. Government customers and their<br />
prime contractors, and we utilize agents and intermediaries to sell and market some products and services, especially<br />
in international markets.<br />
We structure our operations primarily around the products and services we sell and the markets we serve. As<br />
previously reported and as also discussed in Note 1: Significant Accounting Policies and Note 25: Business Segments<br />
in the Notes, in the third quarter of fiscal 2011, we realigned our operations to provide increased market focus and<br />
address certain high-growth commercial markets. As a result of the realignment, effective for the third quarter of<br />
34
fiscal 2011, our reportable operating segment structure changed, and we now report the financial results of our<br />
continuing operations in the following three operating segments:<br />
• Our RF Communications segment, which is unchanged by the realignment and continues to be comprised of<br />
(i) U.S. Department of Defense and International Tactical Communications (“Tactical Communications”) and<br />
(ii) Public Safety and Professional Communications;<br />
• Our Integrated Network Solutions segment, which is comprised of (i) IT Services, (ii) Managed Satellite and<br />
Terrestrial Communications Solutions, (iii) Healthcare Solutions, (iv) Cyber Integrated Solutions and<br />
(v) Broadcast and New Media Solutions; and<br />
• Our Government Communications Systems segment, which is now comprised of (i) Civil Programs,<br />
(ii) Defense Programs and (iii) National Intelligence Programs.<br />
Our new reportable operating segment structure reflects that IT Services, Managed Satellite and Terrestrial<br />
Communications Solutions, Healthcare Solutions and Cyber Integrated Solutions are no longer under our<br />
Government Communications Systems segment, but instead have been realigned with Broadcast and New Media<br />
Solutions (formerly a separate reportable segment called Broadcast Communications) to form our new Integrated<br />
Network Solutions segment. Our RF Communications segment did not change. The historical results, discussion and<br />
presentation of our operating segments as set forth in this Report have been adjusted to reflect the impact of these<br />
changes to our reportable operating segment structure for all periods presented in this Report.<br />
Additionally, in the fourth quarter of fiscal 2009, in connection with the May 27, 2009 Spin-off in the form of<br />
a taxable pro rata dividend to our shareholders of all the shares of HSTX common stock owned by us, we<br />
eliminated our former HSTX operating segment. Our historical financial results have been restated to account for<br />
HSTX as discontinued operations for all periods presented in this Report, and unless otherwise specified, disclosures<br />
in this Report relate solely to our continuing operations. See Note 3: Discontinued Operations in the Notes for<br />
additional information regarding discontinued operations.<br />
Financial information with respect to all of our other activities, including corporate costs not allocated to the<br />
operating segments or discontinued operations, is reported as part of the “Unallocated corporate expense” or “Nonoperating<br />
loss” line items in our Consolidated Financial Statements and accompanying Notes.<br />
Value Drivers of Our Businesses and Our Strategy for Achieving Value<br />
Harris’ mission statement is as follows: “Harris Corporation will be the best-in-class global provider of<br />
mission-critical assured communications» systems and services to both government and commercial customers,<br />
combining advanced technology and application knowledge.” We are committed to our mission statement, and we<br />
believe that executing our mission statement creates value. Consistent with this commitment to effective execution,<br />
we currently focus on these key value drivers:<br />
• Continuing profitable revenue growth in all segments by introducing new technology-based products,<br />
expanding our addressable markets and customer base, and investing in international markets and channels;<br />
• Leveraging technology, know-how and capabilities transfer across business segments;<br />
• Achieving operating efficiencies and cost reductions by delivering on supply chain and operations excellence;<br />
• Making strategic acquisitions to enhance and supplement our products and services portfolios and to gain<br />
access to new markets; and<br />
• Maintaining a strong financial foundation.<br />
Continuing profitable revenue growth in all segments: We plan to focus on continued profitable revenue<br />
growth by focusing on the following strategies in each segment:<br />
RF Communications: Continue to leverage our reputation and position as a leading provider of secure tactical<br />
radio communications and embedded high-grade encryption solutions for military and government organizations and<br />
secure communications systems and equipment for public safety, utility and transportation markets. Capitalize on the<br />
opportunity to transform the legacy narrowband market into the network-enabled wideband market of the future.<br />
Continue to increase our international presence, product offerings, solutions, support and services.<br />
Integrated Network Solutions: Provide mission-critical end-to-end IT services; managed satellite and<br />
terrestrial communications solutions; standards-based healthcare interoperability and image management solutions;<br />
cyber integration and cloud application hosting solutions; and digital media management solutions to support<br />
government, energy, healthcare, enterprise and broadcast customers. Leverage our IT services business scale and<br />
capabilities in each of the above mentioned vertical markets. Continue to increase our international presence,<br />
product offerings, solutions, support and services.<br />
35
Government Communications Systems: Conduct advanced research and produce, integrate and support highly<br />
reliable, net-centric communications and information technology that solve the mission-critical challenges of our<br />
civilian, defense and intelligence government customers, primarily the U.S. Government. Leverage core capabilities<br />
such as SATCOM, ground systems, avionics, data links, mission-critical networks, ISR and space systems.<br />
Leveraging technology, know-how and capabilities transfer across business segments: One of our strengths<br />
is our ability to transfer technology, know-how and capabilities among business segments and focus our research<br />
and development projects in ways that benefit Harris as a whole. An example of this is our FAME product that<br />
utilizes COTS software and hardware developed by our Integrated Network Solutions segment and applying that<br />
technology to government applications where there is a need to gather, store, distribute and analyze increasingly<br />
large amounts of ISR data. The partnering of Broadcast and New Media Solutions and IT Services to provide fully<br />
integrated solutions for the Orlando Magic and 7-Eleven is another example. Another area of focus is cross-selling<br />
through vertical market sales channels and joint pursuits by multiple segments. Other corporate initiatives include<br />
joint international market channel development, such as shared distributors and coordinated “go-to-market”<br />
strategies.<br />
Achieving operating efficiencies and cost reductions: Our principal focus areas for operating efficiencies and<br />
cost management are: reducing procurement costs through an emphasis on coordinated supply chain management;<br />
reducing product costs through dedicated engineering resources focused on product design; improving<br />
manufacturing efficiencies across all segments; and optimizing facility utilization.<br />
Making strategic acquisitions: Another key value driver is making strategic acquisitions and investments to<br />
build or complement the strengths in our core businesses, more quickly access adjacent markets, and gain access to<br />
new markets. On July 30, 2010, we acquired CapRock, a global provider of mission-critical, managed satellite<br />
communications services for the government, energy and maritime industries. The acquisition of CapRock increased<br />
the breadth of our assured communications» capabilities, while enabling us to enter new vertical markets and<br />
increase our international presence. On April 4, 2011, we acquired Schlumberger GCS, a provider of satellite and<br />
terrestrial communications services for the worldwide energy market. We report CapRock and Schlumberger GCS as<br />
part of Managed Satellite and Terrestrial Communications Solutions under our Integrated Network Solutions<br />
segment. Also on April 4, 2011, we acquired Carefx, a provider of interoperability workflow solutions for<br />
government and commercial healthcare providers. This acquisition expanded our presence in government healthcare,<br />
provided entry into the commercial healthcare market and is expected to leverage the healthcare interoperability<br />
workflow products offered by Carefx and the broader scale of enterprise intelligence solutions and services that we<br />
provide. We report Carefx as part of Healthcare Solutions under our Integrated Network Solutions segment. In the<br />
fourth quarter of fiscal 2009, we acquired Wireless Systems, an established provider of mission-critical wireless<br />
communications systems for law enforcement, fire and rescue, public service, utility and transportation markets. We<br />
report Wireless Systems as Public Safety and Professional Communications under our RF Communications segment.<br />
Maintaining a strong financial foundation: We believe our strong capital position, access to key financial<br />
markets, ability to raise funds at a low effective cost and overall low cost of borrowing provide a strong financial<br />
foundation from which to operate. We had $366.9 million in cash and cash equivalents as of July 1, 2011 and had<br />
$833.1 million of cash flows provided by operating activities during fiscal 2011. Our cash is not restricted and can<br />
be used for internal investments, capital expenditures, strategic acquisitions, repurchases of our common stock or to<br />
pay dividends to our shareholders. On July 30, 2011, our Board of Directors approved the $1 billion New<br />
Repurchase Program that replaced the 2009 Repurchase Program, which had a remaining, unused authorization of<br />
approximately $200 million. The New Repurchase Program does not have a stated expiration date. We currently<br />
expect to repurchase up to $500 million in shares under the New Repurchase Program by the end of calendar year<br />
2011. The New Repurchase Program is expected to result in repurchases well in excess of the dilutive effect of<br />
shares issued under our share-based incentive plans. However, the level of repurchases depends on a number of<br />
factors, including our financial condition, capital requirements, results of operations, future business prospects and<br />
other factors our Board of Directors may deem relevant. Share repurchases are expected to be funded with available<br />
cash and commercial paper. Repurchases under the New Repurchase Program may be made through open market<br />
purchases, private transactions, transactions structured through investment banking institutions, or any combination<br />
thereof. The timing, volume and nature of share repurchases are subject to market conditions, applicable securities<br />
laws and other factors and are at our discretion and may be suspended or discontinued at any time. Additional<br />
information regarding share repurchases during fiscal 2011 and our Repurchase Programs is set forth above under<br />
“Item 5. Market for Registrant’s Common Equity, Related Stockholder Matters and Issuer Purchases of Equity<br />
Securities” of this Report.<br />
36
Key Indicators<br />
We believe our value drivers, when implemented, will improve our key indicators of value, such as: income<br />
from continuing operations and income from continuing operations per diluted common share; revenue; income<br />
from continuing operations as a percentage of revenue; net cash provided by operating activities; return on average<br />
assets; and return on average equity. The measure of our success is reflected in our results of operations and<br />
liquidity and capital resources key indicators as discussed below:<br />
Fiscal 2011 Results of Operations Key Indicators: Income from continuing operations, income from<br />
continuing operations per diluted common share, revenue, and income from continuing operations as a percentage of<br />
revenue represent key measurements of our value drivers:<br />
• Income from continuing operations increased 4.7 percent to $588.0 million in fiscal 2011 from<br />
$561.6 million in fiscal 2010;<br />
• Income from continuing operations per diluted common share increased 7.5 percent to $4.60 in fiscal 2011<br />
from $4.28 in fiscal 2010;<br />
• Revenue increased 13.8 percent to $5.9 billion in fiscal 2011 from $5.2 billion in fiscal 2010; and<br />
• Income from continuing operations as a percentage of revenue decreased to 9.9 percent in fiscal 2011 from<br />
10.8 percent in fiscal 2010.<br />
Refer to MD&A heading “Operations Review” below in this Report for more information.<br />
Liquidity and Capital Resources Key Indicators: Net cash provided by operating activities, return on average<br />
assets and return on average equity also represent key measurements of our value drivers:<br />
• Net cash provided by operating activities increased to $833.1 million in fiscal 2011 from $802.7 million in<br />
fiscal 2010;<br />
• Return on average assets (defined as income from continuing operations divided by the two-point average of<br />
total assets at the beginning and ending of the fiscal year) decreased to 10.8 percent in fiscal 2011 from<br />
12.2 percent in fiscal 2010; and<br />
• Return on average equity (defined as income from continuing operations divided by the two-point average of<br />
equity at the beginning and ending of the fiscal year) decreased to 25.0 percent in fiscal 2011 from<br />
27.7 percent in fiscal 2010.<br />
Refer to MD&A heading “Liquidity, Capital Resources and Financial Strategies” below in this Report for more<br />
information.<br />
Industry-Wide Opportunities, Challenges and Risks<br />
Department of Defense: The DoD’s U.S. Government Fiscal Year (“GFY”) 2012 budget proposal reflects<br />
continued investment in national security priorities (including cyber security) and continues efforts to rebalance<br />
military forces to focus on both today’s wars as well as potential future conflicts. Building on efforts begun in GFY<br />
2010, the DoD will continue to implement its acquisition reforms and modernize key weapons systems to provide<br />
service members with the best technology to meet battlefield needs. We expect the U.S. Government to remain<br />
committed to funding intelligence, information superiority, special operations, warfighter support and cyber security,<br />
although there can be no assurance it will do so.<br />
The DoD’s $671 billion GFY 2012 budget request is approximately 3.1% less than GFY 2010 enacted levels of<br />
$692 billion and approximately 5.3% less than the $708 billion GFY 2011 budget request. The GFY 2012 budget<br />
request includes $553 billion for base defense programs compared with $549 billion for base defense programs in<br />
the GFY 2011 budget request, and includes $118 billion for overseas contingency operations (“OCO”) compared<br />
with $159 billion for OCO in the GFY 2011 budget request, reflecting the winding down of military operations in<br />
Iraq and Afghanistan. Of the $118 billion GFY 2012 budget request for OCO, $107 billion is to support activities in<br />
Afghanistan and $11 billion is to support activities in Iraq.<br />
The level of budget amounts allocated to DoD procurement accounts (“Procurement”), along with research,<br />
development, test and evaluation (“RDT&E”) components of the DoD budget, also are an important indicator of<br />
spending. The GFY 2012 budget requests for Procurement and RDT&E of $113 billion and $75 billion, respectively,<br />
are comparable to the GFY 2011 budget requests of $113 billion and $76 billion, respectively. Additionally, the<br />
DoD Operations and Maintenance account (“O&M”), which contains the bulk of funding for training, logistics,<br />
services and other logistical support, is an account of major importance. The DoD O&M budget request for GFY<br />
2012 is $204 billion compared with the GFY 2011 budget request of $200 billion.<br />
37
Over the longer term, DoD budgets are expected to decrease from current levels. While the DoD budget<br />
proposed by the Administration in February 2011 reflects a modest growth rate of approximately 2% from GFY<br />
2012 through GFY 2021, recently enacted debt-ceiling legislation requires reductions of approximately $350 billion<br />
in Pentagon and national security agency budgets over the next ten years. Further, if a House-Senate committee is<br />
unsuccessful in reaching an agreement upon a deficit reduction plan by late November 2011, the recently enacted<br />
debt-ceiling legislation requires significant cuts in federal spending, which would be expected to result in deeper<br />
reductions to DoD budgets. Despite the expected lower levels of defense spending and the cancellation of particular<br />
platforms and programs, the types of products and services we offer appear to be a funding priority over the long<br />
term, which we believe will positively affect our future orders, sales, income and cash flows. Conversely, a<br />
significant decline in defense spending or a shift in funding priorities may have a negative effect on future orders,<br />
sales, income and cash flows depending on the platforms and programs affected by such budget reductions or shifts<br />
in funding priorities.<br />
Other Federal Markets: Another current funding priority for the U.S. Government is the security of the United<br />
States, which includes better communications interplay among law enforcement, civil government agencies,<br />
intelligence agencies and our military services. Funding for investments in secure tactical communications, IT,<br />
information processing, healthcare IT, cyber security and additional communications assets and upgrades has remained<br />
solid. Another current priority of the U.S. Government is investments in productivity, cost reductions and upgrading to<br />
new IT systems and solutions. As a result, programs that promote these initiatives are also expected to receive funding,<br />
although there is no assurance that such funding will remain a priority. We provide products and services to a number<br />
of U.S. Government agencies including the FAA, NRO, NGA, Department of State, NSA, NOAA and others. For<br />
example, the FAA has announced its Next Generation Air Transportation System (“NextGen”) program to transform<br />
the entire U.S. air transport system to meet future demands and avoid gridlock in the sky and at airports.<br />
State and Local: We also provide products to state and local government agencies that are committed to<br />
protecting our homeland and public safety. Despite near-term budget pressures for state and local government agencies,<br />
we believe more normal spending patterns will resume in the long term as these agencies continue upgrading their<br />
technologies to improve communications and interoperability, although there can be no assurance they will do so.<br />
International: Recently, we have experienced a delay in international orders due to continuing political<br />
uncertainty in Northern Africa, the Middle East and Central Asia. However, over the longer term, we believe<br />
demand for communications and IT infrastructure technology and services in emerging global markets will remain<br />
robust. International markets continue to drive toward tactical communications upgrades and interoperability. We<br />
have also identified substantial opportunities with international governments with respect to their defense spending<br />
on national security and on tactical communications modernization and standardization programs, which we believe<br />
will positively affect our future orders, sales, income and cash flows.<br />
Government Oversight and Risk: As a U.S. Government contractor, we are subject to U.S. Government<br />
oversight. The U.S. Government may investigate our business practices and audit our compliance with applicable<br />
rules and regulations. Depending on the results of those investigations and audits, the U.S. Government could make<br />
claims against us. Under U.S. Government procurement regulations and practices, an indictment or conviction of a<br />
government contractor could result in that contractor being fined and/or suspended from being able to bid on, or<br />
from being awarded, new U.S. Government contracts for a period of time. Similar government oversight exists in<br />
most other countries where we conduct business. We are currently not aware of any compliance audits or<br />
investigations that could result in a significant adverse impact to our financial condition, results of operations or<br />
cash flows.<br />
We are also subject to other risks associated with U.S. Government business, including technological<br />
uncertainties, dependence on annual appropriations and allotment of funds, extensive regulations and other risks,<br />
which are discussed in “Item 1A. Risk Factors” and “Item 3. Legal Proceedings” of this Report.<br />
Commercial: We are working to leverage our proven technologies for government applications into attractive<br />
commercial applications and expand in high-growth commercial markets. These markets include IT services,<br />
managed services, cyber integration and media solutions supporting energy, healthcare, broadcast and enterprise<br />
networks. We are trusted to run some of the United States’ largest, secure mission-critical information networks, and<br />
demand for communications and IT infrastructure in emerging global markets remains robust. As a cyber integrator,<br />
we see a large opportunity to help large <strong>corporation</strong>s move their complex IT enterprises to a trusted cloud<br />
environment in order to reduce costs, expand IT service delivery and increase security and compliance. Trends and<br />
developments in the broadcast and new media solutions market include the continuing worldwide transition to<br />
digital and HD technologies; a rebound in the global ad spending market; increasing demand for new systems to<br />
deliver rich media content to live sports and entertainment venues, retail establishments and mobile handheld<br />
38
devices; and a transition from the traditional linear broadcast TV advertising model to out-of-home networks. In the<br />
energy market, we believe oil exploration must accelerate to meet rising global demand for oil and that drivers of<br />
industry demand, including commodity prices, drilling rig counts and well completions and workover activity,<br />
should remain favorable in most geographic market areas, with the exception of the Gulf of Mexico. In the<br />
healthcare market, we believe there are significant opportunities for growth as we capitalize on trends towards<br />
accelerating electronic health record adoption and sharing; accountable care driving hospital consolidation and<br />
enterprise solutions; and increased penalties for healthcare data security violations fueling cyber solutions.<br />
Our management believes that our experience and capabilities are well aligned with, and that we are positioned<br />
to capitalize on, the market trends noted above in this Report. While we believe that some of these developments<br />
may temper near-term growth, we also expect they generally will have a longer-term positive impact on us.<br />
However, we remain subject to general economic conditions that could adversely affect us and our suppliers and<br />
customers. We also remain subject to other risks associated with these markets, including technological<br />
uncertainties, adoption of our new products and other risks which are discussed below under “Forward-Looking<br />
Statements and Factors that May Affect Future Results” and in “Item 1A. Risk Factors” of this Report.<br />
OPERATIONS REVIEW<br />
Revenue and Income From Continuing Operations<br />
2011 2010<br />
2011/2010<br />
Percent<br />
Increase/<br />
(Decrease) 2009<br />
2010/2009<br />
Percent<br />
Increase/<br />
(Decrease)<br />
(Dollars in millions, except per share amounts)<br />
Revenue ............................. $5,924.6 $5,206.1 13.8% $5,005.0 4.0%<br />
Income from continuing operations ......... $ 588.0 $ 561.6 4.7% $ 312.4 79.8%<br />
% of revenue ....................... 9.9% 10.8% 6.2%<br />
Income from continuing operations per diluted<br />
common share ...................... $ 4.60 $ 4.28 7.5% $ 2.33 83.7%<br />
Fiscal 2011 Compared With Fiscal 2010: The increase in revenue in fiscal 2011 compared with fiscal 2010<br />
was primarily due to revenue from CapRock, which we acquired in the first quarter of fiscal 2011, and strength in<br />
international sales in Tactical Communications in our RF Communications segment. The increase in income from<br />
continuing operations in fiscal 2011 compared with fiscal 2010 was primarily due to higher operating income in our<br />
RF Communications segment resulting from higher international sales in Tactical Communications, partially offset<br />
by lower operating income in our Integrated Network Solutions segment, primarily due to integration and other costs<br />
associated with our acquisitions of CapRock, Schlumberger GCS and Carefx, and higher interest expense, primarily<br />
due to borrowings associated with these acquisitions. The decrease in income from continuing operations as a<br />
percentage of revenue in fiscal 2011 compared with fiscal 2010 was primarily due to lower operating income as a<br />
percentage of revenue in our Integrated Network Solutions segment, primarily the result of integration and other<br />
costs associated with the acquisitions mentioned above. See the “Interest Income and Interest Expense” and<br />
“Discussion of Business Segments” discussions below in this MD&A for further information.<br />
Fiscal 2010 Compared With Fiscal 2009: Revenue increased in fiscal 2010 compared with fiscal 2009,<br />
primarily due to increases in revenue in our RF Communications and Integrated Network Solutions segments,<br />
partially offset by a decrease in revenue in our Government Communications Systems segment. Fiscal 2010 revenue<br />
increased by 17.4 percent and 0.6 percent, respectively, in our RF Communications and Integrated Network<br />
Solutions segments, and decreased 6.3 percent in our Government Communications Systems segment. Our RF<br />
Communications segment revenue benefited from our acquisition of Wireless Systems in the fourth quarter of fiscal<br />
2009, partially offset by a decline in our Tactical Communications business in fiscal 2010. Government<br />
Communications Systems segment revenue reflected the winding down of the Field Data Collection Automation<br />
(“FDCA”) program for the 2010 U.S. Census that was mostly offset by growth from several new programs and<br />
growth initiatives. Fiscal 2010 income from continuing operations increased from fiscal 2009, primarily due to a<br />
$255.5 million ($196.7 million after-tax) non-cash charge recorded in fiscal 2009 for impairment of goodwill and<br />
other long-lived assets in our Integrated Network Solutions segment related to Broadcast and New Media Solutions<br />
and strong operating results in fiscal 2010 in our RF Communications and Government Communications Systems<br />
segments. Additionally, operating income in fiscal 2009 included an $18.0 million charge for schedule and cost<br />
overruns on commercial satellite reflector programs; interest expense increased to $72.1 million in fiscal 2010 from<br />
interest expense of $52.8 million in fiscal 2009, primarily due to increased borrowings related to our acquisition of<br />
Wireless Systems; and in fiscal 2010, our effective tax rate (income taxes as a percentage of income from<br />
continuing operations before income taxes) was 33.2 percent compared with an effective tax rate of 35.6 percent in<br />
39
fiscal 2009. See the “Interest Income and Interest Expense,” “Income Taxes” and “Discussion of Business<br />
Segments” discussions below in this MD&A for further information.<br />
Gross Margin<br />
2011 2010<br />
2011/2010<br />
Percent<br />
Increase/<br />
(Decrease) 2009<br />
2010/2009<br />
Percent<br />
Increase/<br />
(Decrease)<br />
(Dollars in millions)<br />
Revenue ........................... $5,924.6 $ 5,206.1 13.8% $ 5,005.0 4.0%<br />
Cost of product sales and services ........ (3,810.5) (3,334.4) 14.3% (3,420.2) (2.5)%<br />
Gross Margin ....................... 2,114.1 1,871.7 13.0% 1,584.8 18.1%<br />
% of revenue. ..................... 35.7% 36.0% 31.7%<br />
Fiscal 2011 Compared With Fiscal 2010: The decrease in gross margin (revenue less cost of product sales<br />
and services) as a percentage of revenue (“gross margin percentage”) in fiscal 2011 compared with fiscal 2010 was<br />
primarily due to a less favorable product mix in our RF Communications segment due to lower sales of radios to<br />
equip the U.S. military’s MRAP vehicles in fiscal 2011 compared with fiscal 2010 and the impact of our acquisition<br />
of CapRock, which has a lower gross margin percentage than our overall gross margin percentage. See the<br />
“Discussion of Business Segments” discussion below in this MD&A for further information.<br />
Fiscal 2010 Compared With Fiscal 2009: The increase in gross margin percentage in fiscal 2010 compared<br />
with fiscal 2009 was primarily due to an increase in the gross margin percentage in our RF Communications<br />
segment as a result of favorable product mix, due to the MRAP vehicle and mine resistant ambush protected allterrain<br />
vehicle (“M-ATV”) programs, and operational efficiencies, as well as a higher percentage of our overall sales<br />
that was generated by this higher-margin segment. See the “Discussion of Business Segments” discussion below in<br />
this MD&A for further information.<br />
Engineering, Selling and Administrative Expenses<br />
2011 2010<br />
2011/2010<br />
Percent<br />
Increase/<br />
(Decrease) 2009<br />
2010/2009<br />
Percent<br />
Increase/<br />
(Decrease)<br />
(Dollars in millions)<br />
Engineering, selling and administrative expenses. . $1,143.9 $958.9 19.3% $791.3 21.2%<br />
% of revenue .......................... 19.3% 18.4% 15.8%<br />
Fiscal 2011 Compared With Fiscal 2010: Engineering, selling and administrative (“ESA”) expenses, and<br />
ESA expenses as a percentage of revenue, increased in fiscal 2011 compared with fiscal 2010 primarily due to our<br />
acquisitions of CapRock, Schlumberger GCS and Carefx, including integration and other costs associated with these<br />
acquisitions, and the pursuit of new growth opportunities. See the “Discussion of Business Segments” discussion<br />
below in this MD&A for further information.<br />
Overall company-sponsored research and product development costs, which are included in ESA expenses,<br />
were $335.6 million in fiscal 2011 compared with $325.8 million in fiscal 2010.<br />
Fiscal 2010 Compared With Fiscal 2009: ESA expenses increased in 2010 compared with fiscal 2009<br />
primarily due to our acquisition of Wireless Systems in the fourth quarter of fiscal 2009. Additionally, ESA<br />
expenses in fiscal 2010 included $20.4 million of acquisition-related costs, compared with $8.9 million of<br />
acquisition-related costs incurred in fiscal 2009. These increases in ESA expenses were partially offset by the<br />
benefit of cost-reduction actions taken in fiscal 2009.<br />
As a percentage of revenue, ESA expenses increased in fiscal 2010 compared with fiscal 2009 primarily due to<br />
our acquisition of Wireless Systems, which has higher ESA expenses as a percentage of revenue compared with our<br />
other businesses. See the “Discussion of Business Segments” discussion below in this MD&A for further<br />
information.<br />
Overall company-sponsored research and product development costs, which are included in ESA expenses,<br />
were $325.8 million in fiscal 2010 compared with $243.5 million in fiscal 2009. The increase in company-sponsored<br />
research and product development costs was primarily due to our acquisition of Wireless Systems.<br />
40
Interest Income and Interest Expense<br />
2011 2010<br />
2011/2010<br />
Percent<br />
Increase/<br />
(Decrease) 2009<br />
2010/2009<br />
Percent<br />
Increase/<br />
(Decrease)<br />
(Dollars in millions)<br />
Interest income. ............................ $ 2.8 $ 1.5 86.7% $ 3.2 (53.1)%<br />
Interest expense ............................ (90.4) (72.1) 25.4% (52.8) 36.6%<br />
Fiscal 2011 Compared With Fiscal 2010: Our interest income increased in fiscal 2011 compared with fiscal<br />
2010 primarily due to higher average balances of cash and cash equivalents. Our interest expense increased in fiscal<br />
2011 compared with fiscal 2010 primarily due to higher levels of borrowings related to our acquisitions of<br />
CapRock, Schlumberger GCS and Carefx.<br />
Fiscal 2010 Compared With Fiscal 2009: Our interest income decreased in fiscal 2010 compared with fiscal<br />
2009 primarily due to lower interest rates applicable to our balances of cash and cash equivalents. Our interest<br />
expense increased in fiscal 2010 compared with fiscal 2009 primarily due to increased borrowings related to our<br />
acquisition of Wireless Systems in the fourth quarter of fiscal 2009.<br />
Income Taxes<br />
2011 2010<br />
2011/2010<br />
Percent<br />
Increase/<br />
(Decrease) 2009<br />
(Dollars in millions)<br />
2010/2009<br />
Percent<br />
Increase/<br />
(Decrease)<br />
Income from continuing operations before income<br />
taxes. ................................. $880.7 $840.3 4.8% $485.3 73.2%<br />
Income taxes ............................. 293.6 278.7 5.3% 172.9 61.2%<br />
% of income from continuing operations before<br />
income taxes .......................... 33.3% 33.2% 35.6%<br />
Fiscal 2011 Compared With Fiscal 2010: In fiscal 2011, the major discrete item from which our effective tax<br />
rate (income taxes as a percentage of income from continuing operations before income taxes) benefited was a<br />
$5.9 million tax benefit associated with legislative action during the second quarter of fiscal 2011 that restored the<br />
U.S. Federal income tax credit for research and development expenses. In fiscal 2010, the major discrete item from<br />
which our effective tax rate benefited was a $3.5 million state income tax benefit associated with the filing of our<br />
income tax returns. See Note 23: Income Taxes in the Notes for further information.<br />
Fiscal 2010 Compared With Fiscal 2009: In fiscal 2010, the major discrete item from which our effective tax<br />
rate benefited was the $3.5 million state income tax benefit noted above regarding fiscal 2011 compared with fiscal<br />
2010. In fiscal 2009, our effective tax rate was higher than the U.S. statutory income tax rate. The major discrete<br />
items in fiscal 2009 were the non-deductibility of a significant portion of the $255.5 million non-cash charge for<br />
impairment of goodwill and other long-lived assets in our Integrated Network Solutions segment related to<br />
Broadcast and New Media Solutions recorded in the fourth quarter of fiscal 2009, largely offset by: a $3.3 million<br />
tax benefit that we recorded in the second quarter of fiscal 2009 when legislative action restored the U.S. Federal<br />
income tax credit for research and development expenses for fiscal 2008; a $3.7 million state tax benefit in the<br />
second quarter of fiscal 2009 related to the filing of our tax returns; and a $6.5 million favorable impact recorded in<br />
the third quarter of fiscal 2009 from the settlement of the U.S. Federal income tax audit of fiscal year 2007. See<br />
Note 23: Income Taxes in the Notes for further information.<br />
Discussion of Business Segments<br />
RF Communications Segment<br />
2011 2010<br />
2011/2010<br />
Percent<br />
Increase/<br />
(Decrease) 2009<br />
2010/2009<br />
Percent<br />
Increase/<br />
(Decrease)<br />
(Dollars in millions)<br />
Revenue ............................. $2,289.2 $2,067.2 10.7% $1,760.6 17.4%<br />
Segment operating income ............... 787.0 707.4 11.3% 571.5 23.8%<br />
% of revenue ....................... 34.4% 34.2% 32.5%<br />
41
Fiscal 2011 Compared With Fiscal 2010: Revenue in fiscal 2011 included $1,775.4 million in Tactical<br />
Communications and $513.8 million in Public Safety and Professional Communications. Revenue growth and higher<br />
operating income in fiscal 2011 compared with fiscal 2010 were primarily due to strong international sales in<br />
Tactical Communications and continuing Falcon III» adoption to support the DoD’s vision for wideband networking<br />
throughout the battlefield, partially offset by lower revenue from shipments of radios to equip MRAP vehicles.<br />
The increase in operating income as a percentage of revenue in fiscal 2011 compared with fiscal 2010 was<br />
primarily due to higher operating margins on international sales in Tactical Communications and a $19.3 million<br />
charge incurred in fiscal 2010 associated with our acquisition of Wireless Systems in the fourth quarter of fiscal<br />
2009, partially offset by the decrease in high-margin sales of radios to equip MRAP vehicles.<br />
Our new manufacturing facility in Rochester, New York is up and running. The new facility consolidates<br />
multiple facilities into one location, reducing production cycle times and creating operational efficiencies. We now<br />
have a single facility of sufficient size, layout and capabilities to fully implement the lean production processes we<br />
need to further reduce product costs. The new facility is expected to provide cost savings and create a state-of-theart<br />
high-volume manufacturing capability for products across RF Communications.<br />
Orders for this segment were $2.03 billion for fiscal 2011 compared with $2.88 billion for fiscal 2010. Fiscal<br />
2011 orders included $1.30 billion in Tactical Communications and $730 million in Public Safety and Professional<br />
Communications. At the end of the fourth quarter of fiscal 2011, total backlog in our RF Communications segment<br />
was $1.50 billion, including $766 million in Tactical Communications and $737 million in Public Safety and<br />
Professional Communications.<br />
In both fiscal 2011 and fiscal 2010, this segment derived 63 percent of its revenue from U.S. Government<br />
customers, including the DoD and intelligence and civilian agencies, as well as foreign military sales through the<br />
U.S. Government, whether directly or through prime contractors.<br />
Fiscal 2010 Compared With Fiscal 2009: Revenue in fiscal 2010 included $1,573.2 million in Tactical<br />
Communications and $494.0 million in Public Safety and Professional Communications. Revenue growth in fiscal<br />
2010 compared with fiscal 2009 was driven by our acquisition of Wireless Systems in the fourth quarter of fiscal<br />
2009, partially offset by a decline in total tactical radio sales.<br />
In spite of the decline in the total tactical radio market, our tactical radio sales increased in the U.S. market due<br />
to customer adoption of our next-generation Falcon III radios, as well as equipping a significant number of the<br />
U.S. military’s MRAP vehicles and M-ATVs with Falcon II» and Falcon III radios. In the international market, our<br />
tactical radio sales declined in fiscal 2010 compared with fiscal 2009 primarily due to a delay in shipments as a<br />
result of the high priority of the U.S. military’s MRAP vehicle and M-ATV programs. However, international orders<br />
in fiscal 2010 were strong, signaling growing international demand.<br />
The increase in operating income was primarily due to higher operating margins in Tactical Communications<br />
and our acquisition of Wireless Systems. Additionally, we incurred a $19.3 million charge associated with our<br />
acquisition of Wireless Systems in fiscal 2010 compared with $9.5 million in fiscal 2009. The increase in operating<br />
income as a percentage of revenue was primarily driven by favorable product mix as a result of the U.S. military’s<br />
MRAP vehicle and M-ATV programs, cost-reduction actions implemented in the second half of fiscal 2009 and<br />
operational efficiencies.<br />
Orders for this segment were $2.88 billion for fiscal 2010 compared with $1.25 billion for fiscal 2009. Fiscal<br />
2010 orders included $2.34 billion in Tactical Communications and $541 million in Public Safety and Professional<br />
Communications. At the end of the fourth quarter, total backlog in our RF Communications segment was<br />
$1.76 billion, including $1.24 billion in Tactical Communications and $527 million in Public Safety and<br />
Professional Communications.<br />
In both fiscal 2010 and fiscal 2009, this segment derived 63 percent of its revenue from U.S. Government<br />
customers, including the DoD and intelligence and civilian agencies, as well as foreign military sales through the<br />
U.S. Government, whether directly or through prime contractors.<br />
42
Integrated Network Solutions Segment<br />
2011 2010<br />
2011/2010<br />
Percent<br />
Increase/<br />
(Decrease) 2009<br />
2010/2009<br />
Percent<br />
Increase/<br />
(Decrease)<br />
(Dollars in millions)<br />
Revenue ............................. $1,985.8 $1,485.1 33.7% $1,476.1 0.6%<br />
Segment operating income (loss). .......... 70.2 85.3 (17.7)% (133.6) *<br />
% of revenue ....................... 3.5% 5.7% (9.1)%<br />
* Not meaningful<br />
Fiscal 2011 Compared With Fiscal 2010: The increase in revenue in fiscal 2011 compared with 2010 was<br />
primarily due to revenue from CapRock, which we acquired in the first quarter of fiscal 2011, and Schlumberger<br />
GCS, which we acquired in the fourth quarter of fiscal 2011, and strong growth at Broadcast and New Media<br />
Solutions. Integrated Network Solutions operating income and operating income as a percentage of revenue were<br />
lower in fiscal 2011 compared with fiscal 2010, primarily due to the impact of $46.6 million in charges for<br />
integration and other costs associated with our acquisitions of CapRock, Schlumberger GCS, the Core180<br />
Infrastructure and Carefx, accelerated investments in Cyber Integrated Solutions and lower pricing on the IT<br />
Services contract extension for the NMCI program, partially offset by much improved performance in Broadcast and<br />
New Media Solutions. For Cyber Integrated Solutions, due to experiencing a much longer selling cycle than we<br />
previously had expected and the associated impact to revenue and income, we expect an operating loss of<br />
approximately $30 million in fiscal 2012.<br />
On July 30, 2010, we acquired privately held CapRock, a global provider of mission-critical, managed satellite<br />
communications services for the government, energy and maritime industries. CapRock’s solutions include<br />
broadband Internet access, VOIP telephony, wideband networking and real-time video, delivered to nearly 2,000<br />
customer sites around the world. The acquisition of CapRock increased the breadth of our assured communications»<br />
capabilities, while enabling us to enter new vertical markets and increase our international presence. The total net<br />
purchase price for CapRock was $517.5 million. Our fiscal 2011 results of operations included eleven months of<br />
operating results associated with CapRock, representing the period subsequent to the acquisition.<br />
On April 4, 2011, we acquired Schlumberger GCS, a provider of satellite and terrestrial communications<br />
services for the worldwide energy industry. The total net purchase price for Schlumberger GCS was $380.6 million,<br />
subject to post-closing adjustments. Our fiscal 2011 results of operations included three months of operating results<br />
associated with Schlumberger GCS, representing the period subsequent to the acquisition.<br />
On April 4, 2011, we acquired privately held Carefx, a provider of interoperability workflow solutions for<br />
government and commercial healthcare providers. Carefx’s solution suite is used by more than 800 hospitals,<br />
healthcare systems and health information exchanges across North America, Europe and Asia. This acquisition<br />
expanded our presence in government healthcare, provided entry into the commercial healthcare market, and is<br />
expected to leverage the healthcare interoperability workflow products offered by Carefx and the broader scale of<br />
enterprise intelligence solutions and services that we provide. The total net purchase price for Carefx was<br />
$152.6 million, subject to post-closing adjustments. Our fiscal 2011 results of operations included three months of<br />
operating results associated with Carefx, representing the period subsequent to the acquisition.<br />
For further information related to the acquisitions described above, including the allocation of the purchase<br />
price and pro forma results as if the CapRock and Schlumberger GCS acquisitions had taken place as of the<br />
beginning of the periods presented, see Note 4: Business Combinations in the Notes.<br />
Orders for this segment were $2.00 billion for fiscal 2011 compared with $1.51 billion for fiscal 2010. During<br />
fiscal 2011, we were not awarded the recompete for the Patriot program which will result in lower revenue from this<br />
program in fiscal 2012 compared with fiscal 2011. In fiscal 2011 and fiscal 2010, this segment derived 55 percent<br />
and 64 percent, respectively, of its revenue from U.S. Government customers, including the DoD and intelligence<br />
and civilian agencies, as well as foreign military sales through the U.S. Government, whether directly or through<br />
prime contractors.<br />
Fiscal 2010 Compared With Fiscal 2009: The increase in revenue in fiscal 2010 compared with 2009 was<br />
primarily driven by higher Healthcare Solutions revenue, which benefited from our acquisition of Patriot in the<br />
second quarter of fiscal 2010 (as discussed in the next paragraph below), and higher IT Services revenue, driven by<br />
increased revenue on the IT services relocation program for the USSOUTHCOM and the U.S. Air Force<br />
43
NETCENTS program. This revenue growth was mostly offset by a decline in Broadcast and New Media Solutions<br />
revenue, primarily due to continued lower U.S. broadcaster capital spending as well as the completion of the<br />
transition from analog to digital transmission in the U.S. The operating loss in fiscal 2009 was due to a<br />
$255.5 million non-cash charge for impairment of goodwill and other long-lived assets in Broadcast and New Media<br />
Solutions, and included $13.1 million in charges related to cost-reduction actions, also in Broadcast and New Media<br />
Solutions. Operating income in fiscal 2010 included $10 million in charges related to cost-reduction actions and<br />
$6 million in inventory write-downs associated with weaker product demand in Broadcast and New Media Solutions<br />
as a result of continuing weakness in the U.S. broadcast market.<br />
In the second quarter of fiscal 2010, we acquired Patriot, which had about 100 employees and expanded our<br />
position as a leading provider of integrated and interoperable healthcare IT solutions for the U.S. Government<br />
market. Additionally, we believed this acquisition further positioned us for providing a comprehensive solution<br />
addressing the national priority of integrating the VA and Military Health Systems.<br />
Orders for this segment were $1.51 billion for fiscal 2010 compared with $1.42 billion for fiscal 2009. In fiscal<br />
2010 and fiscal 2009, this segment derived 64 percent and 57 percent, respectively, of its revenue from<br />
U.S. Government customers, including the DoD and intelligence and civilian agencies, as well as foreign military<br />
sales through the U.S. Government, whether directly or through prime contractors.<br />
Government Communications Systems Segment<br />
2011 2010<br />
2011/2010<br />
Percent<br />
Increase/<br />
(Decrease) 2009<br />
2010/2009<br />
Percent<br />
Increase/<br />
(Decrease)<br />
(Dollars in millions)<br />
Revenue ............................. $1,776.5 $1,747.3 1.7% $1,864.2 (6.3)%<br />
Segment operating income ............... 227.0 227.4 (0.2)% 199.2 14.2%<br />
% of revenue ....................... 12.8% 13.0% 10.7%<br />
Fiscal 2011 Compared With Fiscal 2010: Revenue in fiscal 2011 compared with fiscal 2010 increased on the<br />
GOES-R Ground and Antenna Segment weather programs for NOAA, HNRs for the U.S. Army and our space<br />
communications programs (including satellite reflector programs for commercial customers), but declined on several<br />
classified programs as a result of slower U.S. Government spending. Revenue also declined, as expected, on the<br />
FDCA program for the 2010 U.S. Census due to its wind-down. Important ongoing programs for this segment<br />
include FTI, GOES-R, F-35, MET, WIN-T and various classified space communications systems programs.<br />
Operating income and income as a percentage of revenue in fiscal 2011 were essentially flat compared with<br />
fiscal 2010. This was primarily due to improved performance on our space communications systems programs<br />
(including satellite reflector programs for commercial customers), the GOES-R Ground and Antenna Segment<br />
weather programs and HNR sales to the U.S. Army, partially offset by the impact of the wind-down on the FDCA<br />
program for the 2010 U.S. Census and lower operating income on several classified programs.<br />
Orders for this segment were $1.69 billion for fiscal 2011 and $1.78 billion for fiscal 2010. In fiscal 2011 and<br />
fiscal 2010, this segment derived 97 percent and 94 percent, respectively, of its revenue from U.S. Government<br />
customers, including the DoD and intelligence and civilian agencies, as well as foreign military sales through the<br />
U.S. Government, whether directly or through prime contractors.<br />
Fiscal 2010 Compared With Fiscal 2009: Revenue in fiscal 2010 compared with fiscal 2009 declined as the<br />
FDCA program for the U.S. Census Bureau for the 2010 U.S. Census neared completion. The $238 million decline<br />
in revenue from the FDCA program in fiscal 2010 was partially offset by increased revenue in fiscal 2010 from the<br />
GOES-R Ground Segment weather program for NOAA, the MET program for the U.S. Army, the FTI program, the<br />
F-35 Joint Strike Fighter program and the WIN-T program.<br />
The increases in operating income and operating income as a percentage of revenue in fiscal 2010 compared<br />
with fiscal 2009 were primarily due to excellent award fees and overall program execution across the segment.<br />
Additionally, operating income in fiscal 2009 included an $18.0 million charge for schedule and cost overruns on<br />
commercial satellite reflector programs.<br />
Orders for this segment were $1.78 billion for fiscal 2010 and $1.88 billion for fiscal 2009. In both fiscal 2010<br />
and fiscal 2009, this segment derived 94 percent of its revenue from U.S. Government customers, including the DoD<br />
and intelligence and civilian agencies, as well as foreign military sales through the U.S. Government, whether<br />
directly or through prime contractors.<br />
44
Unallocated Corporate Expense and Corporate Eliminations<br />
2011 2010<br />
2011/2010<br />
Percent<br />
Increase/<br />
(Decrease) 2009<br />
2010/2009<br />
Percent<br />
Increase/<br />
(Decrease)<br />
(Dollars in millions)<br />
Unallocated corporate expense . .................. $87.8 $90.4 (2.9)% $81.4 11.1%<br />
Corporate eliminations ......................... 26.2 16.9 55.0% 17.7 (4.5)%<br />
Fiscal 2011 Compared With Fiscal 2010: Unallocated corporate expense decreased in fiscal 2011 compared<br />
with fiscal 2010, primarily due to a charge associated with a contract termination, recorded in fiscal 2010, and lower<br />
benefit plan expenses. Corporate eliminations increased in fiscal 2011 from fiscal 2010, primarily due to higher<br />
intersegment activity between the Government Communications Systems and Integrated Network Solutions<br />
segments.<br />
Fiscal 2010 Compared With Fiscal 2009: Unallocated corporate expense increased in fiscal 2010 compared<br />
with fiscal 2009, primarily due to investments made in pursuit of new growth opportunities, increased charitable<br />
contributions and a charge associated with a contract termination.<br />
Discontinued Operations<br />
In the fourth quarter of fiscal 2009, in connection with the May 27, 2009 Spin-off to our shareholders of all the<br />
shares of HSTX common stock owned by us, we eliminated our former HSTX operating segment. Our historical<br />
financial results have been restated to account for HSTX as discontinued operations for all periods presented in this<br />
Report. See Note 3: Discontinued Operations for additional information regarding discontinued operations.<br />
LIQUIDITY, CAPITAL RESOURCES AND FINANCIAL STRATEGIES<br />
Cash Flows<br />
2011<br />
Fiscal Years Ended<br />
2010<br />
(Dollars in millions)<br />
2009<br />
Net cash provided by operating activities ........................ $ 833.1 $ 802.7 $ 666.8<br />
Net cash used in investing activities ............................ (1,417.5) (250.1) (864.6)<br />
Net cash provided by (used in) financing activities ................. 492.8 (380.9) 117.1<br />
Effect of exchange rate changes on cash and cash equivalents ......... 3.3 2.3 (8.1)<br />
Net increase (decrease) in cash and cash equivalents. ............... (88.3) 174.0 (88.8)<br />
Cash and cash equivalents, beginning of year ..................... 455.2 281.2 370.0<br />
Cash and cash equivalents, end of year. ......................... $ 366.9 $ 455.2 $ 281.2<br />
Cash and cash equivalents: Our Consolidated Statement of Cash Flows includes the results of HSTX through<br />
the May 27, 2009 Spin-off date. Accordingly, for fiscal 2009, our Consolidated Statement of Cash Flows, and the<br />
following analysis, includes approximately eleven months of cash flows from HSTX.<br />
The decrease in cash and cash equivalents from fiscal 2010 to fiscal 2011 was primarily due to<br />
$1,082.6 million of cash paid for acquired businesses, $324.9 million of additions of property, plant and equipment<br />
and capitalized software, $256.1 million used to repurchase shares of our common stock, and $127.0 million used to<br />
pay cash dividends, partially offset by $833.1 million of net cash provided by operating activities and $851.4 million<br />
of net proceeds from borrowings.<br />
Our financial position remained strong at July 1, 2011. We ended the fiscal year with cash and cash equivalents<br />
of $366.9 million; we have no long-term debt maturing until fiscal 2016; we have a senior unsecured $750 million<br />
revolving credit facility that expires in September 2013 ($570 million of which was available to us as of July 1,<br />
2011 as a result of $180 million of short-term debt outstanding under our commercial paper program, that was<br />
supported by such senior unsecured revolving credit facility); we have a senior unsecured $300 million 364-day<br />
revolving credit facility that expires on September 28, 2011 (all of which was available to us as of July 1, 2011);<br />
and we do not have any material defined benefit pension plan obligations.<br />
Given our current cash position, outlook for funds generated from operations, credit ratings, available credit<br />
facilities, cash needs and debt structure, we have not experienced to date, and do not expect to experience, any<br />
45
material issues with liquidity, although we can give no assurances concerning our future liquidity, particularly in<br />
light of the state of global commerce and financial uncertainty.<br />
We also currently believe that existing cash, funds generated from operations, our credit facilities and access to<br />
the public and private debt and equity markets will be sufficient to provide for our anticipated working capital<br />
requirements, capital expenditures and share repurchases under our New Repurchase Program for the next<br />
12 months. We anticipate tax payments over the next three years to be approximately equal to our tax expense<br />
during the same period. We anticipate that our fiscal 2012 cash outlays may include strategic acquisitions. Other<br />
than those cash outlays noted in the “Contractual Obligations” discussion below in this MD&A, capital<br />
expenditures, potential acquisitions and share repurchases under our New Repurchase Program, no other significant<br />
cash outlays are anticipated in fiscal 2012.<br />
There can be no assurance, however, that our business will continue to generate cash flow at current levels, that<br />
ongoing operational improvements will be achieved, or that the cost or availability of future borrowings, if any,<br />
under our commercial paper program or our credit facilities or in the debt markets will not be impacted by any<br />
potential future credit and capital markets disruptions. If we are unable to maintain cash balances or generate<br />
sufficient cash flow from operations to service our obligations, we may be required to sell assets, reduce capital<br />
expenditures, reduce or eliminate strategic acquisitions, reduce or terminate our New Repurchase Program, reduce or<br />
eliminate dividends, refinance all or a portion of our existing debt or obtain additional financing. Our ability to<br />
make principal payments or pay interest on or refinance our indebtedness depends on our future performance and<br />
financial results, which, to a certain extent, are subject to general conditions in or affecting the defense, government<br />
and integrated communications and information technology and services markets and to general economic, political,<br />
financial, competitive, legislative and regulatory factors beyond our control.<br />
Net cash provided by operating activities: Our net cash provided by operating activities was $833.1 million<br />
in fiscal 2011 compared with $802.7 million in fiscal 2010. All of our segments had positive cash flow from<br />
operating activities in fiscal 2011, reflecting strong operating income, with a significant contribution received from<br />
our RF Communications segment.<br />
Net cash used in investing activities: Our net cash used in investing activities was $1,417.5 million in fiscal<br />
2011 compared with $250.1 million in fiscal 2010. Net cash used in investing activities in fiscal 2011 was due to<br />
$1,082.6 million of cash paid for acquired businesses, $311.3 million of property, plant and equipment additions,<br />
$13.6 million of capitalized software additions and $10.0 million of cash paid for a cost-method investment. Net<br />
cash used in investing activities in fiscal 2010 was due to $189.9 million of property, plant and equipment additions,<br />
$52.1 million of cash paid for acquired businesses and $8.1 million of capitalized software additions. The increase<br />
in capital expenditures in fiscal 2011 compared with fiscal 2010 is primarily due to the build-out of our Cyber<br />
Integration Center and our new RF Communications manufacturing facility. Our total capital expenditures, including<br />
capitalized software, in fiscal 2012 are expected to be between $265 million and $285 million.<br />
Net cash provided by (used in) financing activities: Our net cash provided by financing activities was<br />
$492.8 million in fiscal 2011 compared with net cash used in financing activities of $380.9 million in fiscal 2010.<br />
Net cash provided by financing activities in fiscal 2011 was due to $851.4 million of net proceeds from borrowings<br />
and $24.5 million of proceeds from the exercise of employee stock options, partially offset by $256.1 million used<br />
to repurchase shares of our common stock and $127.0 million used to pay cash dividends. Net cash used in<br />
financing activities in fiscal 2010 was due to $208.0 million used to repurchase shares of our common stock,<br />
$115.0 million used to pay cash dividends and $76.8 million used for repayment of borrowings, partially offset by<br />
$18.9 million of proceeds from the exercise of employee stock options.<br />
Common Stock Repurchases<br />
During fiscal 2011, we used $250.0 million to repurchase 5,325,690 shares of our common stock under our<br />
repurchase program at an average price per share of $46.94, including commissions. During fiscal 2010, we used<br />
$199.9 million to repurchase 4,779,411 shares of our common stock under our repurchase program at an average<br />
price per share of $41.83, including commissions. In fiscal 2011 and fiscal 2010, $6.1 million and $6.7 million,<br />
respectively, in shares of our common stock were delivered to us or withheld by us to satisfy withholding taxes on<br />
employee share-based awards. In fiscal 2010, we used $1.4 million to repurchase 29,760 shares of our common<br />
stock from our Rabbi Trust. Shares repurchased by us are cancelled and retired.<br />
On July 30, 2011, our Board of Directors approved the $1 billion New Repurchase Program. The New<br />
Repurchase Program replaced our previous share repurchase authorization under the 2009 Repurchase Program,<br />
which had a remaining, unused authorization of approximately $200 million at July 1, 2011. The New Repurchase<br />
Program does not have a stated expiration date. We currently expect to repurchase up to $500 million in shares<br />
46
under the New Repurchase Program by the end of the calendar year 2011. The New Repurchase Program is<br />
expected to result in repurchases well in excess of the dilutive effect of shares issued under our share-based<br />
incentive plans. However, the level of our repurchases depends on a number of factors, including our financial<br />
condition, capital requirements, results of operations, future business prospects and other factors that our Board of<br />
Directors may deem relevant. Share repurchases are expected to be funded with available cash and commercial<br />
paper. Repurchases under the New Repurchase Program may be made through open market purchases, private<br />
transactions, transactions structured through investment banking institutions or any combination thereof. The timing,<br />
volume and nature of share repurchases are subject to market conditions, applicable securities laws and other factors<br />
and are at our discretion and may be suspended or discontinued at any time. Additional information regarding share<br />
repurchases during fiscal 2011 and our Repurchase Programs is set forth above under “Item 5. Market for<br />
Registrant’s Common Equity, Related Stockholder Matters and Issuer Purchases of Equity Securities” of this Report.<br />
Dividends<br />
On July 30, 2011, our Board of Directors increased the quarterly cash dividend rate on our common stock from<br />
$.25 per share to $.28 per share, for an annualized cash dividend rate of $1.12 per share, which was our tenth<br />
consecutive annual increase in our quarterly cash dividend rate. Our annualized cash dividend rate was $1.00 per<br />
share, $.88 per share and $.80 per share in fiscal 2011, 2010 and 2009, respectively. There can be no assurances that<br />
our annualized cash dividend rate will continue to increase. Quarterly cash dividends are typically paid in March,<br />
June, September and December. We currently expect that cash dividends will continue to be paid in the near future,<br />
but we can give no assurances concerning payment of future dividends. The declaration of dividends and the amount<br />
thereof will depend on a number of factors, including our financial condition, capital requirements, results of<br />
operations, future business prospects and other factors that our Board of Directors may deem relevant. Additional<br />
information concerning our dividends is set forth above under “Item 5. Market for Registrant’s Common Equity,<br />
Related Stockholder Matters and Issuer Purchases of Equity Securities” of this Report.<br />
Capital Structure and Resources<br />
364-Day Revolving Credit Agreement: As discussed in Note 11: Credit Arrangements in the Notes, on<br />
September 29, 2010, we entered into a $300 million senior unsecured 364-day revolving credit agreement (“the<br />
“364-Day Revolving Credit Agreement”) with a syndicate of lenders. The 364-Day Revolving Credit Agreement<br />
provides for the extension of credit to us in the form of revolving loans at any time and from time to time during<br />
the term of the 364-Day Revolving Credit Agreement, in an aggregate principal amount at any time outstanding not<br />
to exceed $300 million. Borrowings under the 364-Day Revolving Credit Agreement will be denominated in<br />
U.S. Dollars. The 364-Day Revolving Credit Agreement may be used for working capital and other general<br />
corporate purposes (excluding hostile acquisitions) and may also be used to support any commercial paper that we<br />
may issue.<br />
At our election, borrowings under the 364-Day Revolving Credit Agreement will bear interest either at LIBOR<br />
plus an applicable margin or at the base rate plus an applicable margin. The interest rate margin over LIBOR,<br />
initially set at 1.75 percent, may increase (to a maximum amount of 2.25 percent) or decrease (to a minimum<br />
amount of 1.25 percent) based on changes in ratings for our senior unsecured long-term debt securities (“Senior<br />
Debt Ratings”). The base rate is a fluctuating rate equal to the highest of (i) the federal funds rate plus 0.50 percent,<br />
(ii) SunTrust Bank’s publicly announced prime lending rate for U.S. Dollars or (iii) LIBOR for an interest period of<br />
one month plus 1.00 percent. The interest rate margin over the base rate, initially set at 0.75 percent, may increase<br />
(to a maximum amount of 1.25 percent) or decrease (to a minimum amount of 0.25 percent) based on our Senior<br />
Debt Ratings.<br />
The 364-Day Revolving Credit Agreement contains certain customary covenants similar to the 2008 Credit<br />
Agreement discussed below and described in more detail in Note: 11 Credit Arrangements in the Notes. We were in<br />
compliance with the covenants in the 364-Day Revolving Credit Agreement in fiscal 2011. The 364-Day Revolving<br />
Credit Agreement contains certain events of default similar to the 2008 Credit Agreement discussed below. If an<br />
event of default occurs the lenders may, among other things, terminate their commitments and declare all<br />
outstanding borrowings to be immediately due and payable together with accrued interest and fees. All amounts<br />
borrowed or outstanding under the 364-Day Revolving Credit Agreement are due and mature on September 28,<br />
2011, unless the commitments are terminated earlier either at our request or if certain events of default occur. At<br />
July 1, 2011, we had no borrowings outstanding under the 364-Day Revolving Credit Agreement.<br />
2008 Credit Agreement: On September 10, 2008, we entered into a five-year, senior unsecured revolving<br />
credit agreement (the “2008 Credit Agreement”) with a syndicate of lenders. The 2008 Credit Agreement provides<br />
for the extension of credit to us in the form of revolving loans, including swingline loans, and letters of credit at any<br />
47
time and from time to time during the term of the 2008 Credit Agreement, in an aggregate principal amount at any<br />
time outstanding not to exceed $750 million for both revolving loans and letters of credit, with a sub-limit of<br />
$50 million for swingline loans and $125 million for letters of credit. The 2008 Credit Agreement includes a<br />
provision pursuant to which, from time to time, we may request that the lenders in their discretion increase the<br />
maximum amount of commitments under the 2008 Credit Agreement by an amount not to exceed $500 million.<br />
Only consenting lenders (including new lenders reasonably acceptable to the administrative agent) will participate in<br />
any such increase. In no event will the maximum amount of credit extensions available under the 2008 Credit<br />
Agreement exceed $1.25 billion. The 2008 Credit Agreement may be used for working capital and other general<br />
corporate purposes (excluding hostile acquisitions) and to support any commercial paper that we may issue.<br />
Borrowings under the 2008 Credit Agreement may be denominated in U.S. Dollars, Euros, Sterling and any other<br />
currency acceptable to the administrative agent and the lenders, with a non-U.S. currency sub-limit of $150 million.<br />
We may designate certain wholly owned subsidiaries as borrowers under the 2008 Credit Agreement, and the<br />
obligations of any such subsidiary borrower must be guaranteed by Harris Corporation. We also may designate<br />
certain subsidiaries as unrestricted subsidiaries, which means certain of the covenants and representations in the<br />
2008 Credit Agreement do not apply to such subsidiaries.<br />
At our election, borrowings under the 2008 Credit Agreement denominated in U.S. Dollars will bear interest<br />
either at LIBOR plus an applicable margin or at the base rate plus an applicable margin. The interest rate margin<br />
over LIBOR, initially set at 0.50 percent, may increase (to a maximum amount of 1.725 percent) or decrease (to a<br />
minimum of 0.385 percent) based on our Senior Debt Ratings and on the degree of utilization under the 2008 Credit<br />
Agreement (“Utilization”). The base rate is a fluctuating rate equal to the higher of the federal funds rate plus<br />
0.50 percent or SunTrust Bank’s publicly announced prime lending rate for U.S. Dollars. The interest rate margin<br />
over the base rate is 0.00 percent, but if our Senior Debt Ratings fall to “BB+/Ba1” or below, then the interest rate<br />
margin over the base rate will increase to either 0.225 percent or 0.725 percent based on Utilization. Borrowings<br />
under the 2008 Credit Agreement denominated in a currency other than U.S. Dollars will bear interest at LIBOR<br />
plus the applicable interest rate margin over LIBOR described above. Letter of credit fees are also determined based<br />
on our Senior Debt Ratings and Utilization.<br />
The 2008 Credit Agreement contains certain customary covenants, including covenants limiting: certain liens<br />
on our assets; certain mergers, consolidations or sales of assets; certain sale and leaseback transactions; certain<br />
vendor financing investments; and certain investments in unrestricted subsidiaries. The 2008 Credit Agreement also<br />
requires that we not permit our ratio of consolidated total indebtedness to total capital, each as defined, to be greater<br />
than 0.60 to 1.00 and not permit our ratio of consolidated EBITDA to consolidated net interest expense, each as<br />
defined, to be less than 3.00 to 1.00 (measured on the last day of each fiscal quarter for the rolling four-quarter<br />
period then ending). We were in compliance with the covenants in the 2008 Credit Agreement in fiscal 2011. The<br />
2008 Credit Agreement contains certain events of default, including: failure to make payments; failure to perform or<br />
observe terms, covenants and agreements; material inaccuracy of any representation or warranty; payment default<br />
under other indebtedness with a principal amount in excess of $75 million, other default under such other<br />
indebtedness that permits acceleration of such indebtedness, or acceleration of such other indebtedness; occurrence<br />
of one or more final judgments or orders for the payment of money in excess of $75 million that remain unsatisfied;<br />
incurrence of certain ERISA liability in excess of $75 million; any bankruptcy or insolvency; or a change of control,<br />
including if a person or group becomes the beneficial owner of 25 percent or more of our voting stock. If an event<br />
of default occurs the lenders may, among other things, terminate their commitments and declare all outstanding<br />
borrowings to be immediately due and payable together with accrued interest and fees. All amounts borrowed or<br />
outstanding under the 2008 Credit Agreement are due and mature on September 10, 2013, unless the commitments<br />
are terminated earlier either at our request or if certain events of default occur. At July 1, 2011, we had no<br />
borrowings outstanding under the 2008 Credit Agreement, but we had $180.0 million of short-term debt outstanding<br />
under our commercial paper program that was supported by our senior unsecured revolving credit facility under the<br />
2008 Credit Agreement.<br />
Long-Term Debt: As discussed in Note 13: Long-Term Debt in the Notes, on December 3, 2010, we<br />
completed the issuance of $400 million in aggregate principal amount of 4.4% Notes due December 15, 2020 (the<br />
“2020 Notes”) and $300 million in aggregate principal amount of 6.15% Notes due December 15, 2040 (the “2040<br />
Notes”). Interest on each of the 2020 Notes and the 2040 Notes is payable semi-annually in arrears on June 15 and<br />
December 15 of each year. We may redeem the 2020 Notes and/or the 2040 Notes at any time in whole or, from<br />
time to time, in part at the applicable “make-whole” redemption price. The applicable “make-whole” redemption<br />
price is equal to the greater of 100 percent of the principal amount of the notes being redeemed or the sum of the<br />
present values of the remaining scheduled payments of the principal and interest (other than interest accruing to the<br />
date of redemption) on the notes being redeemed, discounted to the redemption date on a semi-annual basis<br />
48
(assuming a 360-day year consisting of twelve 30-day months) at the Treasury Rate, as defined, plus 25 basis points<br />
in the case of the 2020 Notes and 35 basis points in the case of the 2040 Notes. In each case, we will pay accrued<br />
interest on the principal amount of the notes being redeemed to the redemption date. In addition, upon a change of<br />
control combined with a below-investment-grade rating event, we may be required to make an offer to repurchase<br />
the notes at a price equal to 101 percent of the aggregate principal amount of the notes repurchased, plus accrued<br />
interest on the notes repurchased to the date of repurchase. We incurred $5.5 million and $4.8 million in debt<br />
issuance costs and discounts related to the issuance of the 2020 Notes and 2040 Notes, respectively, which are being<br />
amortized on a straight-line basis over the respective lives of the notes, which approximates the effective interest<br />
rate method, and are reflected as a portion of interest expense in our Consolidated Statement of Income.<br />
On June 9, 2009, we completed the issuance of $350 million in aggregate principal amount of 6.375% Notes<br />
due June 15, 2019. Interest on the notes is payable on June 15 and December 15 of each year. We may redeem the<br />
notes at any time in whole or, from time to time, in part at the “make-whole” redemption price. The “make-whole”<br />
redemption price is equal to the greater of 100 percent of the principal amount of the notes being redeemed or the<br />
sum of the present values of the remaining scheduled payments of the principal and interest (other than interest<br />
accruing to the date of redemption) on the notes being redeemed, discounted to the redemption date on a semiannual<br />
basis (assuming a 360-day year consisting of twelve 30-day months) at the Treasury Rate, as defined, plus<br />
37.5 basis points. In each case, we will pay accrued interest on the principal amount of the notes being redeemed to<br />
the redemption date. In addition, upon a change of control combined with a below-investment-grade rating event, we<br />
may be required to make an offer to repurchase the notes at a price equal to 101 percent of the aggregate principal<br />
amount of the notes repurchased, plus accrued interest on the notes repurchased to the date of repurchase. We<br />
incurred $4.1 million in debt issuance costs and discounts related to the issuance of the notes, which are being<br />
amortized on a straight-line basis over the life of the notes, which approximates the effective interest rate method,<br />
and are reflected as a portion of interest expense in our Consolidated Statement of Income.<br />
On December 5, 2007, we completed the issuance of $400 million in aggregate principal amount of<br />
5.95% Notes due December 1, 2017. Interest on the notes is payable on June 1 and December 1 of each year. We<br />
may redeem the notes at any time in whole or, from time to time, in part at the “make-whole” redemption price.<br />
The “make-whole” redemption price is equal to the greater of 100 percent of the principal amount of the notes<br />
being redeemed or the sum of the present values of the remaining scheduled payments of the principal and interest<br />
(other than interest accruing to the date of redemption) on the notes being redeemed, discounted to the redemption<br />
date on a semi-annual basis (assuming a 360-day year consisting of twelve 30-day months) at the Treasury Rate, as<br />
defined, plus 30 basis points. In each case, we will pay accrued interest on the principal amount of the notes being<br />
redeemed to the redemption date. In addition, upon a change of control combined with a below-investment-grade<br />
rating event, we may be required to make an offer to repurchase the notes at a price equal to 101 percent of the<br />
aggregate principal amount of the notes repurchased, plus accrued interest on the notes repurchased to the date of<br />
repurchase. In conjunction with the issuance of the notes, we entered into treasury lock agreements to protect<br />
against fluctuations in forecasted interest payments resulting from the issuance of ten-year, fixed-rate debt due to<br />
changes in the benchmark U.S. Treasury rate. These agreements were determined to be highly effective in offsetting<br />
changes in forecasted interest payments as a result of changes in the benchmark U.S. Treasury rate. Upon<br />
termination of these agreements on December 6, 2007, we recorded a loss of $5.5 million, net of income tax, in<br />
shareholders’ equity as a component of accumulated other comprehensive income. This loss, along with $5.0 million<br />
in debt issuance costs, is being amortized on a straight-line basis over the life of the notes, which approximates the<br />
effective interest rate method, and is reflected as a portion of interest expense in our Consolidated Statement of<br />
Income.<br />
On September 20, 2005, we completed the issuance of $300 million in aggregate principal amount of 5% Notes<br />
due October 1, 2015. Interest on the notes is payable on April 1 and October 1 of each year. We may redeem the<br />
notes in whole, or in part, at any time at the “make-whole” redemption price. The “make-whole” redemption price<br />
is equal to the greater of 100 percent of the principal amount of the notes being redeemed or the sum of the present<br />
values of the remaining scheduled payments of the principal and interest (other than interest accruing to the date of<br />
redemption) on the notes being redeemed, discounted to the redemption date on a semi-annual basis (assuming a<br />
360-day year consisting of twelve 30-day months) at the Treasury Rate, as defined, plus 15 basis points. In each<br />
case, we will pay accrued interest on the principal amount of the notes being redeemed to the redemption date. We<br />
incurred $4.1 million in debt issuance costs and discounts related to the issuance of the notes, which are being<br />
amortized on a straight-line basis over a ten-year period and reflected as a portion of interest expense in our<br />
Consolidated Statement of Income.<br />
In February 1998, we completed the issuance of $150 million in aggregate principal amount of<br />
6.35% Debentures due February 1, 2028. On December 5, 2007, we repurchased and retired $25.0 million in<br />
49
aggregate principal amount of the debentures. On February 1, 2008, we redeemed $99.2 million in aggregate<br />
principal amount of the debentures pursuant to the procedures for redemption at the option of the holders of the<br />
debentures. We may redeem the remaining $25.8 million in aggregate principal amount of the debentures in whole,<br />
or in part, at any time at a pre-determined redemption price.<br />
In January 1996, we completed the issuance of $100 million in aggregate principal amount of 7% Debentures<br />
due January 15, 2026. The debentures are not redeemable prior to maturity.<br />
Short-Term Debt: Our short-term debt at July 1, 2011, April 1, 2011, December 31, 2010, October 1, 2010<br />
and July 2, 2010 was $180.0 million, $180.0 million, $30.0 million, $275.0 million and $30.0 million, respectively,<br />
and consisted primarily of commercial paper outstanding under our commercial paper program that was supported<br />
by our senior unsecured revolving credit facility under the 2008 Credit Agreement. During the first quarter of fiscal<br />
2011, we issued approximately $320 million of commercial paper to fund a portion of the purchase price for our<br />
acquisition of CapRock. During the second quarter of fiscal 2011, we used approximately $285 million of the net<br />
proceeds from the sale of the 2020 Notes and 2040 Notes for repayment of a substantial portion of our outstanding<br />
commercial paper. During the third quarter of fiscal 2011, we issued $150 million of commercial paper to fund a<br />
portion of the purchase price for our pending acquisitions of Schlumberger GCS and Carefx, both of which we<br />
completed on April 4, 2011, the first business day of the fourth quarter of fiscal 2011.<br />
Other: We have an automatically effective, universal shelf registration statement, filed with the SEC on<br />
June 3, 2009, related to the potential future issuance of an indeterminate amount of securities, including debt<br />
securities, preferred stock, common stock, fractional interests in preferred stock represented by depositary shares and<br />
warrants to purchase debt securities, preferred stock or common stock.<br />
We expect to maintain operating ratios, fixed-charge coverage ratios and balance sheet ratios sufficient for<br />
retention of, or improvement to, our current debt ratings. There are no assurances that our debt ratings will not be<br />
reduced in the future. If our debt ratings are lowered below “investment grade,” then we may not be able to issue<br />
short-term commercial paper, but may instead need to borrow under our credit facilities or pursue other options. In<br />
addition, if our debt ratings are lowered below “investment grade,” then we may also be required to provide cash<br />
collateral to support outstanding performance bonds. For a discussion of such performance bonds, see the<br />
“Commercial Commitments” discussion below. We do not currently foresee losing our investment-grade debt<br />
ratings, but no assurances can be given. If our debt ratings were downgraded, however, it could adversely impact,<br />
among other things, our future borrowing costs and access to capital markets and our ability to receive certain types<br />
of contract awards.<br />
Contractual Obligations<br />
At July 1, 2011, we had contractual cash obligations to repay debt, to purchase goods and services and to make<br />
payments under operating leases. Payments due under these long-term obligations are as follows:<br />
Total 2012<br />
Obligations Due by Fiscal Year<br />
(Dollars in millions)<br />
Long-term debt. .......................... $1,892.1 $ 4.9 $ 11.4 $300.0 $1,575.8<br />
Purchase obligations (1),(2),(3)<br />
................. 1,240.1 1,046.8 168.9 23.8 0.6<br />
Operating lease commitments ................ 223.2 51.0 71.3 43.3 57.6<br />
Interest on long-term debt ................... 1,231.1 105.8 211.6 200.3 713.4<br />
Total contractual cash obligations ............. $4,586.5 $1,208.5 $463.2 $567.4 $2,347.4<br />
(1) Amounts do not include pension contributions and payments for various welfare and benefit plans because such amounts had not been<br />
determined beyond fiscal 2011.<br />
(2) The purchase obligations of $1,240.1 million included $313.8 million of purchase obligations related to our Government Communications<br />
Systems segment, which were fully funded under contracts with the U.S. Government, and $85.3 million of these purchase obligations related<br />
to cost-plus type contracts where our costs were fully reimbursable.<br />
(3) Amounts do not include unrecognized tax benefits of $48.4 million.<br />
50<br />
2013<br />
and<br />
2014<br />
2015<br />
and<br />
2016<br />
After<br />
2016
Off-Balance Sheet Arrangements<br />
In accordance with the definition under SEC rules, any of the following qualify as off-balance sheet<br />
arrangements:<br />
• Any obligation under certain guarantee contracts;<br />
• A retained or contingent interest in assets transferred to an unconsolidated entity or similar entity or similar<br />
arrangement that serves as credit, liquidity or market risk support to that entity for such assets;<br />
• Any obligation, including a contingent obligation, under certain derivative instruments; and<br />
• Any obligation, including a contingent obligation, under a material variable interest held by the registrant in<br />
an unconsolidated entity that provides financing, liquidity, market risk or credit risk support to the registrant,<br />
or engages in leasing, hedging or research and development services with the registrant.<br />
Currently we are not participating in transactions that generate relationships with unconsolidated entities or<br />
financial partnerships, including variable interest entities, and we do not have any material retained or contingent<br />
interest in assets as defined above. As of July 1, 2011, we did not have material financial guarantees or other<br />
contractual commitments that are reasonably likely to adversely affect our results of operations, financial condition<br />
or cash flows. In addition, we are not currently a party to any related party transactions that materially affect our<br />
results of operations, financial condition or cash flows.<br />
We have, from time to time, divested certain of our businesses and assets. In connection with these divestitures,<br />
we often provide representations, warranties and/or indemnities to cover various risks and unknown liabilities, such<br />
as environmental liabilities and tax liabilities. We cannot estimate the potential liability from such representations,<br />
warranties and indemnities because they relate to unknown conditions. We do not believe, however, that the<br />
liabilities relating to these representations, warranties and indemnities will have a material adverse effect on our<br />
results of operations, financial condition or cash flows.<br />
Due to our downsizing of certain operations pursuant to acquisitions, restructuring plans or otherwise, certain<br />
properties leased by us have been sublet to third parties. In the event any of these third parties vacates any of these<br />
premises, we would be legally obligated under master lease arrangements. We believe that the financial risk of<br />
default by such sublessees is individually and in the aggregate not material to our results of operations, financial<br />
position or cash flows.<br />
Commercial Commitments<br />
We have entered into commercial commitments in the normal course of business including surety bonds,<br />
standby letter of credit agreements and other arrangements with financial institutions and customers primarily<br />
relating to the guarantee of future performance on certain contracts to provide products and services to customers or<br />
to obtain insurance policies with our insurance carriers. At July 1, 2011, we had commercial commitments on<br />
outstanding surety bonds, standby letters of credit and other arrangements, as follows:<br />
Expiration of Commitments<br />
by Fiscal Year<br />
After<br />
Total 2012 2013 2014 2014<br />
(Dollars in millions)<br />
Standby letters of credit used for:<br />
Bids ......................................... $ 9.7 $ 9.7 $ — $— $—<br />
Down payments ................................. 8.4 8.2 0.2 —<br />
Performance ................................... 32.1 22.1 7.8 2.0 0.2<br />
Warranty ...................................... 11.5 8.9 2.4 0.2 —<br />
Surety bonds used for:<br />
61.7 48.9 10.4 2.2 0.2<br />
Bids ......................................... 125.9 125.9 — — —<br />
Performance ................................... 552.7 552.6 0.1 — —<br />
678.6 678.5 0.1 — —<br />
Total commitments ................................ $740.3 $727.4 $10.5 $2.2 $0.2<br />
The standby letters of credit and surety bonds used for performance are primarily related to Public Safety and<br />
Professional Communications, and the total commitments in the table above have increased from commitments<br />
outstanding as of the end of fiscal 2010, primarily due to growth in Public Safety and Professional Communications<br />
51
during fiscal 2011. As is customary in bidding for and completing network infrastructure projects for public safety<br />
systems, contractors are required to procure performance/bid bonds, standby letters of credit and surety bonds<br />
(collectively, “Performance Bonds”). Such Performance Bonds normally have maturities of up to three years and are<br />
standard in the industry as a way to provide customers a mechanism to seek redress if a contractor does not satisfy<br />
performance requirements under a contract. A customer is permitted to draw on a Performance Bond if we do not<br />
fulfill all terms of a project contract. In such an event, we would be obligated to reimburse the financial institution<br />
that issued the Performance Bond for the amounts paid. It has been rare for our Public Safety and Professional<br />
Communications business and its predecessors to have a Performance Bond drawn upon. In addition, pursuant to the<br />
terms under which we procure Performance Bonds, if our credit ratings are lowered below “investment grade,” then<br />
we may be required to provide collateral to support a portion of the outstanding amount of Performance Bonds.<br />
Such a downgrade could increase the cost of the issuance of Performance Bonds and could make it more difficult to<br />
procure Performance Bonds, which would adversely impact our ability to compete for contract awards. Such<br />
collateral requirements could also result in less liquidity for other operational needs or corporate purposes.<br />
Financial Risk Management<br />
In the normal course of doing business, we are exposed to the risks associated with foreign currency exchange<br />
rates and changes in interest rates. We employ established policies and procedures governing the use of financial<br />
instruments to manage our exposure to such risks.<br />
Foreign Exchange and Currency: We use foreign currency forward contracts and options to hedge both<br />
balance sheet and off-balance sheet future foreign currency commitments. Factors that could impact the<br />
effectiveness of our hedging programs for foreign currency include accuracy of sales estimates, volatility of currency<br />
markets and the cost and availability of hedging instruments. A 10 percent change in currency exchange rates for<br />
our foreign currency derivatives held at July 1, 2011 would not have had a material impact on the fair value of such<br />
instruments. This quantification of exposure to the market risk associated with foreign exchange financial<br />
instruments does not take into account the offsetting impact of changes in the fair value of our foreign denominated<br />
assets, liabilities and firm commitments. See Note 19: Derivative Instruments and Hedging Activities in the Notes<br />
for additional information.<br />
Interest Rates: As of July 1, 2011, we had long-term debt obligations and short-term debt under our<br />
commercial paper program subject to interest rate risk. Because the interest rates on our long-term debt obligations<br />
are fixed, and because our long-term debt is not putable (redeemable at the option of the holders of the debt prior to<br />
maturity), the interest rate risk associated with this debt on our results of operations is not material. We have a<br />
short-term variable-rate commercial paper program in place, which we may utilize to satisfy short-term cash<br />
requirements. We can give no assurances that interest rates will not change significantly or have a material effect on<br />
our income or cash flows in fiscal 2012.<br />
Impact of Foreign Exchange<br />
Approximately 33 percent of our international business was transacted in local currency environments in fiscal<br />
2011 compared with 41 percent in fiscal 2010. The impact of translating the assets and liabilities of these operations<br />
to U.S. dollars is included as a component of shareholders’ equity. As of July 1, 2011, the cumulative translation<br />
adjustment included in shareholders’ equity was a $50.8 million gain compared with a $14.3 million gain at July 2,<br />
2010. We utilize foreign currency hedging instruments to minimize the currency risk of international transactions.<br />
Gains and losses resulting from currency rate fluctuations did not have a material effect on our results in fiscal<br />
2011, 2010 or 2009.<br />
Impact of Inflation<br />
To the extent feasible, we have consistently followed the practice of adjusting our prices to reflect the impact<br />
of inflation on salaries and fringe benefits for employees and the cost of purchased materials and services. Inflation<br />
and changing prices did not materially adversely impact our gross margin, revenue or operating income in fiscal<br />
2011, 2010 or 2009.<br />
CRITICAL ACCOUNTING POLICIES AND ESTIMATES<br />
The following is not intended to be a comprehensive list of all of our accounting policies or estimates. Our<br />
significant accounting policies are more fully described in Note 1: Significant Accounting Policies in the Notes. In<br />
preparing our financial statements and accounting for the underlying transactions and balances, we apply our<br />
accounting policies and estimates as disclosed in the Notes. We consider the policies and estimates discussed below<br />
as critical to an understanding of our financial statements because their application places the most significant<br />
52
demands on our judgment, with financial reporting results dependent upon estimates about the effect of matters that<br />
are inherently uncertain and may change in subsequent periods. Specific risks for these critical accounting estimates<br />
are described in the following paragraphs. The impact and any associated risks related to these estimates on our<br />
business operations are discussed throughout this MD&A where such estimates affect our reported and expected<br />
financial results. Senior management has discussed the development and selection of the critical accounting policies<br />
and estimates and the related disclosure included herein with the Audit Committee of our Board of Directors.<br />
Preparation of this Report requires us to make estimates and assumptions that affect the reported amount of assets<br />
and liabilities, disclosure of contingent assets and liabilities at the date of our financial statements and the reported<br />
amounts of revenue and expenses during the reporting period. Actual results may differ from those estimates.<br />
Besides estimates that meet the “critical” accounting estimate criteria, we make many other accounting<br />
estimates in preparing our financial statements and related disclosures. All estimates, whether or not deemed critical,<br />
affect reported amounts of assets, liabilities, revenue and expenses as well as disclosures of contingent assets and<br />
liabilities. Estimates are based on experience and other information available prior to the issuance of the financial<br />
statements. Materially different results can occur as circumstances change and additional information becomes<br />
known, including for estimates that we do not deem “critical.”<br />
Revenue Recognition on Development and Production Contracts and Contract Estimates<br />
A significant portion of our business is derived from development and production contracts. Revenue related to<br />
development and production contracts is recorded using the percentage-of-completion method generally measured by<br />
the costs incurred on each contract to date against estimated total contract costs at completion (“cost-to-cost”) with<br />
consideration given for risk of performance and estimated profit. Revenue in our Government Communications<br />
Systems segment primarily relates to development and production contracts and the percentage-of-completion<br />
method of revenue recognition is primarily used for these contracts. Amounts representing development and<br />
production contract change orders, claims or other items that may change the scope of a development and<br />
production contract are included in revenue only when they can be reliably estimated and realization is probable.<br />
Incentives or penalties and award fees applicable to performance on development and production contracts are<br />
considered in estimating sales and profit rates, and are recorded when there is sufficient information to assess<br />
anticipated contract performance. Incentive provisions, which increase earnings based solely on a single significant<br />
event, are generally not recognized until the event occurs. Our development and production contracts are generally<br />
not segmented. If development and production contracts are segmented, we have determined that they meet the<br />
segmenting criteria outlined in the accounting standard for construction-type and production-type contracts.<br />
Under the percentage-of-completion method of accounting, a single estimated total profit margin is used to<br />
recognize profit for each development and production contract over its entire period of performance. Recognition of<br />
profit on development and production fixed-price contracts requires estimates of: the contract value or total contract<br />
revenue, the total cost at completion and the measurement of progress toward completion. The estimated profit or<br />
loss on a development and production contract is equal to the difference between the estimated contract value and<br />
the estimated total cost at completion. Due to the long-term nature of many of our programs, developing the<br />
estimated total cost at completion often requires significant judgment. Factors that must be considered in estimating<br />
the work to be completed include labor productivity and availability of labor, the nature and complexity of the work<br />
to be performed, availability and cost of materials, subcontractor performance, the impact of delayed performance,<br />
availability and timing of funding from the customer and the recoverability of claims outside the original<br />
development and production contract included in the estimate to complete. We review cost performance and<br />
estimates to complete on our ongoing development and production contracts at least quarterly and, in many cases,<br />
more frequently. If a change in estimated cost to complete a development and production contract is determined to<br />
have an impact on contract earnings, we will record a positive or negative adjustment to estimated earnings when<br />
identified. Revenue and profits on a cost-reimbursable development and production contract are recognized when<br />
allowable costs are incurred in an amount equal to the allowable costs plus the profit on those costs. These profits<br />
may be at a fixed or variable percentage of allowable costs, depending on the contract fee arrangement. Thus, costreimbursable<br />
development and production contracts generally are not subject to the same estimation risks that affect<br />
fixed-price development and production contracts. We have not made any material changes in the methodologies<br />
used to recognize revenue on development and production contracts or to estimate our costs related to development<br />
and production contracts in the past three fiscal years.<br />
As of July 1, 2011, the amount of unbilled costs and accrued earnings on fixed-price development and<br />
production contracts classified as “Inventory” in our Consolidated Balance Sheet was $381.0 million compared with<br />
$295.3 million as of July 2, 2010. These amounts include gross costs and accrued income, which is netted against<br />
billings and progress payments. A significant change in an estimate on one or more programs could have a material<br />
53
effect on our statement of financial position and results of operations. For example, a one percent variance in our<br />
estimate of accrued income booked as of July 1, 2011 on all open fixed-price development and production contracts<br />
would impact our pre-tax income and our revenue from product sales and services by $17.5 million.<br />
Provisions for Excess and Obsolete Inventory Losses<br />
We value our inventory at the lower of cost or market. We balance the need to maintain prudent inventory<br />
levels to ensure competitive delivery performance with the risk of excess or obsolete inventory due to changing<br />
technology and customer requirements. We regularly review inventory quantities on hand and record a provision for<br />
excess and obsolete inventory primarily based on our estimated forecast of product demand, anticipated end of<br />
product life and production requirements. The review of excess and obsolete inventory applies to all of our business<br />
segments. Several factors may influence the sale and use of our inventories, including our decision to exit a product<br />
line, technological change and new product development. These factors could result in a change in the amount of<br />
obsolete inventory quantities on hand. Additionally, our estimates of future product demand may prove to be<br />
inaccurate, in which case we may have understated or overstated the provision required for excess and obsolete<br />
inventory. In the future, if we determine that our inventory is overvalued, we would be required to recognize such<br />
costs in the “Cost of product sales” line item in our Consolidated Statement of Income at the time of such<br />
determination. In the case of goods which have been written down below cost, such reduced amount is to be<br />
considered the cost for subsequent accounting purposes. We have not made any material changes in the reserve<br />
methodology used to establish our inventory loss reserves during the past three fiscal years.<br />
As of July 1, 2011, our reserve for excess and obsolete inventory was $84.8 million, or 20.0 percent of our<br />
gross inventory balance, which compares with our reserve of $85.9 million, or 21.2 percent of our gross inventory<br />
balance, as of July 2, 2010. We recorded $38.8 million, $20.8 million and $8.6 million in inventory write-downs that<br />
either reduced our reserve for excess and obsolete inventory or our income from continuing operations before<br />
income taxes during fiscal 2011, 2010 and 2009, respectively. Although we make every reasonable effort to ensure<br />
the accuracy of our forecasts of future product demand, including the impact of planned future product launches,<br />
any significant unanticipated changes in demand or technological developments could have a significant impact on<br />
the value of our inventory and our reported operating results.<br />
Goodwill<br />
Goodwill in our Consolidated Balance Sheet as of July 1, 2011 and July 2, 2010 was $2,381.4 million and<br />
$1,576.2 million, respectively. Goodwill is not amortized. We perform annual (or under certain circumstances, more<br />
frequent) impairment tests of our goodwill. We test goodwill for impairment using a two-step process. The first step<br />
is to identify potential impairment by comparing the fair value of each of our reporting units with its net book<br />
value, including goodwill, adjusted for allocations of corporate assets and liabilities as appropriate. If the fair value<br />
of a reporting unit exceeds its adjusted net book value, goodwill of the reporting unit is considered not impaired and<br />
the second step of the impairment test is unnecessary. If the adjusted net book value of a reporting unit exceeds its<br />
fair value, the second step of the goodwill impairment test compares the implied fair value of the reporting unit’s<br />
goodwill with the carrying amount of that goodwill. If the carrying amount of the reporting unit’s goodwill exceeds<br />
the implied fair value of that goodwill, an impairment loss is recognized in an amount equal to that excess. The<br />
implied fair value of goodwill is determined in the same manner as the amount of goodwill recognized in a business<br />
combination. The fair value of the reporting unit is allocated to all of the assets and liabilities of that unit, including<br />
any unrecognized intangible assets, as if the reporting unit had been acquired in a business combination and the fair<br />
value of the reporting unit was the purchase price paid to acquire the reporting unit.<br />
We estimate fair values of our reporting units based on projected cash flows, and sales and/or earnings<br />
multiples applied to the latest twelve months’ sales and earnings of our reporting units. Projected cash flows are<br />
based on our best estimate of future sales, operating costs and balance sheet metrics reflecting our view of the<br />
financial and market conditions of the underlying business; and the resulting cash flows are discounted using an<br />
appropriate discount rate which reflects the risk in the forecasted cash flows. The sales and earnings multiples<br />
applied to the sales and earnings of our reporting units are based on current multiples of sales and earnings for<br />
similar businesses, and based on sales and earnings multiples paid for recent acquisitions of similar businesses made<br />
in the marketplace. We then assess whether any implied control premium, based on a comparison of fair value based<br />
purely on our stock price and outstanding shares with fair value determined by using all of the above-described<br />
models, is reasonable. We have not made any material changes during the past three fiscal years in the methodology<br />
used in the assessment of whether or not goodwill is impaired.<br />
54
Fiscal 2009 Impairment Tests<br />
In the fourth quarter of fiscal 2009, we performed our fiscal 2009 annual impairment tests of our reporting<br />
units’ goodwill. Because of the global recession and postponement of capital projects, which significantly weakened<br />
demand, and the general decline of peer company valuations impacting our valuation, we determined that goodwill<br />
in our Broadcast and New Media Solutions reporting unit (formerly a separate reportable segment and which,<br />
effective for the third quarter of fiscal 2011, is reported under our Integrated Network Solutions segment) was<br />
impaired. As a result, we recorded a $160.9 million non-cash charge for the impairment of goodwill. See Note 8:<br />
Goodwill and Note 22: Impairment of Goodwill and Other Long-Lived Assets for additional information regarding<br />
goodwill, including impairment of Broadcast and New Media Solutions’ goodwill. In fiscal 2009, we also<br />
determined that goodwill in our former HSTX segment was impaired. See Note 3: Discontinued Operations for<br />
additional information regarding impairment of HSTX’s goodwill.<br />
Fiscal 2010 and 2011 Impairment Tests<br />
In the fourth quarter of fiscal 2010 and 2011, we performed our annual impairment tests of our reporting units’<br />
goodwill. We completed these tests with no adjustment required to the goodwill of any of our reporting units.<br />
For all of our reporting units except for Broadcast and New Media Solutions, the fair value determination<br />
resulted in an amount that exceeded the reporting unit’s adjusted net book value by a substantial margin.<br />
For our Broadcast and New Media Solutions reporting unit, the fair value determination resulted in an amount<br />
that exceeded the adjusted net book value of this reporting unit by approximately 12 percent in 2011 and 8 percent<br />
in 2010. Goodwill allocated to this reporting unit as of July 1, 2011 and July 2, 2010 was $673.8 million and<br />
$661.2 million, respectively. When comparing the results from the fair value determination of this reporting unit in<br />
fiscal 2011 with the results from fiscal 2010, an increase in the fair value based on sales multiples paid for recent<br />
acquisitions of similar businesses and current sales multiples of similar businesses was partially offset by a slight<br />
decrease in fair value based on projected cash flows.<br />
Key assumptions used in projecting cash flows included estimates of future sales, operating costs and balance<br />
sheet metrics based on our intermediate and long-term views of the financial and market conditions of the<br />
underlying business. These assumptions assume a continuation of the rebound in capital spending by our customers<br />
based on continuing global economic growth; successful implementation of several strategic growth initiatives,<br />
including redeployment of resources into new media and international markets, where we believe there are<br />
significant new business opportunities; and favorable impacts from cost-reduction actions taken in the current and<br />
prior fiscal years. Events that could have a detrimental impact to the fair value of this reporting unit in the future<br />
include less than forecasted global economic growth, less than forecasted demand for our products (for example, a<br />
slower or less widely than anticipated migration from analog to digital broadcasting in international markets), and<br />
poor execution of our growth strategies. Additionally, slower global economic growth could negatively impact fair<br />
value based on sales multiples of similar business and sales multiples paid for acquisitions of similar businesses.<br />
Income Taxes and Tax Valuation Allowances<br />
We record the estimated future tax effects of temporary differences between the tax basis of assets and<br />
liabilities and amounts reported in our Consolidated Balance Sheet, as well as operating loss and tax credit<br />
carryforwards. We follow very specific and detailed guidelines in each tax jurisdiction regarding the recoverability<br />
of any tax assets recorded on the balance sheet and provide necessary valuation allowances as required. Future<br />
realization of deferred tax assets ultimately depends on the existence of sufficient taxable income of the appropriate<br />
character (for example, ordinary income or capital gain) within the carryback or carryforward periods available<br />
under the tax law. We regularly review our deferred tax assets for recoverability based on historical taxable income,<br />
projected future taxable income, the expected timing of the reversals of existing temporary differences and tax<br />
planning strategies. We have not made any material changes in the methodologies used to determine our tax<br />
valuation allowances during the past three fiscal years.<br />
Our Consolidated Balance Sheet as of July 1, 2011 included a current deferred tax asset of $171.0 million and<br />
a non-current deferred tax asset of $5.7 million. This compares with a current deferred tax asset of $145.3 million<br />
and a non-current deferred tax asset of $107.7 million as of July 2, 2010. The increase in the current deferred tax<br />
balances and the decrease in non-current deferred tax balances were primarily due to acquisitions. For all<br />
jurisdictions for which we have net deferred tax assets, we expect that our existing levels of pre-tax earnings are<br />
sufficient to generate the amount of future taxable income needed to realize these tax assets. Our valuation<br />
allowance related to deferred income taxes, which is reflected in our Consolidated Balance Sheet, was $88.7 million<br />
as of July 1, 2011 and $80.3 million as of July 2, 2010. Although we make reasonable efforts to ensure the accuracy<br />
of our deferred tax assets, if we continue to operate at a loss in certain jurisdictions or are unable to generate<br />
55
sufficient future taxable income, or if there is a material change in the actual effective tax rates or time period<br />
within which the underlying temporary differences become taxable or deductible, or if the potential impact of tax<br />
planning strategies changes, we could be required to increase the valuation allowance against all or a significant<br />
portion of our deferred tax assets resulting in a substantial increase in our effective tax rate and a material adverse<br />
impact on our operating results.<br />
Impact of Recently Issued Accounting Pronouncements<br />
Accounting pronouncements that have recently been issued but have not yet been implemented by us are<br />
described in Note 2: Accounting Changes or Recent Accounting Pronouncements in the Notes, which describes the<br />
potential impact that these pronouncements are expected to have on our financial condition, results of operations and<br />
cash flows.<br />
FORWARD-LOOKING STATEMENTS AND FACTORS THAT MAY AFFECT FUTURE RESULTS<br />
The following are some of the factors we believe could cause our actual results to differ materially from our<br />
historical results or our current expectations or projections. Other factors besides those listed here also could<br />
adversely affect us. See “Item 1A. Risk Factors” of this Report for more information regarding factors that might<br />
cause our results to differ materially from those expressed in or implied by the forward-looking statements contained<br />
in this Report.<br />
• We depend on U.S. Government customers for a significant portion of our revenue, and the loss of this<br />
relationship or a shift in U.S. Government funding priorities could have adverse consequences on our future<br />
business.<br />
• We depend significantly on U.S. Government contracts, which often are only partially funded, subject to<br />
immediate termination, and heavily regulated and audited. The termination or failure to fund one or more of<br />
these contracts could have an adverse impact on our business.<br />
• We enter into fixed-price contracts that could subject us to losses in the event of cost overruns or a<br />
significant increase in inflation.<br />
• We could be negatively impacted by a security breach, through cyber attack, cyber intrusion or otherwise, or<br />
other significant disruption of our IT networks and related systems or of those we operate for certain of our<br />
customers.<br />
• We derive a significant portion of our revenue from international operations and are subject to the risks of<br />
doing business internationally, including fluctuations in currency exchange rates.<br />
• Our reputation and ability to do business may be impacted by the improper conduct of our employees, agents<br />
or business partners.<br />
• We may not be successful in obtaining the necessary export licenses to conduct certain operations abroad,<br />
and Congress may prevent proposed sales to certain foreign governments.<br />
• The continued effects of the general downturn in the global economy and the U.S. Government’s budget<br />
deficits and national debt could have an adverse impact on our business, operating results or financial<br />
condition.<br />
• Our future success will depend on our ability to develop new products, services and technologies that achieve<br />
market acceptance in our current and future markets.<br />
• We participate in markets that are often subject to uncertain economic conditions, which makes it difficult to<br />
estimate growth in our markets and, as a result, future income and expenditures.<br />
• We cannot predict the consequences of future geo-political events, but they may adversely affect the markets<br />
in which we operate, our ability to insure against risks, our operations or our profitability.<br />
• We have made, and may continue to make, strategic acquisitions that involve significant risks and<br />
uncertainties.<br />
• Disputes with our subcontractors and the inability of our subcontractors to perform, or our key suppliers to<br />
timely deliver our components, parts or services, could cause our products or services to be produced or<br />
delivered in an untimely or unsatisfactory manner.<br />
• Third parties have claimed in the past and may claim in the future that we are infringing directly or<br />
indirectly upon their intellectual property rights, and third parties may infringe upon our intellectual property<br />
rights.<br />
• The outcome of litigation or arbitration in which we are involved is unpredictable and an adverse decision in<br />
any such matter could have a material adverse effect on our financial condition and results of operations.<br />
• We face certain significant risk exposures and potential liabilities that may not be covered adequately by<br />
insurance or indemnity.<br />
• Changes in our effective tax rate may have an adverse effect on our results of operations.<br />
56
• We have significant operations in Florida and other locations that could be materially and adversely impacted<br />
in the event of a natural disaster or other significant disruption.<br />
• Changes in the regulatory framework under which our managed satellite and terrestrial communications<br />
solutions operations are operated could adversely affect our business, results of operations and financial<br />
condition.<br />
• We rely on third parties to provide satellite bandwidth for our managed satellite and terrestrial<br />
communications solutions, and any bandwidth constraints could harm our business, financial condition and<br />
results of operations.<br />
• Changes in future business conditions could cause business investments and/or recorded goodwill to become<br />
impaired, resulting in substantial losses and write-downs that would reduce our results of operations.<br />
• We must attract and retain key employees, and failure to do so could seriously harm us.<br />
ITEM 7A. QUANTITATIVE AND QUALITATIVE DISCLOSURES ABOUT MARKET RISK.<br />
In the normal course of doing business, we are exposed to the risks associated with foreign currency exchange<br />
rates and changes in interest rates. We employ established policies and procedures governing the use of financial<br />
instruments to manage our exposure to such risks. For a discussion of such policies and procedures and the related<br />
risks, see “Financial Risk Management” in “Item 7. Management’s Discussion and Analysis of Financial Condition<br />
and Results of Operations” of this Report, which is incorporated by reference into this Item 7A.<br />
57
ITEM 8. FINANCIAL STATEMENTS AND SUPPLEMENTARY DATA.<br />
INDEX TO FINANCIAL STATEMENTS AND SUPPLEMENTARY DATA<br />
Management’s Report on Internal Control Over Financial Reporting ................................ 59<br />
Report of Independent Registered Public Accounting Firm on the Consolidated Financial Statements. ....... 60<br />
Report of Independent Registered Public Accounting Firm on the Effectiveness of Internal Control Over<br />
Financial Reporting .................................................................. 61<br />
Consolidated Statement of Income — Fiscal Years ended July 1, 2011; July 2, 2010; and July 3, 2009 ...... 62<br />
Consolidated Balance Sheet — July 1, 2011 and July 2, 2010 ..................................... 63<br />
Consolidated Statement of Cash Flows — Fiscal Years ended July 1, 2011; July 2, 2010; and July 3, 2009 . . . 64<br />
Consolidated Statement of Comprehensive Income and Equity — Fiscal Years ended July 1, 2011; July 2,<br />
2010; and July 3, 2009 ............................................................... 65<br />
Notes to Consolidated Financial Statements .................................................. 66<br />
Supplementary Financial Information ....................................................... 95<br />
Schedule II — Valuation and Qualifying Accounts — Fiscal Years ended July 1, 2011; July 2, 2010; and<br />
July 3, 2009 ....................................................................... 108<br />
58<br />
Page
MANAGEMENT’S REPORT ON INTERNAL CONTROL<br />
OVER FINANCIAL REPORTING<br />
The management of Harris Corporation (the “Company”) is responsible for establishing and maintaining<br />
adequate internal control over financial reporting as such term is defined in Rules 13a-15(f) and 15d-15(f) under the<br />
Securities Exchange Act of 1934, as amended. The Company’s internal control over financial reporting is designed<br />
to provide reasonable assurance, based on an appropriate cost-benefit analysis, regarding the reliability of financial<br />
reporting and the preparation of financial statements for external purposes in accordance with U.S. generally<br />
accepted accounting principles. The Company’s internal control over financial reporting includes those policies and<br />
procedures that: (i) pertain to the maintenance of records that, in reasonable detail, accurately and fairly reflect the<br />
transactions and dispositions of the assets of the Company; (ii) provide reasonable assurance that transactions are<br />
recorded as necessary to permit preparation of financial statements in accordance with U.S. generally accepted<br />
accounting principles, and that receipts and expenditures of the Company are being made only in accordance with<br />
authorizations of management and directors of the Company; and (iii) provide reasonable assurance regarding<br />
prevention or timely detection of unauthorized acquisition, use or disposition of the Company’s assets that could<br />
have a material effect on the financial statements.<br />
Because of its inherent limitations, internal control over financial reporting may not prevent or detect<br />
misstatements. Therefore, even those systems determined to be effective can provide only reasonable assurance with<br />
respect to financial statement preparation and presentation. Also, projections of any evaluation of effectiveness to<br />
future periods are subject to the risk that controls may become inadequate because of changes in conditions, or that<br />
the degree of compliance with the policies or procedures may deteriorate.<br />
Management, with the participation of our Chief Executive Officer and Chief Financial Officer, assessed the<br />
effectiveness of the Company’s internal control over financial reporting as of July 1, 2011. In making this<br />
assessment, management used the criteria set forth by the Committee of Sponsoring Organizations of the Treadway<br />
Commission (COSO) in Internal Control-Integrated Framework. Based on management’s assessment and those<br />
criteria, management concluded that the Company maintained effective internal control over financial reporting as of<br />
July 1, 2011.<br />
Management excluded from its assessment of the effectiveness of the Company’s internal control over financial<br />
reporting the internal controls of CapRock Holdings, Inc. and its subsidiaries, including CapRock Communications,<br />
Inc. (collectively, “CapRock”), which the Company acquired during the first quarter of fiscal 2011; the internal<br />
controls with respect to the Schlumberger group’s Global Connectivity Services business, substantially all the assets<br />
of which the Company acquired during the fourth quarter of fiscal 2011 (“Schlumberger GCS”); and the internal<br />
controls of Carefx Corporation (“Carefx”), which the Company acquired during the fourth quarter of fiscal 2011.<br />
CapRock, Schlumberger GCS and Carefx are included in the fiscal 2011 consolidated financial statements of the<br />
Company. On a combined basis, as of July 1, 2011, total assets and net assets of CapRock, Schlumberger GCS and<br />
Carefx, excluding goodwill and identifiable intangible assets, constituted 3.8 percent and 5.1 percent of the<br />
Company’s total assets and net assets, respectively. On a combined basis, for the fiscal year ended July 1, 2011,<br />
revenue from CapRock, Schlumberger GCS and Carefx constituted 6.7 percent of the Company’s total revenue.<br />
Management will include the internal controls of CapRock, Schlumberger GCS and Carefx in its assessment of the<br />
effectiveness of the Company’s internal control over financial reporting for fiscal 2012.<br />
The Company’s independent registered public accounting firm, Ernst & Young LLP, has issued a report on the<br />
effectiveness of the Company’s internal control over financial reporting. This report appears on page 61 of this<br />
Annual Report on Form 10-K.<br />
59
REPORT OF INDEPENDENT REGISTERED PUBLIC ACCOUNTING FIRM<br />
The Board of Directors and Shareholders of Harris Corporation<br />
We have audited the accompanying consolidated balance sheets of Harris Corporation as of July 1, 2011 and<br />
July 2, 2010, and the related consolidated statements of income, cash flows, and comprehensive income and equity,<br />
for each of the three years in the period ended July 1, 2011. Our audits also included the financial statement<br />
schedule listed in the Index at Item 15(2). These financial statements and schedule are the responsibility of the<br />
Company’s management. Our responsibility is to express an opinion on these financial statements and schedule<br />
based on our audits.<br />
We conducted our audits in accordance with the standards of the Public Company Accounting Oversight Board<br />
(United States). Those standards require that we plan and perform the audit to obtain reasonable assurance about<br />
whether the financial statements are free of material misstatement. An audit includes examining, on a test basis,<br />
evidence supporting the amounts and disclosures in the financial statements. An audit also includes assessing the<br />
accounting principles used and significant estimates made by management, as well as evaluating the overall<br />
financial statement presentation. We believe that our audits provide a reasonable basis for our opinion.<br />
In our opinion, the financial statements referred to above present fairly, in all material respects, the<br />
consolidated financial position of Harris Corporation at July 1, 2011 and July 2, 2010, and the consolidated results<br />
of its operations and its cash flows for each of the three years in the period ended July 1, 2011, in conformity with<br />
U.S. generally accepted accounting principles. Also, in our opinion, the related financial statement schedule, when<br />
considered in relation to the basic financial statements taken as a whole, presents fairly in all material respects the<br />
information set forth therein.<br />
We also have audited, in accordance with the standards of the Public Company Accounting Oversight Board<br />
(United States), Harris Corporation’s internal control over financial reporting as of July 1, 2011, based on criteria<br />
established in Internal Control — Integrated Framework issued by the Committee of Sponsoring Organizations of<br />
the Treadway Commission and our report dated August 29, 2011 expressed an unqualified opinion thereon.<br />
Boca Raton, Florida<br />
August 29, 2011<br />
60<br />
/s/ ERNST &YOUNG LLP<br />
Certified Public Accountants
REPORT OF INDEPENDENT REGISTERED PUBLIC ACCOUNTING FIRM<br />
The Board of Directors and Shareholders of Harris Corporation<br />
We have audited Harris Corporation’s internal control over financial reporting as of July 1, 2011, based on criteria<br />
established in Internal Control — Integrated Framework issued by the Committee of Sponsoring Organizations of the<br />
Treadway Commission (the COSO criteria). Harris Corporation’s management is responsible for maintaining effective<br />
internal control over financial reporting, and for its assessment of the effectiveness of internal control over financial<br />
reporting included in the accompanying Management’s Report on Internal Control Over Financial Reporting. Our<br />
responsibility is to express an opinion on the company’s internal control over financial reporting based on our audit.<br />
We conducted our audit in accordance with the standards of the Public Company Accounting Oversight Board<br />
(United States). Those standards require that we plan and perform the audit to obtain reasonable assurance about<br />
whether effective internal control over financial reporting was maintained in all material respects. Our audit included<br />
obtaining an understanding of internal control over financial reporting, assessing the risk that a material weakness<br />
exists, testing and evaluating the design and operating effectiveness of internal control based on the assessed risk,<br />
and performing such other procedures as we considered necessary in the circumstances. We believe that our audit<br />
provides a reasonable basis for our opinion.<br />
A company’s internal control over financial reporting is a process designed to provide reasonable assurance<br />
regarding the reliability of financial reporting and the preparation of financial statements for external purposes in<br />
accordance with generally accepted accounting principles. A company’s internal control over financial reporting<br />
includes those policies and procedures that (1) pertain to the maintenance of records that, in reasonable detail,<br />
accurately and fairly reflect the transactions and dispositions of the assets of the company; (2) provide reasonable<br />
assurance that transactions are recorded as necessary to permit preparation of financial statements in accordance<br />
with U.S. generally accepted accounting principles, and that receipts and expenditures of the company are being<br />
made only in accordance with authorizations of management and directors of the company; and (3) provide<br />
reasonable assurance regarding prevention or timely detection of unauthorized acquisition, use, or disposition of the<br />
company’s assets that could have a material effect on the financial statements.<br />
Because of its inherent limitations, internal control over financial reporting may not prevent or detect<br />
misstatements. Also, projections of any evaluation of effectiveness to future periods are subject to the risk that<br />
controls may become inadequate because of changes in conditions, or that the degree of compliance with the<br />
policies or procedures may deteriorate.<br />
As indicated in the accompanying Management’s Report on Internal Control Over Financial Reporting,<br />
management’s assessment of and conclusion on the effectiveness of internal control over financial reporting did not<br />
include the internal controls of CapRock Holdings, Inc., Schlumberger GCS and Carefx Corporation which are<br />
included in the fiscal 2011 consolidated financial statements of Harris Corporation. On a combined basis, as of July 1,<br />
2011, total assets and net assets of CapRock Holdings, Inc., Schlumberger GCS and Carefx Corporation, excluding<br />
goodwill and identifiable intangible assets, constituted 3.8 percent and 5.1 percent of Harris Corporation’s total assets<br />
and net assets, respectively. On a combined basis, for the fiscal year ended July 1, 2011, revenue from CapRock<br />
Holdings, Inc., Schlumberger GCS and Carefx Corporation constituted 6.7 percent of Harris Corporation’s total<br />
revenue. Our audit of internal control over financial reporting of Harris Corporation also did not include an evaluation<br />
of the internal control over financial reporting of CapRock Holdings, Inc., Schlumberger GCS and Carefx Corporation.<br />
In our opinion, Harris Corporation maintained, in all material respects, effective internal control over financial<br />
reporting as of July 1, 2011, based on the COSO criteria.<br />
We also have audited, in accordance with the standards of the Public Company Accounting Oversight Board<br />
(United States), the consolidated balance sheets of Harris Corporation as of July 1, 2011 and July 2, 2010, and the<br />
related consolidated statements of income, cash flows, and comprehensive income and equity, for each of the three<br />
years in the period ended July 1, 2011 of Harris Corporation and our report dated August 29, 2011 expressed an<br />
unqualified opinion thereon.<br />
Boca Raton, Florida<br />
August 29, 2011<br />
61<br />
/s/ ERNST &YOUNG LLP<br />
Certified Public Accountants
CONSOLIDATED STATEMENT OF INCOME<br />
2011<br />
Fiscal Years Ended<br />
2010 2009<br />
(In millions, except per share amounts)<br />
Revenue from product sales and services<br />
Revenue from product sales ...................................... $4,136.8 $ 3,935.2 $ 3,915.3<br />
Revenue from services .......................................... 1,787.8 1,270.9 1,089.7<br />
Cost of product sales and services<br />
5,924.6 5,206.1 5,005.0<br />
Cost of product sales ........................................... (2,339.0) (2,268.7) (2,498.0)<br />
Cost of services ............................................... (1,471.5) (1,065.7) (922.2)<br />
(3,810.5) (3,334.4) (3,420.2)<br />
Engineering, selling and administrative expenses ....................... (1,143.9) (958.9) (791.3)<br />
Impairment of goodwill and other long-lived assets ..................... — — (255.5)<br />
Non-operating loss ............................................. (1.9) (1.9) (3.1)<br />
Interest income. ............................................... 2.8 1.5 3.2<br />
Interest expense ............................................... (90.4) (72.1) (52.8)<br />
Income from continuing operations before income taxes ................. 880.7 840.3 485.3<br />
Income taxes ................................................. (293.6) (278.7) (172.9)<br />
Income from continuing operations .................................<br />
Discontinued operations (including a $62.6 million loss on disposition in fiscal<br />
587.1 561.6 312.4<br />
2009), net of income taxes ..................................... — — (437.0)<br />
Net income (loss) .............................................. 587.1 561.6 (124.6)<br />
Noncontrolling interests, net of income taxes. ......................... 0.9 — 162.5<br />
Net income attributable to Harris Corporation ......................... $ 588.0 $ 561.6 $ 37.9<br />
Amounts attributable to Harris Corporation common shareholders<br />
Income from continuing operations ................................. $ 588.0 $ 561.6 $ 312.4<br />
Discontinued operations, net of income taxes. ......................... — — (274.5)<br />
Net income .................................................. $ 588.0 $ 561.6 $ 37.9<br />
Net income per common share attributable to Harris Corporation<br />
common shareholders<br />
Basic net income per common share attributable to Harris Corporation<br />
common shareholders<br />
Continuing operations ....................................... $ 4.63 $ 4.31 $ 2.35<br />
Discontinued operations. ..................................... — — (2.07)<br />
$ 4.63 $ 4.31 $ 0.28<br />
Diluted net income per common share attributable to Harris Corporation<br />
common shareholders<br />
Continuing operations ....................................... $ 4.60 $ 4.28 $ 2.33<br />
Discontinued operations. ..................................... — — (2.05)<br />
$ 4.60 $ 4.28 $ 0.28<br />
See accompanying Notes to Consolidated Financial Statements.<br />
62
CONSOLIDATED BALANCE SHEET<br />
July 1, July 2,<br />
2011 2010<br />
(In millions, except shares)<br />
Assets<br />
Current Assets<br />
Cash and cash equivalents ................................................ $ 366.9 $ 455.2<br />
Receivables .......................................................... 836.5 736.0<br />
Inventories ........................................................... 720.8 615.3<br />
Income taxes receivable ................................................. 57.3 15.3<br />
Current deferred income taxes ............................................. 171.0 145.3<br />
Other current assets .................................................... 64.3 37.5<br />
Total current assets .................................................<br />
Non-current Assets<br />
2,216.8 2,004.6<br />
Property, plant and equipment ............................................. 872.8 609.7<br />
Goodwill ............................................................ 2,381.4 1,576.2<br />
Intangible assets ....................................................... 502.4 297.8<br />
Non-current deferred income taxes . . . ...................................... 5.7 107.7<br />
Other non-current assets ................................................. 193.7 147.6<br />
Total non-current assets .............................................. 3,956.0 2,739.0<br />
Liabilities and Equity<br />
Current Liabilities<br />
$6,172.8 $4,743.6<br />
Short-term debt. ....................................................... $ 180.0 $ 30.0<br />
Accounts payable ...................................................... 450.8 329.4<br />
Compensation and benefits ............................................... 266.2 239.7<br />
Other accrued items .................................................... 295.8 267.5<br />
Advance payments and unearned income ..................................... 232.8 175.6<br />
Income taxes payable ................................................... — 8.9<br />
Current portion of long-term debt .......................................... 4.9 0.7<br />
Total current liabilities ...............................................<br />
Non-current Liabilities<br />
1,430.5 1,051.8<br />
Long-term debt ........................................................ 1,887.2 1,176.6<br />
Long-term contract liability ............................................... 120.9 132.4<br />
Other long-term liabilities ................................................ 222.2 192.7<br />
Total non-current liabilities ...........................................<br />
Equity<br />
Shareholders’ Equity:<br />
2,230.3 1,501.7<br />
Preferred stock, without par value; 1,000,000 shares authorized; none issued ..........<br />
Common stock, $1.00 par value; 500,000,000 shares authorized; issued and outstanding<br />
— —<br />
123,118,804 shares at July 1, 2011 and 127,460,307 shares at July 2, 2010 .......... 123.1 127.5<br />
Other capital .......................................................... 471.2 461.1<br />
Retained earnings ...................................................... 1,889.0 1,621.4<br />
Accumulated other comprehensive income (loss) ............................... 18.7 (20.4)<br />
Total shareholders’ equity ............................................ 2,502.0 2,189.6<br />
Noncontrolling interests ................................................... 10.0 0.5<br />
Total equity ....................................................... 2,512.0 2,190.1<br />
$6,172.8 $4,743.6<br />
See accompanying Notes to Consolidated Financial Statements.<br />
63
CONSOLIDATED STATEMENT OF CASH FLOWS<br />
2011<br />
Fiscal Years Ended<br />
2010<br />
(In millions)<br />
2009<br />
Operating Activities<br />
Net income (loss) ...............................................<br />
Adjustments to reconcile net income (loss) to net cash provided by operating<br />
activities:<br />
$ 587.1 $ 561.6 $(124.6)<br />
Depreciation and amortization .................................... 212.0 165.7 177.7<br />
Purchased in-process research and development write-off ................ — — 7.0<br />
Share-based compensation. ...................................... 46.1 35.3 41.9<br />
Non-current deferred income taxes ................................ 37.1 (6.5) (47.2)<br />
Impairment of securities available-for-sale ........................... — — 7.6<br />
Impairment of goodwill and other long-lived assets .................... — — 556.5<br />
Loss on disposition of discontinued operations. .......................<br />
(Increase) decrease in:<br />
— — 62.6<br />
Accounts and notes receivable .................................. (42.9) 40.0 32.7<br />
Inventories ................................................<br />
Increase (decrease) in:<br />
(64.7) (13.9) (68.3)<br />
Accounts payable and accrued expenses. .......................... 90.5 (51.8) 72.1<br />
Advance payments and unearned income .......................... 47.6 53.0 (17.2)<br />
Income taxes. .............................................. (64.6) 0.8 (41.3)<br />
Other ...................................................... (15.1) 18.5 7.3<br />
Net cash provided by operating activities ...............................<br />
Investing Activities<br />
833.1 802.7 666.8<br />
Cash paid for acquired businesses ................................... (1,082.6) (52.1) (745.3)<br />
Cash paid for cost-method investment ................................ (10.0) — —<br />
Additions of property, plant and equipment ............................ (311.3) (189.9) (108.9)<br />
Additions of capitalized software ................................... (13.6) (8.1) (12.9)<br />
Cash paid for short-term investments available-for-sale ................... — — (1.2)<br />
Proceeds from the sale of short-term investments available-for-sale . . . ....... — — 3.7<br />
Net cash used in investing activities ...................................<br />
Financing Activities<br />
(1,417.5) (250.1) (864.6)<br />
Proceeds from borrowings ........................................ 852.1 — 531.8<br />
Repayments of borrowings ........................................ (0.7) (76.8) (81.4)<br />
Proceeds from exercise of employee stock options. ...................... 24.5 18.9 5.6<br />
Repurchases of common stock ..................................... (256.1) (208.0) (132.3)<br />
Cash dividends ................................................. (127.0) (115.0) (106.6)<br />
Cash decrease related to spin-off of Harris Stratex Networks, Inc. ........... — — (100.0)<br />
Net cash provided by (used in) financing activities ........................ 492.8 (380.9) 117.1<br />
Effect of exchange rate changes on cash and cash equivalents ................ 3.3 2.3 (8.1)<br />
Net increase (decrease) in cash and cash equivalents ..................... (88.3) 174.0 (88.8)<br />
Cash and cash equivalents, beginning of year .......................... 455.2 281.2 370.0<br />
Cash and cash equivalents, end of year ...............................<br />
Supplemental disclosure of non-cash investing and financing activities:<br />
Distribution of Harris Stratex Networks, Inc. common stock owned by<br />
$ 366.9 $ 455.2 $ 281.2<br />
Harris Corporation to Harris Corporation shareholders .............. $ — $ — $173.1<br />
See accompanying Notes to Consolidated Financial Statements.<br />
64
CONSOLIDATED STATEMENT OF COMPREHENSIVE INCOME AND EQUITY<br />
Accumulated<br />
Other<br />
Common<br />
Stock<br />
Other<br />
Capital<br />
Retained<br />
Earnings<br />
Comprehensive<br />
Income (Loss)<br />
Noncontrolling<br />
Interests<br />
Total<br />
Equity<br />
(In millions, except per share amounts)<br />
Balance at June 27, 2008 ................... $133.6 $453.6 $1,660.8 $ 24.3 $ 332.0 $2,604.3<br />
Net income (loss) . . . . . . . . . . . . . . . . . . . . . . . . . — — 37.9 — (162.5) (124.6)<br />
Foreign currency translation . . . . . . . . . . . . . . . . . .<br />
Net unrealized gain on hedging derivatives, net of<br />
— — — (59.0) (5.0) (64.0)<br />
income taxes of $(1.4) . . . . . . . . . . . . . . . . . . . .<br />
Net unrealized loss on securities available-for-sale,<br />
— — — 2.1 0.2 2.3<br />
net of income taxes of $3.1 . . . . . . . . . . . . . . . .<br />
Amortization of loss on treasury lock, net of income<br />
— — — (5.0) — (5.0)<br />
taxes of $(0.4). . . . . . . . . . . . . . . . . . . . . . . . . .<br />
Net unrecognized pension obligation, net of income<br />
— — — 0.6 — 0.6<br />
taxesof$6.9........................... — — — (11.3) — (11.3)<br />
Comprehensive loss . . . . . . . . . . . . . . . . . . . . . . . (202.0)<br />
Shares issued under stock incentive plans . . . . . . . . 0.5 7.2 — — — 7.7<br />
Share-based compensation expense . . . . . . . . . . . . . — 39.2 — — — 39.2<br />
Repurchases and retirement of common stock . . . . . (2.7) (33.7) (95.9) — — (132.3)<br />
Other activity related to noncontrolling interest . . . . — — — — 2.1 2.1<br />
Spin-off of Harris Stratex Networks, Inc. . . . . . . . . — — (173.1) (3.1) (166.8) (343.0)<br />
Cash dividends ($.80 per share) . . . . . . . . . . . . . . .<br />
Adoption of accounting standard related to pension<br />
— — (106.6) — — (106.6)<br />
benefits . . . . . . . . . . . . . . . . . . . . . . . . . . . . . . — — (0.3) — — (0.3)<br />
Balance at July 3, 2009 .................... 131.4 466.3 1,322.8 (51.4) — 1,869.1<br />
Net income . . . . . . . . . . . . . . . . . . . . . . . . . . . . . — — 561.6 — — 561.6<br />
Foreign currency translation . . . . . . . . . . . . . . . . . .<br />
Net unrealized loss on hedging derivatives, net of<br />
— — — 31.8 — 31.8<br />
income taxes of $0.4 . . . . . . . . . . . . . . . . . . . . .<br />
Net unrealized gain on securities available-for-sale,<br />
— — — (0.7) — (0.7)<br />
net of income taxes of $(0.5) . . . . . . . . . . . . . . .<br />
Amortization of loss on treasury lock, net of income<br />
— — — 0.8 — 0.8<br />
taxes of $(0.3). . . . . . . . . . . . . . . . . . . . . . . . . .<br />
Net unrecognized pension obligation, net of income<br />
— — — 0.5 — 0.5<br />
taxes of $0.9 . . . . . . . . . . . . . . . . . . . . . . . . . . . — — — (1.4) — (1.4)<br />
Comprehensive income . . . . . . . . . . . . . . . . . . . . . 592.6<br />
Shares issued under stock incentive plans . . . . . . . . 0.9 14.7 — — — 15.6<br />
Share-based compensation expense . . . . . . . . . . . . . — 35.3 — — — 35.3<br />
Repurchases and retirement of common stock . . . . . (4.8) (55.2) (148.0) — — (208.0)<br />
Cash dividends ($.88 per share) . . . . . . . . . . . . . . . — — (115.0) — — (115.0)<br />
Other activity related to noncontrolling interest . . . . — — — — 0.5 0.5<br />
Balance at July 2, 2010 .................... 127.5 461.1 1,621.4 (20.4) 0.5 2,190.1<br />
Net income (loss) . . . . . . . . . . . . . . . . . . . . . . . . . — — 588.0 — (0.9) 587.1<br />
Foreign currency translation . . . . . . . . . . . . . . . . . .<br />
Net unrealized loss on hedging derivatives, net of<br />
— — — 36.5 — 36.5<br />
income taxes of $0.4 . . . . . . . . . . . . . . . . . . . . .<br />
Net unrealized gain on securities available-for-sale,<br />
— — — (0.6) — (0.6)<br />
net of income taxes of $(0.3) . . . . . . . . . . . . . . .<br />
Amortization of loss on treasury lock, net of income<br />
— — — 0.5 — 0.5<br />
taxes of $(0.4). . . . . . . . . . . . . . . . . . . . . . . . . .<br />
Net unrecognized pension obligation, net of income<br />
— — — 0.6 — 0.6<br />
taxes of $(1.3). . . . . . . . . . . . . . . . . . . . . . . . . . — — — 2.1 — 2.1<br />
Comprehensive income . . . . . . . . . . . . . . . . . . . . . — — — — — 626.2<br />
Shares issued under stock incentive plans . . . . . . . . 0.9 21.4 — — — 22.3<br />
Share-based compensation expense . . . . . . . . . . . . . — 46.1 — — — 46.1<br />
Repurchases and retirement of common stock . . . . . (5.3) (57.4) (193.4) — — (256.1)<br />
Cash dividends ($1.00 per share) . . . . . . . . . . . . . . — — (127.0) — — (127.0)<br />
Other activity related to noncontrolling interests . . . . — — — — 10.4 10.4<br />
Balance at July 1, 2011 .................... $123.1 $471.2 $1,889.0 $ 18.7 $ 10.0 $2,512.0<br />
See accompanying Notes to Consolidated Financial Statements.<br />
65
NOTES TO CONSOLIDATED FINANCIAL STATEMENTS<br />
NOTE 1: SIGNIFICANT ACCOUNTING POLICIES<br />
Principles of Consolidation — Our Consolidated Financial Statements include the accounts of Harris<br />
Corporation and its consolidated subsidiaries. As used in these Notes to Consolidated Financial Statements (these<br />
“Notes”), the terms “Harris,” “we,” “our” and “us” refer to Harris Corporation and its consolidated subsidiaries.<br />
Significant intercompany transactions and accounts have been eliminated. Unless otherwise specified, disclosures in<br />
the Notes relate solely to our continuing operations.<br />
Use of Estimates — Our Consolidated Financial Statements have been prepared in conformity with<br />
U.S. generally accepted accounting principles (“GAAP”) and require management to make estimates and<br />
assumptions. These assumptions affect the reported amounts of assets and liabilities and disclosure of contingent<br />
assets and liabilities at the date of the Consolidated Financial Statements and the reported amounts of revenue and<br />
expenses during the reporting period. These estimates are based on experience and other information available prior<br />
to issuance of the Consolidated Financial Statements. Materially different results can occur as circumstances change<br />
and additional information becomes known.<br />
Fiscal Year — Our fiscal year ends on the Friday nearest June 30. Fiscal 2011 and 2010 included 52 weeks.<br />
Fiscal 2009 included 53 weeks.<br />
Cash and Cash Equivalents — Cash equivalents are temporary cash investments with a maturity of three or<br />
fewer months when purchased. These investments include accrued interest and are carried at the lower of cost or<br />
market.<br />
Marketable Equity Securities — We consider all of our available-for-sale securities as available for use in our<br />
current operations. All of our marketable equity securities are classified as available-for-sale and are stated at fair<br />
value, with unrealized gains and losses, net of taxes, included as a separate component of shareholders’ equity.<br />
Realized gains and losses from marketable equity securities available-for-sale are determined using the specific<br />
identification method. In instances where a security is subject to transfer restrictions, the value of the security is<br />
based primarily on the quoted price of the same security without restriction but may be reduced by an amount<br />
estimated to reflect such restrictions. If an “other-than-temporary” impairment is determined to exist, the difference<br />
between the value of the investment security recorded on the financial statements and our current estimate of fair<br />
value is recognized as a charge to earnings in the period in which the impairment is determined. We include our<br />
marketable equity securities in the “Other current assets” line item in our Consolidated Balance Sheet.<br />
Fair Value of Financial Instruments — The carrying amounts reflected in our Consolidated Balance Sheet for<br />
cash and cash equivalents, marketable equity securities available-for-sale, accounts receivable, non-current<br />
receivables, notes receivable, accounts payable and short-term and long-term debt approximate their fair values. Fair<br />
values for long-term debt are based primarily on quoted market prices for those or similar instruments. A discussion<br />
of fair values for our derivative financial instruments is included under the caption “Financial Instruments and Risk<br />
Management” in this Note 1: Significant Accounting Policies.<br />
Accounts Receivable — We record receivables at net realizable value and they do not bear interest. This value<br />
includes an allowance for estimated uncollectible accounts to reflect any loss anticipated on the accounts receivable<br />
balances which is charged to the provision for doubtful accounts. We calculate this allowance based on our history<br />
of write-offs, level of past due accounts and economic status of the customers. We consider a receivable delinquent<br />
if it is unpaid after the term of the related invoice has expired. Write-offs are recorded at the time a customer<br />
receivable is deemed uncollectible. See Note 5: Receivables for additional information regarding accounts<br />
receivable.<br />
Inventories — Inventories are valued at the lower of cost (determined by average and first-in, first-out<br />
methods) or market. We regularly review inventory quantities on hand and record a provision for excess and<br />
obsolete inventory based primarily on our estimated forecast of product demand and production requirements. See<br />
Note 6: Inventories for additional information regarding inventories.<br />
Property, Plant and Equipment — Property, plant and equipment are carried on the basis of cost and include<br />
software capitalized for internal use. Depreciation of buildings, machinery and equipment is computed by the<br />
straight-line and accelerated methods. The estimated useful lives of buildings generally range between 3 and<br />
45 years. The estimated useful lives of machinery and equipment generally range between 2 and 10 years.<br />
Amortization of internal-use software begins when the software is put into service and is based on the expected<br />
useful life of the software. The useful lives over which we amortize internal-use software generally range between 3<br />
66
NOTES TO CONSOLIDATED FINANCIAL STATEMENTS (Continued)<br />
and 7 years. See Note 7: Property, Plant and Equipment for additional information regarding property, plant and<br />
equipment.<br />
Goodwill and Indefinite-Lived Intangible Assets — Goodwill and indefinite-lived intangible assets are not<br />
amortized. We perform annual (or under certain circumstances, more frequent) impairment tests of our goodwill and<br />
indefinite-lived intangible assets. We test indefinite-lived intangible assets for impairment by comparing their fair<br />
value (determined by forecasting future cash flows) against their carrying value. We test goodwill for impairment<br />
using a two-step process. The first step is to identify potential impairment by comparing the fair value of each of<br />
our reporting units with its net book value, including goodwill, adjusted for allocations of corporate assets and<br />
liabilities as appropriate. If the fair value of a reporting unit exceeds its adjusted net book value, goodwill of the<br />
reporting unit is considered not impaired and the second step of the impairment test is unnecessary. If the adjusted<br />
net book value of a reporting unit exceeds its fair value, the second step of the goodwill impairment test compares<br />
the implied fair value of the reporting unit’s goodwill with the carrying amount of that goodwill. If the carrying<br />
amount of the reporting unit’s goodwill exceeds the implied fair value of that goodwill, an impairment loss is<br />
recognized in an amount equal to that excess. The implied fair value of goodwill is determined in the same manner<br />
as the amount of goodwill recognized in a business combination. The fair value of the reporting unit is allocated to<br />
all of the assets and liabilities of that unit, including any unrecognized intangible assets, as if the reporting unit had<br />
been acquired in a business combination and the fair value of the reporting unit was the purchase price paid to<br />
acquire the reporting unit. See Note 8: Goodwill, Note 9: Intangible Assets and Note 22: Impairment of Goodwill<br />
and Other Long-Lived Assets for additional information regarding goodwill and intangible assets, including goodwill<br />
and intangible asset impairment charges recorded in fiscal 2009.<br />
Long-Lived Assets, Including Finite-Lived Intangible Assets — Long-lived assets, including finite-lived<br />
intangible assets, are amortized on a straight-line basis over their useful lives. We assess the recoverability of the<br />
carrying value of our long-lived assets, including intangible assets with finite useful lives, whenever events or<br />
changes in circumstances indicate the carrying amount of the assets may not be recoverable. We evaluate the<br />
recoverability of such assets based upon the expectations of undiscounted cash flows from such assets. If the sum of<br />
the expected future undiscounted cash flows was less than the carrying amount of the asset, a loss would be<br />
recognized for the difference between the fair value and the carrying amount. See Note 7: Property, Plant and<br />
Equipment, Note 9: Intangible Assets and Note 22: Impairment of Goodwill and Other Long-Lived Assets for<br />
additional information regarding long-lived assets and intangible assets, including impairment charges recorded in<br />
fiscal 2009.<br />
Capitalized Software to Be Sold, Leased or Otherwise Marketed — Costs incurred to acquire or create a<br />
computer software product are expensed when incurred as research and development until technological feasibility<br />
has been established for the product, at which point such costs are capitalized. Technological feasibility is normally<br />
established upon completion of a detailed program design. Capitalization of computer software costs ceases when<br />
the product is available for general release to customers. Costs of reproduction, documentation, training materials,<br />
physical packaging, maintenance and customer support are charged to cost of products sold as incurred. Capitalized<br />
software to be sold, leased or otherwise marketed is evaluated for impairment periodically by comparing the<br />
unamortized capitalized costs of a computer software product to the net realizable value of that product. In the<br />
fourth quarter of fiscal 2009, we recorded a $24.4 million write-down of capitalized software in our Integrated<br />
Network Solutions segment based on market conditions that resulted in reduced levels of capital expenditures,<br />
including demand for Integrated Network Solutions’ software products. See Note 22: Impairment of Goodwill and<br />
Other Long-Lived Assets for additional information regarding impairment charges recorded in fiscal 2009.<br />
Capitalized software to be sold, leased or otherwise marketed had a net carrying value of $36.4 million at<br />
July 1, 2011 and $27.1 million at July 2, 2010. Total amortization expense related to these capitalized software<br />
amounts for fiscal 2011, 2010 and 2009 was $4.5 million, $3.4 million and $4.7 million, respectively. The annual<br />
amortization of these capitalized software costs is the greater of the amount computed using (a) the ratio that current<br />
gross revenues for a product bear to the total of current and anticipated future gross revenues for that product or<br />
(b) the straight-line method over the remaining estimated economic life of the product. Based on this policy, the<br />
useful lives over which we amortize costs of computer software to be sold, leased or otherwise marketed range from<br />
2 to 7 years. Amortization commences when the product is available for general release to customers. The<br />
capitalized costs, net of accumulated amortization, are reflected in the “Other non-current assets” line item in our<br />
Consolidated Balance Sheet. The amortization of capitalized software is included in the “Cost of product sales” line<br />
item in our Consolidated Statement of Income.<br />
67
NOTES TO CONSOLIDATED FINANCIAL STATEMENTS (Continued)<br />
Other Assets and Liabilities — No current assets within the “Other current assets” line item in our<br />
Consolidated Balance Sheet exceeded 5 percent of our total current assets as of July 1, 2011 or July 2, 2010. No<br />
assets within the “Other non-current assets” line item in our Consolidated Balance Sheet exceeded 5 percent of total<br />
assets as of July 1, 2011 or July 2, 2010. No accrued liabilities or expenses within the “Other accrued items” or<br />
“Other long-term liabilities” line items in our Consolidated Balance Sheet exceeded 5 percent of our total current<br />
liabilities or total liabilities, respectively, as of July 1, 2011 or July 2, 2010.<br />
Income Taxes — We follow the liability method of accounting for income taxes. We record the estimated<br />
future tax effects of temporary differences between the tax basis of assets and liabilities and amounts reported in our<br />
Consolidated Balance Sheet, as well as operating loss and tax credit carryforwards. We follow very specific and<br />
detailed guidelines in each tax jurisdiction regarding the recoverability of any tax assets recorded on the balance<br />
sheet and provide necessary valuation allowances as required. We regularly review our deferred tax assets for<br />
recoverability based on historical taxable income, projected future taxable income, the expected timing of the<br />
reversals of existing temporary differences and tax planning strategies. See Note 23: Income Taxes for additional<br />
information regarding income taxes.<br />
Warranties — On development and production contract sales in our Government Communications Systems and<br />
RF Communications segments, and in the government business in our Integrated Network Solutions segment, the<br />
value or price of our warranty is generally included in the contract and funded by the customer. A provision for<br />
warranties is built into the estimated program costs when determining the profit rate to accrue when applying the<br />
cost-to-cost percentage-of-completion revenue recognition method. Warranty costs, as incurred, are charged to the<br />
specific program’s cost, and both revenue and cost are recognized at that time. Factors that affect the estimated<br />
program cost for warranties include terms of the contract, complexity of the delivered product or service, number of<br />
installed units, historical experience and management’s judgment regarding anticipated rates of warranty claims and<br />
cost per claim.<br />
On product sales in all our segments, we provide for future warranty costs upon product delivery. The specific<br />
terms and conditions of those warranties vary depending upon the product sold, customer and country in which we<br />
do business. In the case of products sold by us, our warranties start from the shipment, delivery or customer<br />
acceptance date and continue as follows:<br />
Segment Warranty Periods<br />
RF Communications One to twelve years<br />
Integrated Network Solutions Less than one year to five years<br />
Government Communications Systems One to two years<br />
Because our products are manufactured, in many cases, to customer specifications and their acceptance is based<br />
on meeting those specifications, we historically have experienced minimal warranty costs. Factors that affect our<br />
warranty liability include the number of installed units, historical experience and management’s judgment regarding<br />
anticipated rates of warranty claims and cost per claim. We assess the adequacy of our recorded warranty liabilities<br />
every quarter and make adjustments to the liability as necessary.<br />
Media, automation and asset management software products sold by our Integrated Network Solutions segment<br />
generally carry a 90-day warranty from the date of shipment. Our liability under these warranties is either to provide<br />
a corrected copy of any portion of the software found not to be in substantial compliance with the specifications or,<br />
if we are unable to do so, to provide a full refund.<br />
Software license agreements and sales contracts for broadcast and new media solutions products in our<br />
Integrated Network Solutions segment generally include provisions for indemnifying customers against certain<br />
specified liabilities should that segment’s products infringe certain intellectual property rights of third parties.<br />
Certain of our Integrated Network Solutions transmission systems customers have notified us of potential claims<br />
against us based on these standard indemnification provisions included in sales contracts between us and these<br />
customers. These indemnification claims arise from litigation brought by a third-party patent licensing company<br />
asserting alleged technology rights against these customers. We are cooperating with these customers in efforts to<br />
mitigate their litigation exposure. To date, we have not incurred material costs as a result of such indemnification<br />
and have not accrued any liabilities related to such obligations in our Consolidated Financial Statements. See<br />
Note 10: Accrued Warranties for additional information regarding warranties.<br />
Foreign Currency Translation — The functional currency for most international subsidiaries is the local<br />
currency. Assets and liabilities are translated at current rates of exchange and income and expense items are<br />
68
NOTES TO CONSOLIDATED FINANCIAL STATEMENTS (Continued)<br />
translated at the weighted average exchange rate for the year. The resulting translation adjustments are recorded as a<br />
separate component of shareholders’ equity.<br />
Stock Options and Other Share-Based Compensation — We measure compensation cost for all share-based<br />
payments (including employee stock options) at fair value and recognize cost over the vesting period. It is our<br />
policy to issue shares when options are exercised. See Note 14: Stock Options and Other Share-Based Compensation<br />
for additional information regarding share-based compensation.<br />
Restructuring Costs — We record restructuring charges for sales or terminations of product lines, closures or<br />
relocations of business activities, changes in management structure, and fundamental reorganizations that affect the<br />
nature and focus of operations. Such costs include one-time termination benefits, contract termination costs and<br />
costs to consolidate facilities or relocate employees. We record these charges at their fair value when incurred. In<br />
cases where employees are required to render service until they are terminated in order to receive the termination<br />
benefits and will be retained beyond the minimum retention period, we record the expense ratably over the future<br />
service period. These charges are included as a component of the “Engineering, selling and administrative expenses”<br />
line item in our Consolidated Statement of Income.<br />
During the fourth quarter of fiscal 2009, due to the global economic slowdown, pressure on Department of<br />
Defense (“DoD”) spending, and contract delays, we announced a number of cost-reduction actions across our<br />
business segments and at our corporate headquarters. We recorded charges, net of government cost reimbursement,<br />
of $17.8 million for severance and other employee-related exit costs and $4.5 million related to consolidation of<br />
facilities. As of the end of fiscal 2009, we had recorded liabilities associated with these restructuring activities of<br />
$26.5 million, of which the majority was paid during fiscal 2010.<br />
Revenue Recognition — Our segments have the following revenue recognition policies:<br />
Development and Production Contracts: Revenue and anticipated profits under development and production<br />
contracts are recorded on a percentage-of-completion basis, generally using the cost-to-cost method of accounting<br />
where sales and profits are recorded based on the ratio of costs incurred to estimated total costs at completion.<br />
Recognition of profit on fixed-price development and production contracts requires estimates of: the total contract<br />
value; the total cost at completion; and the measurement of progress towards completion. Revenue and profits on costreimbursable<br />
development and production contracts are recognized as allowable costs are incurred on the contract, and<br />
become billable to the customer, in an amount equal to the allowable costs plus the profit on those costs. Revenue in<br />
our Government Communications Systems segment primarily relates to development and production contracts.<br />
Development and production contracts are combined when specific aggregation criteria are met. Criteria<br />
generally include closely interrelated activities performed for a single customer within the same economic<br />
environment. Development and production contracts are generally not segmented. If development and production<br />
contracts are segmented, we have determined that they meet specific segmenting criteria. Amounts representing<br />
development and production contract change orders, claims or other items are included in sales only when they can<br />
be reliably estimated and realization is probable. Incentives or penalties and awards applicable to performance on<br />
development and production contracts are considered in estimating sales and profit rates and are recorded when<br />
there is sufficient information to assess anticipated contract performance. Incentive provisions, which increase<br />
earnings based solely on a single significant event, are generally not recognized until the event occurs. When<br />
adjustments in contract value or estimated costs are determined, any changes from prior estimates are reflected in<br />
earnings in the current period. Anticipated losses on development and production contracts or programs in progress<br />
are charged to earnings when identified.<br />
Products and Services Other Than Development and Production Contracts: Revenue from product sales other<br />
than development and production contracts and revenue from service arrangements are recognized when persuasive<br />
evidence of an arrangement exists, the fee is fixed or determinable, collectibility is reasonably assured, and delivery<br />
of a product has occurred and title has transferred or services have been rendered. Further, if an arrangement other<br />
than a development and production contract requires the delivery or performance of multiple deliverables or<br />
elements under a bundled sale, we determine whether the individual elements represent separate units of accounting.<br />
If they do, we recognize the revenue associated with each element separately and contract revenue is allocated<br />
among elements based on relative selling price. If the elements within a bundled sale are not considered separate<br />
units of accounting, they are accounted for as a combined unit of accounting and generally recognized over the<br />
performance period. Unearned income on service contracts is amortized by the straight-line method over the term of<br />
the contracts. Also, if contractual obligations related to customer acceptance exist, revenue is not recognized for a<br />
product or service<br />
69
NOTES TO CONSOLIDATED FINANCIAL STATEMENTS (Continued)<br />
unless these obligations are satisfied. Revenue in our RF Communications Systems segment primarily relates to<br />
products and services other than development and production contracts.<br />
Certain contracts include terms and conditions through which we recognize revenue upon completion of<br />
equipment production, which is subsequently stored at our location at the customer’s request. Revenue is recognized<br />
on such contracts upon the customer’s assumption of title and risk of ownership and when collectibility is<br />
reasonably assured. At the time of revenue recognition, there is a schedule of delivery of the product consistent with<br />
the customer’s business practices, we do not have any remaining performance obligations such that the earnings<br />
process is not complete and the product has been separated from our inventory.<br />
Software Licenses: The amount of revenue allocated to undelivered elements under bundled software licenses<br />
that are bundled with multi-year maintenance agreements is based on the vendor-specific objective evidence of fair<br />
value for those elements using the residual method. Under the residual method, the total fair value of the<br />
undelivered elements, as indicated by vendor-specific objective evidence, is recorded as unearned, and the difference<br />
between the total arrangement fee and the amount recorded as unearned for the undelivered elements is recognized<br />
as revenue related to delivered elements. Unearned revenue due to undelivered elements is recognized ratably on a<br />
straight-line basis over the maintenance agreement. In the case of software products for which we sell term-based<br />
licenses including multi-year maintenance agreements, but do not have vendor-specific objective evidence on the<br />
undelivered element, the entire arrangement is recognized ratably on a straight-line basis over the term of the<br />
license. Our Integrated Network Solutions segment derives a portion of its revenue from the licensing of software<br />
with multi-year maintenance arrangements.<br />
Other: Royalty income is included as a component of the “Non-operating loss” line item in our Consolidated<br />
Statement of Income and is recognized on the basis of terms specified in contractual agreements. Shipping and<br />
handling fees billed to customers are included in the “Revenue from product sales” line item in our Consolidated<br />
Statement of Income and the associated costs are included in the “Cost of product sales” line item in our<br />
Consolidated Statement of Income. Also, we record taxes collected from customers and remitted to governmental<br />
authorities on a net basis in that they are excluded from revenues.<br />
Retirement Benefits — As of July 1, 2011, we provide retirement benefits to substantially all U.S.-based<br />
employees primarily through a defined contribution retirement plan that includes a 401(k) plan and certain nonqualified<br />
deferred compensation plans. The defined contribution retirement plan has matching and savings elements.<br />
Contributions by us to the retirement plan are based on employees’ savings with no other funding requirements. We<br />
may make additional contributions to the retirement plan at our discretion. Retirement benefits also include a<br />
defined benefit plan in the United Kingdom and an unfunded limited healthcare plan for U.S.-based retirees and<br />
employees on long-term disability. We accrue the estimated cost of these medical benefits, which are not material,<br />
during an employee’s active service life.<br />
Retirement plan expenses amounted to $60.0 million in fiscal 2011, $53.2 million in fiscal 2010 and<br />
$46.9 million in fiscal 2009.<br />
Environmental Expenditures — We capitalize environmental expenditures that increase the life or efficiency<br />
of property or that reduce or prevent environmental contamination. We accrue environmental expenses resulting<br />
from existing conditions that relate to past operations when the costs are probable and reasonably estimable.<br />
We are named as a potentially responsible party at 14 sites where future liabilities could exist. These sites<br />
include 2 sites owned by us, 8 sites associated with our former graphics or semiconductor locations and 4 treatment<br />
or disposal sites not owned by us that contain hazardous substances allegedly attributable to us from past operations.<br />
Based on an assessment of relevant factors, we have estimated that our discounted liability under the Comprehensive<br />
Environmental Response, Compensation and Liability Act (commonly known as the “Superfund Act”) and other<br />
environmental statutes and regulations for identified sites, using a 7.5 percent discount rate, is approximately<br />
$4.5 million. The current portion of this liability is included in the “Other accrued items” line item and the noncurrent<br />
portion is included in the “Other long-term liabilities” line item in our Consolidated Balance Sheet. The<br />
expected aggregate undiscounted amount that will be incurred over the next 10 years is approximately $6.1 million.<br />
The expected payments for the next five years are: fiscal 2012 — $0.8 million; fiscal 2013 — $0.9 million; fiscal<br />
2014 — $1.2 million; fiscal 2015 — $0.7 million; and fiscal 2016 — $0.6 million; and the aggregate amount<br />
thereafter is approximately $1.9 million. The relevant factors we considered in estimating our potential liabilities<br />
under the Superfund Act and other environmental statutes and regulations include cost-sharing agreements with<br />
other parties and the potential indemnification from successor and predecessor owners of these sites. We do not<br />
70
NOTES TO CONSOLIDATED FINANCIAL STATEMENTS (Continued)<br />
believe that any uncertainties regarding these relevant factors will materially affect our potential liability under the<br />
Superfund Act and other environmental statutes and regulations.<br />
Financial Guarantees and Commercial Commitments — Financial guarantees are contingent commitments<br />
issued to guarantee the performance of a customer to a third party in borrowing arrangements, such as commercial<br />
paper issuances, bond financings and similar transactions. As of July 1, 2011, there were no such contingent<br />
commitments accrued for in our Consolidated Balance Sheet.<br />
We have entered into commercial commitments in the normal course of business including surety bonds,<br />
standby letter of credit agreements and other arrangements with financial institutions and customers primarily<br />
relating to the guarantee of future performance on certain contracts to provide products and services to customers<br />
and to obtain insurance policies with our insurance carriers. As of July 1, 2011, we had total commercial<br />
commitments, including debt and performance guarantees, of $740.3 million.<br />
Financial Instruments and Risk Management — In the normal course of doing business, we are exposed to<br />
global market risks, including the effect of changes in foreign currency exchange rates. We use derivative<br />
instruments to manage our exposure to such risks and formally document all relationships between hedging<br />
instruments and hedged items, as well as the risk-management objective and strategy for undertaking hedge<br />
transactions. We recognize all derivatives in our Consolidated Balance Sheet at fair value. Derivatives that are not<br />
hedges must be adjusted to fair value through income. If the derivative is a hedge, depending on the nature of the<br />
hedge, changes in the fair value of the derivative are either offset against the change in fair value of assets,<br />
liabilities or firm commitments through earnings or recognized in other comprehensive income until the hedged item<br />
is recognized in earnings. The ineffective portion of a derivative’s change in fair value is immediately recognized in<br />
earnings. We do not hold or issue derivatives for trading purposes. See Note 19: Derivative Instruments and<br />
Hedging Activities for additional information regarding our use of derivative instruments.<br />
Income From Continuing Operations Per Share — For all periods presented in this Report, income from<br />
continuing operations per share is computed using the two-class method as it is the more dilutive of the treasury<br />
stock or two-class methods. The two-class method of computing income from continuing operations per share is an<br />
earnings allocation formula that determines income from continuing operations per share for common stock and any<br />
participating securities according to dividends paid and participation rights in undistributed earnings. Our restricted<br />
stock awards and restricted stock unit awards, as well as our performance share awards and performance share unit<br />
awards granted prior to fiscal 2011, meet the definition of participating securities and are included in the<br />
computations of income from continuing operations per basic and diluted common share. Our performance share<br />
awards and performance share unit awards granted beginning in fiscal 2011 do not meet the definition of<br />
participating securities because they do not contain rights to receive nonforfeitable dividends and, therefore, are<br />
excluded from the computations of income from continuing operations per basic and diluted common share. Under<br />
the two-class method, income from continuing operations per common share is computed by dividing the sum of<br />
distributed earnings to common shareholders and undistributed earnings allocated to common shareholders by the<br />
weighted average number of common shares outstanding for the period. In applying the two-class method,<br />
undistributed earnings are allocated to both common shares and participating securities based on the weighted<br />
average shares outstanding during the period. See Note 15: Income From Continuing Operations Per Share for<br />
additional information.<br />
Reclassifications — Certain prior-year amounts have been reclassified in our Consolidated Financial Statements<br />
to conform to current-year classifications.<br />
NOTE 2: ACCOUNTING CHANGES OR RECENT ACCOUNTING PRONOUNCEMENTS<br />
Adoption of New Accounting Standards<br />
In the first quarter of fiscal 2011, we adopted the following accounting standards, neither of which had a<br />
material impact on our financial position, results of operations or cash flows:<br />
• The accounting standard that revises accounting and reporting requirements for arrangements with multiple<br />
deliverables. This standard allows the use of an estimated selling price to determine the selling price of a<br />
deliverable in cases where neither vendor-specific objective evidence nor third-party evidence is available.<br />
Additionally, this standard requires the total selling price of a multiple-deliverable arrangement to be<br />
allocated at the inception of the arrangement to all deliverables based on relative selling prices.<br />
71
NOTES TO CONSOLIDATED FINANCIAL STATEMENTS (Continued)<br />
• The accounting standard that clarifies which revenue allocation and measurement guidance should be used<br />
for arrangements that contain both tangible products and software, in cases where the software is more than<br />
incidental to the tangible product as a whole. More specifically, if the software sold with or embedded within<br />
the tangible product is essential to the functionality of the tangible product, then this software, as well as<br />
undelivered software elements that relate to this software, are excluded from the scope of existing software<br />
revenue guidance.<br />
Accounting Standards Issued But Not Yet Effective<br />
In May 2011, the Financial Accounting Standards Board (“FASB”) issued an accounting standards update that<br />
generally aligns the principles for fair value measurements and related disclosure requirements under U.S. GAAP<br />
and International Financial Reporting Standards (“IFRS”). The amendments in this update include clarifications of<br />
the FASB’s intent about the application of existing fair value measurements and disclosure requirements and<br />
changes to particular principles or requirements for measuring fair value or for disclosing information about fair<br />
value measurements. Expanded disclosure requirements include disclosures of all transfers between Levels 1 and 2<br />
of the fair value hierarchy, disclosure of the hierarchy classification for items whose fair value is not recorded on<br />
the balance sheet but is disclosed in the notes, and various quantitative and qualitative disclosures pertaining to<br />
Level 3 measurements. This update is to be applied prospectively and is effective for interim and annual reporting<br />
periods beginning after December 15, 2011, which for us is our third quarter of fiscal 2012. We do not currently<br />
anticipate that the adoption of this update will materially impact our financial position, results of operations or cash<br />
flows.<br />
In June 2011, the FASB issued an accounting standards update that requires entities to present components of<br />
net income, components of other comprehensive income (“OCI”) and total comprehensive income in one continuous<br />
statement or two separate but consecutive statements. Entities will no longer be allowed to present OCI in the<br />
statement of equity. Additionally, this update requires entities to present on the face of the financial statements<br />
reclassification adjustments for items that are reclassified from OCI to net income in the statement(s) where the<br />
components of net income and OCI are presented. This update is to be applied retrospectively and is effective for<br />
fiscal years, and interim reporting periods within those years, beginning after December 15, 2011, which for us is<br />
our fiscal 2013. The adoption of this update will not impact our financial position, results of operations or cash<br />
flows.<br />
NOTE 3: DISCONTINUED OPERATIONS<br />
On March 31, 2009, we announced that our Board of Directors approved the Spin-off of all the shares of<br />
HSTX owned by us to our shareholders. On May 27, 2009, we completed the Spin-off through the distribution of<br />
our ownership of approximately 56 percent of the outstanding shares of HSTX in the form of a taxable pro rata<br />
dividend to our shareholders. Each of our shareholders received approximately 0.248418 of a share of HSTX<br />
Class A common stock for each share of our common stock such shareholder held as of 5:30 p.m. Eastern Time on<br />
May 13, 2009, the record date for the Spin-off. The distribution ratio was based on the number of shares of HSTX<br />
Class B common stock owned by us, which we exchanged for an equal number of shares of HSTX Class A<br />
common stock prior to the distribution in order to effect the Spin-off, divided by the number of shares of our<br />
common stock and common stock equivalents outstanding on the record date. Our shareholders of record on the<br />
record date received cash in lieu of any fraction of a HSTX share that they would have otherwise received in the<br />
Spin-off. In aggregate, we distributed 32,913,377 shares of HSTX Class A common stock to our shareholders. Based<br />
upon the $5.26 per share closing price for the HSTX Class A common stock on the NASDAQ Global Market on<br />
May 26, 2009, the day prior to the date of the distribution, the aggregate market value of the shares distributed was<br />
$173.1 million. Our historical financial results have been restated to account for HSTX as discontinued operations<br />
for all periods presented in this Report.<br />
Prior to the Spin-off of HSTX, as of the end of the second quarter of fiscal 2009, based on the current global<br />
economic environment and the decline of the market capitalization of HSTX, we performed an interim review for<br />
impairment of HSTX’s goodwill and its other indefinite-lived intangible assets, consisting solely of the Stratex trade<br />
name. To test for potential impairment of HSTX’s goodwill, we determined the fair value of HSTX based on<br />
projected discounted cash flows and market-based multiples applied to sales and earnings. The results indicated an<br />
impairment of goodwill because the current carrying value of the reporting unit exceeded its fair value. We then<br />
allocated this fair value to HSTX’s underlying assets and liabilities to determine the implied fair value of goodwill,<br />
resulting in a $279.0 million charge to write down all of HSTX’s goodwill. We determined the fair value of the<br />
Stratex trade name by performing a projected discounted cash flow analysis based on the relief-from-royalty<br />
72
NOTES TO CONSOLIDATED FINANCIAL STATEMENTS (Continued)<br />
approach, resulting in a $22.0 million charge to write down a majority of the carrying value of the Stratex trade<br />
name. Substantially all of the goodwill and the Stratex trade name were recorded in connection with the<br />
combination of Stratex and our Microwave Communications Division in January 2007.<br />
Summarized financial information for our discontinued operations is as follows:<br />
2009<br />
(In millions)<br />
Revenue from product sales and services ........................................ $594.6<br />
Loss before income taxes and noncontrolling interest ............................... $(340.8)<br />
Income taxes. ............................................................<br />
Loss on the disposition of discontinued operations, including income tax expense of<br />
(33.6)<br />
$11.1 million ........................................................... (62.6)<br />
Discontinued operations, net of income taxes ..................................... (437.0)<br />
Noncontrolling interest in discontinued operations, net of income taxes. .................<br />
Discontinued operations attributable to Harris Corporation common shareholders, net of<br />
162.5<br />
income taxes ........................................................... $(274.5)<br />
Unless otherwise specified, the information set forth in the other Notes relates solely to our continuing<br />
operations.<br />
NOTE 4: BUSINESS COMBINATIONS<br />
During fiscal 2011 we made the following significant acquisitions:<br />
• Acquisition of CapRock. On July 30, 2010, we acquired privately held CapRock Holdings, Inc. and its<br />
subsidiaries, including CapRock Communications, Inc. (collectively, “CapRock”), a global provider of<br />
mission-critical, managed satellite communications services for the government, energy and maritime<br />
industries. CapRock’s solutions include broadband Internet access, voice over Internet Protocol (“VOIP”)<br />
telephony, wideband networking and real-time video, delivered to nearly 2,000 customer sites around the<br />
world. The acquisition of CapRock increased the breadth of our assured communications» capabilities, while<br />
enabling us to enter new vertical markets and increase our international presence. The total net purchase<br />
price for CapRock was $517.5 million. Our fiscal 2011 results of operations included revenue of<br />
$357.0 million and a pre-tax loss of $16.3 million (including $21.9 million of acquisition-related charges)<br />
associated with CapRock for the eleven-month period following the date of acquisition. We report CapRock<br />
as part of Managed Satellite and Terrestrial Communications Solutions under our Integrated Network<br />
Solutions segment.<br />
• Acquisition of Schlumberger GCS. On April 4, 2011, we acquired from Schlumberger B.V. and its affiliates<br />
(“Schlumberger”) substantially all of the assets of the Schlumberger group’s Global Connectivity Services<br />
business (“Schlumberger GCS”), a provider of satellite and terrestrial communications services for the<br />
worldwide energy industry. The total net purchase price for Schlumberger GCS was $380.6 million, subject<br />
to post-closing adjustments. Our fiscal 2011 results of operations include revenue of $34.6 million and a pretax<br />
loss of $12.5 million (including $17.0 million of acquisition-related charges) associated with<br />
Schlumberger GCS for the three-month period following the date of acquisition. We report Schlumberger<br />
GCS as part of Managed Satellite and Terrestrial Communications Solutions under our Integrated Network<br />
Solutions segment.<br />
• Acquisition of Carefx. Also on April 4, 2011, we acquired privately held Carefx Corporation (“Carefx”), a<br />
provider of interoperability workflow solutions for government and commercial healthcare providers. Carefx’s<br />
solution suite is used by more than 800 hospitals, healthcare systems and health information exchanges<br />
across North America, Europe and Asia. The acquisition expanded our presence in government healthcare,<br />
provided entry into the commercial healthcare market and is expected to leverage the healthcare<br />
interoperability workflow products offered by Carefx and the broader scale of enterprise intelligence solutions<br />
and services that we provide. The total net purchase price for Carefx was $152.6 million, subject to postclosing<br />
adjustments. We report Carefx as part of Healthcare Solutions under our Integrated Network<br />
Solutions segment.<br />
73
NOTES TO CONSOLIDATED FINANCIAL STATEMENTS (Continued)<br />
The following tables provide further detail of these acquisitions in fiscal 2011:<br />
CapRock Schlumberger GCS<br />
(In millions)<br />
Carefx<br />
Date of acquisition .................... 7/30/10 4/4/11 4/4/11<br />
Reporting business segment. ............. Integrated Integrated Integrated<br />
Network Solutions Network Solutions Network Solutions<br />
Cash consideration paid to former owners . . . $540.2 $384.6 $153.8<br />
Less cash acquired ....................<br />
Total net purchase price paid as of July 1,<br />
(22.7) (4.0) (1.2)<br />
2011 . . . ..........................<br />
Estimated post-closing acquired cash<br />
517.5 380.6 152.6<br />
true-up . .......................... — — 0.7<br />
Total estimated net purchase price .........<br />
Allocation of purchase price:<br />
$517.5 $380.6 $153.3<br />
Accounts and notes receivable .......... $ 41.3 $ 4.8 $ 5.8<br />
Inventories ........................ 36.6 3.9 4.4<br />
Other current assets. ................. 4.3 4.2 0.3<br />
Current deferred income taxes .......... 14.3 — 1.5<br />
Property, plant and equipment .......... 59.1 33.7 —<br />
Goodwill ......................... 381.9 268.3 118.8<br />
Identifiable intangible assets ........... 131.5 75.4 31.4<br />
Other assets ....................... — — 0.1<br />
Total assets acquired ................... 669.0 390.3 162.3<br />
Accounts payable and accrued expenses. . . 88.6 5.4 4.7<br />
Advance payments and unearned income . . 3.3 — 2.8<br />
Non-current deferred income taxes. ...... 50.1 4.3 0.6<br />
Other liabilities ..................... 9.5 — 0.9<br />
Total liabilities acquired ................ 151.5 9.7 9.0<br />
Net assets acquired .................... $517.5 $380.6 $153.3<br />
CapRock Schlumberger GCS Carefx<br />
Weighted<br />
Average<br />
Amortization<br />
Period Total<br />
Weighted<br />
Average<br />
Amortization<br />
Period Total<br />
Weighted<br />
Average<br />
Amortization<br />
Period Total<br />
(In years) (In millions) (In years) (In millions) (In years) (In millions)<br />
Identifiable Intangible Assets:<br />
Customer relationships ..... 16.0 $ 68.0 13.0 $66.7 11.0 $ 7.1<br />
Contract backlog ......... 5.0 49.0 2.0 7.2 4.5 10.6<br />
Trade names ............ 5.0 14.0 6.0 0.2 3.5 2.9<br />
Developed technology ..... 6.0 1.3 4.5 10.8<br />
Other. .................<br />
Weighted average amortization<br />
15.0 0.5<br />
period and total .......... 10.7 $131.5 11.8 $75.4 5.9 $31.4<br />
The purchase price for the CapRock acquisition gives effect to post-closing adjustments while the purchase<br />
prices for the Schlumberger GCS and Carefx acquisitions remain subject to post-closing adjustments. The purchase<br />
price allocations for all of these acquisitions are preliminary and subject to changes in the fair value of working<br />
capital and other assets and liabilities on the effective dates, completion of an appraisal of assets acquired and<br />
liabilities assumed, and final valuation of intangible assets.<br />
74
NOTES TO CONSOLIDATED FINANCIAL STATEMENTS (Continued)<br />
Pro Forma Results (Unaudited)<br />
The following summary, prepared on a pro forma basis, presents our unaudited consolidated results of<br />
operations as if the acquisitions of CapRock and Schlumberger GCS had been completed as of the beginning of<br />
fiscal 2010, after including in fiscal 2010 integration and other costs associated with these acquisitions, and after<br />
including the impact of adjustments such as amortization of intangible assets and interest expense on related<br />
borrowings and, in each case, the related income tax effects. This pro forma presentation does not include any<br />
impact of transaction synergies. In the following table, “income from continuing operations” refers to income from<br />
continuing operations attributable to Harris Corporation common shareholders.<br />
2011 2010<br />
(In millions, except per<br />
share amounts)<br />
Revenue from product sales and services — as reported ..................... $5,924.6 $5,206.1<br />
Revenue from product sales and services — pro forma ...................... $6,082.4 $5,750.8<br />
Income from continuing operations — as reported. ......................... $ 588.0 $ 561.6<br />
Income from continuing operations — pro forma .......................... $ 595.8 $ 539.3<br />
Income from continuing operations per diluted common share — as reported ...... $ 4.60 $ 4.28<br />
Income from continuing operations per diluted common share — pro forma ...... $ 4.66 $ 4.11<br />
The pro forma results are not necessarily indicative of our results of operations had we owned CapRock and<br />
Schlumberger GCS for the entire periods presented.<br />
During fiscal 2009 we made the following significant acquisition:<br />
• Acquisition of Tyco Electronics Wireless Systems Business. On May 29, 2009, we acquired substantially all of the<br />
assets of the Tyco Electronics wireless systems business (“Wireless Systems”) (formerly known as M/A-COM), an<br />
established provider of mission-critical wireless communications systems for law enforcement, fire and rescue,<br />
public service, utility and transportation markets. In connection with the acquisition, we assumed liabilities<br />
primarily related to Wireless Systems. We did not assume the State of New York wireless network contract<br />
awarded to Wireless Systems in December 2004. The total purchase price for Wireless Systems was<br />
$674.9 million. We report Wireless Systems, which we now call Public Safety and Professional Communications,<br />
within our RF Communications segment. We believe the acquisition created a powerful supplier of end-to-end<br />
wireless network solutions to the global land mobile radio systems market.<br />
The goodwill resulting from all the above acquisitions was associated primarily with the acquired companies’<br />
market presence and leading positions, growth opportunities in the markets in which the acquired companies<br />
operated, experienced work forces and established operating infrastructures. The goodwill related to the<br />
Schlumberger GCS and Wireless Systems acquisitions is deductible for tax purposes, the goodwill related to the<br />
Carefx acquisition is nondeductible for tax purposes, and most of the goodwill related to the CapRock acquisition is<br />
nondeductible for tax purposes.<br />
NOTE 5: RECEIVABLES<br />
Receivables are summarized below:<br />
2011 2010<br />
(In millions)<br />
Accounts receivable. .................................................. $703.4 $613.0<br />
Unbilled costs on cost-plus contracts ...................................... 138.5 125.1<br />
Notes receivable due within one year, net. .................................. 6.5 7.9<br />
848.4 746.0<br />
Less allowances for collection losses ...................................... (11.9) (10.0)<br />
$836.5 $736.0<br />
We expect to bill substantially all unbilled costs outstanding on cost-plus contracts at July 1, 2011 during fiscal<br />
2012.<br />
75
NOTES TO CONSOLIDATED FINANCIAL STATEMENTS (Continued)<br />
NOTE 6: INVENTORIES<br />
Inventories are summarized below:<br />
2011 2010<br />
(In millions)<br />
Unbilled costs and accrued earnings on fixed-price contracts .................... $381.0 $295.3<br />
Finished products .................................................... 137.2 134.6<br />
Work in process ..................................................... 60.1 59.7<br />
Raw materials and supplies ............................................. 142.5 125.7<br />
$720.8 $615.3<br />
Unbilled costs and accrued earnings on fixed-price contracts are net of progress payments of $85.1 million at<br />
July 1, 2011 and $35.8 million at July 2, 2010.<br />
NOTE 7: PROPERTY, PLANT AND EQUIPMENT<br />
Property, plant and equipment are summarized below:<br />
2011 2010<br />
(In millions)<br />
Land . .......................................................... $ 14.6 $ 13.1<br />
Software capitalized for internal use .................................... 121.0 85.7<br />
Buildings. ....................................................... 493.4 396.6<br />
Machinery and equipment ........................................... 1,087.4 860.2<br />
1,716.4 1,355.6<br />
Less allowances for depreciation and amortization ......................... (843.6) (745.9)<br />
$ 872.8 $ 609.7<br />
Depreciation and amortization expense related to property, plant and equipment was $135.4 million,<br />
$110.0 million and $93.5 million in fiscal 2011, 2010 and 2009, respectively.<br />
NOTE 8: GOODWILL<br />
We test goodwill and other indefinite-lived intangible assets at least annually for impairment. See Note 3:<br />
Discontinued Operations for information regarding impairment of HSTX’s goodwill and its other indefinite-lived<br />
intangible assets recorded in fiscal 2009. See Note 22: Impairment of Goodwill and Other Long-Lived Assets for<br />
information regarding impairment of our Broadcast and New Media Solutions reporting unit’s goodwill recorded in<br />
fiscal 2009.<br />
As discussed further in Note 25: Business Segments in these Notes, effective for the third quarter of fiscal 2011,<br />
we changed our operating segment reporting structure, which also changed certain identified reporting units. As a<br />
result of these changes, we reallocated goodwill to the affected reporting units using the relative fair value approach,<br />
which resulted in changes in the goodwill balances by business segment at July 3, 2009 and at July 2, 2010 as<br />
presented below from amounts previously reported.<br />
76
NOTES TO CONSOLIDATED FINANCIAL STATEMENTS (Continued)<br />
Changes in the carrying amount of goodwill for the fiscal years ended July 1, 2011 and July 2, 2010, by<br />
business segment, were as follows:<br />
RF<br />
Communications<br />
Integrated<br />
Network<br />
Solutions<br />
Government<br />
Communications<br />
Systems Total<br />
Balance at July 3, 2009 — net of impairment losses. .... $411.6 $<br />
(In millions)<br />
844.3 $251.2 $1,507.1<br />
Goodwill acquired during the period .............. 4.1 — 39.5 43.6<br />
Currency translation adjustments .................<br />
Other (including true-ups of previously estimated<br />
3.9 17.2 1.8 22.9<br />
purchase price allocations) .................... 3.0 — (0.4) 2.6<br />
Balance at July 2, 2010 — net of impairment losses. .... 422.6 861.5 292.1 1,576.2<br />
Goodwill acquired during the period .............. — 786.9 — 786.9<br />
Currency translation adjustments .................<br />
Other (including true-ups of previously estimated<br />
1.8 15.9 0.8 18.5<br />
purchase price allocations) .................... — (0.2) — (0.2)<br />
Balance at July 1, 2011 — net of impairment losses. .... $424.4 $1,664.1 $292.9 $2,381.4<br />
Balance at July 1, 2011 — before impairment losses .... $424.4 $1,825.0 $292.9 $2,542.3<br />
Accumulated impairment losses ................... — (160.9) — (160.9)<br />
Balance at July 1, 2011 — net of impairment losses. .... $424.4 $1,664.1 $292.9 $2,381.4<br />
The goodwill resulting from acquisitions was associated primarily with the acquired companies’ market<br />
presence and leading positions, growth opportunities in the markets in which the acquired companies operated,<br />
experienced work forces and established operating infrastructures. The goodwill related to the Schlumberger GCS<br />
and Wireless Systems acquisitions is deductible for tax purposes, the goodwill related to the Carefx acquisition is<br />
nondeductible for tax purposes, and most of the goodwill related to the CapRock acquisition is nondeductible for tax<br />
purposes.<br />
In the table above, the accumulated impairment losses in our Integrated Network Solutions segment related to<br />
Broadcast and New Media Solutions and were recorded in the fourth quarter of fiscal 2009.<br />
NOTE 9: INTANGIBLE ASSETS<br />
Intangible assets subject to amortization and not subject to amortization were as follows:<br />
Gross<br />
Carrying<br />
Amount<br />
2011 2010<br />
Accumulated<br />
Amortization Net<br />
Gross<br />
Carrying<br />
Amount<br />
Accumulated<br />
Amortization Net<br />
(In millions)<br />
Customer relationships ................. $374.2 $ 90.0 $284.2 $229.7 $ 66.2 $163.5<br />
Developed technologies ................ 181.1 86.2 94.9 173.3 77.8 95.5<br />
Contract backlog ..................... 142.8 52.9 89.9 57.5 30.6 26.9<br />
Trade names ........................ 41.7 9.1 32.6 15.8 4.8 11.0<br />
Other ............................. 6.1 5.7 0.4 8.1 7.6 0.5<br />
Total subject to amortization ............ 745.9 243.9 502.0 484.4 187.0 297.4<br />
Total not subject to amortization ......... 0.4 — 0.4 0.4 — 0.4<br />
Total intangible assets ................. $746.3 $243.9 $502.4 $484.8 $187.0 $297.8<br />
Amortization expense related to intangible assets was $68.5 million, $49.6 million and $43.3 million in fiscal<br />
2011, 2010 and 2009, respectively.<br />
77
NOTES TO CONSOLIDATED FINANCIAL STATEMENTS (Continued)<br />
Future estimated amortization expense for intangible assets is as follows:<br />
Total<br />
(In millions)<br />
Fiscal Years:<br />
2012 ................................................................... $ 83.2<br />
2013 ................................................................... 79.0<br />
2014 ................................................................... 66.5<br />
2015 ................................................................... 64.1<br />
2016 ................................................................... 46.7<br />
Thereafter ............................................................... 162.5<br />
Total ................................................................... $502.0<br />
NOTE 10: ACCRUED WARRANTIES<br />
Changes in our warranty liability, which is included as a component of the “Other accrued items” line item in<br />
our Consolidated Balance Sheet, during fiscal 2011 and 2010, were as follows:<br />
2011 2010<br />
(In millions)<br />
Balance at beginning of the fiscal year ..................................... $73.1 $ 65.5<br />
Warranty provision for sales made during the fiscal year ........................ 19.6 28.4<br />
Settlements made during the fiscal year. ....................................<br />
Other adjustments to the warranty liability, including those for acquisitions and foreign<br />
(38.7) (40.3)<br />
currency translation, during the fiscal year ................................. (1.2) 19.5<br />
Balance at the end of the fiscal year ....................................... $52.8 $ 73.1<br />
NOTE 11: CREDIT ARRANGEMENTS<br />
364-Day Revolving Credit Agreement: On September 29, 2010, we entered into a $300 million senior<br />
unsecured 364-day revolving credit agreement (the “364-Day Revolving Credit Agreement”) with a syndicate of<br />
lenders. The 364-Day Revolving Credit Agreement provides for the extension of credit to us in the form of<br />
revolving loans at any time and from time to time during the term of the 364-Day Revolving Credit Agreement, in<br />
an aggregate principal amount at any time outstanding not to exceed $300 million. Borrowings under the 364-Day<br />
Revolving Credit Agreement will be denominated in U.S. Dollars. The 364-Day Revolving Credit Agreement may<br />
be used for working capital and other general corporate purposes (excluding hostile acquisitions) and may also be<br />
used to support any commercial paper that we may issue.<br />
At our election, borrowings under the 364-Day Revolving Credit Agreement will bear interest either at LIBOR<br />
plus an applicable margin or at the base rate plus an applicable margin. The interest rate margin over LIBOR,<br />
initially set at 1.75 percent, may increase (to a maximum amount of 2.25 percent) or decrease (to a minimum<br />
amount of 1.25 percent) based on changes in the ratings of our senior unsecured long-term debt securities (“Senior<br />
Debt Ratings”). The base rate is a fluctuating rate equal to the highest of (i) the federal funds rate plus 0.50 percent,<br />
(ii) SunTrust Bank’s publicly announced prime lending rate for U.S. Dollars or (iii) LIBOR for an interest period of<br />
one month plus 1.00 percent. The interest rate margin over the base rate, initially set at 0.75 percent, may increase<br />
(to a maximum amount of 1.25 percent) or decrease (to a minimum amount of 0.25 percent) based on our Senior<br />
Debt Ratings.<br />
The 364-Day Revolving Credit Agreement contains certain customary covenants, including covenants limiting:<br />
certain liens on our assets; certain mergers, consolidations or sales of assets; certain sale and leaseback transactions;<br />
certain vendor financing investments; and certain investments in unrestricted subsidiaries. The 364-Day Revolving<br />
Credit Agreement also requires that we not permit our ratio of consolidated total indebtedness to total capital, each<br />
as defined, to be greater than 0.60 to 1.00 and not permit our ratio of consolidated EBITDA to consolidated net<br />
interest expense, each as defined, to be less than 3.00 to 1.00 (measured on the last day of each fiscal quarter for the<br />
rolling four-quarter period then ending). We were in compliance with the covenants in the 364-Day Revolving<br />
Credit Agreement in fiscal 2011. The 364-Day Revolving Credit Agreement contains certain events of default,<br />
including: failure to make payments; failure to perform or observe terms, covenants and agreements; material<br />
78
NOTES TO CONSOLIDATED FINANCIAL STATEMENTS (Continued)<br />
inaccuracy of any representation or warranty; payment default under other indebtedness with a principal amount in<br />
excess of $75 million, other default under such other indebtedness that permits acceleration of such indebtedness, or<br />
acceleration of such other indebtedness; occurrence of one or more final judgments or orders for the payment of<br />
money in excess of $75 million that remain unsatisfied; incurrence of certain ERISA liability in excess of<br />
$75 million; any bankruptcy or insolvency; or a change of control, including if a person or group becomes the<br />
beneficial owner of 25 percent or more of our voting stock. If an event of default occurs the lenders may, among<br />
other things, terminate their commitments and declare all outstanding borrowings to be immediately due and<br />
payable together with accrued interest and fees. All amounts borrowed or outstanding under the 364-Day Revolving<br />
Credit Agreement are due and mature on September 28, 2011, unless the commitments are terminated earlier either<br />
at our request or if certain events of default occur. At July 1, 2011, we had no borrowings outstanding under the<br />
364-Day Revolving Credit Agreement.<br />
2008 Credit Agreement: On September 10, 2008, we entered into a five-year, senior unsecured revolving<br />
credit agreement (the “2008 Credit Agreement”) with a syndicate of lenders. The 2008 Credit Agreement provides<br />
for the extension of credit to us in the form of revolving loans, including swingline loans, and letters of credit at any<br />
time and from time to time during the term of the 2008 Credit Agreement, in an aggregate principal amount at any<br />
time outstanding not to exceed $750 million for both revolving loans and letters of credit, with a sub-limit of<br />
$50 million for swingline loans and $125 million for letters of credit. The 2008 Credit Agreement includes a<br />
provision pursuant to which, from time to time, we may request that the lenders in their discretion increase the<br />
maximum amount of commitments under the 2008 Credit Agreement by an amount not to exceed $500 million.<br />
Only consenting lenders (including new lenders reasonably acceptable to the administrative agent) will participate in<br />
any such increase. In no event will the maximum amount of credit extensions available under the 2008 Credit<br />
Agreement exceed $1.25 billion. The 2008 Credit Agreement may be used for working capital and other general<br />
corporate purposes (excluding hostile acquisitions) and to support any commercial paper that we may issue.<br />
Borrowings under the 2008 Credit Agreement may be denominated in U.S. Dollars, Euros, Sterling and any other<br />
currency acceptable to the administrative agent and the lenders, with a non-U.S. currency sub-limit of $150 million.<br />
We may designate certain wholly owned subsidiaries as borrowers under the 2008 Credit Agreement, and the<br />
obligations of any such subsidiary borrower must be guaranteed by Harris Corporation. We also may designate<br />
certain subsidiaries as unrestricted subsidiaries, which means certain of the covenants and representations in the<br />
2008 Credit Agreement do not apply to such subsidiaries.<br />
At our election, borrowings under the 2008 Credit Agreement denominated in U.S. Dollars will bear interest<br />
either at LIBOR plus an applicable margin or at the base rate plus an applicable margin. The interest rate margin<br />
over LIBOR, initially set at 0.50 percent, may increase (to a maximum amount of 1.725 percent) or decrease (to a<br />
minimum of 0.385 percent) based on our Senior Debt Ratings and on the degree of utilization under the 2008 Credit<br />
Agreement (“Utilization”). The base rate is a fluctuating rate equal to the higher of the federal funds rate plus<br />
0.50 percent or SunTrust Bank’s publicly announced prime lending rate for U.S. Dollars. The interest rate margin<br />
over the base rate is 0.00 percent, but if our Senior Debt Ratings fall to “BB+/Ba1” or below, then the interest rate<br />
margin over the base rate will increase to either 0.225 percent or 0.725 percent based on Utilization. Borrowings<br />
under the 2008 Credit Agreement denominated in a currency other than U.S. Dollars will bear interest at LIBOR<br />
plus the applicable interest rate margin over LIBOR described above. Letter of credit fees are also determined based<br />
on our Senior Debt Ratings and Utilization.<br />
The 2008 Credit Agreement contains certain customary covenants, including covenants limiting: certain liens<br />
on our assets; certain mergers, consolidations or sales of assets; certain sale and leaseback transactions; certain<br />
vendor financing investments; and certain investments in unrestricted subsidiaries. The 2008 Credit Agreement also<br />
requires that we not permit our ratio of consolidated total indebtedness to total capital, each as defined, to be greater<br />
than 0.60 to 1.00 and not permit our ratio of consolidated EBITDA to consolidated net interest expense, each as<br />
defined, to be less than 3.00 to 1.00 (measured on the last day of each fiscal quarter for the rolling four-quarter<br />
period then ending). We were in compliance with the covenants in the 2008 Credit Agreement in fiscal 2011. The<br />
2008 Credit Agreement contains certain events of default, including: failure to make payments; failure to perform or<br />
observe terms, covenants and agreements; material inaccuracy of any representation or warranty; payment default<br />
under other indebtedness with a principal amount in excess of $75 million, other default under such other<br />
indebtedness that permits acceleration of such indebtedness, or acceleration of such other indebtedness; occurrence<br />
of one or more final judgments or orders for the payment of money in excess of $75 million that remain unsatisfied;<br />
incurrence of certain ERISA liability in excess of $75 million; any bankruptcy or insolvency; or a change of control,<br />
including if a person or group becomes the beneficial owner of 25 percent or more of our voting stock. If an event<br />
of default occurs the lenders may, among other things, terminate their commitments and declare all outstanding<br />
79
NOTES TO CONSOLIDATED FINANCIAL STATEMENTS (Continued)<br />
borrowings to be immediately due and payable together with accrued interest and fees. All amounts borrowed or<br />
outstanding under the 2008 Credit Agreement are due and mature on September 10, 2013, unless the commitments<br />
are terminated earlier either at our request or if certain events of default occur. At July 1, 2011, we had no<br />
borrowings outstanding under the 2008 Credit Agreement, but we had $180.0 million of short-term debt outstanding<br />
under our commercial paper program, that was supported by our senior unsecured revolving credit facility under the<br />
2008 Credit Agreement.<br />
Other: We have an automatically effective, universal shelf registration statement, filed with the SEC on<br />
June 3, 2009, related to the potential future issuance of an indeterminate amount of securities, including debt<br />
securities, preferred stock, common stock, fractional interests in preferred stock represented by depositary shares and<br />
warrants to purchase debt securities, preferred stock or common stock.<br />
NOTE 12: SHORT-TERM DEBT<br />
Our short-term debt at July 1, 2011 was $180.0 million. The weighted-average interest rate for our short-term<br />
debt was 0.3 percent at July 1, 2011 and 0.4 percent at July 2, 2010.<br />
NOTE 13: LONG-TERM DEBT<br />
Long-term debt is summarized below:<br />
2011 2010<br />
(In millions)<br />
5.0% notes, due October 1, 2015 ...................................... $ 300.0 $ 300.0<br />
5.95% notes, due December 1, 2017 .................................... 400.0 400.0<br />
6.375% notes, due June 15, 2019 ...................................... 350.0 350.0<br />
4.4% notes, due December 15, 2020 .................................... 400.0 —<br />
7.0% debentures, due January 15, 2026 ................................. 100.0 100.0<br />
6.35% debentures, due February 1, 2028. ................................ 25.8 25.8<br />
6.15% notes, due December 15, 2040 ................................... 300.0 —<br />
Other. .......................................................... 16.3 1.5<br />
Total debt ....................................................... 1,892.1 1,177.3<br />
Less: current portion of debt ......................................... (4.9) (0.7)<br />
Total long-term debt ............................................... $1,887.2 $1,176.6<br />
The potential maturities of long-term debt, including the current portion, for the five years following fiscal<br />
2011 and, in total, thereafter are: $4.9 million in fiscal 2012; $7.8 million in fiscal 2013; $3.6 million in fiscal 2014;<br />
none in fiscal 2015; $300.0 million in fiscal 2016; and $1,575.8 million thereafter. All of our outstanding long-term<br />
debt is unsubordinated and unsecured with equal ranking.<br />
On December 3, 2010, we completed the issuance of $400 million in aggregate principal amount of<br />
4.4% Notes due December 15, 2020 (the “2020 Notes”) and $300 million in aggregate principal amount of<br />
6.15% Notes due December 15, 2040 (the “2040 Notes”). Interest on each of the 2020 Notes and the 2040 Notes is<br />
payable semi-annually in arrears on June 15 and December 15 of each year. We may redeem the 2020 Notes and/or<br />
the 2040 Notes at any time in whole or, from time to time, in part at the applicable “make-whole” redemption price.<br />
The applicable “make-whole” redemption price is equal to the greater of 100 percent of the principal amount of the<br />
notes being redeemed or the sum of the present values of the remaining scheduled payments of the principal and<br />
interest (other than interest accruing to the date of redemption) on the notes being redeemed, discounted to the<br />
redemption date on a semi-annual basis (assuming a 360-day year consisting of twelve 30-day months) at the<br />
Treasury Rate, as defined, plus 25 basis points in the case of the 2020 Notes and 35 basis points in the case of the<br />
2040 Notes. In each case, we will pay accrued interest on the principal amount of the notes being redeemed to the<br />
redemption date. In addition, upon a change of control combined with a below-investment-grade rating event, we<br />
may be required to make an offer to repurchase the notes at a price equal to 101 percent of the aggregate principal<br />
amount of the notes repurchased, plus accrued interest on the notes repurchased to the date of repurchase. We<br />
incurred $5.5 million and $4.8 million in debt issuance costs and discounts related to the issuance of the 2020 Notes<br />
and 2040 Notes, respectively, which are being amortized on a straight-line basis over the respective lives of the<br />
80
NOTES TO CONSOLIDATED FINANCIAL STATEMENTS (Continued)<br />
notes, which approximates the effective interest rate method, and are reflected as a portion of interest expense in our<br />
Consolidated Statement of Income.<br />
On June 9, 2009, we completed the issuance of $350 million in aggregate principal amount of 6.375% Notes<br />
due June 15, 2019. Interest on the notes is payable on June 15 and December 15 of each year. We may redeem the<br />
notes at any time in whole or, from time to time, in part at the “make-whole” redemption price. The “make-whole”<br />
redemption price is equal to the greater of 100 percent of the principal amount of the notes being redeemed or the<br />
sum of the present values of the remaining scheduled payments of the principal and interest (other than interest<br />
accruing to the date of redemption) on the notes being redeemed, discounted to the redemption date on a semiannual<br />
basis (assuming a 360-day year consisting of twelve 30-day months) at the Treasury Rate, as defined, plus<br />
37.5 basis points. In each case, we will pay accrued interest on the principal amount of the notes being redeemed to<br />
the redemption date. In addition, upon a change of control combined with a below-investment-grade rating event, we<br />
may be required to make an offer to repurchase the notes at a price equal to 101 percent of the aggregate principal<br />
amount of the notes repurchased, plus accrued interest on the notes repurchased to the date of repurchase. We<br />
incurred $4.1 million in debt issuance costs and discounts related to the issuance of the notes, which are being<br />
amortized on a straight-line basis over the life of the notes, which approximates the effective interest rate method,<br />
and are reflected as a portion of interest expense in our Consolidated Statement of Income.<br />
On December 5, 2007, we completed the issuance of $400 million in aggregate principal amount of<br />
5.95% Notes due December 1, 2017. Interest on the notes is payable on June 1 and December 1 of each year. We<br />
may redeem the notes at any time in whole or, from time to time, in part at the “make-whole” redemption price.<br />
The “make-whole” redemption price is equal to the greater of 100 percent of the principal amount of the notes<br />
being redeemed or the sum of the present values of the remaining scheduled payments of the principal and interest<br />
(other than interest accruing to the date of redemption) on the notes being redeemed, discounted to the redemption<br />
date on a semi-annual basis (assuming a 360-day year consisting of twelve 30-day months) at the Treasury Rate, as<br />
defined, plus 30 basis points. In each case, we will pay accrued interest on the principal amount of the notes being<br />
redeemed to the redemption date. In addition, upon a change of control combined with a below-investment-grade<br />
rating event, we may be required to make an offer to repurchase the notes at a price equal to 101 percent of the<br />
aggregate principal amount of the notes repurchased, plus accrued interest on the notes repurchased to the date of<br />
repurchase. In conjunction with the issuance of the notes, we entered into treasury lock agreements to protect<br />
against fluctuations in forecasted interest payments resulting from the issuance of ten-year, fixed-rate debt due to<br />
changes in the benchmark U.S. Treasury rate. These agreements were determined to be highly effective in offsetting<br />
changes in forecasted interest payments as a result of changes in the benchmark U.S. Treasury rate. Upon<br />
termination of these agreements on December 6, 2007, we recorded a loss of $5.5 million, net of income tax, in<br />
shareholders’ equity as a component of accumulated other comprehensive income. This loss, along with $5.0 million<br />
in debt issuance costs, is being amortized on a straight-line basis over the life of the notes, which approximates the<br />
effective interest rate method, and is reflected as a portion of interest expense in our Consolidated Statement of<br />
Income.<br />
On September 20, 2005, we completed the issuance of $300 million in aggregate principal amount of<br />
5.0% Notes due October 1, 2015. Interest on the notes is payable on April 1 and October 1 of each year. We may<br />
redeem the notes in whole, or in part, at any time at the “make-whole” redemption price. The “make-whole”<br />
redemption price is equal to the greater of 100 percent of the principal amount of the notes being redeemed or the<br />
sum of the present values of the remaining scheduled payments of the principal and interest (other than interest<br />
accruing to the date of redemption) on the notes being redeemed, discounted to the redemption date on a semiannual<br />
basis (assuming a 360-day year consisting of twelve 30-day months) at the Treasury Rate, as defined, plus<br />
15 basis points. In each case, we will pay accrued interest on the principal amount of the notes being redeemed to<br />
the redemption date. We incurred $4.1 million in debt issuance costs and discounts related to the issuance of the<br />
notes, which are being amortized on a straight-line basis over a ten-year period and reflected as a portion of interest<br />
expense in our Consolidated Statement of Income.<br />
In February 1998, we completed the issuance of $150 million in aggregate principal amount of<br />
6.35% Debentures due February 1, 2028. On December 5, 2007, we repurchased and retired $25.0 million in<br />
aggregate principal amount of the debentures. On February 1, 2008, we redeemed $99.2 million in aggregate<br />
principal amount of the debentures pursuant to the procedures for redemption at the option of the holders of the<br />
debentures. We may redeem the remaining $25.8 million in aggregate principal amount of the debentures in whole,<br />
or in part, at any time at a pre-determined redemption price.<br />
81
NOTES TO CONSOLIDATED FINANCIAL STATEMENTS (Continued)<br />
In January 1996, we completed the issuance of $100 million in aggregate principal amount of 7.0% Debentures<br />
due January 15, 2026. The debentures are not redeemable prior to maturity.<br />
NOTE 14: STOCK OPTIONS AND OTHER SHARE-BASED COMPENSATION<br />
As of July 1, 2011, we had two shareholder-approved employee stock incentive plans (“SIPs”) under which<br />
options or other share-based compensation was outstanding, and we had the following types of share-based awards<br />
outstanding under our SIPs: stock options, performance share awards, performance share unit awards, restricted<br />
stock awards and restricted stock unit awards. We believe that such awards more closely align the interests of<br />
employees with those of shareholders. Certain share-based awards provide for accelerated vesting if there is a<br />
change in control (as defined under our SIPs).<br />
Summary of Share-Based Compensation Expense<br />
The following table summarizes the amounts and classification of share-based compensation expense:<br />
2011 2010 2009<br />
(In millions)<br />
Total expense ................................................ $46.1 $ 35.3 $ 39.3<br />
Included in:<br />
Cost of product sales and services ............................... $ 4.2 $ 3.9 $ 3.5<br />
Engineering, selling and administrative expenses. .................... 41.9 31.4 35.8<br />
Income from continuing operations. .............................. 46.1 35.3 39.3<br />
Tax effect on share-based compensation expense ...................... (15.4) (11.7) (14.0)<br />
Total share-based compensation expense after-tax ...................... $30.7 $ 23.6 $ 25.3<br />
Compensation cost related to share-based compensation arrangements that was capitalized as part of inventory<br />
or fixed assets in fiscal 2011, 2010 and 2009 was not material.<br />
Shares of common stock remaining available for future issuance under our SIPs totaled 15,978,745 as of July 1,<br />
2011. In fiscal 2011, we issued an aggregate of 984,187 shares of common stock under the terms of our SIPs, which<br />
is net of shares withheld for tax purposes.<br />
Stock Options<br />
The following information relates to stock options that have been granted under shareholder-approved SIPs.<br />
Option exercise prices are equal to or greater than the fair market value of our common stock on the date the<br />
options are granted, using the closing stock price of our common stock. Options may be exercised for a period set at<br />
the time of grant, which generally ranges from seven to ten years after the date of grant, and they generally become<br />
exercisable in installments, which are typically 33.3 percent one year from the grant date, 33.3 percent two years<br />
from the grant date and 33.3 percent three years from the grant date.<br />
The fair value of each option award is estimated on the date of grant using the Black-Scholes-Merton optionpricing<br />
model which uses assumptions noted in the following table. Expected volatility is based on implied volatility<br />
from traded options on our common stock and the historical volatility of our stock price over the expected term of<br />
the options. The expected term of the options is based on historical observations of our common stock over the past<br />
ten years, considering average years to exercise for all options exercised, average years to cancellation for all<br />
options cancelled and average years remaining for outstanding options, which is calculated based on the weightedaverage<br />
vesting period plus the weighted-average of the difference between the vesting period and average years to<br />
82
NOTES TO CONSOLIDATED FINANCIAL STATEMENTS (Continued)<br />
exercise and cancellation. The risk-free interest rate for periods within the contractual life of the option is based on<br />
the U.S. Treasury yield curve in effect at the time of grant.<br />
A summary of the significant assumptions used in calculating the fair value of stock option grants under our<br />
SIPs is as follows:<br />
2011 2010 2009<br />
Expected dividends ................................................. 2.0% 2.1% 1.4%<br />
Expected volatility ................................................. 35.6% 38.2% 33.4%<br />
Risk-free interest rates .............................................. 1.5% 2.4% 2.6%<br />
Expected term (years) ............................................... 4.94 4.71 4.45<br />
A summary of stock option activity under our SIPs as of July 1, 2011 and changes during fiscal 2011 is as<br />
follows:<br />
Shares<br />
Weighted<br />
Average<br />
Exercise<br />
Price<br />
Per Share<br />
Weighted<br />
Average<br />
Remaining<br />
Contractual<br />
Term<br />
Aggregate<br />
Intrinsic Value<br />
(In years) (In millions)<br />
Stock options outstanding at July 2, 2010 ................ 7,027,509 $37.55<br />
Stock options forfeited or expired ...................... (417,268) $41.14<br />
Stock options granted ............................... 1,423,400 $43.32<br />
Stock options exercised ............................. (809,552) $26.76<br />
Stock options outstanding at July 1, 2011 ................ 7,224,089 $39.69 5.08 $55.59<br />
Stock options exercisable at July 1, 2011 ................ 4,406,774 $39.26 3.06 $39.84<br />
The weighted-average grant-date fair value was $11.75 per share, $10.38 per share and $11.38 per share for<br />
options granted during fiscal 2011, 2010 and 2009, respectively. The total intrinsic value of options exercised during<br />
fiscal 2011, 2010 and 2009 was $16.7 million, $16.4 million and $4.0 million, respectively, at the time of exercise.<br />
A summary of the status of our nonvested stock options at July 1, 2011 and changes during fiscal 2011 is as<br />
follows:<br />
Shares<br />
Weighted-<br />
Average<br />
Grant-Date<br />
Fair Value<br />
Per Share<br />
Nonvested stock options at July 2, 2010. .............................. 2,839,757 $11.76<br />
Stock options granted ............................................ 1,423,400 $11.75<br />
Stock options vested ............................................. (1,445,842) $12.33<br />
Nonvested stock options at July 1, 2011. .............................. 2,817,315 $11.46<br />
As of July 1, 2011, there was $32.3 million of total unrecognized compensation cost related to nonvested stock<br />
options granted under our SIPs. This cost is expected to be recognized over a weighted-average period of 1.58 years.<br />
The total fair value of stock options that vested during fiscal 2011, 2010 and 2009 was approximately $17.8 million,<br />
$16.8 million and $12.3 million, respectively.<br />
Restricted Stock Awards<br />
The following information relates to awards of restricted stock and restricted stock units that have been granted<br />
to employees under our SIPs. The restricted stock and restricted stock units are not transferable until vested and the<br />
restrictions lapse upon the achievement of continued employment over a specified time period.<br />
The fair value of each restricted stock grant is based on the closing price of our common stock on the date of<br />
grant and is amortized to compensation expense over the vesting period. At July 1, 2011, there were 712,447 shares<br />
of restricted stock outstanding.<br />
83
NOTES TO CONSOLIDATED FINANCIAL STATEMENTS (Continued)<br />
The fair value of each restricted stock unit, which can be distributed in cash or shares, is equal to the most<br />
probable estimate of intrinsic value at the time of distribution and is amortized to compensation expense over the<br />
vesting period. At July 1, 2011, we had 101,400 restricted stock units outstanding, all of which were payable in<br />
shares.<br />
A summary of the status of our restricted stock and restricted stock units at July 1, 2011 and changes during<br />
fiscal 2011 is as follows:<br />
Shares<br />
Weighted-<br />
Average<br />
Grant<br />
Price<br />
Per Share<br />
Restricted stock and restricted stock units outstanding at July 2, 2010 ........... 590,248 $42.61<br />
Restricted stock and restricted stock units granted ......................... 470,550 $44.73<br />
Restricted stock and restricted stock units vested .......................... (129,476) $51.46<br />
Restricted stock and restricted stock units forfeited ......................... (117,475) $43.97<br />
Restricted stock and restricted stock units outstanding at July 1, 2011 ........... 813,847 $42.23<br />
As of July 1, 2011, there was $19.1 million of total unrecognized compensation cost related to restricted stock<br />
and restricted stock unit awards under our SIPs. This cost is expected to be recognized over a weighted-average<br />
period of 1.64 years. The weighted-average grant date price per share of restricted stock and per unit of restricted<br />
stock units granted during fiscal 2011, 2010 and 2009 was $44.73, $36.45 and $50.57, respectively. The total fair<br />
value of restricted stock and restricted stock units that vested during fiscal 2011, 2010 and 2009 was approximately<br />
$6.7 million, $8.3 million and $5.1 million, respectively.<br />
Performance Share Awards<br />
The following information relates to awards of performance shares and performance share units that have been<br />
granted to employees under our SIPs. Generally, performance share and performance share unit awards are subject<br />
to performance criteria such as meeting predetermined operating income and return on invested capital targets (and<br />
total shareholder returns, for such awards granted beginning fiscal 2011) for a three-year performance period. These<br />
awards also generally vest at the expiration of the same three-year period. The final determination of the number of<br />
shares to be issued in respect of an award is determined by our Board of Directors or a committee of our Board of<br />
Directors.<br />
The fair value of each performance share is based on the closing price of our common stock on the date of<br />
grant and is amortized to compensation expense over the vesting period, if achievement of the performance<br />
measures is considered probable. At July 1, 2011, there were 847,627 performance shares outstanding.<br />
The fair value of each performance share unit, which can be distributed in cash or shares, is equal to the most<br />
probable estimate of intrinsic value at the time of distribution and is amortized to compensation expense over the<br />
vesting period, if achievement of the performance measures is considered probable. At July 1, 2011, there were<br />
50,670 performance share units outstanding, all of which were payable in shares.<br />
A summary of the status of our performance shares and performance share units at July 1, 2011 and changes<br />
during fiscal 2011 is as follows:<br />
Shares<br />
Weighted-<br />
Average<br />
Grant<br />
Price<br />
Per Share<br />
Performance shares and performance share units outstanding at July 2, 2010 ...... 979,954 $44.49<br />
Performance shares and performance share units granted .................... 210,348 $44.12<br />
Performance shares and performance share units vested ..................... (237,701) $58.74<br />
Performance shares and performance share units forfeited .................... (54,304) $40.21<br />
Performance shares and performance share units outstanding at July 1, 2011 ...... 898,297 $40.90<br />
84
NOTES TO CONSOLIDATED FINANCIAL STATEMENTS (Continued)<br />
As of July 1, 2011, there was $11.9 million of total unrecognized compensation cost related to performance<br />
share and performance share unit awards under our SIPs. This cost is expected to be recognized over a weightedaverage<br />
period of 1.04 years. The weighted-average grant date price per share of performance shares and per unit of<br />
performance share units granted during fiscal 2011, 2010 and 2009 was $44.12, $36.43 and $48.82, respectively.<br />
The total fair value of performance shares and performance share units that vested during fiscal 2011, 2010 and<br />
2009 was approximately $14.0 million, $13.0 million and $10.7 million, respectively.<br />
NOTE 15: INCOME FROM CONTINUING OPERATIONS PER SHARE<br />
The computations of income from continuing operations per share are as follows (in this Note 15, “income<br />
from continuing operations” refers to income from continuing operations attributable to Harris Corporation common<br />
shareholders):<br />
2011 2010 2009<br />
(In millions, except per share<br />
amounts)<br />
Income from continuing operations. ............................... $588.0 $561.6 $312.4<br />
Adjustments for participating securities outstanding ...................<br />
Income from continuing operations used in basic and diluted common share<br />
(7.2) (5.9) (2.1)<br />
calculations (A) ............................................ $580.8 $555.7 $310.3<br />
Basic weighted average common shares outstanding (B) ................ 125.3 129.0 132.3<br />
Impact of dilutive stock options .................................. 1.0 1.0 0.7<br />
Diluted weighted average common shares outstanding (C). .............. 126.3 130.0 133.0<br />
Income from continuing operations per basic common share (A)/(B) ....... $ 4.63 $ 4.31 $ 2.35<br />
Income from continuing operations per diluted common share (A)/(C). ..... $ 4.60 $ 4.28 $ 2.33<br />
Potential dilutive common shares primarily consist of employee stock options. Employee stock options to<br />
purchase approximately 3,274,962, 3,300,641 and 3,270,318 shares of our common stock were outstanding at the<br />
end of fiscal 2011, 2010 and 2009, respectively, but were not included as dilutive stock options in the computations<br />
of income from continuing operations per diluted common share because the effect would have been antidilutive as<br />
the options’ exercise prices exceeded the average market price of our common stock.<br />
NOTE 16: RESEARCH AND DEVELOPMENT<br />
Company-sponsored research and product development costs are expensed as incurred. These costs were<br />
$335.6 million, $325.8 million and $243.5 million in fiscal 2011, 2010 and 2009, respectively, and are included in<br />
the “Engineering, selling and administrative expenses” line item in our Consolidated Statement of Income.<br />
Customer-sponsored research and development costs are incurred pursuant to contractual arrangements and are<br />
accounted for principally by the cost-to-cost percentage-of-completion method. Customer-sponsored research and<br />
development costs incurred under U.S. Government-sponsored contracts require us to provide a product or service<br />
meeting certain defined performance or other specifications (such as designs). Customer-sponsored research and<br />
development was $647.3 million, $720.9 million and $759.2 million in fiscal 2011, 2010 and 2009, respectively.<br />
Customer-sponsored research and development is included in our revenue and cost of product sales and services.<br />
NOTE 17: INTEREST EXPENSE<br />
Total interest expense was $90.4 million, $72.1 million and $52.8 million in fiscal 2011, 2010 and 2009,<br />
respectively. Interest paid was $90.1 million, $69.8 million and $49.0 million in fiscal 2011, 2010 and 2009,<br />
respectively.<br />
NOTE 18: LEASE COMMITMENTS<br />
Total rental expense amounted to $52.7 million, $46.3 million and $31.5 million in fiscal 2011, 2010 and 2009,<br />
respectively. Future minimum rental commitments under leases with an initial lease term in excess of one year,<br />
primarily for land and buildings, amounted to approximately $223.2 million at July 1, 2011. These commitments for<br />
the five years following fiscal 2011 and, in total, thereafter are: fiscal 2012 — $51.0 million; fiscal 2013 —<br />
$39.1 million; fiscal 2014 — $32.2 million; fiscal 2015 — $25.1 million; fiscal 2016 — $18.2 million; and<br />
$57.6 million thereafter. These commitments do not contain any material rent escalations, rent holidays, contingent<br />
85
NOTES TO CONSOLIDATED FINANCIAL STATEMENTS (Continued)<br />
rent, rent concessions, leasehold improvement incentives or unusual provisions or conditions. We do not consider<br />
any of these individual leases material to our operations. Leasehold improvements made either at the inception of<br />
the lease or during the lease term are amortized over the current lease term, or estimated life, if shorter.<br />
NOTE 19: DERIVATIVE INSTRUMENTS AND HEDGING ACTIVITIES<br />
In the normal course of doing business, we are exposed to global market risks, including the effect of changes<br />
in foreign currency exchange rates. We use derivative instruments to manage our exposure to such risks and<br />
formally document all relationships between hedging instruments and hedged items, as well as the risk-management<br />
objective and strategy for undertaking hedge transactions. We recognize all derivatives in our Consolidated Balance<br />
Sheet at fair value. We do not hold or issue derivatives for trading purposes.<br />
At July 1, 2011, we had open foreign currency forward contracts with a notional amount of $83.9 million, of<br />
which $30.2 million were classified as fair value hedges and $53.7 million were classified as cash flow hedges. This<br />
compares with open foreign currency forward contracts with a notional amount of $46.5 million at July 2, 2010, of<br />
which $30.3 million were classified as fair value hedges and $16.2 million were classified as cash flow hedges. At<br />
July 1, 2011, contract expiration dates ranged from less than 1 month to 33 months with a weighted average<br />
contract life of 9 months.<br />
Balance Sheet Hedges<br />
To manage the exposure in our balance sheet to risks from changes in foreign currency exchange rates, we<br />
implement fair value hedges. More specifically, we use foreign currency forward contracts and options to hedge<br />
certain balance sheet items, including foreign currency denominated accounts receivable and inventory. Changes in<br />
the value of the derivatives and the related hedged items are reflected in earnings, in the “Cost of product sales” line<br />
item in our Consolidated Statement of Income. As of July 1, 2011, we had outstanding foreign currency forward<br />
contracts denominated in the Euro, British Pound, Canadian Dollar and Australian Dollar to hedge certain balance<br />
sheet items. The net gains or losses on foreign currency forward contracts designated as fair value hedges were not<br />
material in fiscal 2011, 2010 or 2009. In addition, no amounts were recognized in earnings in fiscal 2011, 2010 and<br />
2009 related to hedged firm commitments that no longer qualify as fair value hedges.<br />
Cash Flow Hedges<br />
To manage our exposure to currency risk and market fluctuation risk associated with anticipated cash flows that<br />
are probable of occurring in the future, we implement cash flow hedges. More specifically, we use foreign currency<br />
forward contracts and options to hedge off-balance sheet future foreign currency commitments, including purchase<br />
commitments from suppliers, future committed sales to customers and intercompany transactions. These derivatives<br />
are primarily being used to hedge currency exposures from cash flows anticipated in our RF Communications<br />
segment related to programs in the United Kingdom and Canada. We also have hedged U.S. dollar payments to<br />
suppliers to maintain our anticipated profit margins in our international operations. As of July 1, 2011, we had<br />
outstanding foreign currency forward contracts denominated in the British Pound and Canadian Dollar to hedge<br />
certain forecasted transactions.<br />
These derivatives have only nominal intrinsic value at the time of purchase and have a high degree of<br />
correlation to the anticipated cash flows they are designated to hedge. Hedge effectiveness is determined by the<br />
correlation of the anticipated cash flows and the maturity dates of the derivatives used to hedge these cash flows.<br />
These financial instruments are marked-to-market using forward prices and fair value quotes with the offset to other<br />
comprehensive income, net of hedge ineffectiveness. Gains and losses from other comprehensive income are<br />
reclassified to earnings when the related hedged item is recognized in earnings. The ineffective portion of a<br />
derivative’s change in fair value is immediately recognized in earnings. The cash flow impact of our derivatives is<br />
included in the same category in our Consolidated Statement of Cash Flows as the cash flows of the item being<br />
hedged.<br />
The amount of gains or losses from cash flow hedges recognized in earnings or recorded in other<br />
comprehensive income, including gains or losses related to hedge ineffectiveness, was not material in fiscal 2011,<br />
2010 or 2009. We do not expect the amount of gains or losses recognized in the “Accumulated other comprehensive<br />
income (loss)” line item in our Consolidated Balance Sheet as of July 1, 2011 that will be reclassified to earnings<br />
from other comprehensive income within the next 12 months to be material.<br />
86
NOTES TO CONSOLIDATED FINANCIAL STATEMENTS (Continued)<br />
Credit Risk<br />
We are exposed to credit losses in the event of non-performance by counterparties to these financial<br />
instruments, but we do not expect any of the counterparties to fail to meet their obligations. To manage credit risks,<br />
we select counterparties based on credit ratings, limit our exposure to any single counterparty under defined<br />
guidelines and monitor the market position with each counterparty.<br />
See Note 24: Fair Value Measurements in these Notes for the amount of the assets and liabilities related to<br />
these foreign currency forward contracts in our Consolidated Balance Sheet as of July 1, 2011, and see our<br />
Consolidated Statement of Comprehensive Income and Equity for additional information on changes in accumulated<br />
other comprehensive income (loss) for the three fiscal years ended July 1, 2011.<br />
NOTE 20: NON-OPERATING LOSS<br />
The components of non-operating loss were as follows:<br />
2011 2010<br />
(In millions)<br />
2009<br />
Impairment of securities available-for-sale .............................. $ — $ — $(7.6)<br />
Impairment of investments ......................................... (0.7) (0.3) —<br />
Net royalty income (expense) ....................................... (2.0) (1.6) 3.4<br />
Other ......................................................... 0.8 — 1.1<br />
$(1.9) $(1.9) $(3.1)<br />
NOTE 21: ACCUMULATED OTHER COMPREHENSIVE INCOME (LOSS)<br />
The components of accumulated other comprehensive income (loss) were as follows:<br />
2011 2010<br />
(In millions)<br />
Foreign currency translation ............................................. $50.8 $ 14.3<br />
Net unrealized gain on securities available-for-sale, net of income taxes ............. 1.1 0.6<br />
Net unrealized gain (loss) on hedging derivatives, net of income taxes .............. (0.1) 0.5<br />
Unamortized loss on treasury lock, net of income taxes ......................... (3.5) (4.1)<br />
Unrecognized pension obligations, net of income taxes ......................... (29.6) (31.7)<br />
$ 18.7 $(20.4)<br />
NOTE 22: IMPAIRMENT OF GOODWILL AND OTHER LONG-LIVED ASSETS<br />
Based on our policy as described at Note 1: Significant Accounting Policies in these Notes, we test our<br />
goodwill and other indefinite-lived intangible assets for impairment annually, as well as when events or<br />
circumstances indicate there may be an impairment. In the fourth quarter of fiscal 2009, we performed our annual<br />
review for impairment of our reporting units’ goodwill and other indefinite-lived intangible assets. To test for<br />
potential impairment, we determined the fair value of our reporting units based on projected discounted cash flows<br />
and market-based multiples applied to sales and earnings. Because of the global recession and postponement of<br />
capital projects which significantly weakened demand, and the general decline of peer company valuations<br />
impacting our valuation, it appeared that goodwill in our Broadcast and New Media Solutions reporting unit<br />
(formerly a separate reportable segment and which, effective for the third quarter of fiscal 2011, is reported under<br />
our Integrated Network Solutions segment) was impaired. This was based on the results of step one testing that<br />
indicated the adjusted net book value of this reporting unit exceeded its fair value. We then allocated this fair value<br />
to Broadcast and New Media Solutions’ underlying assets and liabilities to determine the implied fair value of<br />
goodwill.<br />
In conjunction with the above-described impairment review, we conducted a review for impairment of<br />
Broadcast and New Media Solutions’ other long-lived assets, including amortizable intangible assets and capitalized<br />
software, as any impairment of these assets must be considered prior to the conclusion of the impairment review.<br />
The fair value of Broadcast and New Media Solutions’ other long-lived assets was determined based on projected<br />
discounted cash flows based on future sales and operating costs, except for product trade names, for which we<br />
projected discounted cash flows based on the relief-from-royalty method.<br />
87
NOTES TO CONSOLIDATED FINANCIAL STATEMENTS (Continued)<br />
As a result of these impairment reviews, we determined that the goodwill, amortizable intangible assets and<br />
capitalized software for Broadcast and New Media Solutions were impaired. Accordingly, during the fourth quarter<br />
of fiscal 2009, our Broadcast and New Media Solutions reporting unit recorded a $255.5 million impairment charge,<br />
consisting of charges of $160.9 million, $70.2 million and $24.4 million for impairment of goodwill, amortizable<br />
intangible assets and capitalized software, respectively.<br />
NOTE 23: INCOME TAXES<br />
The provisions for income taxes are summarized as follows:<br />
2011 2010 2009<br />
(In millions)<br />
Current:<br />
United States .............................................. $229.1 $270.5 $227.3<br />
International. .............................................. 4.9 1.0 1.7<br />
State and local ............................................. 30.0 17.4 20.1<br />
Deferred:<br />
264.0 288.9 249.1<br />
United States .............................................. 31.2 (11.5) (58.3)<br />
International. .............................................. (0.1) (2.4) (4.0)<br />
State and local ............................................. (1.5) 3.7 (13.9)<br />
29.6 (10.2) (76.2)<br />
$293.6 $278.7 $172.9<br />
The components of deferred income tax assets (liabilities) were as follows:<br />
2011 2010<br />
Current Non-Current Current Non-Current<br />
(In millions)<br />
Inventory valuations ............................ $ 30.1 $ — $ 23.8 $ —<br />
Accruals ..................................... 142.1 66.0 126.7 68.4<br />
Depreciation .................................. — (50.6) — (28.4)<br />
Domestic tax loss and credit carryforwards. ........... — 38.3 — 27.2<br />
International tax loss and credit carryforwards .........<br />
International research and development expense<br />
— 39.6 — 41.4<br />
deferrals ................................... — 39.8 — 41.5<br />
Acquired intangibles ............................ — (95.8) — (28.8)<br />
Share-based compensation ........................ — 40.0 — 32.5<br />
Unfunded pension liability ........................ — 15.7 — 16.2<br />
Unrecognized tax benefits ........................ — 9.0 — 6.9<br />
All other — net ................................ 1.7 (10.5) (2.3) 8.2<br />
173.9 91.5 148.2 185.1<br />
Valuation allowance. ............................ (2.9) (85.8) (2.9) (77.4)<br />
$171.0 $ 5.7 $145.3 $107.7<br />
88
NOTES TO CONSOLIDATED FINANCIAL STATEMENTS (Continued)<br />
A reconciliation of the United States statutory income tax rate to our effective income tax rate follows:<br />
2011 2010 2009<br />
U.S. statutory income tax rate ......................................... 35.0% 35.0% 35.0%<br />
State taxes ....................................................... 1.6 1.1 0.3<br />
International income ................................................ 0.4 0.2 0.3<br />
Settlement of tax audits ............................................. — — (1.3)<br />
Research and development tax credit .................................... (1.2) (0.7) (2.0)<br />
U.S. production activity benefit ........................................ (2.6) (1.6) (2.4)<br />
Impairment of goodwill and other long-lived assets ......................... — — 6.6<br />
Other items ...................................................... 0.1 (0.8) (0.9)<br />
Effective income tax rate ............................................ 33.3% 33.2% 35.6%<br />
United States income taxes have not been provided on $341.4 million of undistributed earnings of international<br />
subsidiaries because of our intention to reinvest those earnings indefinitely. Determination of unrecognized deferred<br />
U.S. tax liability for the undistributed earnings of international subsidiaries is not practicable. Tax loss and credit<br />
carryforwards as of July 1, 2011 have expiration dates ranging between one year and no expiration in certain<br />
instances. The amount of Federal, international, and state and local tax loss carryforwards as of July 1, 2011 were<br />
$57.8 million, $80.0 million and $10.7 million, respectively. Income (loss) from continuing operations before<br />
income taxes of international subsidiaries was $8.9 million, $(4.9) million and $(59.3) million in fiscal 2011, 2010<br />
and 2009, respectively. Income taxes paid were $322.4 million, $280.5 million and $308.4 million in fiscal 2011,<br />
2010 and 2009, respectively. The valuation allowance increased $8.4 million from $80.3 million at the end of fiscal<br />
2010 to $88.7 million at the end of fiscal 2011. The valuation allowance has been established for financial reporting<br />
purposes to offset certain domestic and foreign deferred tax assets due to uncertainty regarding our ability to realize<br />
them in the future.<br />
A reconciliation of the beginning and ending amounts of unrecognized tax benefits is as follows:<br />
2011 2010<br />
(In millions)<br />
2009<br />
Balance at beginning of the fiscal year ............................... $33.2 $23.1 $ 42.9<br />
Additions based on tax positions taken during the current fiscal year ......... 3.2 6.1 2.3<br />
Additions based on tax positions taken during prior fiscal years. ............ 18.4 7.6 0.4<br />
Decreases based on tax positions taken during prior fiscal years ............ (3.1) (0.2) (19.3)<br />
Decreases from settlements ....................................... (1.7) — (3.0)<br />
Decreases from lapse of statutes of limitations ......................... (1.6) (3.4) (0.2)<br />
Balance at end of the fiscal year .................................... $48.4 $33.2 $ 23.1<br />
As of July 1, 2011, we had $48.4 million of unrecognized tax benefits, of which $35.4 million would favorably<br />
impact our future tax rates in the event that the tax benefits are eventually recognized.<br />
We recognize accrued interest and penalties related to unrecognized tax benefits as part of our income tax<br />
expense. We had accrued $3.5 million for the potential payment of interest and penalties as of July 2, 2010 (and this<br />
amount was not included in the $33.2 million of unrecognized tax benefits balance at July 2, 2010 shown above)<br />
and $2.4 million of this total could favorably impact future tax rates. We had accrued $7.0 million for the potential<br />
payment of interest and penalties as of July 1, 2011 (and this amount was not included in the $48.4 million of<br />
unrecognized tax benefits balance at July 1, 2011 shown above) and $5.3 million of this total could favorably<br />
impact future tax rates.<br />
We file numerous separate and consolidated income tax returns reporting our financial results and, where<br />
appropriate, those of our subsidiaries and affiliates, in the U.S. Federal jurisdiction, and various state, local and<br />
foreign jurisdictions. Pursuant to the Compliance Assurance Process, the Internal Revenue Service (“IRS”) is<br />
examining fiscal 2010, fiscal 2011 and fiscal 2012. We are currently under examination by the Canadian Revenue<br />
Agency for fiscal years 2005 through 2010, and we are appealing portions of a Canadian assessment relating to<br />
fiscal years 2000 through 2004. We are currently under examination by various state and international tax authorities<br />
for fiscal years ranging from 1997 through 2010. It is reasonably possible that there could be a significant decrease<br />
89
NOTES TO CONSOLIDATED FINANCIAL STATEMENTS (Continued)<br />
or increase to our unrecognized tax benefit balance during the course of the next twelve months as these<br />
examinations continue, other tax examinations commence or various statutes of limitations expire. An estimate of<br />
the range of possible changes cannot be made because of the significant number of jurisdictions in which we do<br />
business and the number of open tax periods.<br />
NOTE 24: FAIR VALUE MEASUREMENTS<br />
Fair value is defined as the price that would be received to sell an asset or paid to transfer a liability in the<br />
principal market (or most advantageous market, in the absence of a principal market) for the asset or liability in an<br />
orderly transaction between market participants at the measurement date. Further, entities are required to maximize<br />
the use of observable inputs and minimize the use of unobservable inputs in measuring fair value, and to utilize a<br />
three-level fair value hierarchy that prioritizes the inputs used to measure fair value. The three levels of inputs used<br />
to measure fair value are as follows:<br />
• Level 1 — Quoted prices in active markets for identical assets or liabilities.<br />
• Level 2 — Observable inputs other than quoted prices included within Level 1, including quoted prices for<br />
similar assets or liabilities in active markets; quoted prices for identical or similar assets or liabilities in<br />
markets that are not active; and inputs other than quoted prices that are observable or are derived principally<br />
from, or corroborated by, observable market data by correlation or other means.<br />
• Level 3 — Unobservable inputs that are supported by little or no market activity, are significant to the fair<br />
value of the assets or liabilities, and reflect our own assumptions about the assumptions market participants<br />
would use in pricing the asset or liability developed based on the best information available in the<br />
circumstances.<br />
The following table represents the fair value hierarchy of our assets and liabilities measured at fair value on a<br />
recurring basis (at least annually) as of July 1, 2011:<br />
Level 1 Level 2 Level 3 Total<br />
(In millions)<br />
Assets<br />
Marketable equity securities (1) ........................... $ 5.4 $— $— $ 5.4<br />
Deferred compensation plan investments: (2)<br />
Money market fund .................................. 27.9 — — 27.9<br />
Stock fund ........................................ 40.7 — — 40.7<br />
Equity security ..................................... 17.0 — — 17.0<br />
Foreign currency forward contracts (3) ..................... — 0.7 — 0.7<br />
Liabilities<br />
Deferred compensation plans (4) .......................... 85.8 — — 85.8<br />
Foreign currency forward contracts (5) ..................... — 0.9 — 0.9<br />
(1) Represents investments classified as securities available-for-sale, which we include in the “Other current assets” line item in our Consolidated<br />
Balance Sheet.<br />
(2) Represents investments held in a Rabbi Trust associated with our non-qualified deferred compensation plans, which we include in the “Other<br />
current assets” and “Other non-current assets” line items in our Consolidated Balance Sheet.<br />
(3) Includes derivatives designated as hedging instruments, which we include in the “Other current assets” line item in our Consolidated Balance<br />
Sheet. The fair value of these contracts was measured using a market approach based on quoted foreign currency forward exchange rates for<br />
contracts with similar maturities.<br />
(4) Primarily represents obligations to pay benefits under certain non-qualified deferred compensation plans, which we include in the<br />
“Compensation and benefits” and “Other long-term liabilities” line items in our Consolidated Balance Sheet. Under these plans, participants<br />
designate investment options (including money market, stock and fixed-income funds), which serve as the basis for measurement of the<br />
notional value of their accounts.<br />
(5) Includes derivatives designated as hedging instruments, which we include in the “Other accrued items” line item in our Consolidated Balance<br />
Sheet. The fair value of these contracts was measured using a market approach based on quoted foreign currency forward exchange rates for<br />
contracts with similar maturities.<br />
Assets and liabilities that were measured at fair value on a nonrecurring basis were not material during fiscal<br />
2011, 2010 or 2009, with the exception of impairments to goodwill and other long-lived assets as noted in Note 22:<br />
Impairment of Goodwill and Other Long-Lived Assets in these Notes.<br />
90
NOTES TO CONSOLIDATED FINANCIAL STATEMENTS (Continued)<br />
The following table represents the carrying amounts and estimated fair values of our significant financial<br />
instruments that are not measured at fair value (carrying amounts of other financial instruments not listed in the<br />
table below approximate fair value due to the short-term nature of those items):<br />
July 1, 2011 July 2, 2010<br />
Carrying<br />
Amount<br />
Fair<br />
Value<br />
Carrying<br />
Amount<br />
Fair<br />
Value<br />
(In millions)<br />
Financial Liabilities<br />
Long-term debt (including current portion) (1) . ....... $1,892.1 $2,068.4 $1,177.3 $1,301.8<br />
(1) The estimated fair value was measured using a market approach based on quoted market prices for our debt traded in the secondary market.<br />
NOTE 25: BUSINESS SEGMENTS<br />
We structure our operations primarily around the products and services we sell and the markets we serve, and<br />
we report the financial results of our operations in the following three reportable operating or business segments —<br />
RF Communications, Integrated Network Solutions and Government Communications Systems. Our RF<br />
Communications segment is a global supplier of secure tactical radio communications and embedded high-grade<br />
encryption solutions for military, government and commercial organizations and also of secure communications<br />
systems and equipment for public safety, utility and transportation markets. Our Integrated Network Solutions<br />
segment provides mission-critical end-to-end information technology (“IT”) services; managed satellite and<br />
terrestrial communications solutions; standards-based healthcare interoperability and image management solutions;<br />
cyber integrated and cloud application hosting solutions; and digital media management solutions to support<br />
government, energy, healthcare, enterprise and broadcast customers. Our Government Communications Systems<br />
segment conducts advanced research and produces, integrates and supports highly reliable, net-centric<br />
communications and information technology that solve the mission-critical challenges of our civilian, defense and<br />
intelligence government customers, primarily the U.S. Government. Each business segment is comprised of multiple<br />
program areas and product and service lines that aggregate into such business segment.<br />
As discussed further in the “Business Considerations — General” discussion in “Item 7. Management’s<br />
Discussion and Analysis of Financial Condition and Results of Operations” in this Report, our reportable operating<br />
segment structure reflects that, effective for the third quarter of fiscal 2011, as a result of a realignment of our<br />
operations and as previously reported, we formed our Integrated Network Solutions as a new business segment. The<br />
new segment realigns IT Services, Managed Satellite and Terrestrial Communications Solutions, Healthcare<br />
Solutions and Cyber Integrated Solutions (all of which were formerly under our Government Communications<br />
Systems segment) with Broadcast and New Media Solutions (formerly a separate reportable segment called<br />
Broadcast Communications). Our Government Communications Systems segment now is comprised of Civil<br />
Programs, Defense Programs and National Intelligence Programs. Our RF Communications segment did not change<br />
and continues to be comprised of U.S. Department of Defense and International Tactical Communications and<br />
Public Safety and Professional Communications. The historical results, discussion and presentation of our business<br />
segments as set forth in this Report have been adjusted to reflect the impact of these changes to our reportable<br />
operating segment structure for all periods presented in this Report.<br />
In the fourth quarter of fiscal 2009, in connection with the May 27, 2009 Spin-off in the form of a taxable pro<br />
rata dividend to our shareholders of all the shares of HSTX common stock owned by us, we eliminated our former<br />
HSTX business segment, which is reported as discontinued operations in this Report. Until the Spin-off, HSTX<br />
(formerly our Microwave Communications segment), a provider of wireless network solutions, was our majorityowned<br />
subsidiary, and HSTX’s results of operations and financial position were consolidated into our financial<br />
statements. Subsequent to the Spin-off, we no longer own an equity interest in HSTX and, therefore, HSTX no<br />
longer constitutes part of our business operations. Our historical financial results have been restated to account for<br />
HSTX as discontinued operations for all periods presented in this Report. See Note 3: Discontinued Operations in<br />
these Notes for additional information regarding discontinued operations.<br />
The accounting policies of our business segments are the same as those described in Note 1: Significant<br />
Accounting Policies in these Notes. We evaluate each segment’s performance based on its “operating income (loss),”<br />
which we define as profit or loss from operations before income taxes excluding interest income and expense,<br />
royalties and related intellectual property expenses, equity income and gains or losses from securities and other<br />
investments. Intersegment sales among our segments are transferred at cost to the buying segment and the sourcing<br />
segment recognizes a normal profit that is eliminated. The “Corporate eliminations” line item in the tables below<br />
91
NOTES TO CONSOLIDATED FINANCIAL STATEMENTS (Continued)<br />
represents the elimination of intersegment sales and their related profits. The “Unallocated corporate expense” line<br />
item in the tables below represents the portion of corporate expenses not allocated to the business segments.<br />
Our products and systems are produced principally in the United States with international revenue derived<br />
primarily from exports. No revenue earned from any individual foreign country exceeded 4 percent of our total<br />
revenue during fiscal 2011, 2010 or 2009.<br />
Sales made to U.S. Government customers, including the DoD and intelligence and civilian agencies, as well as<br />
foreign military sales through the U.S. Government, whether directly or through prime contractors, by all segments<br />
as a percentage of total revenue were 71.6 percent, 74.8 percent and 74.0 percent in fiscal 2011, 2010 and 2009,<br />
respectively. Revenue from services in fiscal 2011 was approximately 6.1 percent, 64.8 percent and 20.3 percent of<br />
total revenue in our RF Communications, Integrated Network Solutions and Government Communications Systems<br />
segments, respectively.<br />
Selected information by business segment and geographical area is summarized below:<br />
2011 2010 2009<br />
(In millions)<br />
Total Assets<br />
RF Communications ...................................... $1,493.5 $1,468.5 $1,473.0<br />
Integrated Network Solutions ................................ 3,002.7 1,672.9 1,541.3<br />
Government Communications Systems ......................... 976.9 919.8 922.5<br />
Corporate .............................................. 699.7 682.4 528.3<br />
$6,172.8 $4,743.6 $4,465.1<br />
Capital Expenditures<br />
RF Communications ...................................... $ 77.7 $ 52.4 $ 30.1<br />
Integrated Network Solutions ................................ 162.8 77.9 12.5<br />
Government Communications Systems ......................... 45.6 45.9 39.0<br />
Corporate .............................................. 25.2 13.7 10.1<br />
Discontinued operations .................................... — — 17.2<br />
$ 311.3 $ 189.9 $ 108.9<br />
Depreciation and Amortization<br />
RF Communications ...................................... $ 66.1 $ 68.5 $ 38.5<br />
Integrated Network Solutions ................................ 90.7 45.2 54.2<br />
Government Communications Systems ......................... 43.6 43.7 41.8<br />
Corporate .............................................. 11.6 8.3 16.3<br />
Discontinued operations .................................... — — 33.9<br />
$ 212.0 $ 165.7 $ 184.7<br />
Geographical Information for Continuing Operations<br />
U.S. operations:<br />
Revenue ............................................. $5,487.0 $4,906.1 $4,754.4<br />
Long-lived assets ....................................... $ 770.1 $ 575.2 $ 513.2<br />
International operations:<br />
Revenue ............................................. $ 437.6 $ 300.0 $ 250.6<br />
Long-lived assets ....................................... $ 102.7 $ 34.5 $ 30.0<br />
Corporate assets consisted primarily of cash, marketable equity securities, buildings and equipment.<br />
Depreciation and amortization included intangible assets, capitalized software and debt issuance costs amortization<br />
of $76.6 million, $55.7 million and $57.3 million in fiscal 2011, 2010 and 2009, respectively.<br />
Export revenue was $869.5 million, $424.6 million and $766.0 million in fiscal 2011, 2010 and 2009,<br />
respectively. Fiscal 2011 export revenue and revenue from international operations was principally from Europe,<br />
Asia, the Middle East, Canada and Australia. Fiscal 2011 long-lived assets from international operations were<br />
92
NOTES TO CONSOLIDATED FINANCIAL STATEMENTS (Continued)<br />
principally in the United Kingdom and Canada, which had $41.9 million and $21.7 million, respectively, of longlived<br />
assets as of July 1, 2011.<br />
Revenue and income from continuing operations before income taxes by segment follows:<br />
Revenue<br />
2011 2010<br />
(In millions)<br />
2009<br />
RF Communications ...................................... $2,289.2 $2,067.2 $1,760.6<br />
Integrated Network Solutions ................................ 1,985.8 1,485.1 1,476.1<br />
Government Communications Systems ......................... 1,776.5 1,747.3 1,864.2<br />
Corporate eliminations ..................................... (126.9) (93.5) (95.9)<br />
$5,924.6 $5,206.1 $5,005.0<br />
Income From Continuing Operations Before Income Taxes<br />
2011(2) 2010(3) 2009(4)<br />
(In millions)<br />
Segment Operating Income (Loss):<br />
RF Communications ........................................ $787.0 $707.4 $ 571.5<br />
Integrated Network Solutions ................................. 70.2 85.3 (133.6)<br />
Government Communications Systems .......................... 227.0 227.4 199.2<br />
Unallocated corporate expense .................................. (87.8) (90.4) (81.4)<br />
Corporate eliminations ........................................ (26.2) (16.9) (17.7)<br />
Non-operating loss (1) ........................................ (1.9) (1.9) (3.1)<br />
Net interest expense .......................................... (87.6) (70.6) (49.6)<br />
$880.7 $840.3 $ 485.3<br />
(1) “Non-operating loss” includes equity investment income (loss), royalties and related intellectual property expenses, gains and losses on sales<br />
of investments and securities available-for-sale, and impairments of investments and securities available-for-sale. Additional information<br />
regarding non-operating loss is set forth in Note 20: Non-Operating Loss.<br />
(2) The operating income in our Integrated Network Solutions segment included a $46.6 million charge for integration and other costs associated<br />
with our acquisitions of CapRock, Schlumberger GCS, the Core180 Infrastructure and Carefx.<br />
(3) The operating income in our RF Communications segment included a $19.3 million charge for integration and other costs associated with our<br />
acquisition of Wireless Systems. The operating income in our Integrated Network Solutions segment included a $4.4 million charge for<br />
integration and other costs associated with our acquisitions of Patriot Technologies, LLC, SignaCert, Inc. and CapRock, and a $9.5 million<br />
charge for cost-reduction actions. The operating income in our Government Communications Systems segment included a $2.4 million charge<br />
for integration and other costs associated with our acquisitions of Crucial Security, Inc. and the Air Traffic Control business unit of SolaCom<br />
Technologies, Inc.<br />
(4) The operating income in our RF Communications segment included a $9.5 million charge for integration and other costs associated with our<br />
acquisition of Wireless Systems. The operating income in our Integrated Network Solutions segment included a $255.5 million charge for<br />
impairment of goodwill and other long-lived assets related to Broadcast and New Media Solutions. The operating income in our Government<br />
Communications Systems segment included an $18.0 million ($11.3 million after-tax, or $.09 per diluted share) charge for schedule and cost<br />
overruns on commercial satellite reflector programs. Additionally, we initiated a number of cost-reduction actions during fiscal 2009,<br />
resulting in charges of $8.1 million, $5.0 million, $13.1 million and $2.4 million in our RF Communications, Integrated Network Solutions<br />
and Government Communications Systems segments and at our corporate headquarters, respectively, for severance and other employeerelated<br />
exit costs and for consolidation of facilities.<br />
NOTE 26: LEGAL PROCEEDINGS AND CONTINGENCIES<br />
From time to time, as a normal incident of the nature and kind of businesses in which we are, or were,<br />
engaged, various claims or charges are asserted and litigation or arbitration is commenced by or against us arising<br />
from or related to matters including, but not limited to: product liability; personal injury; patents, trademarks, trade<br />
secrets or other intellectual property; labor and employee disputes; commercial or contractual disputes; the sale or<br />
use of former products containing asbestos or other restricted materials; breach of warranty; or environmental<br />
matters. Claimed amounts against us may be substantial but may not bear any reasonable relationship to the merits<br />
of the claim or the extent of any real risk of court or arbitral awards. We record accruals for losses related to those<br />
matters against us that we consider to be probable and that can be reasonably estimated. Gain contingencies, if any,<br />
are recognized when they are realized and legal costs are expensed when incurred. While it is not feasible to predict<br />
93
NOTES TO CONSOLIDATED FINANCIAL STATEMENTS (Continued)<br />
the outcome of these matters with certainty, and some lawsuits, claims or proceedings may be disposed of or<br />
decided unfavorably to us, based upon available information, in the opinion of management, settlements, arbitration<br />
awards and final judgments, if any, which are considered probable of being rendered against us in litigation or<br />
arbitration in existence at July 1, 2011 are reserved for, covered by insurance or would not have a material adverse<br />
effect on our financial position, results of operations or cash flows.<br />
Our tax filings are subject to audit by taxing authorities in jurisdictions where we conduct business. These<br />
audits may result in assessments of additional taxes that are subsequently resolved with the authorities or ultimately<br />
through established legal proceedings. We believe we have adequately accrued for any ultimate amounts that are<br />
likely to result from these audits; however, final assessments, if any, could be different from the amounts recorded<br />
in our Consolidated Financial Statements.<br />
NOTE 27: SUBSEQUENT EVENT<br />
On July 30, 2011, our Board of Directors approved the $1 billion New Repurchase Program that replaced the<br />
2009 Repurchase Program, which had a remaining, unused authorization of approximately $200 million. The New<br />
Repurchase Program does not have a stated expiration date. Repurchases under the New Repurchase Program may<br />
be made through open market purchases, private transactions, transactions structured through investment banking<br />
institutions, or any combination thereof. The timing, volume and nature of share repurchases are subject to market<br />
conditions, applicable securities laws and other factors and are at our discretion and may be suspended or<br />
discontinued at any time. We began repurchasing shares under the New Repurchase Program in August 2011.<br />
94
QUARTERLY FINANCIAL DATA (UNAUDITED)<br />
SUPPLEMENTARY FINANCIAL INFORMATION<br />
Selected quarterly financial data is summarized below.<br />
Quarter Ended<br />
10-1-10(2) 12-31-10(3) 4-1-11(4) 7-1-11(5)<br />
(In millions, except per share amounts)<br />
Fiscal 2011<br />
Revenue .................................... $1,405.4 $1,438.5 $1,413.3 $1,667.4 $5,924.6<br />
Gross profit ................................. 524.3 498.0 517.0 574.8 2,114.1<br />
Income from continuing operations before income<br />
taxes .................................... 251.5 221.9 206.4 200.9 880.7<br />
Income from continuing operations (1) . ............ 163.9 151.1 139.5 133.5 588.0<br />
Per share data:<br />
Basic — income from continuing operations (1) ..... 1.28 1.19 1.10 1.07 4.63<br />
Diluted — income from continuing operations (1) . . . 1.27 1.18 1.09 1.06 4.60<br />
Cash dividends ............................. 0.25 0.25 0.25 0.25 1.00<br />
Stock prices — High ......................... 48.95 47.42 51.27 53.39<br />
Low......................... 41.13 43.02 43.14 43.75<br />
Quarter Ended<br />
10-2-09(6) 1-1-10(7) 4-2-10(8) 7-2-10(9)<br />
(In millions, except per share amounts)<br />
Fiscal 2010<br />
Revenue .................................... $1,203.0 $1,217.7 $1,329.5 $1,455.9 $5,206.1<br />
Gross profit .................................. 390.9 439.1 509.5 532.2 1,871.7<br />
Income from continuing operations before income<br />
taxes ..................................... 160.8 205.2 246.3 228.0 840.3<br />
Income from continuing operations (1) .............. 104.5 139.5 166.2 151.4 561.6<br />
Per share data:<br />
Basic — income from continuing operations (1) ..... 0.79 1.07 1.27 1.17 4.31<br />
Diluted — income from continuing operations (1) .... 0.79 1.06 1.26 1.16 4.28<br />
Cash dividends. ............................. 0.22 0.22 0.22 0.22 0.88<br />
Stock prices — High ......................... 39.42 48.25 49.67 54.50<br />
Low.......................... 26.11 35.88 42.67 40.24<br />
(1) For this line item, “income from continuing operations” refers to income from continuing operations attributable to Harris Corporation<br />
common shareholders.<br />
(2) Income from continuing operations before income taxes included a $2.0 million ($1.5 million after-tax) charge for costs associated with<br />
acquisitions.<br />
(3) Income from continuing operations before income taxes included a $4.2 million ($3.5 million after-tax) charge for costs associated with<br />
acquisitions.<br />
(4) Income from continuing operations before income taxes included a $10.8 million ($9.1 million after-tax) charge for costs associated with<br />
acquisitions.<br />
(5) Income from continuing operations before income taxes included a $29.6 million ($22.7 million after-tax) charge for costs associated with<br />
acquisitions.<br />
(6) Income from continuing operations before income taxes included a $7.2 million ($4.5 million after-tax) charge for costs associated with<br />
acquisitions.<br />
(7) Income from continuing operations before income taxes included a $3.5 million ($2.3 million after-tax) charge for costs associated with<br />
acquisitions.<br />
(8) Income from continuing operations before income taxes included a $5.3 million ($3.3 million after-tax) charge for costs associated with<br />
acquisitions.<br />
(9) Income from continuing operations before income taxes included a $10.1 million ($9.8 million after-tax) charge for costs associated with<br />
acquisitions.<br />
95<br />
Total<br />
Year<br />
Total<br />
Year
ITEM 9. CHANGES IN AND DISAGREEMENTS WITH ACCOUNTANTS ON ACCOUNTING AND<br />
FINANCIAL DISCLOSURE.<br />
Not applicable.<br />
ITEM 9A. CONTROLS AND PROCEDURES.<br />
(a) Evaluation of disclosure controls and procedures: We maintain disclosure controls and procedures that are<br />
designed to ensure that information required to be disclosed in our reports filed or submitted under the Exchange<br />
Act is recorded, processed, summarized and reported within the time periods specified in SEC rules and forms. Our<br />
disclosure controls and procedures include, without limitation, controls and procedures designed to ensure that<br />
information required to be disclosed in our reports filed or submitted under the Exchange Act is accumulated and<br />
communicated to management, including our Chief Executive Officer and Chief Financial Officer, as appropriate to<br />
allow timely decisions regarding required disclosures. There are inherent limitations to the effectiveness of any<br />
system of disclosure controls and procedures, including the possibility of human error and the circumvention or<br />
overriding of the controls and procedures. Accordingly, even effective disclosure controls and procedures can<br />
provide only reasonable assurance of achieving their control objectives, and management necessarily is required to<br />
use its judgment in evaluating the cost-benefit relationship of possible controls and procedures. As required by<br />
Rule 13a-15 under the Exchange Act, as of the end of fiscal 2011, we carried out an evaluation of the effectiveness<br />
of the design and operation of our disclosure controls and procedures. This evaluation was carried out under the<br />
supervision and with the participation of our management, including our Chief Executive Officer and our Chief<br />
Financial Officer. Based upon this work and other evaluation procedures, our management, including our Chief<br />
Executive Officer and our Chief Financial Officer, has concluded that as of the end of fiscal 2011 our disclosure<br />
controls and procedures were effective.<br />
(b) Changes in internal control: We periodically review our internal control over financial reporting as part<br />
of our efforts to ensure compliance with the requirements of Section 404 of the Sarbanes-Oxley Act of 2002. In<br />
addition, we routinely review our system of internal control over financial reporting to identify potential changes to<br />
our processes and systems that may improve controls and increase efficiency, while ensuring that we maintain an<br />
effective internal control environment. Changes may include such activities as implementing new, more efficient<br />
systems, consolidating the activities of business units, migrating certain processes to our shared services<br />
organizations, formalizing policies and procedures, improving segregation of duties, and adding additional<br />
monitoring controls. In addition, when we acquire new businesses, we incorporate our controls and procedures into<br />
the acquired business as part of our integration activities. There have been no changes in our internal control over<br />
financial reporting that occurred during the quarter ended July 1, 2011 that have materially affected, or are<br />
reasonably likely to materially affect, our internal control over financial reporting.<br />
(c) Evaluation of Internal Control over Financial Reporting. Our management is responsible for establishing<br />
and maintaining adequate internal control over financial reporting. Our management, with the participation of our<br />
Chief Executive Officer and Chief Financial Officer, assessed the effectiveness of our internal control over financial<br />
reporting as of the end of fiscal 2011 and concluded that our internal control over financial reporting was effective<br />
as of the end of fiscal 2011. Our management excluded from its assessment of the effectiveness of our internal<br />
control over financial reporting the internal controls of CapRock, which we acquired during the first quarter of fiscal<br />
2011; the internal controls with respect to Schlumberger GCS, which we acquired during the fourth quarter of fiscal<br />
2011; and the internal controls of Carefx, which we acquired during the fourth quarter of fiscal 2011. CapRock,<br />
Schlumberger GCS and Carefx are included in our fiscal 2011 consolidated financial statements. Our management<br />
will include the internal controls of CapRock, the internal controls with respect to Schlumberger GCS and the<br />
internal controls of Carefx in its assessment of the effectiveness of our internal control over financial reporting for<br />
fiscal 2012. “Management’s Report on Internal Control Over Financial Reporting” is included within “Item 8.<br />
Financial Statements and Supplementary Data” of this Report. The effectiveness of our internal control over<br />
financial reporting was audited by Ernst & Young LLP, our independent registered public accounting firm. Their<br />
unqualified report is included within “Item 8. Financial Statements and Supplementary Data” of this Report.<br />
ITEM 9B. OTHER INFORMATION.<br />
Not applicable.<br />
96
PART III<br />
ITEM 10. DIRECTORS, EXECUTIVE OFFICERS AND CORPORATE GOVERNANCE.<br />
(a) Identification of Directors: The information required by this Item, with respect to our directors, is<br />
incorporated herein by reference to the discussion under the headings Proposal 1: Election of Directors in our Proxy<br />
Statement for our 2011 Annual Meeting of Shareholders scheduled to be held on October 28, 2011 (our “2011<br />
Proxy Statement”), which is expected to be filed within 120 days after the end of our 2011 fiscal year.<br />
(b) Identification of Executive Officers: Certain information regarding our executive officers is included in<br />
Part I of this Report under the heading “Executive Officers of the Registrant” in accordance with General<br />
Instruction G(3) of Form 10-K.<br />
(c) Audit Committee Information; Financial Expert: The information required by this Item with respect to the<br />
Audit Committee of our Board of Directors and Audit Committee financial experts is incorporated herein by<br />
reference to the discussion under the headings Board Committees and Committee Charters, Audit Committee and<br />
Committee Membership in our 2011 Proxy Statement, which is expected to be filed within 120 days after the end of<br />
our 2011 fiscal year.<br />
(d) Section 16(a) Beneficial Ownership Reporting Compliance: The information relating to compliance with<br />
Section 16(a) of the Exchange Act is incorporated herein by reference to the discussion under the heading<br />
Section 16(a) Beneficial Ownership Reporting Compliance in our 2011 Proxy Statement, which is expected to be<br />
filed within 120 days after the end of our 2011 fiscal year.<br />
(e) Code of Ethics: All our directors and employees, including our Chief Executive Officer, Chief Financial<br />
Officer, Principal Accounting Officer and other senior accounting and financial officers, are required to abide by our<br />
Standards of Business Conduct. Our Standards of Business Conduct are posted on our website at www.<strong>harris</strong>.com/<br />
business-conduct and are also available free of charge by written request to our Director of Business Conduct,<br />
Harris Corporation, 1025 West NASA Boulevard, Melbourne, Florida 32919. We intend to disclose any amendment<br />
to, or waiver from, our Standards of Business Conduct granted in favor of any of our directors or officers on the<br />
Business Conduct section of our website at www.<strong>harris</strong>.com/business-conduct within four business days following<br />
such amendment or waiver. The information required by this Item with respect to codes of ethics is incorporated<br />
herein by reference to the discussion under the heading Standards of Business Conduct in our 2011 Proxy<br />
Statement, which is expected to be filed within 120 days after the end of our 2011 fiscal year.<br />
(f) Policy for Nominees: The information required under Item 407(c)(3) of Regulation S-K is incorporated<br />
herein by reference to the discussion concerning procedures by which shareholders may recommend nominees to<br />
our Board of Directors contained under the heading Director Nomination Process and Criteria, and Board Diversity<br />
in our 2011 Proxy Statement, which is expected to be filed within 120 days after the end of our 2011 fiscal year. No<br />
material changes to those procedures have occurred since the disclosure regarding those procedures in our Proxy<br />
Statement for our 2010 Annual Meeting of Shareholders. Additional information concerning requirements and<br />
procedures for shareholders directly nominating directors is contained under the heading Shareholder Proposals for<br />
the 2012 Annual Meeting of Shareholders in our 2011 Proxy Statement, which is expected to be filed within<br />
120 days after the end of our 2011 fiscal year.<br />
ITEM 11. EXECUTIVE COMPENSATION.<br />
The information required by this Item, with respect to compensation of our directors and executive officers, is<br />
incorporated herein by reference to the discussion under the headings Director Compensation and Benefits,<br />
Executive Compensation and Management Development and Compensation Committee Report in our 2011 Proxy<br />
Statement, which is expected to be filed within 120 days after the end of our 2011 fiscal year.<br />
97
ITEM 12. SECURITY OWNERSHIP OF CERTAIN BENEFICIAL OWNERS AND MANAGEMENT AND<br />
RELATED STOCKHOLDER MATTERS.<br />
EQUITY COMPENSATION PLAN INFORMATION<br />
The following table provides information as of July 1, 2011 about our common stock that may be issued,<br />
whether upon the exercise of options, warrants and rights or otherwise, under our existing equity compensation<br />
plans.<br />
Plan Category<br />
Number of securities to be<br />
issued upon exercise<br />
of outstanding options,<br />
warrants and rights<br />
(a)(2)<br />
Weighted-average<br />
exercise price<br />
of outstanding options,<br />
warrants and rights<br />
(b)(2)<br />
Number of securities<br />
remaining available for<br />
future issuance under<br />
equity compensation plans<br />
(excluding securities<br />
reflected in column (a))<br />
(c)<br />
Equity compensation plans approved by<br />
shareholders (1) ..................<br />
Equity compensation plans not approved<br />
7,376,159 $39.69 15,978,745<br />
by shareholders ................... -0- N/A -0-<br />
Total ............................ 7,376,159 $39.69 15,978,745<br />
(1) Consists of the Harris Corporation 2000 Stock Incentive Plan and the Harris Corporation 2005 Equity Incentive<br />
Plan (As Amended and Restated Effective August 27, 2010) (the “2005 Equity Incentive Plan”). No additional<br />
awards may be granted under the Harris Corporation 2000 Stock Incentive Plan.<br />
(2) Under the 2005 Equity Incentive Plan, in addition to options, we have granted share-based compensation awards<br />
in the form of performance shares, restricted stock, performance share units, restricted stock units, or other<br />
similar types of share awards. As of July 1, 2011, there were 1,712,144 such awards outstanding under that<br />
plan. The outstanding awards consisted of (i) 1,560,074 performance share awards and restricted stock awards,<br />
for which all 1,560,074 shares were issued and outstanding; and (ii) 152,070 performance share unit awards and<br />
restricted stock unit awards, for which all 152,070 were payable in shares but for which no shares were yet<br />
issued and outstanding. The 7,376,159 shares to be issued upon exercise of outstanding options, warrants and<br />
rights as listed in column (a) consisted of shares to be issued in respect of the exercise of 7,224,089 outstanding<br />
options and in respect of the 152,070 performance share unit awards and restricted stock units awards payable in<br />
shares. Because there is no exercise price associated with performance share awards or restricted stock awards<br />
or with performance share units awards or restricted stock unit awards, all of which are granted to employees at<br />
no cost, such awards are not included in the weighted average exercise price calculation in column (b).<br />
See Note 14: Stock Options and Other Share-Based Compensation in the Notes for a general description of our<br />
stock and equity incentive plans.<br />
The other information required by this Item, with respect to security ownership of certain of our beneficial<br />
owners and management, is incorporated herein by reference to the discussion under the headings Our Largest<br />
Shareholders and Shares Held By Our Directors and Executive Officers in our 2011 Proxy Statement, which is<br />
expected to be filed within 120 days after the end of our 2011 fiscal year.<br />
ITEM 13. CERTAIN RELATIONSHIPS AND RELATED TRANSACTIONS, AND DIRECTOR<br />
INDEPENDENCE.<br />
The information required by this Item is incorporated herein by reference to the discussion under the headings<br />
Director Independence and Related Person Transaction Policy in our 2011 Proxy Statement, which is expected to be<br />
filed within 120 days after the end of our 2011 fiscal year.<br />
ITEM 14. PRINCIPAL ACCOUNTANT FEES AND SERVICES.<br />
The information required by this Item is incorporated herein by reference to the discussion under the heading<br />
Proposal 4: Ratification of the Appointment of Independent Registered Public Accounting Firm in our 2011 Proxy<br />
Statement, which is expected to be filed within 120 days after the end of our 2011 fiscal year.<br />
98
PART IV<br />
ITEM 15. EXHIBITS AND FINANCIAL STATEMENT SCHEDULES.<br />
The following documents are filed as a part of this Report:<br />
(1) List of Financial Statements Filed as Part of this Report<br />
The following financial statements and reports of Harris Corporation and its consolidated<br />
subsidiaries are included in Item 8. of this Report at the page numbers referenced below:<br />
Management’s Report on Internal Control Over Financial Reporting. ........................ 59<br />
Report of Independent Registered Public Accounting Firm on the Consolidated Financial<br />
Statements ................................................................. 60<br />
Report of Independent Registered Public Accounting Firm on the Effectiveness of Internal Control<br />
Over Financial Reporting ...................................................... 61<br />
Consolidated Statement of Income — Fiscal Years ended July 1, 2011; July 2, 2010; and July 3,<br />
2009 ...................................................................... 62<br />
Consolidated Balance Sheet — July 1, 2011 and July 2, 2010 ............................. 63<br />
Consolidated Statement of Cash Flows — Fiscal Years ended July 1, 2011; July 2, 2010; and July 3,<br />
2009 ...................................................................... 64<br />
Consolidated Statement of Comprehensive Income and Equity — Fiscal Years ended July 1, 2011;<br />
July 2, 2010; and July 3, 2009. .................................................. 65<br />
Notes to Consolidated Financial Statements ........................................... 66<br />
(2) Financial Statement Schedules:<br />
Schedule II — Valuation and Qualifying Accounts — Fiscal Years ended July 1, 2011; July 2, 2010;<br />
and July 3, 2009 ............................................................. 108<br />
All other schedules are omitted because they are not applicable, the amounts are not significant, or the<br />
required information is shown in the Consolidated Financial Statements or the Notes thereto.<br />
(3) Exhibits:<br />
The following exhibits are filed herewith or are incorporated herein by reference to exhibits previously<br />
filed with the SEC:<br />
(1) Underwriting Agreement, dated as of November 30, 2010; among Harris Corporation and<br />
J.P. Morgan Securities LLC, Merrill Lynch, Pierce, Fenner & Smith Incorporated and Morgan Stanley &<br />
Co. Incorporated, on behalf of the several underwriters named therein, incorporated herein by reference to<br />
Exhibit 1.1 to the Company’s Current Report on Form 8-K filed with the SEC on December 3, 2010.<br />
(Commission File Number 1-3863)<br />
(2)(a)(i) Asset Purchase Agreement, dated as of April 16, 2009, among Harris Corporation, Tyco<br />
Electronics Group S.A. and, solely for the limited purposes of Section 11.09, Tyco Electronics Ltd.,<br />
incorporated herein by reference to Exhibit 2.1 to the Company’s Current Report on Form 8-K filed with<br />
the SEC on April 22, 2009. (Commission File Number 1-3863)<br />
(ii) Amendment to Asset Purchase Agreement, dated as of May 29, 2009, by and among Harris<br />
Corporation, Tyco Electronics Group S.A. and, solely for the limited purposes of Section 11.09, Tyco<br />
Electronics Ltd., incorporated herein by reference to Exhibit 2.2 to the Company’s Current Report on<br />
Form 8-K filed with the SEC on June 2, 2009. (Commission File Number 1-3863)<br />
(2)(b) Agreement and Plan of Merger, dated as of May 21, 2010, by and among Harris Corporation,<br />
CapRock Holdings, Inc., Canyon Merger Corp., and, solely for purposes of Sections 7.11, 9.1 and 9.8,<br />
certain holders of the issued and outstanding equity securities of CapRock Holdings, Inc. party thereto as<br />
of the date thereof, and for purposes of the provisions thereof that apply to the Stockholder Representative,<br />
ABRY Partners V, L.P., incorporated by reference to Exhibit 2.1 to the Company’s Current Report on<br />
Form 8-K filed with the SEC on May 27, 2010. (Commission File Number 1-3863)<br />
(2)(c) Share and Business Sale Agreement, dated as of November 6, 2010, between Schlumberger<br />
B.V. and Harris Corporation, incorporated herein by reference to Exhibit 2.1 to the Company’s Current<br />
Report on Form 8-K filed with the SEC on November 12, 2010. (Commission File Number 1-3863)<br />
99<br />
Page
(3)(a) Restated Certificate of In<strong>corporation</strong> of Harris Corporation (1995), as amended, incorporated<br />
herein by reference to Exhibit 3(a) to the Company’s Quarterly Report on Form 10-Q for the fiscal quarter<br />
ended September 26, 2008. (Commission File Number 1-3863)<br />
(3)(b) By-Laws of Harris Corporation, as amended and restated effective October 24, 2008,<br />
incorporated herein by reference to Exhibit 3(ii) to the Company’s Current Report on Form 8-K filed with<br />
the SEC on October 29, 2008. (Commission File Number 1-3863)<br />
(4)(a) Specimen stock certificate for the Company’s common stock, incorporated herein by reference<br />
to Exhibit 4(a) to the Company’s Quarterly Report on Form 10-Q for the fiscal quarter ended<br />
December 31, 2004. (Commission File Number 1-3863)<br />
(4)(b)(i) Indenture, dated as of May 1, 1996, between Harris Corporation and The Bank of New York,<br />
as Trustee, relating to unlimited amounts of debt securities which may be issued from time to time by the<br />
Company when and as authorized by the Company’s Board of Directors or a Committee of the Board,<br />
incorporated herein by reference to Exhibit 4 to the Company’s Registration Statement on Form S-3,<br />
Registration Statement No. 333-03111, filed with the SEC on May 3, 1996.<br />
(ii) Instrument of Resignation from Trustee and Appointment and Acceptance of Successor Trustee<br />
among Harris Corporation, JP Morgan Chase Bank, as Resigning Trustee and The Bank of New York, as<br />
Successor Trustee, dated as of November 1, 2002 (effective November 15, 2002), incorporated herein by<br />
reference to Exhibit 99.4 to the Company’s Quarterly Report on Form 10-Q for the fiscal quarter ended<br />
September 27, 2002. (Commission File Number 1-3863)<br />
(4)(c) Indenture, dated as of October 1, 1990, between Harris Corporation and National City Bank, as<br />
Trustee, relating to unlimited amounts of debt securities which may be issued from time to time by the<br />
Company when and as authorized by the Company’s Board of Directors or a Committee of the Board,<br />
incorporated herein by reference to Exhibit 4 to the Company’s Registration Statement on Form S-3,<br />
Registration Statement No. 33-35315, filed with the SEC on June 8, 1990.<br />
(4)(d)(i) Indenture, dated as of September 3, 2003, between Harris Corporation and The Bank of New<br />
York, as Trustee, relating to unlimited amounts of debt securities which may be issued from time to time<br />
by the Company when and as authorized by the Company’s Board of Directors or a Committee of the<br />
Board, incorporated herein by reference to Exhibit 4(b) to the Company’s Registration Statement on<br />
Form S-3, Registration Statement No. 333-108486, filed with the SEC on September 3, 2003.<br />
(ii) Instrument of Resignation of Trustee, Appointment and Acceptance of Successor Trustee, dated<br />
as of June 2, 2009, among Harris Corporation, The Bank of New York Mellon (formerly known as The<br />
Bank of New York) and The Bank of New York Mellon Trust Company, N.A., as to Indenture dated as of<br />
September 3, 2003, incorporated herein by reference to Exhibit 4(m) to the Company’s Registration<br />
Statement on Form S-3, Registration Statement No. 333-159688, filed with the SEC on June 3, 2009.<br />
(4)(e)(i) Subordinated Indenture, dated as of September 3, 2003, between Harris Corporation and The<br />
Bank of New York, as Trustee, relating to unlimited amounts of debt securities which may be issued from<br />
time to time by the Company when and as authorized by the Company’s Board of Directors or a<br />
Committee of the Board, incorporated herein by reference to Exhibit 4(c) to the Company’s Registration<br />
Statement on Form S-3, Registration Statement No. 333-108486, filed with the SEC on September 3,<br />
2003.<br />
(ii) Instrument of Resignation of Trustee, Appointment and Acceptance of Successor Trustee, dated<br />
as of June 2, 2009, among Harris Corporation, The Bank of New York Mellon (formerly known as The<br />
Bank of New York) and The Bank of New York Mellon Trust Company, N.A., as to Subordinated<br />
Indenture dated as of September 3, 2003, incorporated herein by reference to Exhibit 4(n) to the<br />
Company’s Registration Statement on Form S-3, Registration Statement No. 333-159688, filed with the<br />
SEC on June 3, 2009.<br />
(4)(f) Form of the Company’s 5% Notes due 2015, incorporated herein by reference to Exhibit 4.1 to<br />
the Company’s Current Report on Form 8-K filed with the SEC on September 16, 2005. (Commission File<br />
Number 1-3863)<br />
(4)(g) Form of Harris Corporation’s 5.95% Notes due 2017, incorporated herein by reference to<br />
Exhibit 4.1 to the Company’s Current Report on Form 8-K filed with the SEC on December 5, 2007.<br />
(Commission File Number 1-3863)<br />
100
(4)(h) Form of the Company’s 6.375% Notes due 2019, incorporated herein by reference to<br />
Exhibit 4.1 to the Company’s Current Report on Form 8-K filed with the SEC on June 10, 2009.<br />
(Commission File Number 1-3863)<br />
(4)(i) Form of the Company’s 4.40% Notes due 2020, incorporated herein by reference to Exhibit 4.1<br />
to the Company’s Current Report on Form 8-K filed with the SEC on December 3, 2010. (Commission<br />
File Number 1-3863)<br />
(4)(j) Form of the Company’s 6.15% Notes due 2040, incorporated herein by reference to Exhibit 4.2<br />
to the Company’s Current Report on Form 8-K filed with the SEC on December 3, 2010. (Commission<br />
File Number 1-3863)<br />
(4)(k) Pursuant to Regulation S-K Item 601(b)(4)(iii), Registrant by this filing agrees, upon request,<br />
to furnish to the SEC a copy of other instruments defining the rights of holders of long-term debt of<br />
Harris.<br />
(10) Material Contracts:<br />
*(10)(a)(i) Form of Executive Change in Control Severance Agreement, incorporated herein by<br />
reference to Exhibit 10(a) to the Company’s Quarterly Report on Form 10-Q for the fiscal quarter ended<br />
January 2, 2009. (Commission File Number 1-3863)<br />
(ii) Form of Executive Change in Control Severance Agreement, effective as of, and for use after,<br />
April 22, 2010, incorporated herein by reference to Exhibit (10)(o) to the Company’s Quarterly Report on<br />
Form 10-Q for the fiscal quarter ended October 1, 2010. (Commission File Number 1-3863)<br />
*(10)(b)(i) Harris Corporation 2005 Annual Incentive Plan (Effective as of July 2, 2005), incorporated<br />
herein by reference to Exhibit 10.2 to the Company’s Current Report on Form 8-K filed with the SEC on<br />
November 3, 2005. (Commission File Number 1-3863)<br />
(ii) Amendment No. 1 to Harris Corporation 2005 Annual Incentive Plan, effective January 1, 2009,<br />
incorporated herein by reference to Exhibit (10)(b) to the Company’s Quarterly Report on Form 10-Q for<br />
the fiscal quarter ended January 2, 2009. (Commission File Number 1-3863)<br />
*(10)(c)(i) Harris Corporation 2000 Stock Incentive Plan, incorporated herein by reference to<br />
Exhibit 4(b) to the Company’s Registration Statement on Form S-8, Registration Statement No.<br />
333-49006, filed with the SEC on October 31, 2000.<br />
(ii) Amendment No. 1 to Harris Corporation 2000 Stock Incentive Plan, dated as of December 3,<br />
2004, incorporated herein by reference to Exhibit 10.2 to the Company’s Current Report on Form 8-K<br />
filed with the SEC on December 8, 2004. (Commission File Number 1-3863)<br />
(iii) Amendment No. 2 to Harris Corporation 2000 Stock Incentive Plan, effective January 1, 2009,<br />
incorporated herein by reference to Exhibit (10)(c) to the Company’s Quarterly Report on Form 10-Q for<br />
the fiscal quarter ended January 2, 2009. (Commission File Number 1-3863)<br />
(iv) Stock Option Agreement Terms and Conditions (as of 10/27/2000) for grants under the Harris<br />
Corporation 2000 Stock Incentive Plan, incorporated herein by reference to Exhibit (10)(d)(ii) to the<br />
Company’s Annual Report on Form 10-K for the fiscal year ended June 29, 2001. (Commission File<br />
Number 1-3863)<br />
(v) Stock Option Agreement Terms and Conditions (as of 8/24/01) for grants under the Harris<br />
Corporation 2000 Stock Incentive Plan, incorporated herein by reference to Exhibit (10)(i) to the<br />
Company’s Quarterly Report on Form 10-Q for the fiscal quarter ended September 28, 2001. (Commission<br />
File Number 1-3863)<br />
(vi) Stock Option Agreement Terms and Conditions (as of 8/22/03) for grants under the Harris<br />
Corporation 2000 Stock Incentive Plan, incorporated herein by reference to Exhibit 10(b) to the<br />
101
Company’s Quarterly Report on Form 10-Q for the fiscal quarter ended September 26, 2003. (Commission<br />
File Number 1-3863)<br />
(vii) Stock Option Agreement Terms and Conditions (as of 8/27/04) for grants under the Harris<br />
Corporation 2000 Stock Incentive Plan, incorporated herein by reference to Exhibit 10(a) to the<br />
Company’s Quarterly Report on Form 10-Q for the fiscal quarter ended October 1, 2004. (Commission<br />
File Number 1-3863)<br />
(viii) Stock Option Agreement Terms and Conditions (as of 8/26/05) for grants under the Harris<br />
Corporation 2000 Stock Incentive Plan, incorporated herein by reference to Exhibit 10.2 to the Company’s<br />
Current Report on Form 8-K filed with the SEC on September 1, 2005. (Commission File Number 1-3863)<br />
(ix) Form of Outside Director Stock Option Agreement (as of 10/27/2000) for grants under the Harris<br />
Corporation 2000 Stock Incentive Plan, incorporated herein by reference to Exhibit (10)(d)(iii) to the<br />
Company’s Annual Report on Form 10-K for the fiscal year ended June 29, 2001. (Commission File<br />
Number 1-3863)<br />
(x) Restoration Stock Option Agreement Terms and Conditions (as of 8/22/03) for grants under the<br />
Harris Corporation 2000 Stock Incentive Plan, incorporated herein by reference to Exhibit 10(c) to the<br />
Company’s Quarterly Report on Form 10-Q for the fiscal quarter ended September 26, 2003. (Commission<br />
File Number 1-3863)<br />
*(10)(d)(i) Harris Corporation 2005 Equity Incentive Plan, incorporated herein by reference to<br />
Exhibit 10.1 to the Company’s Current Report on Form 8-K filed with the SEC on November 3, 2005.<br />
(Commission File Number 1-3863)<br />
(ii) Amendment No. 1 to Harris Corporation 2005 Equity Incentive Plan, effective January 1, 2009,<br />
incorporated herein by reference to Exhibit (10)(d) to the Company’s Quarterly Report on Form 10-Q for<br />
the fiscal quarter ended January 2, 2009. (Commission File Number 1-3863)<br />
(iii) Stock Option Award Agreement Terms and Conditions (as of 10/28/05) for grants under the<br />
Harris Corporation 2005 Equity Incentive Plan, incorporated herein by reference to Exhibit 10(f) to the<br />
Company’s Quarterly Report on Form 10-Q for the fiscal quarter ended December 30, 2005. (Commission<br />
File Number 1-3863)<br />
(iv) Form of Stock Option Award Agreement Terms and Conditions (as of June 30, 2007) for grants<br />
under the Harris Corporation 2005 Equity Incentive Plan, incorporated herein by reference to Exhibit 10.1<br />
to the Company’s Current Report on Form 8-K filed with the SEC on August 30, 2007. (Commission File<br />
Number 1-3863)<br />
(v) Form of Performance Share Award Agreement Terms and Conditions (as of June 30, 2007) for<br />
grants under the Harris Corporation 2005 Equity Incentive Plan, incorporated herein by reference to<br />
Exhibit 10.2 to the Company’s Current Report on Form 8-K filed with the SEC on August 30, 2007.<br />
(Commission File Number 1-3863)<br />
(vi) Form of Performance Share Unit Award Agreement Terms and Conditions (as of June 30,<br />
2007) for grants under the Harris Corporation 2005 Equity Incentive Plan, incorporated herein by<br />
reference to Exhibit 10.3 to the Company’s Current Report on Form 8-K filed with the SEC on August 30,<br />
2007. (Commission File Number 1-3863)<br />
(vii) Form of Restricted Stock Award Agreement Terms and Conditions (as of June 30, 2007) for<br />
grants under the Harris Corporation 2005 Equity Incentive Plan, incorporated herein by reference to<br />
Exhibit 10.4 to the Company’s Current Report on Form 8-K filed with the SEC on August 30, 2007.<br />
(Commission File Number 1-3863)<br />
(viii) Form of Restricted Stock Unit Award Agreement Terms and Conditions (as of June 30,<br />
2007) for grants under the Harris Corporation 2005 Equity Incentive Plan, incorporated herein by<br />
reference to Exhibit 10.5 to the Company’s Current Report on Form 8-K filed with the SEC on August 30,<br />
2007. (Commission File Number 1-3863)<br />
(ix) Form of Stock Option Award Agreement Terms and Conditions (as of June 28, 2008) for grants<br />
under the Harris Corporation 2005 Equity Incentive Plan, incorporated herein by reference to Exhibit 10.1<br />
to the Company’s Current Report on Form 8-K filed with the SEC on August 28, 2008. (Commission File<br />
Number 1-3863)<br />
102
(x) Form of Performance Share Award Agreement Terms and Conditions (as of June 28, 2008) for<br />
grants under the Harris Corporation 2005 Equity Incentive Plan, incorporated herein by reference to<br />
Exhibit 10.2 to the Company’s Current Report on Form 8-K filed with the SEC on August 28, 2008.<br />
(Commission File Number 1-3863)<br />
(xi) Form of Performance Share Unit Award Agreement Terms and Conditions (as of June 28,<br />
2008) for grants under the Harris Corporation 2005 Equity Incentive Plan, incorporated herein by<br />
reference to Exhibit 10.3 to the Company’s Current Report on Form 8-K filed with the SEC on August 28,<br />
2008. (Commission File Number 1-3863)<br />
(xii) Form of Restricted Stock Award Agreement Terms and Conditions (as of June 28, 2008) for<br />
grants under the Harris Corporation 2005 Equity Incentive Plan, incorporated herein by reference to<br />
Exhibit 10.4 to the Company’s Current Report on Form 8-K filed with the SEC on August 28, 2008.<br />
(Commission File Number 1-3863)<br />
(xiii) Form of Restricted Stock Unit Award Agreement Terms and Conditions (as of June 28,<br />
2008) for grants under the Harris Corporation 2005 Equity Incentive Plan, incorporated herein by<br />
reference to Exhibit (10)(b) to the Company’s Quarterly Report on Form 10-Q for the fiscal quarter ended<br />
October 2, 2009. (Commission File Number 1-3863)<br />
(xiv) Form of Stock Option Award Agreement Terms and Conditions (as of July 4, 2009) for grants<br />
under the Harris Corporation 2005 Equity Incentive Plan, incorporated herein by reference to Exhibit 10.1<br />
to the Company’s Current Report on Form 8-K filed with the SEC on September 3, 2009. (Commission<br />
File Number 1-3863)<br />
*(10)(e)(i) Harris Corporation Supplemental Executive Retirement Plan (amended and restated<br />
effective March 1, 2003), incorporated herein by reference to Exhibit 10(b)(i) to the Company’s Quarterly<br />
Report on Form 10-Q for the fiscal quarter ended March 28, 2003. (Commission File Number 1-3863)<br />
(ii) Amendment No. 1 to Harris Corporation Supplemental Executive Retirement Plan, dated<br />
April 25, 2003, incorporated herein by reference to Exhibit (10)(b)(ii) to the Company’s Quarterly Report<br />
on Form 10-Q for the fiscal quarter ended March 28, 2003. (Commission File Number 1-3863)<br />
(iii) Amendment No. 2 to Harris Corporation Supplemental Executive Retirement Plan, dated June 4,<br />
2004, incorporated herein by reference to Exhibit (10)(f)(iii) to the Company’s Annual Report on<br />
Form 10-K for the fiscal year ended July 2, 2004. (Commission File Number 1-3863)<br />
(iv) Amendment No. 3 to Harris Corporation Supplemental Executive Retirement Plan, dated<br />
April 19, 2007, incorporated herein by reference to Exhibit 10(g)(iv) to the Company’s Annual Report on<br />
Form 10-K for the fiscal year ended June 29, 2007. (Commission File Number 1-3863)<br />
(v) Amendment No. 4 to Harris Corporation Supplemental Executive Retirement Plan, dated<br />
October 27, 2010 and effective as of August 28, 2010, incorporated herein by reference to Exhibit (10)(j)<br />
to the Company’s Quarterly Report on Form 10-Q for the fiscal quarter ended October 1, 2010.<br />
(Commission File Number 1-3863)<br />
*(10)(f)(i) Harris Corporation 2005 Supplemental Executive Retirement Plan, effective January 1,<br />
2009, incorporated herein by reference to Exhibit (10)(f) to the Company’s Quarterly Report on<br />
Form 10-Q for the fiscal quarter ended January 2, 2009. (Commission File Number 1-3863)<br />
(ii) Amendment Number One to the Harris Corporation 2005 Supplemental Executive Retirement<br />
Plan, dated October 1, 2009 and effective January 1, 2010, incorporated herein by reference to Exhibit<br />
(10)(d) to the Company’s Quarterly Report on Form 10-Q for the fiscal quarter ended October 2, 2009.<br />
(Commission File Number 1-3863)<br />
(iii) Amendment Number Two to the Harris Corporation 2005 Supplemental Executive Retirement<br />
Plan, dated December 8, 2009 and effective November 30, 2009, incorporated herein by reference to<br />
Exhibit (10)(b) to the Company’s Quarterly Report on Form 10-Q for the fiscal quarter ended January 1,<br />
2010. (Commission File Number 1-3863)<br />
(iv) Amendment Number Three to the Harris Corporation 2005 Supplemental Executive Retirement<br />
Plan, dated October 27, 2010 and effective as of August 28, 2010, incorporated herein by reference to<br />
Exhibit (10)(k) to the Company’s Quarterly Report on Form 10-Q for the fiscal quarter ended October 1,<br />
2010. (Commission File Number 1-3863)<br />
103
*(10)(g)(i) Harris Corporation 1997 Directors’ Deferred Compensation and Annual Stock Unit Award<br />
Plan (Amended and Restated Effective January 1, 2006), incorporated herein by reference to Exhibit 10.4<br />
to the Company’s Current Report on Form 8-K filed with the SEC on November 3, 2005. (Commission<br />
File Number 1-3863)<br />
(ii) Amendment Number One to the Harris Corporation 1997 Directors’ Deferred Compensation and<br />
Annual Stock Unit Award Plan (Amended and Restated Effective January 1, 2006), effective January 1,<br />
2009, incorporated herein by reference to Exhibit (10)(g) to the Company’s Quarterly Report on<br />
Form 10-Q for the fiscal quarter ended January 2, 2009. (Commission File Number 1-3863)<br />
(iii) Amendment Number Two to the Harris Corporation 1997 Directors’ Deferred Compensation and<br />
Annual Stock Unit Award Plan (Amended and Restated Effective January 1, 2006), dated October 27,<br />
2010 and effective as of August 28, 2010, incorporated herein by reference to Exhibit (10)(l) to the<br />
Company’s Quarterly Report on Form 10-Q for the fiscal quarter ended October 1, 2010. (Commission<br />
File Number 1-3863)<br />
*(10)(h)(i) Harris Corporation 2005 Directors’ Deferred Compensation Plan (as Amended and<br />
Restated Effective January 1, 2009), incorporated herein by reference to Exhibit 10(h) to the Company’s<br />
Quarterly Report on Form 10-Q for the fiscal quarter ended January 2, 2009. (Commission File Number<br />
1-3863)<br />
(ii) Amendment Number One to the Harris Corporation 2005 Directors’ Deferred Compensation Plan<br />
(As Amended and Restated Effective January 1, 2009), dated October 27, 2010 and effective as of<br />
August 28, 2010, incorporated herein by reference to Exhibit (10)(m) to the Company’s Quarterly Report<br />
on Form 10-Q for the fiscal quarter ended October 1, 2010. (Commission File Number 1-3863)<br />
(10)(i) Revolving Credit Agreement, dated as of September 10, 2008, among the Company and the<br />
other parties thereto, incorporated herein by reference to Exhibit 10.1 to the Company’s Current Report on<br />
Form 8-K filed with the SEC on September 16, 2008. (Commission File Number 1-3863)<br />
10(j) 364-Day Revolving Credit Agreement, dated as of September 29, 2010, by and among the<br />
Company and the other parties thereto, incorporated herein by reference to Exhibit 10.1 to the Company’s<br />
Current Report on Form 8-K filed with the SEC on October 5, 2010. (Commission File Number 1-3863)<br />
*(10)(k) Form of Director and Executive Officer Indemnification Agreement, incorporated herein by<br />
reference to Exhibit 10(r) to the Company’s Annual Report on Form 10-K for the fiscal year ended July 3,<br />
1998. (Commission File Number 1-3863)<br />
*10(l) Form of Director and Executive Officer Indemnification Agreement, effective as of, and for<br />
use after, August 28, 2010, incorporated herein by reference to Exhibit (10)(p) to the Company’s Quarterly<br />
Report on Form 10-Q for the fiscal quarter ended October 1, 2010. (Commission File Number 1-3863)<br />
*(10)(m)(i) Amended and Restated Master Trust Agreement and Declaration of Trust, made as of<br />
December 2, 2003, by and between Harris Corporation and The Northern Trust Company, incorporated<br />
herein by reference to Exhibit 10(c) to the Company’s Quarterly Report on Form 10-Q for the fiscal<br />
quarter ended January 2, 2004. (Commission File Number 1-3863)<br />
(ii) Amendment to the Harris Corporation Master Trust, dated May 21, 2009, incorporated herein by<br />
reference to Exhibit (10)(m)(ii) to the Company’s Annual Report on Form 10-K for the fiscal year ended<br />
July 3, 2009. (Commission File Number 1-3863)<br />
(iii) Amendment to the Harris Corporation Master Trust, dated December 8, 2009 and effective<br />
December 31, 2009, incorporated herein by reference to Exhibit 4(e)(iii) to the Company’s Registration<br />
Statement on Form S-8, Registration Statement No. 333-163647, filed with the SEC on December 10,<br />
2009.<br />
*(10)(n)(i) Master Rabbi Trust Agreement, amended and restated as of December 2, 2003, by and<br />
between Harris Corporation and The Northern Trust Company, incorporated herein by reference to<br />
Exhibit 10(d) to the Company’s Quarterly Report on Form 10-Q for the fiscal quarter ended January 2,<br />
2004. (Commission File Number 1-3863)<br />
(ii) First Amendment to Master Rabbi Trust Agreement, dated the 24th day of September, 2004,<br />
incorporated herein by reference to Exhibit (10)(b) to the Company’s Quarterly Report on Form 10-Q for<br />
the fiscal quarter ended October 1, 2004. (Commission File Number 1-3863)<br />
104
(iii) Second Amendment to the Harris Corporation Master Rabbi Trust Agreement, dated as of<br />
December 8, 2004, incorporated herein by reference to Exhibit 10.5 to the Company’s Current Report on<br />
Form 8-K filed with the SEC on December 8, 2004. (Commission File Number 1-3863)<br />
(iv) Third Amendment to the Harris Corporation Master Rabbi Trust Agreement, dated January 15,<br />
2009 and effective January 1, 2009, incorporated herein by reference to Exhibit (10)(i) to the Company’s<br />
Quarterly Report on Form 10-Q for the fiscal quarter ended January 2, 2009. (Commission File Number<br />
1-3863)<br />
(v) Fourth Amendment to the Harris Corporation Master Rabbi Trust Agreement, dated October 27,<br />
2010 and effective as of August 28, 2010, incorporated herein by reference to Exhibit (10)(n) to the<br />
Company’s Quarterly Report on Form 10-Q for the fiscal quarter ended October 1, 2010. (Commission<br />
File Number 1-3863)<br />
*(10)(o) Letter Agreement, dated as of December 19, 2008 and effective January 1, 2009, by and<br />
between Harris Corporation and Howard L. Lance, incorporated herein by reference to Exhibit 10.1 to the<br />
Company’s Current Report on Form 8-K filed with the SEC on December 24, 2008. (Commission File<br />
Number 1-3863)<br />
*(10)(p)(i) Offer Letter, dated July 5, 2005, by and between Harris Corporation and Jeffrey S.<br />
Shuman, incorporated herein by reference to Exhibit 10.1 to the Company’s Current Report on Form 8-K<br />
filed with the SEC on September 1, 2005. (Commission File Number 1-3863)<br />
(ii) Addendum, dated December 12, 2008, to the Offer Letter, dated July 5, 2005, by and between<br />
Harris Corporation and Jeffrey S. Shuman, incorporated herein by reference to Exhibit 10(l) to the<br />
Company’s Quarterly Report on Form 10-Q for the fiscal quarter ended January 2, 2009. (Commission<br />
File Number 1-3863)<br />
(10)(q) Commercial Paper Issuing and Paying Agent Agreement, dated as of March 30, 2005,<br />
between Citibank, N.A. and Harris Corporation, incorporated herein by reference to Exhibit 99.2 to the<br />
Company’s Current Report on Form 8-K filed with the SEC on April 5, 2005. (Commission File Number<br />
1-3863)<br />
*(10)(r) Supplemental Pension Plan for Howard L. Lance (Amended and Restated effective January 1,<br />
2009), dated as of December 19, 2008, by and between Harris Corporation and Howard L. Lance,<br />
incorporated herein by reference to Exhibit 10.2 to the Company’s Current Report on Form 8-K filed with<br />
the SEC on December 24, 2008. (Commission File Number 1-3863)<br />
(10)(s) Non-Competition Agreement, dated as of January 26, 2007, among Harris Corporation, Stratex<br />
Networks, Inc. and Harris Stratex Networks, Inc., incorporated herein by reference to Exhibit 10.2 to the<br />
Company’s Current Report on Form 8-K filed with the SEC on February 1, 2007. (Commission File<br />
Number 1-3863)<br />
(10)(t) Commercial Paper Dealer Agreement, dated as of June 12, 2007, between Citigroup Global<br />
Markets Inc. and Harris Corporation, incorporated herein by reference to Exhibit 10.1 to the Company’s<br />
Current Report on Form 8-K filed with the SEC on June 18, 2007. (Commission File Number 1-3863)<br />
(10)(u) Commercial Paper Dealer Agreement, dated June 13, 2007, between Banc of America<br />
Securities LLC and Harris Corporation, incorporated herein by reference to Exhibit 10.2 to the Company’s<br />
Current Report on Form 8-K filed with the SEC on June 18, 2007. (Commission File Number 1-3863)<br />
(10)(v) Commercial Paper Dealer Agreement, dated as of June 14, 2007, between SunTrust Capital<br />
Markets, Inc. and Harris Corporation, incorporated herein by reference to Exhibit 10.3 to the Company’s<br />
Current Report on Form 8-K filed with the SEC on June 18, 2007. (Commission File Number 1-3863)<br />
*(10)(w) Summary of Annual Compensation of Outside Directors effective January 1, 2011,<br />
incorporated herein by reference to Exhibit 10.2 to the Company’s Current Report on Form 8-K filed with<br />
the SEC on October 27, 2010. (Commission File Number 1-3863)<br />
*(10)(x)(i) Harris Corporation Retirement Plan (Amended and Restated Effective January 1, 2011),<br />
incorporated herein by reference to Exhibit 10(b) to the Company’s Quarterly Report on Form 10-Q for<br />
the fiscal quarter ended December 31, 2010. (Commission File Number 1-3863)<br />
(ii) Amendment Number One to the Harris Corporation Retirement Plan (Amended and Restated<br />
Effective January 1, 2011) dated June 28, 2011 and effective as of July 2, 2011.<br />
105
*(10)(y) Harris Corporation Annual Incentive Plan (Effective as of July 3, 2010), incorporated herein<br />
by reference to Exhibit 10.3 to the Company’s Current Report on Form 8-K filed with the SEC on<br />
September 2, 2010. (Commission File Number 1-3863)<br />
*(10)(z)(i) Harris Corporation 2005 Equity Incentive Plan (As Amended and Restated Effective<br />
August 27, 2010), incorporated herein by reference to Exhibit 10.4 to the Company’s Current Report on<br />
Form 8-K filed with the SEC on September 2, 2010. (Commission File Number 1-3863)<br />
(ii) Form of Stock Option Award Agreement Terms and Conditions (as of July 3, 2010) for grants<br />
under the Harris Corporation 2005 Equity Incentive Plan (As Amended and Restated Effective August 27,<br />
2010), incorporated herein by reference to Exhibit (10)(c) to the Company’s Quarterly Report on<br />
Form 10-Q for the fiscal quarter ended October 1, 2010. (Commission File Number 1-3863)<br />
(iii) Form of Performance Share Award Agreement Terms and Conditions (as of July 3, 2010) for<br />
grants under the Harris Corporation 2005 Equity Incentive Plan (As Amended and Restated Effective<br />
August 27, 2010), incorporated herein by reference to Exhibit (10)(d) to the Company’s Quarterly Report<br />
on Form 10-Q for the fiscal quarter ended October 1, 2010. (Commission File Number 1-3863)<br />
(iv) Form of Performance Share Unit Award Agreement Terms and Conditions (as of July 3,<br />
2010) for grants under the Harris Corporation 2005 Equity Incentive Plan (As Amended and Restated<br />
Effective August 27, 2010), incorporated herein by reference to Exhibit (10)(e) to the Company’s<br />
Quarterly Report on Form 10-Q for the fiscal quarter ended October 1, 2010. (Commission File Number<br />
1-3863)<br />
(v) Form of Restricted Stock Award Agreement Terms and Conditions (as of July 3, 2010) for grants<br />
under the Harris Corporation 2005 Equity Incentive Plan (As Amended and Restated Effective August 27,<br />
2010), incorporated herein by reference to Exhibit (10)(f) to the Company’s Quarterly Report on<br />
Form 10-Q for the fiscal quarter ended October 1, 2010. (Commission File Number 1-3863)<br />
(vi) Form of Restricted Stock Unit Award Agreement Terms and Conditions (as of July 3, 2010) for<br />
grants under the Harris Corporation 2005 Equity Incentive Plan (As Amended and Restated Effective<br />
August 27, 2010), incorporated herein by reference to Exhibit (10)(g) to the Company’s Quarterly Report<br />
on Form 10-Q for the fiscal quarter ended October 1, 2010. (Commission File Number 1-3863)<br />
(12) Statement regarding computation of ratio of earnings to fixed charges.<br />
(21) Subsidiaries of the Registrant.<br />
(23) Consent of Ernst & Young LLP, Independent Registered Public Accounting Firm.<br />
(24) Power of Attorney.<br />
(31.1) Rule 13a-14(a)/15d-14(a) Certification of Chief Executive Officer.<br />
(31.2) Rule 13a-14(a)/15d-14(a) Certification of Chief Financial Officer.<br />
(32.1) Section 1350 Certification of Chief Executive Officer.<br />
(32.2) Section 1350 Certification of Chief Financial Officer.<br />
**(101.INS) XBRL Instance Document.<br />
**(101.SCH) XBRL Taxonomy Extension Schema Document.<br />
**(101.CAL) XBRL Taxonomy Extension Calculation Linkbase Document.<br />
**(101.LAB) XBRL Taxonomy Extension Label Linkbase Document.<br />
**(101.PRE) XBRL Taxonomy Extension Presentation Linkbase Document.<br />
**(101.DEF) XBRL Taxonomy Extension Definition Linkbase Document.<br />
* Management contract or compensatory plan or arrangement.<br />
** Furnished herewith (not filed).<br />
106
SIGNATURES<br />
Pursuant to the requirements of Section 13 or 15(d) of the Securities Exchange Act of 1934, the<br />
registrant has duly caused this report to be signed on its behalf by the undersigned, thereunto duly<br />
authorized.<br />
HARRIS CORPORATION<br />
(Registrant)<br />
Date: August 29, 2011 By: /s/ HOWARD L. LANCE<br />
Howard L. Lance<br />
Chairman of the Board, President and Chief Executive Officer<br />
Pursuant to the requirements of the Securities Exchange Act of 1934, this report has been signed below<br />
by the following persons on behalf of the registrant and in the capacities and on the dates indicated.<br />
/s/ HOWARD L. LANCE<br />
Howard L. Lance<br />
/s/ GARY L. MCARTHUR<br />
Gary L. McArthur<br />
/s/ LEWIS A. SCHWARTZ<br />
Lewis A. Schwartz<br />
/s/ THOMAS A. DATTILO*<br />
Thomas A. Dattilo<br />
/s/ TERRY D. GROWCOCK*<br />
Terry D. Growcock<br />
/s/ LEWIS HAY III*<br />
Lewis Hay III<br />
/s/ KAREN KATEN*<br />
Karen Katen<br />
/s/ STEPHEN P. KAUFMAN*<br />
Stephen P. Kaufman<br />
/s/ LESLIE F. KENNE*<br />
Leslie F. Kenne<br />
/s/ DAVID B. RICKARD*<br />
David B. Rickard<br />
/s/ JAMES C. STOFFEL*<br />
James C. Stoffel<br />
/s/ GREGORY T. SWIENTON*<br />
Gregory T. Swienton<br />
/s/ HANSEL E. TOOKES II*<br />
Hansel E. Tookes II*<br />
*By: /s/ SCOTT T. MIKUEN<br />
Scott T. Mikuen<br />
Attorney-in-Fact<br />
pursuant to a power of attorney<br />
Signature Title Date<br />
Chairman of the Board, President and<br />
Chief Executive Officer<br />
(Principal Executive Officer)<br />
Senior Vice President and Chief<br />
Financial Officer<br />
(Principal Financial Officer)<br />
Vice President, Principal<br />
Accounting Officer<br />
(Principal Accounting Officer)<br />
August 29, 2011<br />
August 29, 2011<br />
August 29, 2011<br />
Director August 29, 2011<br />
Director August 29, 2011<br />
Director August 29, 2011<br />
Director August 29, 2011<br />
Director August 29, 2011<br />
Director August 29, 2011<br />
Director August 29, 2011<br />
Director August 29, 2011<br />
Director August 29, 2011<br />
Director August 29, 2011<br />
107
SCHEDULE II — VALUATION AND QUALIFYING ACCOUNTS<br />
HARRIS CORPORATION AND SUBSIDIARIES<br />
(In thousands)<br />
Col. A Col. B Col. C<br />
Additions<br />
Col. D Col. E<br />
Description<br />
Balance at<br />
Beginning<br />
of Period<br />
Charged to<br />
Costs and<br />
Expenses<br />
Charged to<br />
Other Accounts<br />
— Describe<br />
Deductions<br />
— Describe<br />
Balance at<br />
End of Period<br />
Year ended July 1, 2011<br />
Amounts Deducted From<br />
Respective Asset Accounts:<br />
Allowances for collection losses ....... $10,036 $ 3,387 $ 2,370 (C)<br />
$ (277) (A)<br />
4,142 (B)<br />
$3,865 $11,928<br />
$ 386 (C)<br />
(4,401) (D)<br />
Allowances for deferred tax assets ..... $80,321 $ 12,098 $(4,015) $ (328) (A) $88,732<br />
Year ended July 2, 2010<br />
Amounts Deducted From<br />
Respective Asset Accounts:<br />
$ 31 (A)<br />
Allowances for collection losses ....... $13,261 $ (2,261) $ 169 (C)<br />
1,102 (B)<br />
$1,133 $10,036<br />
Allowances for deferred tax assets ..... $72,464 $ 6,303<br />
$ 2,937 (C)<br />
(1,116) (D)<br />
$ 1,821 $ 267 $80,321<br />
Year ended July 3, 2009<br />
Amounts Deducted From<br />
Respective Asset Accounts:<br />
Allowances for collection losses ....... $ 5,712 $ 4,711 $ 6,011 (C)<br />
$ 182 (A)<br />
2,991 (B)<br />
$3,173 $13,261<br />
Allowances for deferred tax assets ..... $84,366 $(12,403) $ 736 (D) $ 235 (A) $72,464<br />
Note A — Foreign currency translation gains and losses.<br />
Note B — Uncollectible accounts charged off, less recoveries on accounts previously charged off.<br />
Note C — Acquisitions.<br />
Note D — Uncertain income tax positions.<br />
108
COMPUTATION OF RATIO OF EARNINGS TO FIXED CHARGES<br />
Exhibit 12<br />
July 1,<br />
Year Ended<br />
July 2, July 3,<br />
2011 2010 2009<br />
(In millions, except ratios)<br />
Earnings:<br />
Income from continuing operations before income taxes ....................... $880.7 $840.3 $485.3<br />
Plus: Fixed charges .................................................. 103.4 79.9 59.2<br />
Amortization of capitalized interest .................................. — — —<br />
Less: Interest capitalized during the period ................................. (4.7) (0.5) (0.2)<br />
Undistributed earnings in equity investments ........................... — — —<br />
$979.4 $919.7 $544.3<br />
Fixed Charges:<br />
Interest expense ..................................................... $ 90.4 $ 72.1 $ 52.8<br />
Plus: Interest capitalized during the period ................................. 4.7 0.5 0.2<br />
Interest portion of rental expense .................................... 8.3 7.3 6.2<br />
$103.4 $ 79.9 $ 59.2<br />
Ratio of Earnings to Fixed Charges ..................................... 9.47 11.51 9.19
Name of Subsidiary<br />
HARRIS CORPORATION<br />
SUBSIDIARIES AS OF AUGUST 26, 2011<br />
(100% direct or indirect ownership by Harris Corporation, unless otherwise noted)<br />
Exhibit 21<br />
State or Other<br />
Jurisdiction of In<strong>corporation</strong><br />
Harris Atlas Systems LLC*. .............................................. AbuDhabi, UAE<br />
Harris Asia Pacific Sdn. Bhd. ............................................. Malaysia<br />
Harris Assured Communications S.R.L(Romania). ............................. Romania<br />
Harris (Beijing) Communications Technology Co., Ltd. . . . ....................... China<br />
Harris Broadcast Communications France S.A.R.L. ............................. France<br />
Harris Canada Holdings Inc. ............................................. Canada<br />
Harris Canada, Inc. .................................................... Canada<br />
Harris Canada Systems, Inc. .............................................. Canada<br />
Harris CapRock Communications, Inc. ...................................... Texas<br />
Harris Cayman Ltd. .................................................... Cayman Island<br />
Harris Communications Egypt, LLC ........................................ Egypt<br />
Harris Communication Systems (Ireland) Limited .............................. Ireland<br />
Harris Communications (Afghanistan) ....................................... Afghanistan<br />
Harris Communications Austria GmbH ...................................... Austria<br />
Harris Communications CIS Limited Liability Company . . ....................... Russia<br />
Harris Communications Congo SARL ....................................... Congo<br />
Harris Communications FZCO ............................................ Dubai, UAE<br />
Harris Communications GmbH ............................................ Germany<br />
Harris Communications Honduras S.A. de C.V. ................................ Honduras<br />
Harris Communications International India Private Limited ....................... India<br />
Harris Communications Limited ........................................... Hong Kong<br />
Harris Communications Malaysia Sdn. Bhd. .................................. Malaysia<br />
Harris Communications (Spain), S.L. ....................................... Spain<br />
Harris Communications YK .............................................. Japan<br />
Harris Denmark ApS ................................................... Denmark<br />
Harris Denmark Holding ApS ............................................. Denmark<br />
Harris EC Cayman Ltd. ................................................. Cayman Island<br />
Harris Global Communications Solutions Limited (Nigeria) ....................... Nigeria<br />
Harris International, Inc. ................................................ Delaware<br />
Harris International, Inc. (Afghanistan) ...................................... Afghanistan<br />
Harris International de Argentina S.R.L. ..................................... Argentina<br />
Harris International Chile Limitada ......................................... Chile<br />
Harris International de Mexico S. de R.L. de C.V. ............................. Mexico<br />
Harris International Holdings, LLC ......................................... Delaware<br />
Harris International Venezuela, C.A. ........................................ Venezuela<br />
Harris IT Services Corporation ............................................ Maryland<br />
Harris Norge AS. ...................................................... Norway<br />
Harris Patriot Healthcare Solutions, LLC ..................................... Pennsylvania<br />
Harris Pension Management Limited ........................................ United Kingdom<br />
Harris S.A. .......................................................... Belgium<br />
Harris Semiconductor Design & Sales Pte. Ltd. ............................... Singapore<br />
Harris Semiconductor Pte. Ltd. ............................................ Singapore<br />
Harris Software Systems (HK) Limited ...................................... Hong Kong<br />
Harris Software Systems Pte. Ltd. ......................................... Singapore<br />
Harris Software Systems Pty. Ltd. ......................................... Australia
Name of Subsidiary<br />
State or Other<br />
Jurisdiction of In<strong>corporation</strong><br />
Harris Solid-State (Malaysia) Sdn. Bhd. ..................................... Malaysia<br />
Harris Soluções em Comunicação do Brasil Ltda. .............................. Brazil<br />
Harris Systems Limited. ................................................. United Kingdom<br />
Harris Wireless Ireland Limited. ........................................... Ireland<br />
H2MI, LLC* ......................................................... Delaware<br />
510284 N.B. Inc. ...................................................... Canada<br />
CapRock Communications (Australia) Pty. Ltd. ............................... Australia<br />
CapRock Communications International, Inc. ................................. Delaware<br />
CapRock Communications International Limited ............................... Scotland<br />
CapRock Communications de México, S. de R.L. de C.V. . ....................... Mexico<br />
CapRock Communications Norway AS ...................................... Norway<br />
CapRock Communications Pte. Ltd. ........................................ Singapore<br />
CapRock Communications Servicios de México, S. de R.L. de C.V. ................ Mexico<br />
CapRock Comunicações Angola, Lda ....................................... Angola<br />
CapRock Comunicações Brasil Ltda. ....................................... Brazil<br />
CapRock Government Solutions, Inc. ....................................... Virginia<br />
CapRock Holdings do Brasil Participações Ltda. ............................... Brazil<br />
CapRock Holdings, Inc. ................................................. Delaware<br />
CapRock International Holdings, Ltd. ....................................... Bermuda<br />
CapRock UK, Ltd. ..................................................... Scotland<br />
Carefx Corporation ..................................................... Delaware<br />
Carefx International Corp. ............................................... Delaware<br />
Carefx Limited ........................................................ England and Wales<br />
CCI Services Corp. .................................................... Delaware<br />
CR Communications, Inc. ............................................... Texas<br />
CRMSA,LLC........................................................ Delaware<br />
CR Shared Services, LLC ................................................ Delaware<br />
Crucial Security, Inc. ................................................... Delaware<br />
Digital Automation (Canada) Limited ....................................... Canada<br />
Eagle Technology, LLC ................................................. Delaware<br />
GCS Limited (Cayman Islands). ........................................... Cayman Islands<br />
Encoda Systems de Mexico S.A. de C.V. .................................... Mexico<br />
HAL Technologies, LLC ................................................. Delaware<br />
Hunan Carefx Information Technology, LLC .................................. China<br />
Leitch Asia Limited .................................................... Hong Kong<br />
Manatee Investment, LLC ................................................ Delaware<br />
Maritime Communication Services, Inc. ..................................... Delaware<br />
Melbourne Leasing, LLC ................................................ Florida<br />
Pine Valley Investments, LLC ............................................. Delaware<br />
Project Chicago Merger, LLC ............................................. Delaware<br />
PT CapRock Communications Indonesia ..................................... Indonesia<br />
SARL Assured Communications ........................................... Algeria<br />
Saudi International Harris Communications ................................... Saudi Arabia<br />
SpaceLink Systems, Inc. ................................................ Texas<br />
SpaceLink Systems, LLC. ............................................... Delaware<br />
* Subsidiary of Harris Corporation less than 100% directly or indirectly owned by Harris Corporation.
Exhibit 23<br />
CONSENT OF INDEPENDENT REGISTERED PUBLIC ACCOUNTING FIRM<br />
We consent to the in<strong>corporation</strong> by reference in the following registration statements of Harris Corporation and<br />
in the related Prospectuses of our reports dated August 29, 2011, with respect to the consolidated financial<br />
statements and schedule of Harris Corporation, and the effectiveness of internal control over financial reporting of<br />
Harris Corporation, included in this Annual Report (Form 10-K) for the year ended July 1, 2011:<br />
Form S-8 No. 333-163647 Harris Corporation Retirement Plan<br />
Form S-8 No. 333-49006 Harris Corporation 2000 Stock Incentive Plan<br />
Form S-8 No. 333-130124 Harris Corporation 2005 Equity Incentive Plan<br />
Form S-3 ASR No. 333-159688 Harris Corporation Debt and Equity Securities<br />
Boca Raton, Florida<br />
August 29, 2011<br />
/s/ ERNST & YOUNG LLP<br />
Certified Public Accountants
CERTIFICATIONS<br />
Exhibit 31.1<br />
I, Howard L. Lance, Chairman of the Board, President and Chief Executive Officer of Harris Corporation, certify<br />
that:<br />
1. I have reviewed this Annual Report on Form 10-K for the fiscal year ended July 1, 2011, of Harris<br />
Corporation;<br />
2. Based on my knowledge, this report does not contain any untrue statement of a material fact or omit to state<br />
a material fact necessary to make the statements made, in light of the circumstances under which such statements<br />
were made, not misleading with respect to the period covered by this report;<br />
3. Based on my knowledge, the financial statements, and other financial information included in this report,<br />
fairly present in all material respects the financial condition, results of operations and cash flows of the registrant as<br />
of, and for, the periods presented in this report;<br />
4. The registrant’s other certifying officer and I are responsible for establishing and maintaining disclosure<br />
controls and procedures (as defined in Exchange Act Rules 13a-15(e) and 15d-15(e)) and internal control over<br />
financial reporting (as defined in Exchange Act Rules 13a-15(f) and 15d-15(f)) for the registrant and have:<br />
(a) Designed such disclosure controls and procedures, or caused such disclosure controls and procedures<br />
to be designed under our supervision, to ensure that material information relating to the registrant, including its<br />
consolidated subsidiaries, is made known to us by others within those entities, particularly during the period in<br />
which this report is being prepared;<br />
(b) Designed such internal control over financial reporting, or caused such internal control over financial<br />
reporting to be designed under our supervision, to provide reasonable assurance regarding the reliability of<br />
financial reporting and the preparation of financial statements for external purposes in accordance with<br />
generally accepted accounting principles;<br />
(c) Evaluated the effectiveness of the registrant’s disclosure controls and procedures and presented in this<br />
report our conclusions about the effectiveness of the disclosure controls and procedures, as of the end of the<br />
period covered by this report based on such evaluation; and<br />
(d) Disclosed in this report any change in the registrant’s internal control over financial reporting that<br />
occurred during the registrant’s most recent fiscal quarter (the registrant’s fourth fiscal quarter in the case of an<br />
annual report) that has materially affected, or is reasonably likely to materially affect, the registrant’s internal<br />
control over financial reporting; and<br />
5. The registrant’s other certifying officer and I have disclosed, based on our most recent evaluation of internal<br />
control over financial reporting, to the registrant’s auditors and the audit committee of the registrant’s board of<br />
directors (or persons performing the equivalent functions):<br />
(a) All significant deficiencies and material weaknesses in the design or operation of internal control over<br />
financial reporting which are reasonably likely to adversely affect the registrant’s ability to record, process,<br />
summarize and report financial information; and<br />
(b) Any fraud, whether or not material, that involves management or other employees who have a<br />
significant role in the registrant’s internal control over financial reporting.<br />
Date: August 29, 2011<br />
/s/ HOWARD L. LANCE<br />
Name: Howard L. Lance<br />
Title: Chairman of the Board, President and Chief<br />
Executive Officer
CERTIFICATIONS<br />
I, Gary L. McArthur, Senior Vice President and Chief Financial Officer of Harris Corporation, certify that:<br />
1. I have reviewed this Annual Report on Form 10-K for the fiscal year ended July 1, 2011, of Harris<br />
Corporation;<br />
Exhibit 31.2<br />
2. Based on my knowledge, this report does not contain any untrue statement of a material fact or omit to state<br />
a material fact necessary to make the statements made, in light of the circumstances under which such statements<br />
were made, not misleading with respect to the period covered by this report;<br />
3. Based on my knowledge, the financial statements, and other financial information included in this report,<br />
fairly present in all material respects the financial condition, results of operations and cash flows of the registrant as<br />
of, and for, the periods presented in this report;<br />
4. The registrant’s other certifying officer and I are responsible for establishing and maintaining disclosure<br />
controls and procedures (as defined in Exchange Act Rules 13a-15(e) and 15d-15(e)) and internal control over<br />
financial reporting (as defined in Exchange Act Rules 13a-15(f) and 15d-15(f)) for the registrant and have:<br />
(a) Designed such disclosure controls and procedures, or caused such disclosure controls and procedures<br />
to be designed under our supervision, to ensure that material information relating to the registrant, including its<br />
consolidated subsidiaries, is made known to us by others within those entities, particularly during the period in<br />
which this report is being prepared;<br />
(b) Designed such internal control over financial reporting, or caused such internal control over financial<br />
reporting to be designed under our supervision, to provide reasonable assurance regarding the reliability of<br />
financial reporting and the preparation of financial statements for external purposes in accordance with<br />
generally accepted accounting principles;<br />
(c) Evaluated the effectiveness of the registrant’s disclosure controls and procedures and presented in this<br />
report our conclusions about the effectiveness of the disclosure controls and procedures, as of the end of the<br />
period covered by this report based on such evaluation; and<br />
(d) Disclosed in this report any change in the registrant’s internal control over financial reporting that<br />
occurred during the registrant’s most recent fiscal quarter (the registrant’s fourth fiscal quarter in the case of an<br />
annual report) that has materially affected, or is reasonably likely to materially affect, the registrant’s internal<br />
control over financial reporting; and<br />
5. The registrant’s other certifying officer and I have disclosed, based on our most recent evaluation of internal<br />
control over financial reporting, to the registrant’s auditors and the audit committee of the registrant’s board of<br />
directors (or persons performing the equivalent functions):<br />
(a) All significant deficiencies and material weaknesses in the design or operation of internal control over<br />
financial reporting which are reasonably likely to adversely affect the registrant’s ability to record, process,<br />
summarize and report financial information; and<br />
(b) Any fraud, whether or not material, that involves management or other employees who have a<br />
significant role in the registrant’s internal control over financial reporting.<br />
Date: August 29, 2011<br />
/s/ GARY L. MCARTHUR<br />
Name: Gary L. McArthur<br />
Title: Senior Vice President and Chief Financial Officer
Exhibit 32.1<br />
Certification<br />
Pursuant to Section 1350 of Chapter 63 of Title 18 of the<br />
United States Code as Adopted Pursuant to Section 906<br />
of the Sarbanes-Oxley Act of 2002<br />
In connection with the filing of the Annual Report on Form 10-K of Harris Corporation (“Harris”) for the fiscal<br />
year ended July 1, 2011, as filed with the Securities and Exchange Commission on the date hereof (the “Report”),<br />
the undersigned, Howard L. Lance, Chairman of the Board, President and Chief Executive Officer of Harris, hereby<br />
certifies, pursuant to Section 906 of the Sarbanes-Oxley Act of 2002, 18 U.S.C. § 1350, that:<br />
(1) The Report fully complies with the requirements of Section 13(a) or 15(d), as applicable, of the<br />
Securities Exchange Act of 1934, as amended; and<br />
(2) The information contained in the Report fairly presents, in all material respects, the financial condition<br />
and results of operations of Harris as of the dates and for the periods expressed in the Report.<br />
Date: August 29, 2011<br />
/s/ HOWARD L. LANCE<br />
Name: Howard L. Lance<br />
Title: Chairman of the Board, President and Chief<br />
Executive Officer
Exhibit 32.2<br />
Certification<br />
Pursuant to Section 1350 of Chapter 63 of Title 18 of the<br />
United States Code as Adopted Pursuant to Section 906<br />
of the Sarbanes-Oxley Act of 2002<br />
In connection with the filing of the Annual Report on Form 10-K of Harris Corporation (“Harris”) for the fiscal<br />
year ended July 1, 2011, as filed with the Securities and Exchange Commission on the date hereof (the “Report”),<br />
the undersigned, Gary L. McArthur, Senior Vice President and Chief Financial Officer of Harris, hereby certifies,<br />
pursuant to Section 906 of the Sarbanes-Oxley Act of 2002, 18 U.S.C. § 1350, that:<br />
(1) The Report fully complies with the requirements of Section 13(a) or 15(d), as applicable, of the<br />
Securities Exchange Act of 1934, as amended; and<br />
(2) The information contained in the Report fairly presents, in all material respects, the financial condition<br />
and results of operations of Harris as of the dates and for the periods expressed in the Report.<br />
Date: August 29, 2011<br />
/s/ GARY L. MCARTHUR<br />
Name: Gary L. McArthur<br />
Title: Senior Vice President and Chief Financial Officer
SHAREHOLDER INFORMATION<br />
CORPORATE HEADQUARTERS<br />
Harris Corporation<br />
1025 West NASA Boulevard<br />
Melbourne, Florida 32919<br />
321-727-9100<br />
www.<strong>harris</strong>.com<br />
STOCK EXCHANGE<br />
Harris common stock is listed and traded on the New York Stock<br />
Exchange. Ticker Symbol: HRS<br />
TRANSFER AGENT AND REGISTRAR<br />
BNY Mellon Shareowner Services<br />
480 Washington Boulevard<br />
Jersey City, New Jersey 07310-1900<br />
888-261-6777<br />
Outside the U.S., please dial 201-680-6578<br />
www.melloninvestor.com/isd<br />
SHAREHOLDER SERVICES<br />
BNY Mellon Shareowner Services maintains the records for our<br />
registered shareholders and can assist you with a variety of shareholderrelated<br />
services at no charge.<br />
The BNY Mellon automated telephone voice response system,<br />
at 888-261-6777, is available 24 hours a day, 7 days a week, to conduct<br />
a wide variety of secure transactions.<br />
Electronic access to your financial statements and shareholder<br />
communications is available 24 hours a day, 7 days a week,<br />
via BNY Mellon’s secure Investor ServiceDirect® website. Visit<br />
www.melloninvestor.com/isd to view and print Investment<br />
Plan Statements, Investor Activity Reports, 1099 tax documents,<br />
notification of ACH transmissions, transaction activities,<br />
annual meeting materials and other selected correspondence.<br />
You can also send mail to BNY Mellon at:<br />
Harris Corporation<br />
c/o BNY Mellon Shareowner Services<br />
P.O. Box 3315<br />
South Hackensack, New Jersey 07606-1915<br />
ANNUAL MEETING<br />
The 2011 annual meeting of shareholders will be held on October 28<br />
at the Customer Briefing Center on the Harris Corporate Headquarters<br />
campus, Melbourne, Florida, starting at 1:00 p.m. Eastern Time.<br />
The meeting will be webcast and can be accessed from a link on the<br />
Investor Relations page on the Harris website: www.<strong>harris</strong>.com.<br />
INDEPENDENT ACCOUNTANTS<br />
Ernst & Young LLP<br />
Boca Raton, Florida<br />
FORWARD-LOOKING STATEMENTS<br />
This report, including the letter to shareholders, contains forward-<br />
looking statements that are based on the views of management<br />
regarding future events at the time of publi cation of this report.<br />
These forward-looking statements, which include, but are not limited<br />
to: our plans, strategies and objectives for future operations; new<br />
products, services or developments; future economic conditions;<br />
outlook; the value of contract and program awards; the effect of our<br />
acquisitions on our business; our growth potential; and the potential<br />
of the industries and markets we serve, are subject to known and<br />
unknown risks, uncertainties, and other factors that may cause our<br />
actual results to be materially different from those expressed in or<br />
implied by each forward-looking statement. These risks, uncertainties,<br />
and other factors are discussed in our Form 10-K for the fiscal year<br />
ended July 1, 2011.<br />
ANNUAL CERTIFICATIONS<br />
The most recent certifications by our Chief Executive Officer and<br />
Chief Financial Officer pursuant to sections 302 and 906 of the<br />
Sarbanes-Oxley Act of 2002 were filed as exhibits to our Form 10-K<br />
for the fiscal year ended July 1, 2011. Our most recent annual CEO<br />
certification regarding Harris compliance with corporate governance<br />
listing standards was submitted to the New York Stock Exchange on<br />
November 19, 2010.<br />
A portion of this report is printed on Monadnock Astrolite<br />
pc 100®, which is 100% post-consumer recycled material.<br />
Monadnock uses post-consumer fiber from waste sources<br />
that are carefully selected and controlled. The entire report<br />
is printed on papers that are Forest Stewardship Council®<br />
(FSC®) certified.<br />
DESIGN: SVP PARTNERS EXECUTIVE PHOTOGRAPHY: TED KAWALERSKI<br />
PRINTING: RR DONNELLEY/MORAN
HARRIS CORPORATION<br />
1025 West NASA Boulevard<br />
Melbourne, Florida 32919<br />
U.S.: 1-800-442-7747<br />
International: 1-321-727-9207<br />
www.<strong>harris</strong>.com