honey bush tea - Department of Agriculture: Western Cape
honey bush tea - Department of Agriculture: Western Cape
honey bush tea - Department of Agriculture: Western Cape

Create successful ePaper yourself
Turn your PDF publications into a flip-book with our unique Google optimized e-Paper software.
1.1 Background<br />
REPORT: HONEY BUSH TEA<br />
CHAPTER ONE<br />
INTRODUCTION<br />
World markets have become open-minded, globalisation is increasing and international<br />
competition is rising, and the need for substantiated qualitative and quantitative<br />
information increases. This applies especially for those products for which the market is<br />
either booming already or for which market potentials are high. Such products are<br />
basically found in the food and pharmaceutical area, as these sectors still grow much<br />
faster than related markets such as industrial chemical areas etc. Tea, for example,<br />
has become an ever more popular beverage in the <strong>Western</strong> world and especially health<br />
<strong>tea</strong>s that have come to fame with recent scientific findings on their benefits as having<br />
medicinal properties. These are increasingly publicised in the media and heavily<br />
promoted in magazines devoted to specific target groups.<br />
In the <strong>Western</strong> <strong>Cape</strong>, the growing popularity towards natural products like <strong>honey</strong><strong>bush</strong><br />
<strong>tea</strong> is because <strong>of</strong> their potential to economic development, in terms <strong>of</strong> job creation,<br />
income generation, export earnings, value adding, counteracting demand in the<br />
northern hemisphere, etc. With regard to <strong>honey</strong><strong>bush</strong>, although an ancient product, it is<br />
only recently that it went to commercialisation and appeared on the market shelves, and<br />
hence treated as a new comer (Wesgro, 2001). Therefore, production <strong>of</strong> <strong>honey</strong><strong>bush</strong><br />
since it is a new crop carries large risks at this moment. This emphasise the need for<br />
research and extension efforts that will reduce the risks inherent with the adoption and<br />
commercialisation <strong>of</strong> it as a new crop.<br />
However, production and post-harvest trials by a few institutions and specialists are still<br />
underway as even a few hectares that are planted, have not been in production long<br />
enough for the results to be finalised at this stage. These trials are producing<br />
scientifically based results that can begin to round out our knowledge <strong>of</strong> how<br />
performance varies under varying environmental conditions, cultural and management<br />
practices. However, this knowledge needs to be complemented by a more systematic<br />
1
understanding <strong>of</strong> production costs and returns studies, and assessments <strong>of</strong> market<br />
trends.<br />
With this information altogether we would have a more total package <strong>of</strong> information to<br />
inform the decision-making <strong>of</strong> small and large-scale operators. Market related issues<br />
and production costs and return information are among the top issues identified by the<br />
industry. These issues are particularly critical for new or specialty crops, because<br />
unlike other well-established commodities, information is limited at its best. Hence, the<br />
South African Honey<strong>bush</strong> Tea Association requested the <strong>Department</strong> <strong>of</strong> <strong>Agriculture</strong> to<br />
conduct a study on the economic analysis <strong>of</strong> <strong>honey</strong><strong>bush</strong> <strong>tea</strong>.<br />
The study will give a brief overview <strong>of</strong> the black <strong>tea</strong> market focusing on both demand<br />
and supply issues. The reason being that although <strong>honey</strong><strong>bush</strong> is a health <strong>tea</strong>, it still<br />
faces competition from other <strong>tea</strong>s that serve a similar purpose and hence trends<br />
particularly in the black <strong>tea</strong> market are <strong>of</strong> importance. As new products are being<br />
introduced and more competition arises, pr<strong>of</strong>it margins will be affected. Thus, there is<br />
increasing need to study the economic efficiency <strong>of</strong> <strong>honey</strong><strong>bush</strong>. For this purpose, a<br />
number <strong>of</strong> farm management tools such as gross and net margins are used in this<br />
study.<br />
An effort will also be made to compare different species <strong>of</strong> <strong>honey</strong><strong>bush</strong> and farming<br />
practices i.e. small and commercial scales). However, it should be noted that the study<br />
is not meant to be comprehensive, but should be taken as a contribution or a<br />
background to the analysis <strong>of</strong> the entrepreneur who has the opportunity and or want to<br />
invest in the <strong>honey</strong><strong>bush</strong> industry.<br />
1.2 Product Description and Benefits<br />
All <strong>honey</strong><strong>bush</strong> <strong>tea</strong>s are derived from one plant, Cyclopia spp. It is the region <strong>of</strong> origin<br />
that mainly determines the variety. “Heuningtee, Bergtee, Boertee, Bossiestee,<br />
Bush<strong>tea</strong>” are some <strong>of</strong> the many names the <strong>tea</strong> is called. The indigenous shrub,<br />
belonging to the <strong>Cape</strong> fynbos biome, grows in the coastal districts <strong>of</strong> the <strong>Western</strong> and<br />
Eastern <strong>Cape</strong> Provinces, from Darling to Port Elizabeth, being bounded on the north by<br />
the Cederberg, Koue Bokkeveld, Klein Swartberg, Groot Swartberg and Kouga<br />
2
mountain ranges. These are the only places where <strong>honey</strong><strong>bush</strong> grows<br />
(www.montego<strong>tea</strong>.com).<br />
For marketing and statistical purposes, the processing method after harvesting plays a<br />
very important role as it distinguishes the <strong>tea</strong> according to different categories which are<br />
discussed in forth coming subsection.<br />
1.2.1 Botanical description <strong>of</strong> <strong>honey</strong><strong>bush</strong><br />
Honey<strong>bush</strong> (Cyclopia spp) is an indigenous plant to South Africa, and is well known for<br />
its pleasant taste and flavour. It is expected to have approximately 24 species that are<br />
endemic to the fynbos region <strong>of</strong> South Africa. From this, only Cyclopia intermedia<br />
(“bergtee”), Cyclopia subternata (“vleitee”) have found limited commercial applications.<br />
But it is known that the Cyclopia maculata, Cyclopia genistoides and Cyclopia<br />
sessiliflora (“Heidelbergtee”) species have been used for home consumption. Except<br />
from the wild, species such as Cyclopia intermedia and Cyclopia subternata have<br />
plantations on both small and commercial scales while Cyclopia genistoides is currently<br />
available on commercial scale only. Other species, including Cyclopia meyeriana,<br />
Cyclopia pubescens, Cyclopia dregeana and Cyclopia buxifolia, are currently being<br />
evaluated for future commercialisation (www.montego<strong>tea</strong>.com).<br />
Honey<strong>bush</strong> <strong>tea</strong> plants have woody stems, a relatively low ratio <strong>of</strong> leaves to stems and<br />
hard-shelled seeds that germinate poorly if not scarified prior to germination. Leaf<br />
shape and size differ within the species, but are mostly thin, needle-like to elongated,<br />
broadish leaves. During the flowering period the <strong>bush</strong>es are easily recognized in the<br />
field as they are covered with distinctive, deep-yellow flowers, which have a<br />
characteristic sweet <strong>honey</strong> scent, from which the <strong>tea</strong> acquires its name.<br />
According to traditional methods the <strong>tea</strong> is harvested during the flowering period.<br />
Cyclopia intermedia and Cyclopia subternata flower in September/October while<br />
Cyclopia sessiliflora flowers in May/June. Bushes <strong>of</strong> the lower yielding varieties<br />
Cyclopia intermedia are observed to be sustainable when harvested every two years. A<br />
year break in Cyclopia intermedia is observed to give enough time for the plant to<br />
regenerate after harvesting. It is also observed that after a fire, the <strong>bush</strong>es <strong>of</strong> Cyclopia<br />
3
intermedia show more growth, have more flowers and <strong>of</strong>ten reach one to one and half<br />
meters in height (www.healthwisefood.com).<br />
1.2.2 Harmonised System description <strong>of</strong> <strong>tea</strong><br />
Although called red <strong>tea</strong>s, <strong>honey</strong><strong>bush</strong> like rooibos is classified under black <strong>tea</strong>. Tea is<br />
normally classified based on the processing, leaf size and grade. Fermentation is the<br />
major process and creates two major classifications, black and green <strong>tea</strong>. Black <strong>tea</strong> is<br />
further classified into CTC (cut, <strong>tea</strong>r and curl) and Orthodox <strong>tea</strong><br />
(www.valuenotes.biz/research/<strong>tea</strong>toc.asp). In other words the red <strong>tea</strong>s including<br />
rooibos and <strong>honey</strong><strong>bush</strong> (called black <strong>tea</strong>s in English) are fermented for a few hours<br />
while the oolong <strong>tea</strong>s are fermented for a shorter time (see classification below).<br />
Unfermented Tea Green <strong>tea</strong><br />
Partially fermented <strong>tea</strong> Pauchong <strong>tea</strong><br />
4<br />
Oolong <strong>tea</strong><br />
Fermented <strong>tea</strong> Black <strong>tea</strong><br />
With regard to statistics, there are three basic types <strong>of</strong> black <strong>tea</strong>. These include, ready-<br />
to-brew <strong>tea</strong> that is packaged for retail sale in containers <strong>of</strong> 3kg or less, black <strong>tea</strong> that<br />
can be sold as bulk and is unprocessed or blended which can then be processed in the<br />
country concerned. Lastly, is instant <strong>tea</strong> that is used mainly for vending machines or<br />
confections. As a result, the study will mainly relate to these types <strong>of</strong> black <strong>tea</strong> as also<br />
classified in the Harmonised System (HS).<br />
1.2.3 Benefits<br />
Honey<strong>bush</strong> shares some similar characteristics with rooibos, but differs very in taste<br />
and aroma as observed to be more aromatic. It is an herbal infusion and many health<br />
properties are associated with its regular consumption as the <strong>tea</strong> and hence<br />
comparable to other health <strong>tea</strong>s. Its potential rely on the following benefits:
The plant has antioxidants that are known to be potent free radical scavengers.<br />
Free radicals are the very unstable compounds that attack DNA, proteins and<br />
fatty acids, leading to health problems such as cancer and heart disease.<br />
Honey<strong>bush</strong> and Rooibos <strong>tea</strong>s are scientifically proven anti-mutagenics (process<br />
whereby the genetic material <strong>of</strong> a cell is damaged and normally associated with<br />
the early stages <strong>of</strong> cancer as well as the general ageing process). Specifically,<br />
these indigenous plants are rich in phyto-estrogens which have been positively<br />
linked to a reduction in the risk <strong>of</strong> developing hormone-related diseases such as<br />
breast, prostate and uterine cancer. Phyto-estrogens also help to regulate the<br />
menstrual cycle, alleviate symptoms <strong>of</strong> menopause, prevent osteoporosis,<br />
reduce the risk <strong>of</strong> heart disease, and protect against premature ageing.<br />
The <strong>tea</strong> is also low in tannin and is caffeine free, which are significant factors for<br />
people who have to avoid stimulants. It is therefore especially valuable for<br />
children and patients with digestive and heart problems where stimulants and<br />
tannins should be avoided.<br />
Honey<strong>bush</strong> has soothing and relaxing effects and have been found to counter<br />
headaches, irritability, tension and insomnia and depression.<br />
It has effective anti-spasmodics and thefore good for people who suffer from<br />
stomach cramps. Other stomach ailments such as stomach ulcers, nausea,<br />
heartburn and constipation have been found to respond positively to Honey<strong>bush</strong>.<br />
Honey<strong>bush</strong> has significant anti-viral properties and help to build up the body’s<br />
auto-immune system. Allergic conditions such as hay fever, asthma and excema<br />
respond well to treatment with Honey<strong>bush</strong> and Rooibos<br />
(www.cape<strong>honey</strong><strong>bush</strong><strong>tea</strong>.co.za).<br />
1.3 Methodology<br />
The study aims to outline the black <strong>tea</strong> and eventually <strong>honey</strong><strong>bush</strong> market with emphasis<br />
on supply and demand side at both international and domestic market. Secondly, the<br />
study determines the costs <strong>of</strong> production based on the actual and current operations <strong>of</strong><br />
<strong>honey</strong><strong>bush</strong>. These will be achieved through using various sources <strong>of</strong> information.<br />
Firstly, the desktop approach is followed particularly for market information where World<br />
Wide Web is explored for relevant information. In addition, reviewing available<br />
5
literature, publications and studies are also used for market intelligence. The technical<br />
information for enterprise budget analysis that is presented in this report is obtained by<br />
means <strong>of</strong> interviews with individual farmers and agricultural related institutions involved<br />
in <strong>honey</strong><strong>bush</strong> research like ARC-Nietvoorbij and ASNAPP. This data is then quantified<br />
and processed in Combud, acronym for Computerised Budgets, to enable economic<br />
assessment. Price estimates <strong>of</strong> chemical inputs were obtained from local suppliers.<br />
The information on the budgets is predicted on a convenient unit <strong>of</strong> production, which is<br />
a hectare for the purpose <strong>of</strong> this study. The financial model used in this study is based<br />
on actual <strong>honey</strong><strong>bush</strong> <strong>tea</strong> practices in various regions, i.e. Haarlem for information on<br />
small-scale and in Albertinia and Riversdale on commercial operations. The end result<br />
<strong>of</strong> this model is the calculation <strong>of</strong> the unit gross margin and net margin for the selected<br />
enterprise for a typical s<strong>tea</strong>dy-state year. These are discussed in details under<br />
economic analysis in Chapter 3.<br />
6
CHAPTER TWO<br />
DEMAND ANALYSIS<br />
Given the fact that <strong>tea</strong> is the second most consumed drink in the world after water, one<br />
might be tempted to think that future prospects <strong>of</strong> the world <strong>tea</strong> market look good.<br />
People drink <strong>tea</strong> for a number <strong>of</strong> reasons. On one hand, drinking is a basic need for<br />
human body that has long been associated with pleasure. One does not drink only to<br />
input H2O (water) in the body cells, but also expects a variety <strong>of</strong> pleasing tastes and<br />
feelings. On the other, consumers are now demanding even more as they require that<br />
a beverage must not only taste good, but also do good. In other words consumers,<br />
especially in the developed world, expect healthy, functional beverages.<br />
2.1. Consumption by Country<br />
The top <strong>tea</strong> producing countries such as India, China and the like are also the top<br />
consumers. In fact, Datamonitor in 2003 predicted that the Indian <strong>tea</strong> consumption will<br />
outstrip Britain's by 2004. The UK is one <strong>of</strong> the biggest consumers although not in the<br />
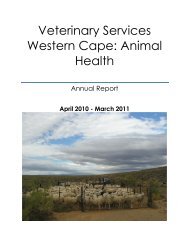
group <strong>of</strong> producers. In the year 2000, Ireland took the first place and was estimated at<br />
approximately 4.5kg in per capita consumption, followed by Britain at 3.8kg. Diverging<br />
from the European countries, Russia took the third position with per capita consumption<br />
<strong>of</strong> 3.5kg (see Figure 1). In 2001, although consumption took a slide, Ireland was still<br />
leading with 3kg, UK (2.4kg) and France (0.2kg). Regarding the German market, there<br />
were no changes as consumption remained static and estimated at 0.2kg or 19,760<br />
tons in 2000.<br />
7
Kilogram<br />
5<br />
4.5<br />
4<br />
3.5<br />
3<br />
2.5<br />
2<br />
1.5<br />
1<br />
0.5<br />
0<br />
Ireland<br />
Source: Walker, 2002<br />
Britain Russia Ukraine Scandinivia Netherlands Germany East Friesland<br />
Figure 1 Per capita <strong>tea</strong> consumption in Europe, 2000<br />
Although not shown in Figure 1, Austria is also among the countries that pose a<br />
glooming picture with consumption <strong>of</strong> quality <strong>tea</strong> estimated to double in the last 10<br />
years. Similarly, Poland has also a growing consumption and is estimated between 5<br />
and 10% each year. Another positive picture is observed in Turkey with some 2.3<br />
kilograms per capita drunk each year (Datamonitor, 2003).<br />
2.1.1 Market sales by country<br />
Despite the traditional image that Britain holds as one <strong>of</strong> the world’s largest consumers<br />
<strong>of</strong> <strong>tea</strong>, the country’s <strong>tea</strong> drinking habit is waning. Britain is in fact still the largest <strong>tea</strong><br />
market in <strong>Western</strong> Europe, representing 86.9% in overall volume terms and 92.6% <strong>of</strong><br />
volume sales <strong>of</strong> black <strong>tea</strong>. Although in 2000, sales <strong>of</strong> <strong>tea</strong> fell by 0.1% and by 2005, total<br />
sales are expected to fall from a total consumption <strong>of</strong> 127,700 tons in 2000 to 117,100<br />
tons. The market has seen a decline in sales <strong>of</strong> mainstream black <strong>tea</strong> bags, a slight<br />
increase in consumption <strong>of</strong> green, organic, and fair-trade <strong>tea</strong>s and a growing interest in<br />
the fruit and herb segment with <strong>honey</strong><strong>bush</strong> <strong>tea</strong> benefiting especially in the later<br />
segment.<br />
8
In France, sales <strong>of</strong> <strong>tea</strong> grew in the year 2000 by 7.7% and by 2005 are predicted to<br />
increase from 14 million litres to 21 million litres, an increase <strong>of</strong> 8.4% since 2001. Also<br />
in Italy, growth in 2000 was 1.8% and total volume is expected to grow from 3,065 tons<br />
that year to 3,325.6 tons in 2005, an overall increase <strong>of</strong> 1.6% since 2001. In Hungary,<br />
sales <strong>of</strong> <strong>tea</strong> grew by 3% in 2000 to 2,758.6 kilos and are forecast to reach 2,908.9 kilos<br />
by 2005, up by 1.1% on figures for 2001. Sales <strong>of</strong> <strong>tea</strong> in the Ukraine grew by 4.7% in<br />
2000 and total volume is forecast to rise from 13,400 tons in 2000 to 16,500 tons in<br />
2005 (Pettigrew, 2002). Likewise, in Russia, a fall in sales in 1999 has been reversed<br />
and total sales for 2001 amounted to 165,000 tons up by 10% on the 1999 figure.<br />
There have also been shifts in the position <strong>of</strong> individual European companies in the<br />
brand league table. In 1998, Unilever’s Brooke Bond took the lead from Tetley and now<br />
tops the list with 27.6% <strong>of</strong> market share. The other three main brands are Premier<br />
International Foods, R. Twining, and Taylors <strong>of</strong> Harrogate (Pettigrew, 2002). In<br />
countries such as the USA one most popular hot drink used to be c<strong>of</strong>fee, but those days<br />
are gone as the <strong>tea</strong> industry is undergoing a dramatic period <strong>of</strong> change from that <strong>of</strong> the<br />
1990s. This can be seen in Table 1 below.<br />
Table 1 Estimated wholesale value <strong>of</strong> the United Sates <strong>tea</strong> industry<br />
Market segments 1990 2002<br />
Traditional Market (supermarket, drug stores & mass)<br />
(estimates)<br />
$0.87 billion $1.80 billion<br />
merchandisers)<br />
R-T-D Market (increment only) 0.20 1.85<br />
Foodservice Segment 0.50 0.80<br />
Specialty Segment 0.27 0.58<br />
Total Sales $1.84 billion $5.03 billion<br />
Source: Simrany, 2002<br />
In 2003, the US <strong>tea</strong> industry still presented a promising image as <strong>tea</strong> consumption<br />
continued to grow in both volume and value terms. US <strong>tea</strong> retail volume sales grew by<br />
an estimated 1.3% in 2003, and by 10.3% between 1998 and 2003, to 32,794 tonnes.<br />
In 2003, current value sales gains exceeded those in volume with increase estimated at<br />
4.2% from 2002, and by 28.3% from 1998.<br />
9
2.2 Consumption per Product Category and Opportunities<br />
The consumer trend towards health and convenience is underlined by the ongoing rise<br />
<strong>of</strong> herbal products that led to new terminologies and or segments such as<br />
nutraceuticals, enriched, energised etc. Consumers appear to be turning to more<br />
flavoursome or healthy alternatives consumption <strong>of</strong> which increased by almost 50 per<br />
cent between 1997 and 2002. These trends are observed in various industries that use<br />
herbal products in different applications and in different forms and these will be<br />
highlighted in this section.<br />
2.2.1 Instant <strong>tea</strong>s<br />
In 1997, British consumers bought 127 million kilograms <strong>of</strong> normal <strong>tea</strong>bags, but by<br />
2002, consumption had decreased to 114 million. But c<strong>of</strong>fee, perhaps the most natural<br />
alternative to <strong>tea</strong>, is not filling the gap either as instant c<strong>of</strong>fee sales are falling, and even<br />
sales <strong>of</strong> ground c<strong>of</strong>fee fell in 2002. Nevertheless, Britain is not the only country where<br />
hot beverage consumption is undergoing something <strong>of</strong> a revolution.<br />
Instant <strong>tea</strong> sales all over the world appear to be in decline according to Datamonitor.<br />
One exception, however, is decaffeinated <strong>tea</strong> sales which fell even faster than regulars.<br />
According to Datamonitor, 2003 “it's more about image, as a stereotypical decaf drinker<br />
is perceived as a recovering caffeine addict, while a stereotypical flavoured <strong>tea</strong> drinker<br />
is perceived as 'stable', 'modern' and 'with it”. Convenience, which is one <strong>of</strong> the<br />
assumed trends behind instant <strong>tea</strong> consumption, is also playing a less important role in<br />
this category.<br />
Also in Japan for example, where instant <strong>tea</strong> has long been popular, sales dropped<br />
severely by over 6 per cent a year between 1997 and 2002 (Datamonitor, 2003).<br />
However, consumers may have shown some resistance to instant <strong>tea</strong>s in the past,<br />
mainly because <strong>of</strong> their inferior taste and aroma. Marketers believe that Instant<br />
Rooibos and Honey<strong>bush</strong> products could change all this by capturing the enigmatic taste<br />
and flavour so characteristic <strong>of</strong> these two South African brews (Snyman, 2000). In other<br />
words, this means an opportunity for <strong>honey</strong><strong>bush</strong> to be used in blending as it can give<br />
beverages a unique taste and flavour.<br />
10
2.2.2 S<strong>of</strong>t drinks<br />
According to Euromonitor’s report in 2002 the world market for s<strong>of</strong>t drinks, May 2001,<br />
experienced an explosive growth especially in functional drinks. The functional<br />
category recorded an annual average growth rate <strong>of</strong> about 10% between 1995 and<br />
2000. This is believed to be spurred by spots nutrition and media influence. Although<br />
the terminology is therefore not yet established, varying according to the sources <strong>of</strong><br />
information. Some include enriched drinks, nutraceuticals drinks, herbal drinks, sports<br />
and energy drinks, whereas the others can only focus on the last two categories.<br />
Within the s<strong>of</strong>t drinks market, functional drinks show the highest growth even though<br />
they account for 3% <strong>of</strong> the total s<strong>of</strong>t drinks volume. This tendency is expected to speed<br />
up in future putting total forecasts for 2004 at 14 billion litres <strong>of</strong> functional drinks. The<br />
evolution <strong>of</strong> functional drinks varies from one region to another. The Asia Pacific<br />
Region including Japan, is the biggest market size, but records the smallest<br />
progression. The US market is still expanding at a rate above 10% per annum,<br />
whereas the European market is booming, with 15% growth between 1998 and 1999,<br />
although from a small volume basis. In world market share per category, enriched<br />
drinks come to the first position in most regions <strong>of</strong> the world, except in Japan, where<br />
nutraceuticals drinks dominate.<br />
Enriched drinks 30%<br />
Nutraceuticals drinks 21%<br />
Energy drinks 15%<br />
Herbal dinks 10%<br />
Sports drinks 9%<br />
Other functional drinks 12%<br />
Despite the above terminology and the fact <strong>honey</strong><strong>bush</strong> <strong>tea</strong> being a pleasant warm drink,<br />
it also has the features to be competitive in the ice <strong>tea</strong> market. This is one <strong>tea</strong> based<br />
drink that is experiencing an increasing popularity already. In 2001, the UK alone sold<br />
14 million litres despite the poor summer weather they had during that period<br />
(Datamonitor, 2003). Datamonitor also stressed that even if ice <strong>tea</strong> in Europe is<br />
11
experiencing a tremendous increase in consumption, it is unlikely to reach the dizzy<br />
heights <strong>of</strong> the US, where <strong>tea</strong> is almost always drunk over ice.<br />
Regarding the ready-to-drink (RTD) <strong>honey</strong><strong>bush</strong>, it is not yet available in the market,<br />
which portrays a big opportunity that still awaits <strong>honey</strong><strong>bush</strong> both in the domestic and<br />
global arena. Even its rival Rooibos iced <strong>tea</strong> has not yet made any meaningful impact<br />
on the international s<strong>of</strong>t drink market, but demand is expected to surge along with the<br />
growing popularity <strong>of</strong> other iced <strong>tea</strong>s and s<strong>of</strong>t drinks in Europe, the US and Canada<br />
especially.<br />
2.2.3 Speciality <strong>tea</strong>s<br />
There has been a tremendous upsurge in interest on the part <strong>of</strong> operators, hoteliers,<br />
entrepreneurs, and consumers for specialty <strong>tea</strong>. This interest is strongest in the Pacific<br />
Northwest <strong>of</strong> America, but there is much evidence that it is spreading to the rest <strong>of</strong> the<br />
U.S. as well. The trend to specialty <strong>tea</strong>s is following on the curtails <strong>of</strong> a similar<br />
expansion in the c<strong>of</strong>fee industry. Today, specialty c<strong>of</strong>fee accounts for a third <strong>of</strong> total<br />
c<strong>of</strong>fee sales and an even larger percentage <strong>of</strong> the pr<strong>of</strong>its. Consumer awareness <strong>of</strong><br />
specialty <strong>tea</strong> is receiving a big boost from the exposure it is getting in c<strong>of</strong>fee houses as<br />
well as free standing <strong>tea</strong> salons, retailers, and catalogue distributors.<br />
The move to specialty <strong>tea</strong>s is triggered in part by the lure <strong>of</strong> high pr<strong>of</strong>its, but is also in<br />
response to perceived renewed consumer interest in the entire <strong>tea</strong> category. Interest in<br />
specialty <strong>tea</strong>s will also benefit from renewed marketing support on the part <strong>of</strong> producing<br />
countries interested in increasing the revenues and pr<strong>of</strong>its that they derive from this<br />
segment. A similar positive picture is also portrayed in some European countries such<br />
as Switzerland where sales <strong>of</strong> specialty <strong>tea</strong>s have been growing over the past 12 years<br />
or so, and total sales in 2001-2002 were up approximately 30% compared to the year<br />
2000. The same sort <strong>of</strong> increase is evident in Spain’s specialty <strong>tea</strong> sales<br />
(www.<strong>tea</strong>andc<strong>of</strong>fee.net).<br />
12
2.2.4 Herbal <strong>tea</strong>s<br />
Health awareness among consumers is underlined by the ongoing rise <strong>of</strong> herbal <strong>tea</strong>s,<br />
and to a lesser extent, fruit infusions, both <strong>of</strong> which have been marketed from a health<br />
angle. Between 1994 and 1998, herbal <strong>tea</strong>s were the most dynamic sub-sector in both<br />
volume and value terms in countries such as Italy, Spain, and the UK. In the UK alone,<br />
herbal <strong>tea</strong> sales soared by more than 16% between 1997 and 1998. The United States<br />
and Germany are two <strong>of</strong> the largest importers <strong>of</strong> herbal <strong>tea</strong> products, therefore holding<br />
large potential for South African indigenous products such as <strong>honey</strong><strong>bush</strong> and its<br />
counterpart, rooibos.<br />
During 1997, herbal <strong>tea</strong>s represented around $320 million <strong>of</strong> all US <strong>tea</strong> sales, with<br />
functional <strong>tea</strong>s comprising $80 million <strong>of</strong> herbal <strong>tea</strong> sales. In 1998, the US imported<br />
over 5 000 metric tons <strong>of</strong> plants and plant parts for use in herbal <strong>tea</strong>s, at an estimated<br />
value <strong>of</strong> around $22 million. This reflects an increase <strong>of</strong> 78% in volume and 156% in<br />
value from 1994 levels.<br />
The herbal <strong>tea</strong>s six largest import countries in terms <strong>of</strong> value are China, Chile, Taiwan,<br />
Mexico, Spain, and Germany. In 1998, China cashed in close to $7 400 000 from the<br />
US herbal <strong>tea</strong> market, compared to $3 136 000 by Chile. In terms <strong>of</strong> import volumes,<br />
China was also the largest, followed by Mexico, Chile, Germany and then India<br />
(Snyman, 2000).<br />
This is more prevalent for green <strong>tea</strong>s, as marketers observed that the market demand is<br />
calling for the production <strong>of</strong> unfermented or semi-fermented herbal <strong>tea</strong>s. This also<br />
presents a huge opportunity for <strong>honey</strong><strong>bush</strong> as the green formats are seen to yield dry<br />
green herbal <strong>tea</strong>s in which maximum levels <strong>of</strong> the original naturally occurring anti-<br />
oxidants are retained. Future prospects look good in countries such as Japan also<br />
where consumers are returning to the more traditional green <strong>tea</strong>s, not least because <strong>of</strong><br />
the growing body <strong>of</strong> evidence about the health benefits <strong>of</strong> the drink.<br />
13
2.2.5 Nutraceuticals and pharmaceuticals<br />
Heightened awareness <strong>of</strong> the link between diet and health, as well as the interest in<br />
self-promotion <strong>of</strong> health, particularly among an ageing population, will also fuel growth<br />
in the nutraceuticals and pharmaceuticals. Scientific discoveries <strong>of</strong> substances with<br />
disease-fighting properties, particularly in the case <strong>of</strong> major life-threatening conditions<br />
that incur high health costs, have also led to the use as ingredients in functional foods.<br />
In countries such as the United States, an increase in the involvement <strong>of</strong> multinational<br />
companies in natural ingredients has been observed. Most <strong>of</strong> the large pharmaceutical<br />
companies have already entered the supplement business or are closely reviewing the<br />
market. For example, Warner Lambert, American Home Products, Bayer and<br />
SmithKline Beecham are all introducing herbal products and this add respectability to<br />
this previously marginalised market (Chung, 2000).<br />
There is also a trend towards expansion <strong>of</strong> multinational chemical companies into the<br />
market sector now known as ‘nutraceuticals’, a subsection <strong>of</strong> the nutrition and food<br />
supplement industry. Nutraceuticals comprise <strong>of</strong> three principal areas, which are plant<br />
derived products, food and feed additives and diary supplements. For example<br />
companies like DuPont diversified into a life science division and has acquired Proteins<br />
Technologies International to develop its soy proteins technologies. Also, Henkel<br />
Nutrition and Health Group in Germany are <strong>of</strong>fering anti-oxidants and H<strong>of</strong>fmann La<br />
Roche introducing a range <strong>of</strong> omega-3 fatty acids. As a result the European Market for<br />
nutraceuticals is projected to increase by 52% within the next three years (Chung,<br />
2000).<br />
Regarding <strong>honey</strong><strong>bush</strong>, this implies huge potential and because <strong>of</strong> its antioxidants, it<br />
could be also used in the feed sector as an additive, although this still needs to be<br />
substantiated by research. The ARC-Rooderport started research on this issue, but<br />
discontinued due to lack <strong>of</strong> support, as natural products lack popularity, as they are not<br />
backed by huge sums <strong>of</strong> money to persuade the public compared to their rivals.<br />
14
2.2.6 Alternative medicines<br />
Worldwide, the trend towards herbal medicines and alternative treatment therapies is<br />
being combined with conventional medicine in the form <strong>of</strong> an integrated medical<br />
approach. According to the World Health Organisation, herbalism worldwide is three to<br />
four times more commonly practiced than conventional medicine.<br />
In this industry, the US market is considered to be in an evolutionary phase and<br />
relatively immature compared to the European market for natural products. Europe has<br />
a long history <strong>of</strong> research and processing <strong>of</strong> natural products, and has much tighter<br />
regulations and established quality control procedures. Generally, the European market<br />
is as well regulated as the drug industry and many <strong>of</strong> the compounds sold in the US as<br />
dietary supplements.<br />
In Europe, the major therapeutic categories for natural products in order <strong>of</strong> their<br />
magnitude are cardiovascular (27%), respiratory (15%), digestive (14%), tonics (14%)<br />
and hypotonics and sedatives account for approximately (10%). In the US, the reverse<br />
is true with sedatives, relaxants and other mood and memory enhancing compounds<br />
representing the largest category, and the cardiovascular treatments at the lower end <strong>of</strong><br />
the usage pattern (Chung, 2000).<br />
In both the US and Europe there has been a significant increase in the use <strong>of</strong> natural<br />
plant extracts as replacements for prescription pharmaceuticals. The major examples<br />
are the use <strong>of</strong> non-pharmaceutical products for the treatments <strong>of</strong> menopause in women<br />
and there is a growing market for their use in treatment and prevention <strong>of</strong> prostate<br />
cancer in men.<br />
In the world, Germans are the leaders in scientific herbal evaluation under Commission<br />
E while in the US standard testing for approval is done by USFDA and has approved<br />
only a few botanicals and formulations. In Germany and France, alternative medicines<br />
are sold as prescription drugs in the pharmacies and are covered by health insurance.<br />
This is the single most factor affecting the use <strong>of</strong> these products in both countries. In<br />
Germany, about 80 percent <strong>of</strong> physicians regularly prescribe natural medications<br />
compared to fewer than 10 percent in the US.<br />
15
In addition, the Europeans have a longer history <strong>of</strong> the use <strong>of</strong> natural products with<br />
medicinal properties for the treatment <strong>of</strong> dermatological compositions with Chamomile<br />
being among the top three selling preparation to this usage (Chung, 2000). Therefore<br />
<strong>honey</strong><strong>bush</strong>, like rooibos, has unprecedented market opportunities in skin care products<br />
and hence in the cosmetic industry.<br />
2.2.7 Organic and Fair Trade<br />
In Europe, there is a growing demand for organic products. Total sales <strong>of</strong> organic food<br />
in Europe were estimated at €10 billion in 2002. The average growth rate annually is<br />
estimated between 5-15%. The Germany alone amounted to €3 billion <strong>of</strong> total sales in<br />
2002, the Netherlands (€380 million) and UK (€1,45 billion) (www.sippo.ch)<br />
There is also a growing demand for fair trade products, although still a very small<br />
proportion <strong>of</strong> international trade like organic products. The fair trade market accounts<br />
for US$ 400 million in retail sales each year in Europe and the USA, or 0.01% <strong>of</strong> global<br />
trade. In Europe sales <strong>of</strong> fair trade products through alternative channels and<br />
supermarkets is calculated to be at least $228 million. The fair trade product with the<br />
highest market share is banana in Switzerland which has achieved 15%, but elsewhere<br />
the market share for fair trade products such as <strong>tea</strong> and c<strong>of</strong>fee is at most 2.7%. An<br />
increasing number <strong>of</strong> products are being traded on the basis <strong>of</strong> fair trade relationships<br />
and some producers that learned about export under the tutelage <strong>of</strong> fair trade partners<br />
are now able to enter conventional export markets (Tallontire, 2001).<br />
Since these two systems, organic and fair trade complement one another, fair trade<br />
organisations have become an important distribution channel for organic products in<br />
Europe, particularly in Germany, Switzerland and the Netherlands, but also in a number<br />
<strong>of</strong> other markets. As one <strong>of</strong> the traditionally fairly traded products, the market for<br />
organic <strong>tea</strong>s is growing strongly and Fair Trade organisations are pioneering work to<br />
develop environmentally-sensitive production and cultivation methods. Honey<strong>bush</strong> from<br />
Haarlem has already received the fair trade status which is an added advantage and is<br />
believed to be a start to other lucrative markets.<br />
“If it has a fair trade status, it’s a bonus, and if also organic, it’s a double bonus”.<br />
16
2.3 General Trends and Future Outlook<br />
The trends and patterns discussed in the previous paragraphs and reasons for growth<br />
vary slightly around the world. There are definite trends that account for this new wave<br />
<strong>of</strong> success and are expected to do so in the next 5-10 years.<br />
2.3.1 Macro demand forces<br />
Although a series <strong>of</strong> external influences have affected demand for <strong>tea</strong> positively in the<br />
last few years, there are also consumer trends which counteract the growing demand<br />
for <strong>tea</strong>, and natural products in general. These include the following:<br />
Pursuit <strong>of</strong> a healthy lifestyle and acknowledgment <strong>of</strong> a greater responsibility<br />
for the quality <strong>of</strong> one’s own health.<br />
Improved knowledge about nutrition and better dissemination <strong>of</strong> this<br />
information to the mass market.<br />
Greater reliance on natural homeopathic remedies to prevent disease as<br />
opposed to invasive procedures to treat disease.<br />
Continuing appeal <strong>of</strong> natural products. This is more prevalent in South Africa<br />
where there is a strong movement towards natural products with the word<br />
‘natural’ being the buzzword in today’s conversations.<br />
Concern for the environment prompts buying decisions compatible with that<br />
concern.<br />
Preference for quality products <strong>of</strong>fering true value.<br />
Desire for products that go beyond satisfying basic needs <strong>of</strong> satiating hunger<br />
and thirst.<br />
Increasing sense <strong>of</strong> adventure and appreciation <strong>of</strong> foreign customs and<br />
cuisine.<br />
The macro-demand forces have been in place for many years and several major ones<br />
are responsible for the creation <strong>of</strong> a big new industry, healthy foods. Prospects for s<strong>of</strong>t<br />
drinks are positive as they stand to benefit from the growing trend towards healthy<br />
living, especially among women. There is room to grow sales through innovation, new<br />
products, and awareness. This trend, by nature, is long term and will probably<br />
17
accelerate as more knowledge surfaces about the role beverages play in maintaining<br />
health. There are no doubts that these factors will affect the <strong>honey</strong><strong>bush</strong> industry<br />
positively (wwww.<strong>tea</strong>andc<strong>of</strong>fee.com).<br />
2.3.2 Micro demand factors<br />
Demand for convenience will continue to drive the market for RTD <strong>tea</strong>s.<br />
Relative ease <strong>of</strong> entering this market and success <strong>of</strong> other start-up companies<br />
such as Snapple, Arizona, Lipton, and Mystic will continue to attract other<br />
companies and contribute to continued growth <strong>of</strong> the segment.<br />
Compatibility <strong>of</strong> <strong>tea</strong> with a great many flavours and spices will trigger many new<br />
entries including the development <strong>of</strong> sub-categories.<br />
RTD <strong>tea</strong> represents only a tiny percentage <strong>of</strong> overall consumer consumption <strong>of</strong><br />
beverages, especially s<strong>of</strong>t drinks with which the category is most closely<br />
compared. With increased marketing effort, RTD <strong>tea</strong> is likely to pick up<br />
significant share from s<strong>of</strong>t drinks consumers, particularly with that segment<br />
concerned with health issues.<br />
As the market for foods consumed away from home continues to grow, RTD <strong>tea</strong><br />
will continue to benefit from this trend.<br />
While the entire RTD <strong>tea</strong> category is still in its infancy, there is much room for<br />
growth for higher quality specialty brands as opposed to value based products.<br />
Evidence for this assumption is seen in the premium prices that consumers are<br />
willing to spend on branded water products. Of course, this necessitates that the<br />
branded products are supported by consumer marketing activities<br />
(wwww.<strong>tea</strong>andc<strong>of</strong>fee.com).<br />
These predictions appear to paint a rosy picture for the <strong>tea</strong> industry and hence for<br />
<strong>honey</strong><strong>bush</strong> over the next 5 -10 years. The forces in place are time-proven and<br />
significant, and should continue to positively affect growth for the future. However, as<br />
the saying goes, the only things guaranteed in life are taxes and death. Consequently,<br />
nothing should be taken for granted and the <strong>honey</strong><strong>bush</strong> leaves will miss this boat unless<br />
the industry aggressively pursues the growth opportunities before it. On the basis <strong>of</strong> the<br />
growth realised over the last few years, it is safe to predict that <strong>honey</strong><strong>bush</strong> will be one<br />
hot water the <strong>tea</strong> industry will encounter and use to make the world’s favourite brews.<br />
18
In the domestic market, future prospects also look good, although consumer awareness<br />
and or education will worth a while to strengthen this. Also, expectations are to see<br />
<strong>honey</strong><strong>bush</strong> follow the swift growth pattern <strong>of</strong> rooibos. The reason is simple "You drink<br />
and you feel” (www.baby<strong>tea</strong>s.com). In other words, the flavour and the feeling make<br />
the bottom line and are the main attributes that will make <strong>honey</strong><strong>bush</strong> to be always<br />
sought after.<br />
2.4 Prices<br />
Taking into account the greater diversity in the quality <strong>of</strong> <strong>tea</strong>, prices are very variable<br />
and the price <strong>of</strong> <strong>tea</strong> is not determined by a quoted world market price as it is mainly sold<br />
through auctions. The principal auction markets are in Calcutta (India), Cochin (India),<br />
Colombo (Sri Lanka) Chittagong erreur (India), Chittagong se trouve au (Bangladesh),<br />
Mombasa (Kenya), and Jakarta (Indonesia), Limbe Cameroon. The sales therefore<br />
take place directly between sellers and purchasers or via traders. Table 2 reveals that<br />
prices <strong>of</strong> <strong>tea</strong> sold at all the international auctions registered an increase in $ terms<br />
except at Jakarta in the last two years (Tea Board <strong>of</strong> India, 2003).<br />
Table 2 World auctions (January to November)<br />
Country 2002 (USD) +/-(%) 2003 (USD) +/- (%)<br />
North India 1.30 (+) 0.04 1.34 (+) 3.08<br />
South India 0.86 (+) 0.03 0.89 (+) 3.49<br />
All India 1.16 (+) 0.06 1.22 (+) 5.17<br />
Colombo (Sri Lanka) 1.54 (+) 0.01 1.55 (+) 0.65<br />
Chittagong (Bangladesh) 1.01 (+) 0.16 1.17 (+) 15.84<br />
Jakarta (Indonesia) 1.01 (-) 0.06 0.95 (+) 5.53<br />
Mombassa (Kenya) 1.49 (+) 0.05 1.54 (+) 3.36<br />
Limbe (Malawi) 0.91 (+) 0.02 0.93 (+) 2.20<br />
Source: Tea Board <strong>of</strong> India, 2003<br />
In 2003, India alone represented about 30% <strong>of</strong> world production <strong>of</strong> <strong>tea</strong> and should<br />
therefore be in a position <strong>of</strong> power when it comes to setting the price <strong>of</strong> <strong>tea</strong>. However,<br />
this is not necessary the case. Even though the quantity and the quality <strong>of</strong> Indian<br />
harvests have an influence on prices, this impact is minimal. Of major impact are<br />
economic relations between North and South and the power <strong>of</strong> the multinational<br />
companies. As far as <strong>honey</strong><strong>bush</strong> is concerned, it is also produced in small quantities<br />
19
that will hardly have any influence in <strong>tea</strong> prices in the medium term. However, import<br />
and export parity prices will be calculated since it is an exportable and or tradable<br />
product.<br />
2.4.1 Import- and export parity prices<br />
Although <strong>honey</strong><strong>bush</strong> that is sold does not go through auctions like normal <strong>tea</strong>s.<br />
However, the demand and supply forces play their role in price determination.<br />
Therefore world prices are <strong>of</strong> importance to consider since they determine the band<br />
within which domestic prices in South Africa could vary, depending on supply and<br />
demand levels. In a period where supply exceeds demand, <strong>tea</strong> prices will tend to move<br />
towards export parity, which might not even be the case for <strong>honey</strong><strong>bush</strong> as always in<br />
short supply and hence prices are expected to move towards import parity. Therefore<br />
the calculated import- and export parity prices act as a ceiling and a floor price for<br />
domestic prices and hence final values should be taken as a point <strong>of</strong> reference when<br />
compared to local net prices.<br />
The import parity price is normally higher than the export parity price. In Table 3, when<br />
some marketing costs are added, a processor in the <strong>Western</strong> <strong>Cape</strong> can import <strong>tea</strong> at a<br />
price <strong>of</strong> R8236.63 per ton. Given ceteris paribus assumption such as comparable<br />
quality and availability, the economically rational processor will be willing to pay a local<br />
farmer equal or less than this calculated price. Also, if other costs are from the<br />
warehouse to the processing point are to be subtracted, this will bring the price at the<br />
warehouse down to R8208.63 per ton. On the other hand, if a local farmer has to pay<br />
for <strong>tea</strong> that is stored at the warehouse he/she can only expect to receive a price <strong>of</strong><br />
R8143.63per ton.<br />
Table 3 Estimated import parity <strong>of</strong> <strong>honey</strong><strong>bush</strong><br />
ITEM<br />
International Fob Price ($/t) (+)<br />
20<br />
HONEYBUSH<br />
1 200.00<br />
Ocean Freight Rates) ($/t) (+) 23.00<br />
Insurance (0.3% <strong>of</strong> Fob price) (+) 3.6<br />
CIF ($/t) (=) 1226.60<br />
R/$ Exchange Rate (average 06/2004) 6.49
(C.I.F.) (R/t) 7 960.63<br />
Docking costs (R/t) (+) 51.00<br />
Discharging costs(R/t) (+) 72<br />
Free on rail at <strong>Cape</strong> Town (R/t) (=) 8083.63<br />
Transport costs from harbour to Mosselbay (R/t) (+) 135.00<br />
Financing cost (R/t) (+) 18.0<br />
Price at Processor (R/t (=) 8236.63<br />
Transport costs from warehouse to processor (R) (-) 28.00<br />
Warehouse price (R/t (=) 8208.63<br />
Storage (R) (-) 65.00<br />
Warehouse gate price (R/t) (=) 8143.63<br />
Source: Calculations based on Sagis, 2004<br />
Note:<br />
the processor is assumed to be in Mosselbay and harbour in <strong>Cape</strong> Town.<br />
Price <strong>of</strong> US$ 1.20/kg is the average calculated from all <strong>tea</strong> auctions listed in Table 2 and is also<br />
used in the calculation.<br />
Exchange rate <strong>of</strong> R6.49 is a 16-day average for June obtained from www.x-rates.com.<br />
Conversely, when an export parity price is calculated as shown in Table 4, all marketing<br />
costs are subtracted. These therefore result into a large difference between the import<br />
and export parity prices. If all marketing costs are subtracted, the price that the farmer<br />
can expect at the warehouse gate is R7472.3 per ton <strong>of</strong> <strong>tea</strong> and is much lower<br />
compared to the import parity price. However, this price would still be attractive to<br />
farmers as it can generate pr<strong>of</strong>its that are comparable with those <strong>of</strong> other competing<br />
<strong>tea</strong>s like rooibos.<br />
Table 4 Estimated export parity price <strong>of</strong> <strong>honey</strong><strong>bush</strong><br />
Item Honey<strong>bush</strong><br />
CIF London ($/t) 1 200.00<br />
Exchange rate (R/$) = 6.49<br />
Honey<strong>bush</strong> (fob) London (R/t) 7788.00<br />
SA fob price: <strong>Cape</strong> Town (90% <strong>of</strong> fob price) (R/t)* 7009.20<br />
Docking ($) (-) 65.20<br />
Loading cost ($) (-) 85.90<br />
Price at quay (R) (=) 7160.30<br />
Transport from warehouse to harbour(R) (-) 135.00<br />
Storage (R) (-) 75.00<br />
Financing (R) (-) 102.38<br />
EXPORT REALISATION (R/t)<br />
Source: Calculations based on Sagis, 2004<br />
21<br />
7472.3
2.4.2 Influencing factors to calculations<br />
Moreover, higher transportation costs that make a significant difference between import<br />
and export parity prices will result in low volumes to be available for international trade,<br />
because they are at the disadvantage <strong>of</strong> the exporter. However, the export parity price<br />
confronting a particular exporter <strong>of</strong> any product can be increased i.e. a premium can be<br />
earned. This can be achieved through strategic marketing, which involve activities that<br />
convince buyers that the exporter’s product is superior (e.g. more in consistent quality,<br />
no chemicals used, healthy etc) compared to other exporters.<br />
Another potential influencing factor in these prices is an exchange rate, as a weaker<br />
rand against the dollar would raise South African prices in rands. Freight rates also<br />
influence the calculation. If at import parity, then higher freight rates could raise the SA<br />
exfarm price, similarly, if at export parity, it could lower the SA exfarm price.<br />
22
CHAPTER THREE<br />
SUPPLY ANALYSIS<br />
World <strong>tea</strong> production in the last decade has grown at an annual rate <strong>of</strong> 1.81% per<br />
annum and consumption has kept pace at a slightly higher growth rate <strong>of</strong> 2.05% per<br />
annum. After India, the second largest producer is China but mainly produce green <strong>tea</strong>,<br />
while India produces mainly black <strong>tea</strong>. World <strong>tea</strong> exports have grown by almost 2%<br />
over the last decade. Sri Lanka is the largest exporter followed by Kenya, China and<br />
India. World imports grew yearly at 1.2% over the last decade. The largest importers<br />
are the UK, the United States, Japan and Arab countries such as United Emirates and<br />
Iraq (ITC, 2002).<br />
3.1 World Production<br />
World <strong>tea</strong> production reached 2.9 million tons in the year 2000 meaning a slight<br />
increase over 1999, but an overall stagnation as compared to peak production <strong>of</strong> 1998<br />
(see Figure 2). Approximately 56% <strong>of</strong> this is consumed in the producing countries while<br />
the remainder <strong>of</strong> about 1.1 million tons are available for exportation (Tee Gschwendner,<br />
2001).<br />
Figure 2 World Tea Production 1973-2000 based on Walker, 2002<br />
Today <strong>tea</strong> is cultivated in approximately 36 countries and in three major categories i.e.<br />
green (unfermented), black (fermented) and oolong (partially fermented) as explained in<br />
23
Section 1.2.2. Although not popular because <strong>of</strong> too low volumes to be <strong>of</strong> economic<br />
importance, but one could add a fourth category which would be white <strong>tea</strong>.<br />
The most important <strong>tea</strong> producing countries are India, China, Kenya (normally referred<br />
to by origin, Africa) and Sri Lanka. However, <strong>tea</strong> is also cultivated in minor quantities in<br />
countries and regions such as Argentina, Brazil, Iran, Turkey, Vietnam, Korea,<br />
Malaysia, Thailand, Australia, New Guinea, Mexico, USA, Corsica, the Azores and<br />
Tuscany (Tee Gschwendner, 2001).<br />
Tea production is an important economic factor in some countries. These include India<br />
with the highest production followed by China. However, India stands in the fourth<br />
position regarding <strong>tea</strong> exports; having Sri Lanka, Africa and China in the first three<br />
ranks respectively (See figure 3). Countries like Sri Lanka continues to rely heavily on<br />
the export market because domestic consumption uses only roughly 10% <strong>of</strong> production.<br />
Figure 3 Production vs Exports, based on Walker, 2002<br />
3.1.1 Tea major producing regions<br />
During the year 2002 and 2003, <strong>tea</strong> crop in major producing countries increased by 36.5<br />
million kilograms due to improvement in production <strong>of</strong> <strong>tea</strong> in India, Bangladesh, Kenya,<br />
Malawi, Tanzania and Uganda. However, production <strong>of</strong> <strong>tea</strong> in countries such as Sri<br />
Lanka, Indonesia and Zimbabwe experienced a decline in 2003 (see Table 5).<br />
24
Table 5 Tea major producing countries during 2003 (million kilograms)<br />
Country January to 2002 2003 + / -<br />
India November 778.5 809.9 (+) 31.4<br />
Bangladesh October 44.2 46.4 (+) 2.2<br />
Sri Lanka November 281.1 279.0 (-) 2.1<br />
Indonesia June 66.9 63.1 (-) 3.8<br />
Kenya October 231.4 233.1 (+) 1.7<br />
Malawi October 32.5 36.6 (+) 4.1<br />
Tanzania September 18.2 20.7 (+) 2.5<br />
Uganda September 23.4 24.7 (+) 1.3<br />
Zimbabwe September 15.8 15.0 (-) 0.8<br />
Total -- 1492.0 1528.5 (+) 36.5<br />
Source: Tea Board <strong>of</strong> India, 2003<br />
India<br />
India is the world_s largest producer <strong>of</strong> <strong>tea</strong>, which is estimated to account for 30% <strong>of</strong><br />
world production. In the year 2000, the country produced about 800,000 metric<br />
kilograms <strong>of</strong> <strong>tea</strong>, less than 25% <strong>of</strong> which was exported (www.stjames<strong>tea</strong>s.co.uk). India<br />
produces three <strong>tea</strong> specialities i.e. Darjeeling, Assam and Nilgiri. The Indian <strong>tea</strong><br />
industry is highly mechanised and industrialised due to labour costs, which are above<br />
those <strong>of</strong> other competing countries like China. All categories <strong>of</strong> <strong>tea</strong> are produced:<br />
green, oolong, black and white. The focus <strong>of</strong> production, however, is clearly on black<br />
<strong>tea</strong>s. Recently a shift towards organic farming has been noticed (Walker 2002).<br />
China<br />
China is one country that has enormous varieties <strong>of</strong> <strong>tea</strong> grown. A total <strong>of</strong> 138 distinct<br />
green <strong>tea</strong>s with more than 12.500 subgroups are listed in the encyclopedia <strong>of</strong> Chinese<br />
<strong>tea</strong>s (Rosen, 1998). Black, green and oolong <strong>tea</strong>s are produced, but more than 80% <strong>of</strong><br />
<strong>tea</strong> produced is green <strong>tea</strong> (Zittlau, 1997). The four most common Chinese <strong>tea</strong>s<br />
exported world-wide are Jasmine Tea, Gunpowder, Lung Ching (Dragonwell) and Chun<br />
Mee (know as ‘Precious Eyebrows’) (www.stash<strong>tea</strong>.com).<br />
25
Africa<br />
In 2000, Africa was the third largest producer with Kenya as the most important<br />
producer. Total <strong>tea</strong> production was estimated in the region <strong>of</strong> 360,000 tons <strong>of</strong> which<br />
Kenya produced about 236,000 tons. As the most recent <strong>of</strong> the <strong>tea</strong> producing<br />
countries, African countries have been able to build on the experience <strong>of</strong> other<br />
producers. As a result, Africa is now a major force in world <strong>tea</strong>, producing <strong>tea</strong>s <strong>of</strong> high<br />
quality and good bright colour which are used for blending all over the world. As a<br />
result, <strong>tea</strong> is also produced in countries such as Malawi, Uganda, Tanzania Zimbabwe,<br />
Rwanda and South Africa. Tea from these African countries is estimated at 25% <strong>of</strong><br />
world exports amounting to some 250,000 tonnes (www.<strong>tea</strong>council.uk).<br />
Sri Lanka (Ceylon)<br />
In Sri Lanka, <strong>tea</strong> production dates back from the 1860s when the first <strong>tea</strong> seedlings<br />
were introduced by Scotsman James Taylor. Ever since, <strong>tea</strong> has become the major<br />
economic factor. Sri Lanka is the 3rd biggest <strong>tea</strong> producer with a market share <strong>of</strong> 9%.<br />
Sri Lanka has over 220,0000 hectares under <strong>tea</strong> cultivation yielding about 240,000<br />
tonnes <strong>of</strong> "made" The home <strong>of</strong> Ceylon Tea. Production in 2000 was just over 300,000<br />
tons (approximately 10% <strong>of</strong> world production), but fell in the last two years to 281.1 and<br />
279.0 respectively (www.stjames<strong>tea</strong>s.co.uk).<br />
Sri Lanka_s <strong>tea</strong> is still well known and sold under the country’s colonial name Ceylon.<br />
Three categories <strong>of</strong> Ceylon <strong>tea</strong> can be distinguished according to the altitude <strong>of</strong> the<br />
area where it is cultivated:<br />
- Highgrowns: growing from 1300 to 2500 meters<br />
- Mediums: growing between 650 and 1300 meters<br />
- Lowgrowns: growing at less than 650 meters<br />
Indonesia<br />
26
Indonesia, with a production <strong>of</strong> approximately 165,000 tons <strong>of</strong> <strong>tea</strong> a year is also among<br />
the largest producers <strong>of</strong> <strong>tea</strong> in the world, and contributes about 100,000 tons to world's<br />
exports, just under 10%. In this country, most plantations have focused on mass<br />
production and as a result, Indonesian <strong>tea</strong> is mostly used for blending. The main<br />
advantage that Indonesia has over other countries is its year round production.<br />
3.2 World Exports<br />
According to Table 6 <strong>tea</strong> exports in major producing and exporting countries registered<br />
a decline <strong>of</strong> 37.9 M.Kgs due to decline in export from India, Bangladesh, Sri Lanka,<br />
Kenya and Argentina (Tea Board <strong>of</strong> India, 2003). However, most African countries with<br />
the exception <strong>of</strong> Zimbabwe experienced an increase in exports.<br />
Table 6 Major producing countries exports during 2003 (million kilograms)<br />
Country January to 2002 2003 (+) or (-)<br />
India November 184.7 143.7 (-) 41.0<br />
Bangladesh June 5.7 4.1 (-) 1.6<br />
Sri Lanka October 246.4 246.4 -<br />
China September 185.8 197.6 (+) 11.8<br />
Kenya September 209.3 199.6 (-) 9.7<br />
Malawi June 26.7 29.5 (+) 2.8<br />
Tanzania September 15.1 15.8 (+) 0.7<br />
Uganda August 19.5 20.4 (+) 0.9<br />
Zimbabwe September 14.3 12.7 (-) 1.6<br />
Argentina July 38.1 37.9 (-) 0.2<br />
Total -- 945.6 907.7 (-) 37.9<br />
Source: Tea Board <strong>of</strong> India, 2003<br />
3.3 Domestic Supply Analysis<br />
For a number <strong>of</strong> years, <strong>honey</strong><strong>bush</strong> have been harvested from the wilderness. This wild<br />
harvesting for use as an herbal <strong>tea</strong> has traditionally been an important source <strong>of</strong> income<br />
to a number <strong>of</strong> people. As a result, the industry is estimated to comprised <strong>of</strong> 30 wild<br />
harvesters that supply the market with <strong>tea</strong> that has been granted organic status as it is<br />
from wilderness. Because it has been harvested from the wild, the natural population <strong>of</strong><br />
27
<strong>honey</strong><strong>bush</strong> species has, however, diminished over the years, affecting the income <strong>of</strong><br />
the harvesters.<br />
Through intervention <strong>of</strong> various stakeholders, commercial cultivation <strong>of</strong> <strong>honey</strong><strong>bush</strong> has<br />
been encouraged. At present, there are approximately 20 producers and two<br />
communities, which supply seven processors. There are also about 15 marketers that<br />
facilitate the marketing process. The cultivation in the communities is estimated at<br />
approximately 15 hectares <strong>of</strong> dry land. Production per hectare is estimated at between<br />
2 and five tons for sprouting species like Cyclopia intermedia and Cyclopia genistoides<br />
and could be up to 10 tons for higher yielding species such as Cyclopia subternata<br />
(wwwcape<strong>honey</strong><strong>bush</strong><strong>tea</strong>.co.za).<br />
Even the commercial plantings that are available at present are still perceived to be<br />
totally inadequate to represent a meaningful industry. Therefore more hectares devoted<br />
to <strong>honey</strong><strong>bush</strong> cultivation are crucial from both nature conservation and the<br />
establishment <strong>of</strong> the industry especially for efficient development <strong>of</strong> the international<br />
market. The product therefore is a cash crop except the re-sprouting species and can<br />
be ready to be harvested within a year and hence supply can be increased over a short<br />
period <strong>of</strong> time. But, if the situation remains as it is at the moment, this could jeopardise<br />
export opportunities in markets such as Germany, the United Kingdom and Japan<br />
where demand is prevalent for this product.<br />
Another critical factor is rainfall, as production is carried in dryland, which is cost saving<br />
but yield compromising. Rainfall is crucial in <strong>honey</strong><strong>bush</strong> production, as it strongly<br />
affects yield and quality and hence pricing and or optimum margins in both domestic<br />
and international markets. Another critical factor is the absence <strong>of</strong> <strong>of</strong>ficial standards for<br />
taste and flavour, physical properties and micro-organism counts especially for the<br />
international market. In the last eight years though, the industry has seen an<br />
improvement in the quality <strong>of</strong> <strong>tea</strong> and the establishment <strong>of</strong> export standards,<br />
construction <strong>of</strong> large processing and packaging facilities (Wesgro, 1999).<br />
However, the competitive advantage <strong>of</strong> the product lies on its uniqueness to the<br />
<strong>Western</strong> <strong>Cape</strong>, the only area where it is found in its natural habitat. Also, being natural,<br />
organic and the health benefits associated with it can be added to its advantage<br />
28
(Wesgro, 1999). Its competitive advantage will also be strengthened by the fact that the<br />
international market is forcing companies to differentiate and hence new products are<br />
being introduced. Therefore being a new product, <strong>honey</strong><strong>bush</strong> stands a chance to have<br />
wide applications and to be accepted in a number <strong>of</strong> industries. It is envisaged that<br />
people <strong>of</strong>ten make assumptions that it will be easily accepted as its counterpart rooibos<br />
which has been in the market for some time, however, this will still require<br />
comprehensive promotion at both local and international market.<br />
3.3.1 Exports<br />
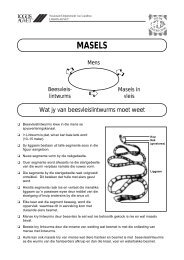
International demand for <strong>honey</strong><strong>bush</strong> has shown an increasing trend in the last five<br />
years. Between 1999 and 2003, sales <strong>of</strong> <strong>honey</strong><strong>bush</strong> increased from 50 to 160 tons,<br />
although local supply is far to even market demand for this product (see Figure 4). The<br />
industry has a huge potential <strong>of</strong> earning foreign exchange as approximately all <strong>tea</strong> that<br />
is produced is for the export market, as the local market consumes only a small amount.<br />
However, the local market is also envisaged to be increasing s<strong>tea</strong>dily.<br />
Ton<br />
180<br />
160<br />
140<br />
120<br />
100<br />
80<br />
60<br />
40<br />
20<br />
0<br />
www.ppecb.co.za<br />
1999 2000 2001 2002 2003<br />
Figure 4 Honey<strong>bush</strong> passed for exports 1999-2003<br />
The largest export customers <strong>of</strong> rooibos, are also observed to be the existing and<br />
possible future customers for <strong>honey</strong><strong>bush</strong> <strong>tea</strong> and these include UK, Japan, Germany<br />
and Switzerland where health drinks are particularly sought after. The growing export<br />
29
figures and a s<strong>tea</strong>dy increase in local consumption has sparked <strong>of</strong>f a widespread<br />
interest in the commercial growing and processing <strong>of</strong> <strong>honey</strong><strong>bush</strong> <strong>tea</strong>. As a result,<br />
production <strong>of</strong> <strong>honey</strong><strong>bush</strong> is forecasted to increase in the few coming years with growth<br />
estimated at about 20% per annum on average.<br />
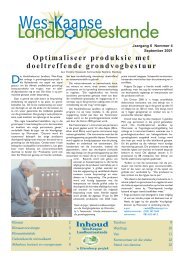
However, production forecast is difficult to conclude due to climatic constraints that<br />
seem to be a threat to the whole agricultural industry. Highly depending on natural<br />
factors at different times <strong>of</strong> year, some months record positive growth while the others<br />
poor growth as outlined in Figure 5.<br />
kilongram<br />
40000<br />
35000<br />
30000<br />
25000<br />
20000<br />
15000<br />
10000<br />
5000<br />
0<br />
Oct Nov Dec Jan Feb Mar Apr May Jun Jul Aug Sep<br />
www.ppecb.co.za<br />
Figure 5 Honey<strong>bush</strong> monthly exports from October 2002 to September 2003<br />
3.4 Economic Analysis<br />
The process <strong>of</strong> analysing a farm business has been traditionally divided into two parts<br />
(MAFF, 1980). General analysis based primarily upon financial accounts and other<br />
appropriate records and a more detailed analysis <strong>of</strong> the individual enterprises on the<br />
farm in the form <strong>of</strong> gross margins for each enterprise. Gross margins provide a useful<br />
tool in terms <strong>of</strong> farm budgeting and estimating the likely returns or losses <strong>of</strong> a particular<br />
crop.<br />
30
In recent years, with the increasing economic pressure on agriculture, there has been a<br />
greater use <strong>of</strong> cost accounting techniques which result in net margin or pr<strong>of</strong>it per<br />
enterprise. In cost accounting or complete enterprise costing, not only are the outputs<br />
and variable costs allocated to individual enterprises, as for gross margins, but the fixed<br />
costs are also allocated. This results in a net pr<strong>of</strong>it per enterprise and, with all costs<br />
allocated, enables the calculation <strong>of</strong> costs per ton produced on the farm and break-even<br />
budgets. The strength <strong>of</strong> such techniques is that they help to identify all costs involved<br />
in a particular enterprise (Firth, 2002).<br />
Despite their apparent simplicity, however, the full cost approach is fraught with<br />
difficulties. Awkward and sometimes arbitrary decisions have to be made concerning<br />
the allocation <strong>of</strong> overhead expenses between enterprises (Barnard and Nix, 1979). But<br />
the net margins are used in this study, as they are assumed to give full coverage <strong>of</strong> an<br />
enterprise concerned.<br />
3.4.1 Enterprise budget analysis<br />
The information presented in Table 7 was obtained through informal interviews with<br />
commercial and small-scale farmers involved in <strong>honey</strong><strong>bush</strong> production. Unlike the other<br />
studies, an attempt to give a closer to a real situation <strong>of</strong> <strong>honey</strong><strong>bush</strong> production is made,<br />
as most <strong>of</strong> the information in the budgets is a reflection <strong>of</strong> actual production. The<br />
advantage being the experience and the period since <strong>honey</strong><strong>bush</strong> farmers have been<br />
engaged in production. However, it is not common to conduct economic analysis<br />
without any assumptions.<br />
Therefore the base scenario, i.e. yields, costs breakdown presented in Table 7 is taken<br />
from the enterprise budgets that are part <strong>of</strong> the appendices. The gross income varies<br />
according to the yield and price while the yield could be manipulated according to size<br />
<strong>of</strong> production. However, discussions with various producers and researchers led to the<br />
following assumptions:<br />
One hectare is available and is used as a unit <strong>of</strong> analysis in this study<br />
Productive life expectancy <strong>of</strong> the plant is projected to be five years, but could be<br />
longer depending on a species. However, calculations in this study are for year<br />
31
one (establishment) up to year three. This is based on assumption that the yield<br />
is lower in year one and starts increasing in year two and in full capacity and<br />
constant from year three to year five. Thus, budgets for other years will not be <strong>of</strong><br />
any significant difference. Also, costs are higher in year one, decrease in year<br />
two and stable from year three onwards.<br />
Assumed to yield between 0 and 7 tons per hectare depending on the year, area<br />
and species. For subternata, if grown under conducive conditions, more yield<br />
could be expected. Also, in certain production areas, no output could be<br />
expected in the first year <strong>of</strong> establishment. This could also depend on the<br />
species used as this is highly expected <strong>of</strong> intermedia although not discussed in<br />
this study.<br />
The current market price that farmers receive is R2.50 per kg <strong>of</strong> dry <strong>honey</strong><strong>bush</strong><br />
depending on the area, as Haarlem small scale producers are assumed to<br />
receive a price <strong>of</strong> R2.00 per kg<br />
Costs are considered at current prices<br />
Mortality rate <strong>of</strong> plants is assumed at 25%, 30% and 40% depending on the<br />
species and area<br />
Market related interest rates assumed are not less that prime plus two<br />
Marketing and distribution costs are for the account <strong>of</strong> secondary intermediaries<br />
32