View/Open - University of Zululand Institutional Repository
View/Open - University of Zululand Institutional Repository View/Open - University of Zululand Institutional Repository
49 lil11l1tllll;lllll Table J20: Estimated annual water demand statistics for Natal/KwaZulu 110 6 m 3 ) (continued). Primary drainage region 1980 1990 2000 2010 Water for irrigation under control of irrigation boards W 62 79 189 225 V 31 33 35 38 U 28 40 54 70 T 1 1 1 1 Total 122 153 279 334 Water for private irrigation W 500 542 588 643 V 152 194 239 292 U 240 326 420 525 T 111 119 124 129 Total 1003 1 181 1371 1 589 Total water demand for Government irrigation schemes. irrigation boards and private irrigation W 661 741 833 938 V 202 250 302 364 U 280 378 487 608 T 158 178 195 218 Total 1301 1547 1817 2128 Water for stock watering W 16 16 17 19 V 14 15 16 17 U 5 8 10 14 T 25 28 311 34 Total 60 67 74 84
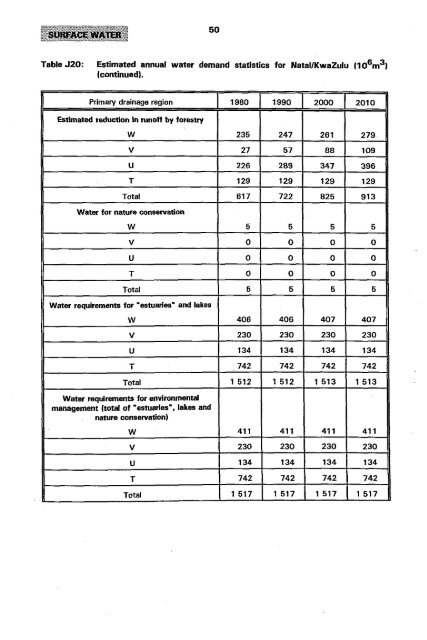
11111181111.1 50 Table J20: Estimated annual water demand statistics for NatallKwaZulu 110 6 m 3 ) (continued). Primary drainage region 1980 1990 2000 2010 Estimated reduction in runoff by forestry W 235 247 261 279 V 27 57 88 109 U 226 289 347 396 T 129 129 129 129 Total 617 722 825 913 Water for nature conservation W 5 5 5 5 V 0 0 0 0 U 0 0 0 0 T 0 0 0 0 Total 5 5 5 5 Water requirements for "estuaries" and lakes W 406 406 407 407 V 230 230 230 230 U 134 134 134 134 T 742 742 742 742 Total 1 512 1 512 1 513 1 513 Water requirements for environmental management Itotal of "estuaries". lakes and nature conservation) W 411 411 411 411 V 230 230 230 230 U 134 134 134 134 T 742 742 742 742 Total 1 517 1 517 1 517 1 517
- Page 1: A WATER RESOURCES AND SANITATION SY
- Page 4 and 5: Contents 1 11111111111:1&11 CHAPTER
- Page 7 and 8: lillllllllllll.'. Tables (continued
- Page 9 and 10: 11111111];11,,11. 10.1 Introduction
- Page 11 and 12: Table J2: Water budgets for Natal/K
- Page 13 and 14: Table J4: Overall gradient distribu
- Page 16 and 17: 13 111.IJJ1111111 (when runoff: rai
- Page 18 and 19: Table J7: 15 Hi) A small part of Kw
- Page 20 and 21: 17 1\11••111;[11. Table J7: App
- Page 22 and 23: 19 TableJ8: Hydrological Research U
- Page 24 and 25: 21 11111••111111111 TableJ9: Cr
- Page 26 and 27: 23 Table J10: Areas. mean annual pr
- Page 28 and 29: 25 1111III1I11,rllll Table J10: Are
- Page 30 and 31: 27 Table J10: Areas. mean annual pr
- Page 32 and 33: 29 Table J10: Areas. mean annual pr
- Page 34 and 35: 31 Table J10: Areas. mean annual pr
- Page 36 and 37: 33 Table J10: Areas. mean annual pr
- Page 38 and 39: 35 Table J10: Areas. mean annual pr
- Page 40: 37 Table J10: Areas. mean annual pr
- Page 43 and 44: IlfllllllllllJJilll 40 Table J12: K
- Page 45 and 46: 10.6 Runoff models 42 Models are no
- Page 47: 111I111'llll1JII 10.9 The variabili
- Page 54 and 55: 51 Table J20: Estimated annual wate
- Page 56 and 57: 53 Table J22: Estimated annual wate
- Page 58 and 59: 55 Ijlllltl1llflll (ii) Considerabl
- Page 60 and 61: 57 large catchments data. The Centr
- Page 62 and 63: 59 1111111111111' KwaDlangezwa, 283
- Page 64 and 65: Other reports 61 Research Unit, Dep
- Page 66 and 67: 63 1IIIIIE1111Elfl Id} The rest of
- Page 68 and 69: 65 Table J24: Department of Water A
- Page 70 and 71: 67 Table J24: Department of Water A
- Page 72 and 73: 69 Table J24: Department of Water A
- Page 74 and 75: 71 Table J24: Department of Water A
- Page 76 and 77: 73 Table J24: Department of Water A
- Page 78 and 79: 75 Table J24: Department of Water A
- Page 80 and 81: 77 Table J24: Department of Water A
- Page 82 and 83: 79 Table J24: Depanment of Water Af
- Page 84 and 85: 81 Station closed Station closed U2
- Page 86 and 87: 83 Station Drainage region Station
- Page 88 and 89: 85 Table J25: Number of stations wi
- Page 90 and 91: 87 iI11J111!!ltllllil equal share i
- Page 92: 89 Source: liI After Anonymous, 198
- Page 95: 111111111111111 92 boards (discusse
- Page 98 and 99: Table J28: Some relevant data on se
11111181111.1<br />
50<br />
Table J20: Estimated annual water demand statistics for NatallKwaZulu 110 6 m 3 )<br />
(continued).<br />
Primary drainage region 1980 1990 2000 2010<br />
Estimated reduction in run<strong>of</strong>f by forestry<br />
W 235 247 261 279<br />
V 27 57 88 109<br />
U 226 289 347 396<br />
T 129 129 129 129<br />
Total 617 722 825 913<br />
Water for nature conservation<br />
W 5 5 5 5<br />
V 0 0 0 0<br />
U 0 0 0 0<br />
T 0 0 0 0<br />
Total 5 5 5 5<br />
Water requirements for "estuaries" and lakes<br />
W 406 406 407 407<br />
V 230 230 230 230<br />
U 134 134 134 134<br />
T 742 742 742 742<br />
Total 1 512 1 512 1 513 1 513<br />
Water requirements for environmental<br />
management Itotal <strong>of</strong> "estuaries". lakes and<br />
nature conservation)<br />
W 411 411 411 411<br />
V 230 230 230 230<br />
U 134 134 134 134<br />
T 742 742 742 742<br />
Total 1 517 1 517 1 517 1 517


