View/Open - University of Zululand Institutional Repository
View/Open - University of Zululand Institutional Repository View/Open - University of Zululand Institutional Repository
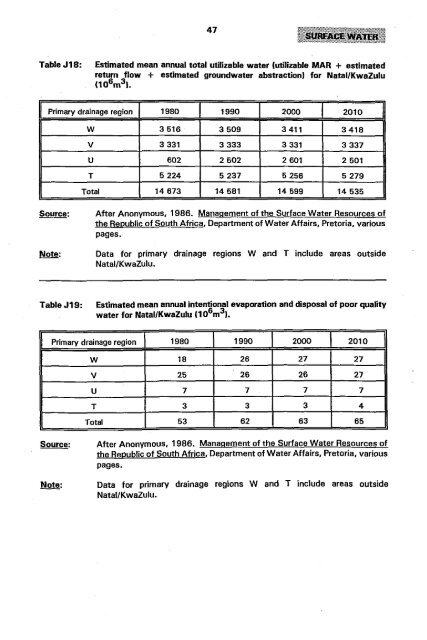
47 Table J18: Estimated mean annual total utilizable water (utilizable MAR + estimated return flow + estimated groundwater abstraction) for Natal/KwaZulu (10 6 m 3 ). Primary drainage region 1980 1990 2000 2010 . Source: Note: Table J19: W 3516 3509 3411 3418 V 3331 3333 3331 3337 U 602 2502 2601 2501 T 5224 5237 5256 5279 Total 14673 14581 14599 14535 After Anonymous, 1986. Management of the Surface Water Resources of the Republic of South Africa, Department of Water Affairs, Pretoria, various pages. Data for primary drainage regions Wand T include areas outside NatallKwaZulu. Estimated mean annual intentional evaporation and disposal of poor quality water for NatallKwaZulu 110 6 m 3 ). Primary drainage region 1980 1990 2000 2010 Source: Note: W 18 26 27 27 V 25 26 26 27 U 7 7 7 7 T 3 3 3 4 Total 53 62 63 65 After Anonymous. 1986. Management of the Surface Water Resources of the Republic of South Africa, Department of Water Affairs, Pretoria, various pages. Data for primary drainage regions Wand T include areas outside Natal/KwaZulu.
- Page 1: A WATER RESOURCES AND SANITATION SY
- Page 4 and 5: Contents 1 11111111111:1&11 CHAPTER
- Page 7 and 8: lillllllllllll.'. Tables (continued
- Page 9 and 10: 11111111];11,,11. 10.1 Introduction
- Page 11 and 12: Table J2: Water budgets for Natal/K
- Page 13 and 14: Table J4: Overall gradient distribu
- Page 16 and 17: 13 111.IJJ1111111 (when runoff: rai
- Page 18 and 19: Table J7: 15 Hi) A small part of Kw
- Page 20 and 21: 17 1\11••111;[11. Table J7: App
- Page 22 and 23: 19 TableJ8: Hydrological Research U
- Page 24 and 25: 21 11111••111111111 TableJ9: Cr
- Page 26 and 27: 23 Table J10: Areas. mean annual pr
- Page 28 and 29: 25 1111III1I11,rllll Table J10: Are
- Page 30 and 31: 27 Table J10: Areas. mean annual pr
- Page 32 and 33: 29 Table J10: Areas. mean annual pr
- Page 34 and 35: 31 Table J10: Areas. mean annual pr
- Page 36 and 37: 33 Table J10: Areas. mean annual pr
- Page 38 and 39: 35 Table J10: Areas. mean annual pr
- Page 40: 37 Table J10: Areas. mean annual pr
- Page 43 and 44: IlfllllllllllJJilll 40 Table J12: K
- Page 45 and 46: 10.6 Runoff models 42 Models are no
- Page 47: 111I111'llll1JII 10.9 The variabili
- Page 53 and 54: 11111181111.1 50 Table J20: Estimat
- Page 55 and 56: 52 Table J21: Estimated annual wate
- Page 57 and 58: 1111[,111111111111 54 Table J22: Es
- Page 59 and 60: 56 (1981); and Pitman, Middleton an
- Page 61 and 62: 58 • Middleton, B.J. and Pitman,
- Page 63 and 64: 60 • Rivett-Carnac. A.S. and Schu
- Page 65 and 66: 62 • Thomas, W.M., 1951. Part 2.
- Page 67 and 68: 64 Table J23: Types of gauging stat
- Page 69 and 70: 111.IIIEtlll:.11 66 Table J24: Depa
- Page 71 and 72: 1,.111111811 68 Table J24: Departme
- Page 73 and 74: 70 TableJ24: Department of Water Af
- Page 75 and 76: 72 Table J24: Department of Water A
- Page 77 and 78: 74 Table J24: Department of Water A
- Page 79 and 80: 76 Table J24: Department of Water A
- Page 81 and 82: 78 Table J24: Department of Water A
- Page 83 and 84: 80 Table J24: Department of Water A
- Page 85 and 86: IflBlIEilllllll 82 Station closed S
- Page 87 and 88: 84 (v) The Department of Agricultur
- Page 89 and 90: 86 have streamflow gauges situated
- Page 91 and 92: lil11111111111111 Table J26: Intern
- Page 94 and 95: 91 11_11111 for Merthley Dam and ac
- Page 97 and 98: Table J28: Some relevant data on se
47<br />
Table J18: Estimated mean annual total utilizable water (utilizable MAR + estimated<br />
return flow + estimated groundwater abstraction) for Natal/KwaZulu<br />
(10 6 m 3 ).<br />
Primary drainage region 1980 1990 2000 2010 .<br />
Source:<br />
Note:<br />
Table J19:<br />
W 3516 3509 3411 3418<br />
V 3331 3333 3331 3337<br />
U 602 2502 2601 2501<br />
T 5224 5237 5256 5279<br />
Total 14673 14581 14599 14535<br />
After Anonymous, 1986. Management <strong>of</strong> the Surface Water Resources <strong>of</strong><br />
the Republic <strong>of</strong> South Africa, Department <strong>of</strong> Water Affairs, Pretoria, various<br />
pages.<br />
Data for primary drainage regions Wand T include areas outside<br />
NatallKwaZulu.<br />
Estimated mean annual intentional evaporation and disposal <strong>of</strong> poor quality<br />
water for NatallKwaZulu 110 6 m 3 ).<br />
Primary drainage region 1980 1990 2000 2010<br />
Source:<br />
Note:<br />
W 18 26 27 27<br />
V 25 26 26 27<br />
U 7 7 7 7<br />
T 3 3 3 4<br />
Total 53 62 63 65<br />
After Anonymous. 1986. Management <strong>of</strong> the Surface Water Resources <strong>of</strong><br />
the Republic <strong>of</strong> South Africa, Department <strong>of</strong> Water Affairs, Pretoria, various<br />
pages.<br />
Data for primary drainage regions Wand T include areas outside<br />
Natal/KwaZulu.


