- Page 1: A WATER RESOURCES AND SANITATION SY
- Page 4 and 5: Contents 1 11111111111:1&11 CHAPTER
- Page 7 and 8: lillllllllllll.'. Tables (continued
- Page 9 and 10: 11111111];11,,11. 10.1 Introduction
- Page 11 and 12: Table J2: Water budgets for Natal/K
- Page 13 and 14: Table J4: Overall gradient distribu
- Page 16 and 17: 13 111.IJJ1111111 (when runoff: rai
- Page 18 and 19: Table J7: 15 Hi) A small part of Kw
- Page 20 and 21: 17 1\11••111;[11. Table J7: App
- Page 22 and 23: 19 TableJ8: Hydrological Research U
- Page 24 and 25: 21 11111••111111111 TableJ9: Cr
- Page 26 and 27: 23 Table J10: Areas. mean annual pr
- Page 28 and 29: 25 1111III1I11,rllll Table J10: Are
- Page 30 and 31: 27 Table J10: Areas. mean annual pr
- Page 32 and 33: 29 Table J10: Areas. mean annual pr
- Page 34 and 35: 31 Table J10: Areas. mean annual pr
- Page 36 and 37: 33 Table J10: Areas. mean annual pr
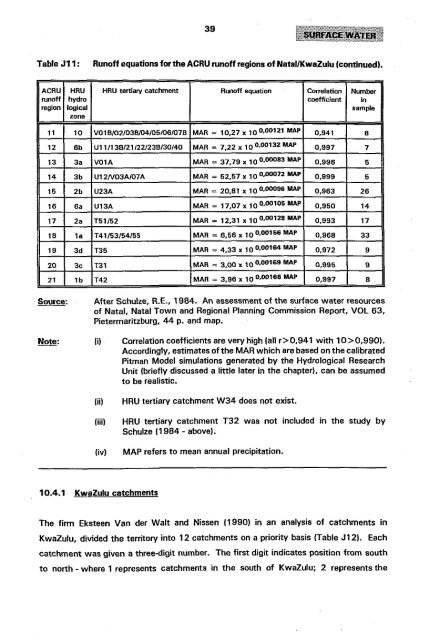
- Page 38 and 39: 35 Table J10: Areas. mean annual pr
- Page 40: 37 Table J10: Areas. mean annual pr
- Page 45 and 46: 10.6 Runoff models 42 Models are no
- Page 47: 111I111'llll1JII 10.9 The variabili
- Page 52 and 53: 49 lil11l1tllll;lllll Table J20: Es
- Page 54 and 55: 51 Table J20: Estimated annual wate
- Page 56 and 57: 53 Table J22: Estimated annual wate
- Page 58 and 59: 55 Ijlllltl1llflll (ii) Considerabl
- Page 60 and 61: 57 large catchments data. The Centr
- Page 62 and 63: 59 1111111111111' KwaDlangezwa, 283
- Page 64 and 65: Other reports 61 Research Unit, Dep
- Page 66 and 67: 63 1IIIIIE1111Elfl Id} The rest of
- Page 68 and 69: 65 Table J24: Department of Water A
- Page 70 and 71: 67 Table J24: Department of Water A
- Page 72 and 73: 69 Table J24: Department of Water A
- Page 74 and 75: 71 Table J24: Department of Water A
- Page 76 and 77: 73 Table J24: Department of Water A
- Page 78 and 79: 75 Table J24: Department of Water A
- Page 80 and 81: 77 Table J24: Department of Water A
- Page 82 and 83: 79 Table J24: Depanment of Water Af
- Page 84 and 85: 81 Station closed Station closed U2
- Page 86 and 87: 83 Station Drainage region Station
- Page 88 and 89: 85 Table J25: Number of stations wi
- Page 90 and 91: 87 iI11J111!!ltllllil equal share i
- Page 92:
89 Source: liI After Anonymous, 198
- Page 95:
111111111111111 92 boards (discusse
- Page 98 and 99:
Table J28: Some relevant data on se
- Page 101 and 102:
IDIIIIIDII':1111 98 (ii) The co-ord
- Page 103 and 104:
100 the respective departments at P
- Page 105 and 106:
1IIIIIIJIII.i1 102 Table J31: Categ
- Page 107 and 108:
104 10.16.2 Environmental impacts o
- Page 109 and 110:
Table J32: 106 A simplified form of
- Page 111 and 112:
1111111111111 108 Table J33: Action
- Page 113 and 114:
110 There is a growing South Africa
- Page 115 and 116:
112 Attention has also been focused
- Page 117 and 118:
114 10.17 Some legal aspects of wat
- Page 119 and 120:
116 time (mean exceedance flow), du
- Page 121 and 122:
IIII.IIWIIIII 118 10.17.4 Use of wa
- Page 123 and 124:
1[lIlIIIIIIJ. 120 Government dams,
- Page 125 and 126:
10.18.4 River diversions 122 Depart
- Page 127 and 128:
124 10.18.6 Irrigation districts an
- Page 129 and 130:
111(11111:41m'l 126 Table J36: Irri
- Page 131 and 132:
Table J37: Irrigation boards in Nat
- Page 133:
Tabla J37: Irrigation boards In Nat
- Page 136 and 137:
133 Table J38: Some urban areas in
- Page 138 and 139:
135 Table J38: Some urban areas in
- Page 140 and 141:
Table J38: 137 Some urban areas in
- Page 142 and 143:
139 Source: (i) After Ardington, E.
- Page 144 and 145:
141 i111_1illll1l noted above!. are
- Page 146 and 147:
143 (ii) The Directorate of Land an
- Page 148 and 149:
145 1111111111111 the Board will as
- Page 150 and 151:
147 Table J40: Administrative regio
- Page 152 and 153:
149 111II1.llllIf:J Government Noti
- Page 154 and 155:
151 111I.lIllllil1 Government agenc
- Page 156 and 157:
153 Table J43: Joint Services Board
- Page 159 and 160:
156 Source: (i) After Jenkin, F. (e
- Page 161 and 162:
158 Chief Directorate: Administrati
- Page 163 and 164:
Source: See also: Note: 160 Afterth
- Page 165 and 166:
162 off low - responsible inter ali
- Page 167 and 168:
11111.'.111:11111 164 If it became
- Page 169 and 170:
tlll••••I:IB11 NOTES: 166
- Page 171 and 172:
Contents 167 CHAPTER 11: GROUNDWATE
- Page 173:
Tables 169 Table K1: Some geologica
- Page 178 and 179:
174 Bate, 1992}*. The use of water
- Page 180 and 181:
176 X313, Pretoria, 0001; as well a
- Page 183 and 184:
179 a particular site, then a stati
- Page 185 and 186:
181 111...1[111 of streams and rive
- Page 187 and 188:
183 good. with a total dissolved so
- Page 189 and 190:
(iii) Holocene sands lQuaternary) 1
- Page 191 and 192:
187 Table K1: Some geological forma
- Page 193 and 194:
189 fault-bounded blocks, although
- Page 195 and 196:
191 11.6.4 Aquifer characteristics
- Page 197 and 198:
193 coarse and the latter, fine and
- Page 199 and 200:
195 111.BIII!I!111 The yields of bo
- Page 202 and 203:
11...,].11 198 11.7 Methods of grou
- Page 205 and 206:
201 11...11111 Table K3: Methods of
- Page 207 and 208:
203 boreholes are drilled for both
- Page 209 and 210:
205 1111111111'.1 3838. The borehol
- Page 211 and 212:
207 11.11 Standards applicable to t
- Page 213 and 214:
(a) Gravity springs 209 Gravity spr
- Page 215:
Table K4: Spring discharge in the V
- Page 218:
214 Table K5: The number of ephemer
- Page 222 and 223:
JJI...lllJll 218 (h) Some of the wa
- Page 224 and 225:
i'•••liDl Group E: Pure water
- Page 226 and 227:
222 Bond, Van Wyk proposed the foll
- Page 228 and 229:
1[11....11.,1 224 (b) Chlorides are
- Page 230 and 231:
226 Source: Edwards, T.J., 1989. Pe
- Page 232 and 233:
228 also obtainable from the Ground
- Page 234 and 235:
Ill1••lll1l 230 • Hofkes, EH.
- Page 236 and 237:
232 • Vegter, J.R., 1995. Groundw
- Page 238 and 239:
234 • Meyer, R. and Godfrey, l.,
- Page 240 and 241:
Springs 236 • Africa Co-operative
- Page 242 and 243:
NOTES: 238
- Page 244 and 245:
239 CHAPTER 12: WATER SUPPLY PLANNI
- Page 246 and 247:
12.1 Introduction 241 111'1&111111
- Page 248 and 249:
243 rilliltl.'ll water consumption
- Page 250 and 251:
Table L2: Cattle 245 study of reduc
- Page 252 and 253:
Note: (j) (ii) (iii) 247 Animal wat
- Page 254:
249 111111:llllltJI Source: After A
- Page 257 and 258:
1111111118.1 252 Table L4: Some per
- Page 259 and 260:
lillll.'.II' 254 high income. Iow d
- Page 261 and 262:
* 256 to obtain. Difficulties inclu
- Page 263 and 264:
1111...11 (iii) 258 Home Glasson Pa
- Page 265 and 266:
260 Table L6: Some typical domestic
- Page 267 and 268:
* ** 262 are in agreement with cons
- Page 270 and 271:
Table L7: Some South African indust
- Page 272 and 273:
Table L7: 267 Some South African In
- Page 274 and 275:
Table L7: 269 Some South African in
- Page 276 and 277:
Table L7: 271 Some South African In
- Page 278 and 279:
Note: (i) (ii) (iii) (iv) (v) (vi)
- Page 281 and 282:
276 concentrate on the provision of
- Page 283:
278 Table L8: RSA-KwaZulu Developme
- Page 286 and 287:
Table L9: 281 RSA-KwaZulu Developme
- Page 288 and 289:
Table L9: 283 RSA-KwaZulu Developme
- Page 291 and 292:
286 the Green book, namely, Anonymo
- Page 293 and 294:
IIIRlmlllillS 12.4.2 Durban Metro W
- Page 296:
291 design phase of projects. Any a
- Page 299 and 300:
294 Table L12: Some extant water wh
- Page 301:
11111111111911 296 • Energy Resea
- Page 304 and 305:
299 11111111111111 Table l13: Speci
- Page 306:
301 Table L13: Specific training ag
- Page 309 and 310:
304 Road and Umlazi (Durban); Pinet
- Page 312:
307 Table L14: A spatial typology o
- Page 315 and 316:
310 Table L15: A typology of social
- Page 317:
1111111..11 312 Table L15: A typolo
- Page 320 and 321:
315 114,[llll1\'1 Table L16: Some s
- Page 322 and 323:
317 Table L18: Mean household size
- Page 324 and 325:
319 Illil;JJtllllll Table L19: Exis
- Page 326 and 327:
321 Table L19: Existing housing del
- Page 328 and 329:
323 1IIIi!:lil.'11 a month, and a s
- Page 330 and 331:
NOTES: 325