View/Open - University of Zululand Institutional Repository
View/Open - University of Zululand Institutional Repository View/Open - University of Zululand Institutional Repository
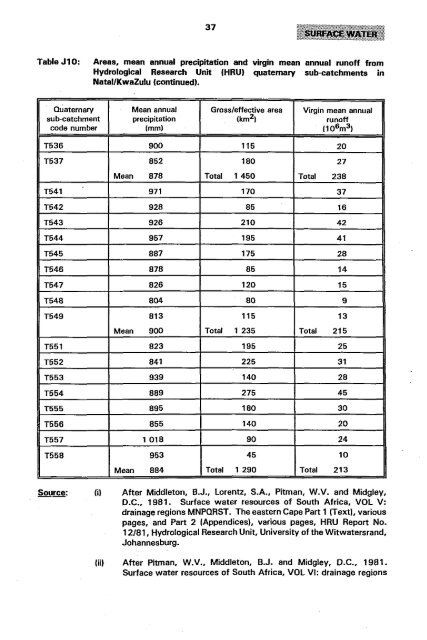
37 Table J10: Areas. mean annual precipitation and virgin mean annual runoff from Hydrological Research Unit (HRU) quaternary sub-eatchments in NatallKwaZulu (continued). Quaternary Mean annual Gross/effective area Virgin mean annual sub-eatchment precipitation (km 2 ) runoff code number (mm) (10 6 m 3 ) T536 900 115 20 T537 852 180 27 Mean 878 Total 1450 Total 238 T541 971 170 37 T542 928 85 16 T543 926 210 42 T544 957 195 41 T545 887 175 28 T546 878 85 14 T547 826 120 15 T548 804 80 9 T549 813 115 13 Mean 900 Total 1 235 Total 215 T551 823 195 25 T552 841 225 31 T553 939 140 28 T554 889 275 45 T555 895 180 30 T556 855 140 20 T557 1018 90 24 T558 953 45 10 Mean 884 Total 1290 Total 213 Source: (i) After Middleton, B.J., lorentz, S.A., Pitman, W.V. and Midgley, D.C., 1981. Surface water resources of South Africa, VOl V: drainage regions MNPQRST. The eastern Cape Part 1 (Text), various pages, and Part 2 (Appendices), various pages, HRU Report No. 12/81, Hydrological Research Unit, University ofthe Witwatersrand, Johannesburg. (H) After Pitman, W.V., Middleton, B.J. and Midgley, D.C., 1981. Surface water resources of South Africa, VOl VI: drainage regions
- Page 1: A WATER RESOURCES AND SANITATION SY
- Page 4 and 5: Contents 1 11111111111:1&11 CHAPTER
- Page 7 and 8: lillllllllllll.'. Tables (continued
- Page 9 and 10: 11111111];11,,11. 10.1 Introduction
- Page 11 and 12: Table J2: Water budgets for Natal/K
- Page 13 and 14: Table J4: Overall gradient distribu
- Page 16 and 17: 13 111.IJJ1111111 (when runoff: rai
- Page 18 and 19: Table J7: 15 Hi) A small part of Kw
- Page 20 and 21: 17 1\11••111;[11. Table J7: App
- Page 22 and 23: 19 TableJ8: Hydrological Research U
- Page 24 and 25: 21 11111••111111111 TableJ9: Cr
- Page 26 and 27: 23 Table J10: Areas. mean annual pr
- Page 28 and 29: 25 1111III1I11,rllll Table J10: Are
- Page 30 and 31: 27 Table J10: Areas. mean annual pr
- Page 32 and 33: 29 Table J10: Areas. mean annual pr
- Page 34 and 35: 31 Table J10: Areas. mean annual pr
- Page 36 and 37: 33 Table J10: Areas. mean annual pr
- Page 38 and 39: 35 Table J10: Areas. mean annual pr
- Page 42 and 43: 39 Table J11: Runoff equations fort
- Page 44 and 45: 41 J13. Dent, Schulze and Angus (19
- Page 46 and 47: 43 10.7 Mean annual runoff in Natal
- Page 50: 47 Table J18: Estimated mean annual
- Page 53 and 54: 11111181111.1 50 Table J20: Estimat
- Page 55 and 56: 52 Table J21: Estimated annual wate
- Page 57 and 58: 1111[,111111111111 54 Table J22: Es
- Page 59 and 60: 56 (1981); and Pitman, Middleton an
- Page 61 and 62: 58 • Middleton, B.J. and Pitman,
- Page 63 and 64: 60 • Rivett-Carnac. A.S. and Schu
- Page 65 and 66: 62 • Thomas, W.M., 1951. Part 2.
- Page 67 and 68: 64 Table J23: Types of gauging stat
- Page 69 and 70: 111.IIIEtlll:.11 66 Table J24: Depa
- Page 71 and 72: 1,.111111811 68 Table J24: Departme
- Page 73 and 74: 70 TableJ24: Department of Water Af
- Page 75 and 76: 72 Table J24: Department of Water A
- Page 77 and 78: 74 Table J24: Department of Water A
- Page 79 and 80: 76 Table J24: Department of Water A
- Page 81 and 82: 78 Table J24: Department of Water A
- Page 83 and 84: 80 Table J24: Department of Water A
- Page 85 and 86: IflBlIEilllllll 82 Station closed S
- Page 87 and 88: 84 (v) The Department of Agricultur
- Page 89 and 90: 86 have streamflow gauges situated
37<br />
Table J10: Areas. mean annual precipitation and virgin mean annual run<strong>of</strong>f from<br />
Hydrological Research Unit (HRU) quaternary sub-eatchments in<br />
NatallKwaZulu (continued).<br />
Quaternary Mean annual Gross/effective area Virgin mean annual<br />
sub-eatchment precipitation (km 2 ) run<strong>of</strong>f<br />
code number (mm) (10 6 m 3 )<br />
T536 900 115 20<br />
T537 852 180 27<br />
Mean 878 Total 1450 Total 238<br />
T541 971 170 37<br />
T542 928 85 16<br />
T543 926 210 42<br />
T544 957 195 41<br />
T545 887 175 28<br />
T546 878 85 14<br />
T547 826 120 15<br />
T548 804 80 9<br />
T549 813 115 13<br />
Mean 900 Total 1 235 Total 215<br />
T551 823 195 25<br />
T552 841 225 31<br />
T553 939 140 28<br />
T554 889 275 45<br />
T555 895 180 30<br />
T556 855 140 20<br />
T557 1018 90 24<br />
T558 953 45 10<br />
Mean 884 Total 1290 Total 213<br />
Source: (i) After Middleton, B.J., lorentz, S.A., Pitman, W.V. and Midgley,<br />
D.C., 1981. Surface water resources <strong>of</strong> South Africa, VOl V:<br />
drainage regions MNPQRST. The eastern Cape Part 1 (Text), various<br />
pages, and Part 2 (Appendices), various pages, HRU Report No.<br />
12/81, Hydrological Research Unit, <strong>University</strong> <strong>of</strong>the Witwatersrand,<br />
Johannesburg.<br />
(H) After Pitman, W.V., Middleton, B.J. and Midgley, D.C., 1981.<br />
Surface water resources <strong>of</strong> South Africa, VOl VI: drainage regions


