The Garden Route Sector Plan Western Cape - bgis-sanbi
The Garden Route Sector Plan Western Cape - bgis-sanbi
The Garden Route Sector Plan Western Cape - bgis-sanbi

Create successful ePaper yourself
Turn your PDF publications into a flip-book with our unique Google optimized e-Paper software.
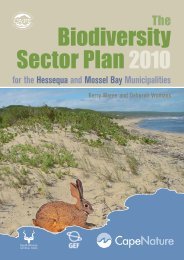
<strong>The</strong> <strong>Garden</strong> <strong>Route</strong><br />
Biodiversity<br />
<strong>Sector</strong> <strong>Plan</strong> 2010<br />
for the George, Knysna and Bitou Municipalities<br />
D.C. Vromans, K.S Maree, S. Holness, N. Job and A.E. Brown
iodiversity is all of nature<br />
<strong>The</strong> <strong>Garden</strong> <strong>Route</strong><br />
Biodiversity <strong>Sector</strong> <strong>Plan</strong><br />
for the George, Knysna and Bitou Municipalities<br />
2010<br />
Supporting land-use planning and decision-making<br />
in Critical Biodiversity Areas and Ecological Support Areas<br />
for sustainable development<br />
ISBN 978-0-9869776-1-9<br />
promoting sustainable development
Handbook Compiled by<br />
<strong>The</strong> handbook information was prepared by the <strong>Garden</strong> <strong>Route</strong> Initiative (SANParks) and the C.A.P.E. Fine-Scale Biodiversity <strong>Plan</strong>ning Project<br />
(<strong>Cape</strong>Nature). Both projects were funded by the Global Environmental Facility through the <strong>Cape</strong> Action for People and the Environment<br />
(C.A.P.E) programme.<br />
For Further Information<br />
<strong>The</strong> Geographical Information Systems (GIS) maps used to prepare the Critical Biodiversity Areas Map, plus electronic versions of this<br />
handbook, wall map, mapbook and technical reports, are available on DVD. Copies of the DVD can be obtained from (1) SANParks: <strong>Garden</strong><br />
<strong>Route</strong> Cluster (<strong>Plan</strong>ning and Implementation) – (044) 302 5600; or (2) South African National Biodiversity Institute: Biodiversity GIS Unit - (021)<br />
799 8698, email BGIShelp@<strong>sanbi</strong>.org or alternatively, download the handbook, maps and technical reports from www.<strong>bgis</strong>.<strong>sanbi</strong>.org.<br />
Acknowledgements<br />
This handbook has been based on the municipal biodiversity booklets compiled by Nancy Job and Amanda Driver for the Putting Biodiversity<br />
<strong>Plan</strong>s to Work Project (2006). <strong>The</strong> booklet was modified to align with the contents of a bioregional plan in terms of Chapter 3 of the National<br />
Environmental Management: Biodiversity Act (NEMBA) 10 of 2004. Other literature sources were also consulted (as referenced).<br />
We gratefully acknowledge the following people for their essential advice and support, namely: Kate Snaddon, Jeanne Nel, Mandy Cadman,<br />
Susie Brownlie, Marek Mentz Kedzieja, Willem Smit, Tania de Wahl, Neil Lambrecht, Yakeen Atwaru, Ed Hill, Ludolph Gherika, Greg McCulloch,<br />
Jonathan Mabula, Jan Smit, Hannes Muller and Dawie de Villiers. Credit must also be given to all the other provincial and local government<br />
officials with whom the author liaised with, too numerous to list. A special thanks goes to Johan Baard (flora), Ian Russel (aquatic ecosystems),<br />
Nick Hanekom (coastal and marine ecosystems), Armin Seydack (forest ecosystems), Susan Swain (stewardship) and Tineke Kraaij (fynbos<br />
ecosystems). We also recognize the indispensable role of the journalistic editor and proof-reader.<br />
Specific recognition must be given to Andrew Brown, the <strong>Garden</strong> <strong>Route</strong> Initiative (GRI) Project Coordinator, for his invaluable support and<br />
guidance throughout the life of the GRI Programme.<br />
Disclaimer<br />
<strong>The</strong> map associated with this handbook is not guaranteed to be free from error or omission. Consequently, the authors and designers hold no<br />
responsibility for any inaccuracies or financial loss. <strong>The</strong> map together with the guidelines serves as the primary biodiversity informant for landuse<br />
planning and decision-making, and does not claim to address other land-use or town and regional planning policy.<br />
Citation<br />
Vromans, D.C., Maree, K.S., Holness, S. and Job, N. and Brown, A.E. 2010. <strong>The</strong> <strong>Garden</strong> <strong>Route</strong> Biodiversity <strong>Sector</strong> <strong>Plan</strong> for the George, Knysna and<br />
Bitou Municipalities. Supporting land-use planning and decision-making in Critical Biodiversity Areas and Ecological Support Areas for sustainable<br />
development. <strong>Garden</strong> <strong>Route</strong> Initiative. South African National Parks. Knysna.<br />
Technical Editors and Contributors<br />
Amanda Driver, Samantha Ralsten, Jeffrey Manuel, Mellisa Naiker, Charl De Villiers, Donovan Kirkwood and Lucinda Cedras.<br />
CBA Map Compiled by<br />
Holness, S.D., Bradshaw, P. and Brown, A.E. 2010. Critical Biodiversity Areas of the <strong>Garden</strong> <strong>Route</strong>. Conservation <strong>Plan</strong>ning Report. <strong>Garden</strong> <strong>Route</strong><br />
Initiative. South African National Parks. Knysna..<br />
Design and Layout by Davidson Design Solutions..<br />
Andrew Brown
TABLE OF CONTENTS<br />
Each section of the handbook has been colour coded for your convenience (according to the Table of Contents below).<br />
ACRONYMS vi<br />
PREFACE vii<br />
SECTION 1: INTRODUCTION 1<br />
1.1 What is the purpose of a Biodiversity <strong>Sector</strong> <strong>Plan</strong> (BSP)? 1<br />
1.2 What is biodiversity? 2<br />
1.3 What are Critical Biodiversity Areas (CBA) and Ecological Support Areas (ESA)? 3<br />
1.4 What is a Biodiversity <strong>Sector</strong> <strong>Plan</strong>? 3<br />
1.5 Intended users and uses of a Biodiversity <strong>Sector</strong> <strong>Plan</strong> 4<br />
1.6 What the Biodiversity <strong>Sector</strong> <strong>Plan</strong> can and cannot do 4<br />
1.7 Biodiversity, the economy and poverty alleviation 5<br />
1.8 Biodiversity and climate change 7<br />
SECTION 2: BIODIVERSITY PROFILE FOR THE GARDEN ROUTE 9<br />
2.1 Why is the <strong>Garden</strong> <strong>Route</strong>’s biodiversity so important? 9<br />
2.2 Natural Wonders of the <strong>Garden</strong> <strong>Route</strong> 10<br />
2.3 Terrestrial (Land) Ecosystems 11<br />
2.4 Aquatic (Water) Ecosystems 13<br />
2.4.1 Wetlands 13<br />
2.4.2 Rivers 15<br />
2.4.3 Catchments 16<br />
2.5 Coastal and Marine Ecosystems 17<br />
2.6 Special habitats and Species of Special Concern 19<br />
2.7 Ecological Process Areas 22<br />
2.8 Protected Areas and Conservation Areas 23<br />
2.9 Land Cover in the <strong>Garden</strong> <strong>Route</strong> : Levels of Transformation and Degradation 24<br />
SECTION 3: THE CRITICAL BIODIVERSITY AREAS (CBA) MAP 27<br />
3.1 What is a Critical Biodiversity Areas Map? 27<br />
3.2 How was the Critical Biodiversity Area Map produced? 27<br />
3.3 Definitions of the categories on the Critical Biodiversity Areas Map 27<br />
3.4 <strong>The</strong> <strong>Garden</strong> <strong>Route</strong> Critical Biodiversity Areas Map 28<br />
3.5 Areas covered by the Critical Biodiversity Areas Map 28<br />
3.6 Criteria used to map categories on the Critical Biodiversity Areas Map 30<br />
3.7 Quantitative values (hectares/percentage) of the categories on the Critical Biodiversity Areas Map 31<br />
SECTION 4: LAND-USE GUIDELINES 33<br />
4.1 Desired Management Objectives 33<br />
4.2 Recommended biodiversity-compatible land-use guidelines matrix 34<br />
4.3 Descriptions of land-use activities 36<br />
4.4 Guidelines for the sound management of land and water resources 40<br />
SECTION 5: HOW AND WHEN TO USE THE BIODIVERSITY SECTOR PLAN IN LAND-USE PLANNING AND DECISION-MAKING 43<br />
5.1 Reactive land-use decision-making: EIAs, planning and agricultural applications 43<br />
5.1.1 Steps to follow when using the CBA Map 44<br />
5.2 Proactive land-use planning: Spatial Development Frameworks (SDF) and Environmental Management Frameworks (EMF) 46<br />
5.3 Multi-sectoral planning: Integrated Development <strong>Plan</strong>s (IDP) 47<br />
5.3.1 <strong>The</strong> Environmental <strong>Sector</strong> <strong>Plan</strong> of the IDP 50<br />
5.3.1.1 Municipal Coastal Management Programmes 50<br />
5.3.1.2 State of the Environment Reporting 50<br />
5.3.1.3 An Environmental Management <strong>Plan</strong> for municipal-owned land 50<br />
5.3.1.4 Municipal Invasive Alien Species Control <strong>Plan</strong> 50<br />
5.3.1.5 Area Wide <strong>Plan</strong>ning 50<br />
5.3.1.6 Using financial measures to protect biodiversity and promote sustainable development 50<br />
5.3.1.7 Protecting biodiversity through stewardship 51<br />
5.3.1.8 Co-operative management measures for protecting biodiversity 51<br />
5.3.1.9 Protecting biodiversity and supporting Local Economic Development (LED) 51<br />
SECTION 6: FREQUENTLY ASKED QUESTIONS 53<br />
SECTION 7: AGENCIES THAT CAN HELP PROTECT AND MANAGE BIODIVERSITY 55<br />
Glossary 56<br />
References 61<br />
Appendix A: Summary biodiversity statistics for the <strong>Garden</strong> <strong>Route</strong> vegetation types. 62<br />
Note: Superscript g denotes that a particular term is defined or further explained in the glossary.<br />
v
Acronyms<br />
BGIS Biodiversity Geographical Information Systems<br />
BSP Biodiversity <strong>Sector</strong> <strong>Plan</strong><br />
C.A.P.E. <strong>Cape</strong> Action for People and the Environment<br />
CBA Critical Biodiversity Area<br />
CFR <strong>Cape</strong> Floristic Region<br />
CR Critically Endangered<br />
CREW Custodians of Rare and Endangered Wildlife<br />
DAFF Department of Agriculture, Forestry and Fisheries<br />
DEADP Department of Environmental Affairs and Development <strong>Plan</strong>ning<br />
DoA Department of Agriculture (as part of the DAFF)<br />
DWEA Department of Water and Environmental Affairs<br />
DPLG Department of Provincial and Local Government<br />
EIA Environmental Impact Assessment<br />
EMF Environmental Management Framework<br />
EMP Environmental Management <strong>Plan</strong><br />
ESA Ecological Support Area<br />
FF Fynbos Forum<br />
FSP Fine-Scale <strong>Plan</strong>ning<br />
GDP Gross Domestic Product<br />
GIS Geographical Information Systems<br />
GR <strong>Garden</strong> <strong>Route</strong><br />
IDP Integrated Development <strong>Plan</strong><br />
LED Local Economic Development<br />
LM Local Municipality<br />
LUMS Land Use Management System<br />
LUPO Land-use <strong>Plan</strong>ning Ordinance (1985)<br />
MPA Marine Protected Area<br />
NEMA National Environmental Management Act<br />
NEMBA National Environmental Management: Biodiversity Act<br />
NEMPAA National Environmental Management: Protected Areas Act<br />
NNAR No Natural Areas Remaining<br />
NPAES National Protected Area Expansion Strategy<br />
NGO Non-governmental organisations<br />
NSBA National Spatial Biodiversity Assessment<br />
NWA National Water Act<br />
ONAs Other Natural Areas<br />
PSDF Provincial Spatial Development Framework<br />
RLUP&M Rural Land-Use <strong>Plan</strong>ning and Management Guidelines<br />
SANBI South African National Biodiversity Institute<br />
SANParks South African National Parks<br />
SDF Spatial Development Framework<br />
SEA Strategic Environmental Assessment<br />
SoER State of Environment Report<br />
SPC Spatial <strong>Plan</strong>ning Categories<br />
STEP Subtropical Thicket Ecosystem <strong>Plan</strong>ning Project<br />
WMA Water Management Area
Preface<br />
This handbook was prepared to accompany and further explain the <strong>Garden</strong> <strong>Route</strong> Critical Biodiversity Areas<br />
(CBA) Map for the George, Knysna and Bitou municipalities (Section 3 pg 27). <strong>The</strong> CBA Map seeks to support<br />
municipalities and other sectors in multi-sectoral planning proceduresg to ensure sustainable development<br />
through the protection of biodiversity (i.e. nature) and its ecosystem services (e.g. water, food, clean air, firewood,<br />
grazing lands etc).<br />
<strong>The</strong> CBA Map divides the landscape into five categories: Protected Areas, Critical Biodiversity Areas, Ecological<br />
Support Areas, Other Natural Areas and No Natural Areas Remaining. <strong>The</strong> first three mentioned categories<br />
represent the biodiversity priority areas which should be maintained in a natural to near natural state. <strong>The</strong> last<br />
two mentioned categories are not considered biodiversity priority areas, and can be targeted for sustainable<br />
development.<br />
Biodiversity-compatible land-use guidelines are provided for the biodiversity priority areas and a set of land and<br />
water resource use management guidelines for Critical Biodiversity Areas, Ecological Support Areas and Other<br />
Natural Areas (Section 4 pg 33). <strong>The</strong> network of CBA reflected on the CBA Map represents the most efficient<br />
(least land hungry) pattern that attempts to avoid conflict with other land-uses, and which is required to meet<br />
national biodiversity thresholdsg .<br />
<strong>The</strong> <strong>Garden</strong> <strong>Route</strong> Critical Biodiversity Areas Map<br />
<strong>The</strong> CBA Map and guidelines are central components of the Biodiversity <strong>Sector</strong> <strong>Plan</strong>g (BSP), which represents the<br />
biodiversity informant for various multi-sectoral planning procedures. <strong>The</strong> BSP also comprises this handbook, the<br />
various maps used to prepare the CBA Map (e.g. vegetation map, land cover map), a wall map, a mapbook and<br />
technical reports (see Section 1.4 pg 3).<br />
<strong>The</strong> BSP is intended to support land-use planning and decision-makingg for sustainable development. It will<br />
help inform the planning and management tools that municipalities are required to develop, such as Integrated<br />
Development <strong>Plan</strong>s (IDPs) and Spatial Development Frameworks (SDFs), including Environmental Management<br />
Frameworks (EMFs), environmental assessments and land-use decisions.<br />
Numerous environmental and planning laws require municipalities to consider the environment and protect<br />
biodiversity in planning and decision-making, in support of sustainable development. Critical Biodiversity<br />
Areas and Ecological Support Areas should inform decision-making by all spheres of government, especially<br />
municipalities, as required by National Environmental Management: Biodiversity Act (NEMBA) 10 of 2004. <strong>The</strong><br />
CBA Map provides a newly available reference for land-use decisions at a more accurate and detailed scale for<br />
informed decision-making, as required by the National Environment Management Act (NEMA) 107 of 1998. It<br />
therefore supersedes all other biodiversity maps, namely the NSBA, CAPE and STEP. Furthermore, the BSP serves<br />
as the framework for the compilation of a bioregional plang in terms of Chapter 3 of the NEMBA for the <strong>Garden</strong><br />
<strong>Route</strong> region.<br />
This handbook aims to provide a common point of reference for municipal officials, environmental and planning<br />
professionals, the Department of Environmental Affairs and Development <strong>Plan</strong>ning (DEADP), the Departments<br />
of Water and Environmental Affairs (DWEA), the Department of Agriculture, Forestry and Fisheries (DAFF), various<br />
other government and non-government agencies, landowners, developers, estate agents and the general public.<br />
Note: <strong>The</strong> term, bioregional plan g , should be understood in terms of Chapter 3 of the National<br />
Environmental Management: Biodiversity Act (NEMBA) 10 of 2004 and not in relation to the provincial<br />
Bioregional <strong>Plan</strong>ning Manual for the <strong>Western</strong> <strong>Cape</strong> (Moss, 2003). Both promote the principles of bioregional<br />
planning which encourage the protection of our biodiversity, thereby promoting sustainable development.<br />
Refer to the Table of Contents for easy access to those sections of the Handbook most useful to you.<br />
vii
Andrew Brown<br />
Peet Joubert
Introduction<br />
1<br />
Andrew Brown<br />
National policy is underpinned by the principle of sustainable development g which aims to ensure that<br />
all development serves both present and future generations. Key to achieving this is the safeguarding of<br />
critical natural services such as clean and adequate water supplies, nutritious veld for grazing livestock, and<br />
stable healthy soils which are resilient to flood damage and erosion. It follows then, that the prerequisite<br />
for sustainability is the safeguarding of biodiversity g (i.e. the variety of local plants and animals and the<br />
natural processes that sustain them).<br />
Spatial planning and land-use management decisions must, by law, take into account the biodiversity<br />
of an area. To enable this, scientists have researched the <strong>Garden</strong> <strong>Route</strong>’s biodiversity to determine the<br />
spatial arrangement of plants, animals, rivers, wetlands and their interactions and functioning. Based on<br />
this information, areas have been categorised and prioritised according to their biodiversity value and<br />
requirement for safeguarding.<br />
In summary, in order to ensure sustainable development, scientists have identified priority areas requiring<br />
special safeguarding. <strong>The</strong>y have also identified areas of lesser biodiversity importance, as well as those<br />
sites which have insignificant biodiversity remaining after intensive development, e.g. housing, plantation<br />
forestry or ploughing for the cultivation of agricultural crops.<br />
1.1 WHAT IS THE PURPOSE OF A BIODIVERSITY SECTOR PLAN?<br />
<strong>The</strong> Biodiversity <strong>Sector</strong> <strong>Plan</strong> provides a synthesis of prioritised information to planners and land-use<br />
managers, enabling the integration of biodiversity into land-use planning and decision-making g (LUPDM).<br />
It identifies those sites that are critical for conserving biodiversity and in this way, facilitates the integration<br />
of biodiversity into decision-making (i.e. mainstreaming g biodiversity). Mainstreaming is crucial to<br />
overcoming the “conservation versus development” mindset, and for ensuring sustainable development<br />
(National Biodiversity Framework, 2009).<br />
<strong>The</strong> overall aim is to minimise the loss of natural habitat in Critical Biodiversity Areas (CBA) and prevent<br />
the degradation of Ecological Support Areas (ESA), while encouraging sustainable development in other<br />
natural areas. <strong>The</strong> broad objective is to ensure appropriate land-use for the best possible sustainable<br />
benefits and to promote integrated management g of natural resources. <strong>The</strong> CBA Map should be the<br />
common reference of biodiversity priority areas for supporting municipalities and other sectors in multisectoral<br />
planning procedures g at a more accurate and detailed scale.<br />
<strong>The</strong> way in which the components of<br />
biodiversity are spatially arranged is<br />
referred to as biodiversity pattern<br />
(below) while the series of actions and<br />
interactions are termed ecological<br />
processes (left).<br />
1
1.2 WHAT IS BIODIVERSITY?<br />
In brief, biodiversity g is a relatively new, technical term for nature.<br />
It encompasses the diversity of all living things - plants, animals,<br />
insects, micro-organisms etc., and also the series of actions and<br />
interactions that sustains these living components and enables their<br />
persistence over time.<br />
<strong>The</strong> way in which the components of biodiversity are spatially<br />
arranged is referred to as biodiversity pattern while the series<br />
of actions and interactions are termed ecological processes.<br />
Biodiversity pattern can be expressed as different vegetation types<br />
(such as forest, grassland, shrubland) or habitats (the natural home of<br />
a living organism such as a wetland) or specific features (populations<br />
of rare plants which grow in a specific area and nowhere else).<br />
Process and pattern are interdependent - with processes dependent<br />
on the health and integrity of the component biodiversity, while<br />
pattern is essentially maintained by processes.<br />
Ecological processes are those actions and interactions which<br />
enable natural systems to function and run as healthy, working<br />
systems. An example of an ecological process is nutrient recycling<br />
whereby a plant grows by absorbing elements from the air and<br />
nutrients from the soil, and after its death, these enhanced products<br />
are released into the soil. <strong>The</strong> spin-off of the process is improved soil<br />
fertility and carbon storage g (which increases our resilience to global<br />
climate change). Both spin-offs benefit humans and are known as<br />
ecosystem services g (see below).<br />
Evolutionary processes are those series of actions which enable<br />
new species to evolve in response to changing conditions over<br />
extended time periods. <strong>The</strong> maintenance and functioning of healthy<br />
natural systems is determined by a variety of factors which are<br />
termed ecological drivers e.g. rainfall, temperature, fire, herbivory etc.<br />
Keurbooms River corridor which is critical<br />
for maintaining ecological processes.<br />
Biodiversity is maintained by ecological processes at the micro-scale<br />
(such as in pollination, nutrient cycling via microbial action) through<br />
to the mega-scale (natural events e.g. fire, flood; migration of species<br />
along river valleys or coastal areas, quality and quantity of water<br />
feeding rivers and estuaries; marine sand movement, the seasonal<br />
mountain-to-coast migration of birds that pollinate plants).<br />
An ecosystem g is a natural system which comprises all living<br />
organisms (plants, animals etc) in a particular area including its<br />
physical environment (water, air, soil etc) functioning together as a<br />
unit. A mountain ecosystem, for example, is very different to a beach<br />
ecosystem because they are comprised of different plants, animals<br />
and climates. Ecosystems can operate at any scale from very small<br />
(e.g. a small pond) to an extensive landscape (an entire mountain<br />
water catchment g area).<br />
Ecosystems deliver a number of ecosystem services, most of which<br />
we simply take for granted. For example, healthy ecosystems provide<br />
us with water to drink, foodstuffs, woodfuel, medicines, clean air<br />
and safeguard us against flooding. See Sections 2.3 – 2.5 for a list<br />
of the ecosystem services offered by the various ecosystems e.g.<br />
vegetation, rivers etc.<br />
Since we are totally dependent on natural systems for food<br />
and water, it is essential that land-use decisions are guided by<br />
biodiversity considerations and the maintenance of healthy<br />
functioning ecosystems, now and in the future. This is the<br />
essence of sustainable development.<br />
Andrew Brown
1.3 WHAT ARE CRITICAL BIODIVERSITY AREAS<br />
(CBA) AND ECOLOGICAL SUPPORT AREAS<br />
(ESA)?<br />
Critical Biodiversity Areas g (CBA) are terrestrial (land) and aquatic<br />
(water) areas which must be safeguarded in their natural or nearnatural<br />
state as they are critical for conserving biodiversity and<br />
maintaining ecosystem functioning. <strong>The</strong>se areas include: (a) natural<br />
areas identified as requiring safeguarding in order to meet national<br />
biodiversity thresholds 1 ; (b) areas required to ensure the continued<br />
existence and functioning of species g and ecosystems g , including the<br />
delivery of ecosystem services g ; and/or (c) important locations for<br />
biodiversity features or rare species.<br />
Ecological Support Areas g (ESA) are supporting zones or<br />
areas which must be safeguarded as they are needed to prevent<br />
degradation of Critical Biodiversity Areas and formal Protected Areas g .<br />
Although biodiversity pattern and process are interdependent,<br />
there are situations where even though pattern is disrupted, certain<br />
processes are able to continue functioning. Riparian zones and<br />
wetlands in areas of intensive agriculture or plantations may still<br />
play an important role in maintaining water quality in rivers that<br />
flow through these areas. In Protected Areas and Critical Biodiversity<br />
Areas, both pattern and process need to be protected against<br />
degradation, whereas in Ecological Support Areas, the protection of<br />
ecological processes is required.<br />
1.4 WHAT IS A BIODIVERSITY SECTOR PLAN?<br />
A Biodiversity <strong>Sector</strong> <strong>Plan</strong> (BSP) provides a way forward in reconciling<br />
the conflict between development and the maintenance of natural<br />
systems. It provides biodiversity information needed for land-use<br />
planning and decision-making and other multi-sectoral planning<br />
processes (see Section 1.5 below).<br />
1. Primary products: This Biodiversity <strong>Sector</strong> <strong>Plan</strong> Handbook, the<br />
CBA Wall Map, the CBA Mapbook and GISg maps.<br />
2. Associated products:a legislative user guide, the Fynbos Forum<br />
Ecosystem Guidelines for Environmental Impacts Assessment in<br />
the <strong>Western</strong> <strong>Cape</strong> (de Villiers et al., 2005)g; the C.A.P.E Fine-Scale<br />
<strong>Plan</strong>ning (FSP) Aquatic Ecosystem Guidelines (Job et al., 2008),<br />
the <strong>Garden</strong> <strong>Route</strong> Vegetation Report (Vlok and Euston-Brown,<br />
2008) and the <strong>Garden</strong> <strong>Route</strong> Conservation <strong>Plan</strong>ning Report<br />
(Holness et al. 2010).<br />
<strong>The</strong> GIS (Geographical Information Systemsg ) maps include:<br />
• Primary data: the Critical Biodiversity Areas Map (includes all<br />
CBA Map categories: Protected Areas, Critical Biodiversity Areas,<br />
Ecological Support Areas, Other Natural Areas and No Natural<br />
Areas Remaining), the Desired Management Objectives and the<br />
recommended Spatial <strong>Plan</strong>ning Categoryg (as per the Provincial<br />
SDF). A CBA Lookup Table is provided which indicates the key<br />
criteria that determined whether a site is a CBA or ESA. Refer to<br />
the technical report (Holness et al., 2010) for further details on<br />
the CBA Lookup Table.<br />
• Associated data: Vegetation types, land cover (transformation<br />
shapefile); and an alien plant map.<br />
<strong>The</strong> <strong>Garden</strong> <strong>Route</strong> Biodiversity <strong>Sector</strong> <strong>Plan</strong> data are provided on DVD<br />
and is available from SANParks <strong>Garden</strong> <strong>Route</strong> Cluster on (044) 302<br />
5600, the BGIS Unit on (021) 799 8738 or downloadable from their<br />
website www.<strong>bgis</strong>.<strong>sanbi</strong>.org (South Africa’s biodiversity portal).<br />
1 Threshold - the target area which must be safeguarded in order for the component plants and animals to exist and for ecosystems to continue<br />
functioning (e.g. pollination, migration of animals). <strong>The</strong> thresholds for various types of habitats have been set nationally within the National Spatial<br />
Biodiversity Assessment planning process.<br />
3
1.5 INTENDED USERS AND USES OF A<br />
BIODIVERSITY SECTOR PLAN<br />
<strong>The</strong> Biodiversity <strong>Sector</strong> <strong>Plan</strong> is essential to all sectors involved in landuse<br />
planning and decision-making, as well as other multi-sectoral<br />
planning procedures (See Figure 1.1). It provides a common point<br />
of reference for municipal officials, planning and environmental<br />
professionals, National and Provincial Environmental Departments,<br />
National and Provincial Agricultural Departments, including<br />
Water Affairs, Forestry, Fisheries, Mineral Resources, Energy, Rural<br />
Development and Land Reform, Local Government, Housing, Public<br />
Works, Catchment Management Agencies; and all organs of state<br />
preparing guidelines in terms of section 74 of the Environmental<br />
Impact Assessment regulations 2 . Programmes such as Working<br />
for Water, Working for Wetlands, LandCare, CoastCare; private<br />
landowners, estate agents, developers, the general public and<br />
conservation NGOs will also benefit from consulting the BSP.<br />
<strong>The</strong> BSP should be used by ALL sectors whose policies and decisionmaking<br />
affects land-use.<br />
Restricting<br />
Figure 1.1: Intended users and uses of the Biodiversity <strong>Sector</strong> <strong>Plan</strong> (adapted from Job and Driver, 2006).<br />
1.6 WHAT THE BIODIVERSITY SECTOR PLAN<br />
CAN AND CANNOT DO<br />
SANBI and other research institutes<br />
DEA&DP<br />
Supplements to the<br />
NEMA EIA regulations,<br />
developing EMFs, PSDF<br />
and guidelines; input<br />
into land-use<br />
applications and<br />
assessing<br />
municipal SDFs<br />
National & provincial authorities require data to set policy & guide decision-making<br />
CAPE NATURE<br />
e.g. Environmental Depts, MCM, DP&LG etc. (All sectors whose policies and decision-making impacts land-use)<br />
BSP<br />
and natural resource management<br />
Specialists<br />
• <strong>The</strong> Biodiversity <strong>Sector</strong> <strong>Plan</strong> can:Serve as the primary source<br />
of information on biodiversity for land and water resource<br />
use decision-making and forward planning processes, such<br />
as municipal Spatial Development Frameworks (SDFs),<br />
Environmental Management Frameworks (EMFs) and<br />
Integrated Development <strong>Plan</strong>s (IDPs);<br />
• Provide more accurate and detailed information and therefore<br />
replaces broad-scale biodiversity plans, e.g. NSBA, STEP and<br />
CAPE;<br />
• Provide the spatial framework and policy recommendations for<br />
the drafting of a bioregional plang by identifying priority areas<br />
for conservation action and the establishment of protected<br />
areas, required in terms of Chapter 3 of the NEMBA;<br />
• Identify a network of Critical Biodiversity Areas whose<br />
safeguarding is required to meet national biodiversity<br />
thresholdsg ;<br />
• Provide regional biodiversity priorities thereby creating a<br />
strategic framework for sustainable development; and<br />
Water<br />
Affairs<br />
Water Resources<br />
planning,<br />
protection, input<br />
into CMA<br />
strategies<br />
2 Provincial and national guidelines that are issued in relation to environmentally sensitive areas, environmental impacts, activities or processes contemplated<br />
in the EIA regulations.
• Assist municipalities to comply with environmental and<br />
planning legislation that promotes the protection and<br />
management of biodiversity, acting as the spatial framework<br />
and policy for sustainable development set by international<br />
and national environmental and planning legislation and<br />
policy.<br />
<strong>The</strong> CBA Map provides the information needed for three broad<br />
categories of day-to-day land and water resource use decisions:<br />
1) Reactive decision-making, such as environmental impact<br />
assessment (EIA), agricultural land-use decisions, water-use<br />
licensing and other development control decisions through<br />
the Land-use <strong>Plan</strong>ning Ordinance (LUPO) or other land-use<br />
legislation; 2) Proactive forward planning, such as Integrated<br />
Development <strong>Plan</strong>s (IDPs), Spatial Development Frameworks<br />
(SDFs) and Zoning Schemes; and 3) Proactive conservation,<br />
such as stewardship, land acquisition and clearing of invasive<br />
alien plants.<br />
Every effort has been made to produce a useful and accurate map.<br />
However, it is important to be aware that:<br />
• <strong>The</strong> CBA Map does not replace on-site assessments for<br />
land-use applications. <strong>The</strong>refore, the CBA Map must be used in<br />
conjunction with a site visit to inform site level decisions.<br />
• <strong>The</strong> Biodiversity <strong>Sector</strong> <strong>Plan</strong> simply provides information on<br />
biodiversity (i.e. provides only one information layer of the<br />
many layers required in land-use planning); and must be<br />
used in conjunction with other land-use or town and regional<br />
planning application procedures.<br />
• <strong>The</strong> Biodiversity <strong>Sector</strong> <strong>Plan</strong> is the forerunner to any future<br />
bioregional plang in terms of Chapter 3 of the NEMBA. It must<br />
undergo further legal, administrative and public consultation<br />
procedures in order to qualify as a formally published<br />
bioregional plang .<br />
1.7 BIODIVERSITY, THE ECONOMY AND<br />
POVERTY ALLEVIATION<br />
All social and economic sectors are entirely dependent on<br />
biodiversity because it delivers ecosystem services g , which<br />
are vital for our survival. <strong>The</strong>se services include a regular supply<br />
of clean water, flood control, prevention of erosion, insect<br />
pollination (vital for the fruit industry), carbon storage g (to<br />
counteract climate change) and clean air.<br />
<strong>The</strong> <strong>Garden</strong> <strong>Route</strong>’s biodiversity contributes significantly to the<br />
province’s economic growth and development through the<br />
provision of services such as food, fuel, fibre, and medicines. It is<br />
the basis for our nature-based tourism, sustainable harvesting<br />
and film industries, and a location for traditional and modern<br />
rituals and ceremonies. Biodiversity is also the mainstay of our<br />
agricultural economy, providing services such as grazing for<br />
livestock and insect pollination for food crops. Every aspect of<br />
our livelihoods depends on these services (see Sections 2.3 – 2.5<br />
for a list of services offered by the various ecosystems e.g. rivers,<br />
vegetation etc).<br />
<strong>The</strong> fruit industry in the <strong>Cape</strong> is entirely dependent on bees for its crop<br />
production. Outside of the fruiting season, as much as 80% of bee<br />
colonies survive on nectar and pollen provided by the natural veld.<br />
Safeguarding natural bee habitat is critical to the success of the fruit<br />
industry which employs significant numbers of people in rural areas.<br />
<strong>The</strong> loss of biodiversity through disturbance or development has<br />
impacts on ecosystem functioning and reduces the delivery of<br />
ecosystem services; and as a result economic growth. For example,<br />
the destruction of vegetation leads to erosion, and heavy silt loads<br />
which then necessitate increased municipal spending on chemicals<br />
used for water treatment. Water becomes more costly to supply,<br />
reducing finances for other service delivery. Furthermore, after the<br />
removal of plant cover, heavy rainfall results in flooding, and homes<br />
and roads are washed away, with the rural poor often being the<br />
most severely affected. <strong>The</strong> loss of natural veld can impact on nearby<br />
agricultural crops as a reduction in insect pollinators leads to smaller<br />
harvests, with fewer jobs leading to greater poverty.<br />
Despite great progress, scientists do not know enough to predict<br />
the full impacts of human activities on natural systems. However, it<br />
is known that natural systems can bear increasing burdens without<br />
revealing any decline in their own functioning before they reach a<br />
critical point, after which they then collapse. Future generations<br />
will face significant ecological, economic, social and cultural<br />
costs if we do not acknowledge that human well-being is<br />
dependent on protecting biodiversity.<br />
In South Africa, the total value of ecosystems is conservatively<br />
estimated at R27 billion per annum. This estimate includes the<br />
production of biological resources as well as the final consumption of<br />
ecosystem services. <strong>The</strong> calculated value of biodiversity-dependent<br />
industries in the greater <strong>Cape</strong> region amounts to approximately R9,4<br />
billion. In 2000 it was estimated that the pollinating services of bees<br />
to the fruit industry and for honey production amounted to R594<br />
million, while in 2003, bird-watching tourism generated R16 million.<br />
5
Biodiversity should be viewed as the cornerstone of sustainable development. Both<br />
natural and social capital provides the input for economic capital. <strong>The</strong> ability of nature<br />
to manage the waste generated by economic activity (e.g. pollution) has a major effect<br />
on the overall competitiveness and success of our economy as a whole. If we fail to<br />
recognize the challenge of separating economic growth and poverty eradication from<br />
rising levels of natural resource-use and waste per capita, we will undermine the preconditions<br />
needed to boost growth and eradicate poverty. <strong>The</strong> situation of continuing<br />
inequality, accompanied by a deteriorating resource base, makes it imperative for us to<br />
go beyond thinking in terms of trade-offs and the simplicity of the ‘triple bottom line’ 3 .<br />
We must acknowledge that there are non-negotiable ecological thresholds that<br />
must sustain our natural capital; and that we must employ the precautionary<br />
principle g in this approach (National Framework for Sustainable Development,<br />
2008).<br />
Safeguarding biodiversity includes activities such as removing invasive<br />
alien plants from natural areas. Such initiatives not only provide<br />
employment and training opportunities, but It is estimated that alien<br />
clearance in the <strong>Cape</strong> could ‘earn’ about R700 million per year through<br />
enhanced cut-flower production for the wildflower industry, improved<br />
water supply through enhanced runoff and increased tourism.<br />
Our rich biodiversity provides for nature-based community initiatives<br />
that support poverty alleviation by creating jobs in industries such<br />
as eco-tourism, wild cut-flowers and honeybush tea, professional<br />
nature guiding, and bee farming. Some of these initiatives are good<br />
examples of collaborative programmes involving a range of national<br />
agencies that include municipalities at the local level e.g. SANParks<br />
‘People and Conservation’ (see Section 5.3.1.9 pg 51).<br />
In South Africa, the total<br />
value of ecosystems is<br />
conservatively estimated<br />
at R27 billion per annum.<br />
This estimate includes the<br />
production of biological<br />
resources as well as the<br />
final consumption of<br />
ecosystem services.<br />
Application of the CBA Map and guidelines ensures that we<br />
maintain nature’s valuable ecosystems services for sustainable<br />
economic and social development.<br />
3 Triple bottom line: Also referred to as the 3 pillars of sustainability, namely ecological integrity, social justice and economic efficiency, where economic<br />
capital is dependent on natural and social capital.<br />
Hilton Herd
1.8 BIODIVERSITY AND CLIMATE CHANGE<br />
Climate change 4 is one of the biggest challenges facing humankind.<br />
Even if we achieve significant reductions in emissions of greenhouse<br />
gases, global climate change is inevitable. It poses significant threats<br />
to the basic provisions of life: water, health, food production and the<br />
environment, with the poorest communities likely to be the hardest<br />
hit. <strong>The</strong> ‘business as usual’ approach to climate change will cost as<br />
much as between 5 and 20% of global Gross Domestic Product every<br />
year.<br />
Climatologists predict a 50% reduction in rain-fed agricultural yield<br />
in some African countries by the 2020s (Intergovernmental Panel on<br />
Climate Change, 2007).<br />
Scientific predictions of future climate change suggest that the<br />
<strong>Western</strong> <strong>Cape</strong> could experience more drought periods. Coupled with<br />
increased evaporation and temperatures, this will negatively impact<br />
water supply. Regional predictions suggest a drying trend from<br />
west to east, with a weakening of winter rainfall, possibly slightly<br />
more summer rainfall (mainly in the eastern regions associated with<br />
the mountains), a shift to more irregular rainfall of possibly greater<br />
intensity, and rising temperatures everywhere. It is likely that the<br />
greatest impacts will be on water supply. Economic growth in most<br />
of the <strong>Western</strong> <strong>Cape</strong> Province is already limited by water shortages<br />
(Midgley, 2005). A study by Hewitson and Crane (2006) suggests<br />
decreased winter rainfall in the <strong>Western</strong> <strong>Cape</strong> with increased summer<br />
rainfall in the interior and eastern part of South Africa.<br />
Climate change highlights the importance of protecting our water<br />
resources from over-abstraction, degradation and the spread<br />
of invasive alien plants (which use more water than indigenous<br />
plants). <strong>The</strong> Critical Biodiversity Areas map identifies the mountain<br />
catchment g areas that are critical in this regard as they are the<br />
primary source of our water supply. For example; a fynbos mountain<br />
catchment can lose up to 68% of its water yield due to a dense cover<br />
of invasive alien shrubs or trees. In the face of climate change we<br />
cannot afford these losses.<br />
By protecting biodiversity we protect<br />
ourselves against climate change.<br />
<strong>The</strong> increase in temperatures anticipated with climate change may<br />
result in increased fire frequencies. Invasive alien plants are often<br />
highly flammable and with their large volumes, are likely to fuel<br />
more frequent fires. <strong>The</strong> combination of more frequent and more<br />
intense fires will have a devastating impact on the region. To avert<br />
this, an integrated alien and fire management plan is essential to<br />
ensure both the removal of invasive alien plants as well as controlled<br />
burns (see Section 5.3.1.4 and 8). <strong>The</strong>se interventions will result in<br />
an increased water supply, optimum regeneration of our veld, and a<br />
reduction in erosion and sediment deposition during times of severe<br />
rain.<br />
<strong>The</strong> <strong>Garden</strong> <strong>Route</strong> is especially vulnerable to two of climate change’s<br />
most severe impacts, i.e. sea level rise and freshwater flooding. To<br />
prevent flooding of vulnerable coastal properties such as those<br />
between Mossel Bay and Nature’s Valley, natural defenses in the form<br />
of primary dune systems and estuarine mudflats must be protected<br />
from further conversion through urban development or agricultural<br />
practices. Ensuring that development is setback from the coast and<br />
from freshwater systems enhances the economic and ecological<br />
functioning of marine and other aquatic ecosystems, and improves<br />
our resilience to climate change impacts (Roets and Duffell-Canham,<br />
2009).<br />
To ensure resilience against the impacts of climate change, landscape<br />
corridors need to be kept intact to function as ecological process areas.<br />
<strong>The</strong>se corridors enable the migration of plants, animals and birds and<br />
hence to persist despite changing climatic conditions. Examples of<br />
corridors are river valleys extending from inland mountains to the sea,<br />
along parts of the escarpment (the step where the inland plateau drops<br />
to the coastal plain) and also along the coast.<br />
Application of the CBA Map and guidelines should be one of<br />
the primary adaptation mechanisms used by local authorities<br />
to deal effectively with climate change.<br />
With climate change taking affect<br />
building within the 1:100 year floodline or<br />
even higher is no longer an option.<br />
Photo: Sarah Fox<br />
4 A climate change strategy and action plan for the <strong>Western</strong> <strong>Cape</strong>’ has been developed by the Department of Environmental Affairs and Development<br />
<strong>Plan</strong>ning, <strong>Western</strong> <strong>Cape</strong> (DEADP, 2007); and in preparation is the report ‘A guideline for incorporating climate change adaptation and mitigation measures<br />
in Environmental and Spatial Development <strong>Plan</strong>ning and the development and environmental authorisation processes’.<br />
Sarah Fox<br />
7
At the local level, one of the most effective ways to mitigate<br />
against climate change is to safeguard Critical Biodiversity Areas<br />
and Ecological Support Areas. As a strategy against the impacts of<br />
climate change, the CBA Map has identified a network of important<br />
biodiversity areas linking the inland mountains to the coast, as well<br />
as along the coast. Accompanying guidelines assist in integrating<br />
climate change into land-use planning and decision-making. Crucial<br />
management guidelines include:<br />
• maintaining intact riparian (river bank) vegetation to avoid<br />
flooding and to protect water resources;<br />
• restricting building to above the 1:100 year flood-line or higher<br />
where necessary;<br />
• establishing a coastal set back line (i.e. a set distance inland<br />
from the coast) to avoid flooding;<br />
• protecting major landscape corridorsg with biodiversitycompatible<br />
land-uses to allow for species migration<br />
(persistence) and carbon storage;<br />
• protecting water resources;<br />
• appropriate fire management to reduce fire damage and<br />
maintain biodiversity;<br />
• removal of alien invasive plants to yield more water and reduce<br />
fire damage; and<br />
• restoring and maintaining biodiversity for carbon storageg to reduce the impacts of rising temperatures due to global<br />
warming.<br />
<strong>The</strong>se guidelines also assist with Disaster Management, using<br />
preventative rather than costly reactive measures.<br />
Decision-makers and planners can reduce the effects of global<br />
climate change by integrating the CBA Map and guidelines into<br />
land-use planning and decision-making, and by adhering to wise<br />
management guidelines.<br />
All organs of state are obliged to consider biodiversity in their decision-making and to make use of the<br />
most up to date information (National Environment Management Act (NEMA) 107 of 1998). Furthermore, all<br />
spheres of government and all organs of state must co-operate with, consult and support one another.<br />
<strong>The</strong> Biodiversity <strong>Sector</strong> <strong>Plan</strong>, comprising the CBA Map and guidelines, provides a framework for the compilation<br />
of a bioregional plan g in terms of Chapter 3 of the National Environmental Management: Biodiversity Act<br />
(NEMBA) 10 of 2004 and, in so doing, supports the National Biodiversity Framework (2009).<br />
Andrew Brown
Biodiversity Profile<br />
for the <strong>Garden</strong> <strong>Route</strong><br />
2<br />
2.1 WHY IS THE GARDEN ROUTE’S BIODIVERSITY SO IMPORTANT?<br />
<strong>The</strong> <strong>Garden</strong> <strong>Route</strong> falls within the <strong>Cape</strong> Floristic Region (CFR), which is recognised as one of three<br />
internationally acclaimed biodiversity hotspots 5 in South Africa. Biodiversity hotspots are areas of high<br />
species diversity, and which are also under serious threat. <strong>The</strong> CFR, which extends from Nieuwoudtville<br />
south to <strong>Cape</strong> Town and then eastwards to Grahamstown, comprises about 9000 plant species, of which<br />
over 6000 are endemic g to the region, meaning that they are found nowhere else in the world. Along with<br />
its plant diversity, the CFR is also rich in animal species (more than 560 vertebrates) in both terrestrial and<br />
aquatic environments, and is home to extraordinarily high numbers of invertebrates (insects, etc). Over half<br />
of the 44 frog species recorded in the CFR are endemic g . <strong>The</strong>re are 142 indigenous reptile species, 27 of<br />
which are endemic. Two species of tortoise occur almost exclusively within the region. <strong>The</strong> majority of its<br />
freshwater fish are endemic, not only to South Africa, but to the CFR. It is also a priority area for species of<br />
endemic birds.<br />
<strong>The</strong> <strong>Garden</strong> <strong>Route</strong> domain contains numerous endemic plant species, such as the heath, Erica outeniquae,<br />
and the grass, Pentameris uniflora, located in the Outeniqua Subalpine Fynbos within the George<br />
Municipality. <strong>The</strong> orchid, Disa procera, is a local endemic of the Hoogekraal Sandplain Fynbos, whilst the<br />
grass, Pentaschistis barbata ssp. orientalis, and the orchid, Satyrium princeps, are local rarities in the <strong>Garden</strong><br />
<strong>Route</strong>. <strong>The</strong> Brenton-Blue Butterfly occurs exclusively in the coastal fynbos at Brenton-on-Sea, while the<br />
Knysna Spiny Reed Frog is endemic to the Knysna area.<br />
<strong>The</strong> forests of the <strong>Garden</strong> <strong>Route</strong> are of national importance. This is because very few forests occur in South<br />
Africa. <strong>The</strong>y also represent the most extensive system of tall, natural forests in South Africa, and have a<br />
high diversity of plant species per unit area (DWAF, 2007). Known as the Southern <strong>Cape</strong> Forests, they are<br />
extraordinarily rich in plant species. In fact, South African temperate forests are between 3 and 7 times<br />
richer in tree species than other temperate forested areas in the Southern Hemisphere, even though they<br />
occupy a relatively small area. Although they are climatically classified as warm temperate forests, they<br />
function more like tropical forests, which may explain their relatively high diversity. True forest animals,<br />
such as the vulnerable and nationally protected 6 blue duiker, and even leopard, still occur within the forest.<br />
However, in the surrounding fynbos shrublands, most of the larger animals have been displaced. Other red<br />
data 7 or protected species are also found in the forests, such as the Crowned Eagle and the Honey Badger.<br />
<strong>The</strong> local endemic heath, Erica canaliculata, grows in moist sites along the forest edge. See Appendix A for<br />
a full list of vegetation types in the <strong>Garden</strong> <strong>Route</strong>.<br />
<strong>The</strong> <strong>Garden</strong> <strong>Route</strong> contains some of South Africa’s most important estuaries, such as the Knysna Estuary,<br />
which is ranked number 1 in terms of its conservation value (Turpie et al, 2002). It contains the second<br />
largest salt marsh area in the country. It is also home to the Wilderness Lakes (Rondevlei, Langvlei, Island<br />
Lake and the Serpentine), which form an area listed as a Ramsar Site of international importance and<br />
Swartvlei, which is ranked number 6 in the country.<br />
5 <strong>The</strong>re are 34 global biodiversity hotspots. For more information see www.biodiversityhotspots.org.<br />
6 In terms of the National Environmental Management: Biodiversity Act – Critically Endangered, Endangered,<br />
Vulnerable Protected Species List.<br />
7 Red data species are species that have been classified according to their risk of extinction in the near future. See<br />
glossary.<br />
9<br />
<strong>The</strong> Outeniqua<br />
Mountain Range<br />
showing the<br />
Outeniqua Subalpine<br />
Fynbos (Critically<br />
Endangered) and the<br />
Outeniqua Montane<br />
Forest (Endangered)<br />
located in the<br />
George Municipality<br />
(Photos: Jan Vlok).
2.2 NATURAL WONDERS OF THE GARDEN ROUTE<br />
George Knysna Bitou<br />
Wilderness Lakes – are globally important<br />
and classified as a Ramsar site because of<br />
the abundance of water birds.<br />
Ruitersberg Ericaceous Fynbos – occurs<br />
in the Outeniqua mountains and is vital in<br />
ensuring good quality water and reliable<br />
stream flow.<br />
Outeniqua Mountains – this range forms<br />
a natural scenic backdrop to the town of<br />
George, and serves as a landscape corridor<br />
which increases resilience against climate<br />
change.<br />
Grysbok (Raphicerus melanotis) – an<br />
Endangered and endemic buck that<br />
inhabits thick scrub and bush, as well as<br />
fynbos.<br />
Martial Eagle (Polematus bellicosus) - the<br />
largest eagle in Africa with a preference<br />
for uninhabited stretches of thicket and<br />
open plains. It is nationally protected and<br />
is Vulnerable.<br />
Ruitersberg Ericaceous Fynbos occurs in the Outeniqua<br />
mountains is vital in ensuring good quality water and reliable<br />
stream flow.<br />
Photo: Jan Vlok<br />
<strong>The</strong> Knysna Estuary – ranked number one in<br />
South Africa for its conservation importance. Its<br />
biodiversity is rich, accounting for 43% of South<br />
Africa’s estuarine plant and animal species<br />
(Allanson, 2000).<br />
Knysna Forest - high diversity of tree and shrub<br />
species, providing habitat which supports true<br />
forest animals, such as the nationally protected<br />
and Vulnerable leopard.<br />
Groenvlei-Swartvlei mouth dunes – <strong>The</strong>se<br />
include the Groenvlei Dunefields, east of<br />
Swartvlei mouth. This dune area is an area of<br />
high conservation value (Clark and Lombard,<br />
2007).<br />
Caracal (Felis caracal) – Lives in a wide range<br />
of habitats, but easily displaced by urban and<br />
agricultural development.<br />
Knysna Seahorse (Hippocampus capensis) – is<br />
an Endangered fish species endemic to South<br />
Africa, with the smallest geographical range<br />
of any seahorse. It lives in the Knysna Estuary,<br />
Swartvlei, Keurbooms and Klein Brak.<br />
Salt River – in an ecologically healthy<br />
and natural state. It’s ecological and<br />
importance sensitivity rating is Very<br />
High, requiring a high level of protection<br />
(Gouritz State of River Report, 2007).<br />
Roodefontein Grassy Fynbos – This is a<br />
Critically Endangered Fynbos vegetation<br />
type that grows only in the Bitou<br />
Municipality, and nowhere else.<br />
Bitou Corridor (includes the Bitou and<br />
Keurbooms Rivers) – is vital in maintaining<br />
ecological processes, which in turn,<br />
increases resilience against climate<br />
change.<br />
Pansy shell (Echinodiscus bisperforatus) – is<br />
a nationally protected marine species and<br />
its shape is used as a symbol for the Bitou<br />
Municipality.<br />
Leopard (Panthera pardus) – a Vulnerable<br />
and nationally protected big cat,<br />
inhabiting forest and rocky mountainous<br />
areas.
2.3 TERRESTRIAL (LAND) ECOSYSTEMS<br />
As described earlier in section 1.2, ecosystemsg comprise living<br />
organisms and their relationships and interactions, as well as their<br />
non-living environment (e.g. soils). Furthermore, ecosystems can<br />
operate at different scales from a small wetland to a large mountain<br />
ecosystem. Terrestrial ecosystems include living organisms and the<br />
substrate or land on which they occur. A useful way of categorising<br />
them is according to vegetation type (e.g. forest, grassland,<br />
shrubland) and then further classifying them according to their<br />
specific habitat, for example the Outeniqua Plateau Forest or the<br />
Wilderness Forest-Thicket in the <strong>Garden</strong> <strong>Route</strong>.<br />
<strong>The</strong> vegetation map for the <strong>Garden</strong> <strong>Route</strong> shows the historical and<br />
current extent of the indigenous vegetation types in the region<br />
mapped at a scale of 1:50 000 (see Figure 2.1 and 2.2 below). An<br />
associated publication with full vegetation type descriptions is<br />
available8 . Appendix A (pg 62) provides a list of all the vegetation<br />
types in the <strong>Garden</strong> <strong>Route</strong> domain, including other biodiversity<br />
data, e.g. land cover (such as natural, degradedg , plantation, urban),<br />
ecosystem statusg .<br />
Protecting vegetation types also protects other biodiversity features,<br />
such as mammals, birds, insects and other organisms that are<br />
associated with specific vegetation types. By protecting the habitat,<br />
we therefore protect the range of species that occur there.<br />
11<br />
<strong>The</strong> single biggest cause of biodiversity loss in South Africa, and the<br />
<strong>Garden</strong> <strong>Route</strong>, is loss of natural habitat e.g. by urban development,<br />
agriculture and plantation forestry. Infestation by invasive alien<br />
species is a second major cause. Other land-uses such as grazing<br />
of natural veld and harvesting of wild plants can be sustainable if<br />
managed appropriately so that biodiversity 9 is not compromised.<br />
As natural habitat is lost, ecosystem functioning becomes<br />
increasingly compromised. This can eventually lead to collapse, with<br />
the consequent loss of ecosystem servicesg . In most cases, ecosystem<br />
service delivery is irreplaceable or too expensive to substitute. For<br />
example, it is simply not feasible to build man-made structures that<br />
can deliver the clean and reliable water supplies provided by healthy,<br />
fynbos-covered mountain catchments.<br />
Even small, degraded or patches of natural habitat invaded by alien<br />
plants may play an important role in the ecological functioning of<br />
the broader landscape or support the last remaining population of a<br />
particular species, and should nevertheless, be regarded as being of<br />
importance for biodiversity.<br />
Until specialists have assessed ALL the remaining natural habitat in<br />
the municipality; and the municipality has built a database of sitespecific<br />
information, all terrestrial ecosystems in the municipality<br />
should be approached in terms of the guidelines offered in Section<br />
4 and 5.<br />
Figure 2.1a Historical extent of vegetation types within the <strong>Garden</strong> <strong>Route</strong> prior to urban and agricultural development versus<br />
2.1b Current extent of vegetation within the <strong>Garden</strong> <strong>Route</strong>, subsequent to urban, plantation forestry and agricultural development.<br />
8 Vlok, J.H.J., Euston-Brown D.I.W. and Wolf, T. 2008. A vegetation map for the <strong>Garden</strong> <strong>Route</strong> Initiative. Unpublished 1:50 000 maps and report supported by<br />
CAPE FSP task team.<br />
9 See the South African National Biodiversity Institute’s conservation farming website www.nbi.ac.za/consfarm/cfindex.htm<br />
a<br />
b
Key vegetation types of the <strong>Garden</strong> <strong>Route</strong> region<br />
Included in Critical Biodiversity Areas (CBA) are all those vegetation<br />
types classified as Critically Endangered 10 , as well as the best and<br />
most efficient areas to meet the thresholds for other vegetation<br />
types (e.g. a Least Threatened vegetation type will be classified as a<br />
CBA if it is located in a landscape corridor).<br />
All the vegetation types that are dependent on the presence of<br />
either fresh or brackish surface water are important in terms of their<br />
conservation value. For example, the Keurbooms River and Perennial<br />
Streams which only occur in Knysna Municipality, the Moordkuils<br />
Perennial Stream, which is confined to the George Municipality and<br />
the Tsitsikamma River and Floodplain which is restricted to the Bitou<br />
Municipality. Both Tsitsikamma Ericaceous Fynbos and Ruitersberg<br />
Ericaceous Fynbos are considered priority vegetation types as they<br />
fulfil an important water catchment function and are the source of<br />
most of the perennial streams. <strong>The</strong> latter vegetation type occurs only<br />
in the George Municipality, while the former type is found in all<br />
three municipalities. <strong>The</strong> Coastal Forests are also highly significant<br />
in terms of biodiversity. Examples include the Tsitsikamma Dune<br />
Forest which grows only in the Bitou Municipality, the Groenvlei<br />
Coastal Forest near Sedgefield in the Knysna Municipality and<br />
the Wolwedans Thicket-Forest which is limited to the George<br />
Municipality. In all, 15 vegetation types are classified as Critically<br />
Endangered, some of which are mentioned above. See Appendix A<br />
(pg 62) for the full listing of vegetation types and associated data.<br />
For the VEGETATION MAP, see the <strong>Garden</strong> <strong>Route</strong> CBA Mapbook<br />
and GIS maps.<br />
Terrestrial ecosystems are protected by various pieces of<br />
legislation, such as:<br />
• <strong>The</strong> Listed Activities in terms of the National<br />
Environmental Management Act (NEMA) 107 of 1998<br />
protects the removal of indigenous vegetation depending<br />
on certain criteria.<br />
• <strong>The</strong> National Forest Act (NFA) 84 of 1998 protects certain<br />
tree species and national forest types (including Southern<br />
<strong>Cape</strong> Afrotemperate Forests which are located in the<br />
<strong>Garden</strong> <strong>Route</strong>),<br />
• <strong>The</strong> NEMBA protects certain plants species and threatened<br />
ecosystems, known as Listed Threatened Ecosystems. <strong>The</strong><br />
SA vegetation types (Mucina et al., 2006), which are Listed<br />
and located in the <strong>Garden</strong> <strong>Route</strong> include <strong>Cape</strong> Lowland<br />
Alluvial Vegetation (George and Bitou LM), Eastern Coastal<br />
Shale Band Vegetation (Bitou LM), <strong>Garden</strong> <strong>Route</strong> Granite<br />
Fynbos (George and Knysna LM), <strong>Garden</strong> <strong>Route</strong> Shale<br />
Fynbos (George to Bitou LM), Groot Brak Dune Strandveld<br />
(George LM along the coast), Knysna Sand Fynbos (Knysna<br />
LM), Langkloof Shale Renosterveld (George to Bitou LM)<br />
and the <strong>Western</strong> <strong>Cape</strong> Milkwood Forests (George and<br />
Knysna LM).<br />
<strong>The</strong> <strong>Western</strong> <strong>Cape</strong> Nature Conservation Laws Amendment Act<br />
protects certain flora and fauna.<br />
Terrestrial ecosystem services - What our natural habitat does<br />
for us<br />
Human survival is entirely dependent on the delivery of ecosystem<br />
services. <strong>The</strong> maintenance of these ecosystems and their supporting<br />
‘ecological infrastructure’ is a key socio-economic imperative.<br />
Degradation or destruction of the natural environment can lead to<br />
high socio-economic costs.<br />
Although this is not an exhaustive list, the following services are<br />
delivered by terrestrial ecosystems:<br />
• Buffers against natural hazards such as fire and floods<br />
• Regulation of water supply<br />
• Forage for grazing livestock and wild animals<br />
• Provision of food, fibre, medicinal and cosmetic plants<br />
• Provision of cleaner air<br />
• Improved resilience against climate change by storage (aboveand<br />
below-ground) of excess carbon released as carbon<br />
dioxide through burning fossil fuels i.e. carbon storage<br />
• Support of the horticultural and wildflower industries<br />
• Provision of natural spaces for recreation and tourism<br />
• Contribution to natural and cultural heritage<br />
<strong>The</strong> sustainable use and management of the natural environment is<br />
vital, not only for the sake of biodiversity, but for social and economic<br />
survival. Ill-considered development resulting in the destruction of<br />
natural landscapes will reduce the tourism potential of an area. Instead,<br />
wise and well-informed land-use planning and management will<br />
enhance the region’s capacity for tourism.<br />
Bird-watching tourism<br />
in the <strong>Cape</strong> Floristic Region generated<br />
R16 million p.a. in 2003<br />
10 Classified in terms of the <strong>Garden</strong> <strong>Route</strong> Fine-Scale Systematic Biodiversity <strong>Plan</strong> (Holness, 2010), the technical term for the CBA Map and analysis process<br />
which produced the CBA Map. <strong>The</strong> systematic biodiversity plan is based on the national equivalent ecosystem status. See glossary and technical report<br />
(Holness, 2010).<br />
Peet Joubert
2.4 AQUATIC (WATER) ECOSYSTEMS<br />
An aquatic ecosystem (natural water features) comprises the living<br />
organisms and the non-living components in the surrounding<br />
water system. Aquatic ecosystems described here include wetlands<br />
(or vleis), estuaries, lagoons, lakes and rivers. <strong>The</strong>y are grouped<br />
together in this section to emphasize that they are usually interrelated<br />
systems and activities which impact on one part will have<br />
consequences elsewhere. For example, whatever happens in the<br />
upper reaches of a river in the mountains will impact the lower<br />
reaches of the river where the estuary links with the sea. See Section<br />
2.4.3 on catchments (pg 16).<br />
South Africa is a water-scarce country, and our aquatic ecosystems<br />
are under severe pressure as a result of many competing demands<br />
on our limited water resources. All indications are that South Africa<br />
will reach its limits of potentially accessible water supplies between<br />
2020 and 2030. It is crucial that efficient water use is encouraged, for<br />
example through demand control g , recycling, re-use and rainwater<br />
harvesting.<br />
2.4.1 WETLANDS<br />
Wetlands, commonly known as vleis, occur where water covers<br />
the soil permanently or periodically, at or near the surface. <strong>The</strong>se<br />
waterlogged soils determine the types of organisms which can grow<br />
in this habitat, such as specially adapted plants, termed hydrophytes.<br />
Wetlands are found in many forms, including peat bogs or mountain<br />
seeps or alongside stream banks, or as salt marshes associated with<br />
estuaries.<br />
More than half of South Africa’s wetlands have already been<br />
destroyed (for example by urban expansion or cultivation), with<br />
severe consequences for water quality, consistency of water supply<br />
and flood control. Significant economic costs are incurred where<br />
there are inadequate buffers, resulting in flooding. High expenditure<br />
is required for controlling invasive weed species, mosquitoes,<br />
sedimentation, eutrophication (nutrient enrichment) and the<br />
rehabilitation of degraded areas.<br />
All wetlands and estuaries in the <strong>Garden</strong> <strong>Route</strong> are Critical<br />
Biodiversity Areas. <strong>The</strong> CBA Map shows those wetlands that<br />
have been mapped in the <strong>Garden</strong> <strong>Route</strong>, but note that not<br />
all wetlands have been mapped. <strong>The</strong>refore, the presence<br />
and extent of a wetland on a site should be confirmed by a<br />
specialist.<br />
13<br />
Estuaries are also a type of wetland. According to the National<br />
Wetland Inventory Classification System, estuaries are defined as “…<br />
partially enclosed ecosystems that are permanently or periodically<br />
connected to the ocean, which are influenced by tidal fluctuations<br />
and within which ocean water is at least occasionally diluted by fresh<br />
water derived from surface or subsurface land drainage.”<br />
Estuaries occur where river water and seawater mix in the lower<br />
sections of a river causing the pH, salinity, and water level to vary<br />
depending on the river and the ocean that feeds the estuary. <strong>The</strong>y<br />
can concentrate materials such as pollutants and sediments. <strong>The</strong>y are<br />
impacted by activities far upstream, such as abstraction, and as far as<br />
the mountains where their rivers originate. <strong>The</strong>y are also affected by<br />
activities out at sea.<br />
Key wetlands/estuaries of the <strong>Garden</strong> <strong>Route</strong> region<br />
<strong>The</strong> large estuarine lake systems in this region are the result of<br />
ancient sedimentation processes along the coastal areas (primarily<br />
associated with ancient quaternary sedimentary deposits). <strong>The</strong> lake<br />
systems are found in depressions or low lying valleys where the<br />
water table is exposed, or where these low lying areas have been<br />
back-flooded by the sea, as in the case of estuaries<br />
<strong>The</strong> <strong>Garden</strong> <strong>Route</strong> Lakes Systems, which span both the George and<br />
Knysna municipal areas, are made up of:<br />
1. Touw System (Touw River and Estuary, Island Lake, Langvlei,<br />
Rondevlei and connecting channels);<br />
2. Swartvlei System (Swartvlei Lake, Karatara Lake and Swartvlei<br />
Estuary); and<br />
3. Knysna Estuary.<br />
<strong>The</strong> Salt River, which<br />
is situated in the Bitou<br />
Municipality, is in an<br />
ecologically healthy<br />
and natural state.<br />
It’s ecological and<br />
importance sensitivity<br />
rating is Very High,<br />
requiring a high level<br />
of protection.<br />
Photo: Andrew Brown
<strong>The</strong> key estuaries in the George Municipality include the Wilderness<br />
Lakes Area, which comprises the Langvlei, Island Lake and Rondevlei<br />
connected to each other by small shallow channels, as well as the<br />
Touw Estuary. <strong>The</strong>y receive freshwater from the Touw and Duiwe<br />
Rivers, including underground seepage and sea water via the Touw<br />
Estuary. <strong>The</strong> Wilderness Estuary is connected to Langvlei by the<br />
Serpentine River. Lagoons, running from west to east, include the<br />
Rooi River located at Outeniqua Beach near Glentana, the Maalgate,<br />
Gwaing, Skaapkop, Meul at Ballots Bay and Kaaimans Lagoon, just<br />
east of the Touw Estuary in Wilderness.<br />
Important estuaries in the Knysna Municipality include the Knysna<br />
and Goukamma Estuary, and the Swartvlei Lake in Sedgefield. <strong>The</strong><br />
largest estuary on South Africa’s south coast is the Knysna Estuary,<br />
which is highly diverse and accounts for 43% of South Africa’s<br />
estuarine plant and animal species (Allanson, 2000). <strong>The</strong> Swartvlei<br />
Lake is the deepest of the estuaries and is often stratified into<br />
different densities owing to tidal water exchange and river inflow. It<br />
is one of the few clear water systems in South Africa with high plant<br />
diversity.<br />
Both estuaries are home to the rare Knysna seahorse (Hippocampus<br />
capensis), which is listed in the IUCN Red Data Book as Endangered,<br />
and which is endemic to South Africa. Groenvlei is another unique<br />
system representing the only closed drainage basin (endorheic) with<br />
water levels approximately 3m above sea-level. It is a freshwater<br />
coastal lake, lying to the east of Sedgefield, and separated from the<br />
ocean and entirely dependent on groundwater. It contains some<br />
relic estuarine species, such as the estuarine roundherring. <strong>The</strong><br />
Knysna Estuary is ranked number 1 in South Africa in terms of its<br />
conservation value, while the Swartvlei Lake is ranked number 6<br />
(Turpie et al, 2002). A key wetland, Vankerelsvlei, is extremely unusual<br />
in having an Aspargnum (peat-forming) wetland that is in good<br />
condition.<br />
<strong>The</strong> Bitou Municipality contains the large Keurbooms River Estuary<br />
located to the east of the town of Plettenberg Bay. It is separated<br />
from the sea by a coastal barrier, which has a tidal inlet linking it<br />
to the sea. It is an important nursery area for fish, is home to the<br />
Knysna Seahorse, and is ranked number 16 in South Africa in terms<br />
of conservation importance. <strong>The</strong> Bitou Estuary, which feeds into the<br />
Keurbooms, has a unique mixture of plant and animal species, and<br />
no alien fish species. <strong>The</strong> Brak and Salt River Mouth enter the Indian<br />
Ocean to the west of Nature’s Valley, where the Groot River (west)<br />
estuary is periodically open to the sea. <strong>The</strong> Groot River has important<br />
saltmarsh beds, two red data fish species and is a relatively diverse<br />
and pristineg system. Two Lagoons, the Helpmekaar and Kliprivier,<br />
are located just east of the Groot River.<br />
Wetlands are protected by various pieces of legislation, such<br />
as:<br />
• <strong>The</strong> National Water Act (NWA) 107 of 1998, which stipulates<br />
that reserve determination studies need to be undertaken<br />
to identify the ecological reserveg requirements of a<br />
wetland<br />
• <strong>The</strong> NEMA in terms of principle (r) and the listed activities<br />
(Section 24).; and<br />
• <strong>The</strong> Conservation of Agricultural Resources Act (CARA) 43<br />
of 1983; in which no activities are allowed within the flood<br />
area or within 10 meters horizontally outside the flood<br />
area.<br />
<strong>The</strong> Wilderness Lakes (Rondevlei, Langvlei, Island Lake and the<br />
Serpentine), a portion of the Touw System, is a listed Ramsarg<br />
Site due to the high abundance of water birds. <strong>The</strong> Knysna<br />
Protected Environment and the Wilderness National Park form<br />
part of the <strong>Garden</strong> <strong>Route</strong> National Park, under the National<br />
Environmental Management: Protected Areas Act (NEMPAA) 57<br />
of 2003.<br />
<strong>Garden</strong> <strong>Route</strong> Estuaries and Wetlands are all classified as Critical<br />
Biodiversity Areas, as they are important hydrological process areas, many<br />
of which have been degraded or transformed.<br />
Estuaries are located at the mouth of rivers where they enter the sea,<br />
whilst wetlands are found from the mountains to the coast<br />
(Photographers: Andrew Brown and Hilton Herd).<br />
<strong>The</strong> economic value of the Knysna Estuary<br />
is estimated at R2.8 to 3.4 billion per annum.
Ecosystem Services – What our wetlands do for us<br />
Wetlands, together with an associated buffer of natural vegetation,<br />
perform a number of valuable functions, especially in relation to<br />
- water quality (filtering and purifying water, trapping sediment,<br />
protecting shorelines and controlling erosion [which minimises<br />
excessive sedimentation downstream], recharging aquifers), water<br />
quantity (reducing peak floods and storing flood waters, supporting<br />
stream base flow during the dry season, groundwater discharge/<br />
recharge), and wildlife habitat (providing habitat for amphibians,<br />
birds, fish and mammals for all or portions of their life cycles).<br />
It is clear that development in wetlands and within floodlines have<br />
contributed to flood damage in the <strong>Garden</strong> <strong>Route</strong>. Recently, massive<br />
damage to property occurred in Wilderness, Sedgefield, along the<br />
Knysna Estuary and the Keurbooms Estuary. Agricultural and other<br />
human activities in the river catchments have led to pollution<br />
events in the Swartvlei and Wilderness Lakes systems. <strong>The</strong> Knysna<br />
Estuary, for example, is impacted by sewage pollution, and upstream<br />
developments of the Keurbooms have led to a reduction in flood<br />
events, resulting in saltwater intrusion and sedimentation.<br />
For the WETLANDS (VLEIS) and ESTUARIES, see the <strong>Garden</strong> <strong>Route</strong><br />
CBA Mapbook.<br />
<strong>The</strong> rand value of a natural flood control service,<br />
such as a vegetation buffer around a wetland, is equal to the<br />
cost of repairing flood damages or the costs of rehabilitating a<br />
wetland.<br />
2.4.2 RIVERS<br />
<strong>The</strong> natural water resources along the Outeniqua Coastal Area<br />
(Mossel Bay to Plettenberg Bay) are under enormous pressure<br />
owing to development and the spread of water-thirsty alien plants.<br />
Frequent water shortages are experienced during peak holiday<br />
season. Along the Outeniqua coast climate change predictions<br />
suggest generally slightly reduced rainfall 11 , with increased rainfall<br />
variability, fewer but more intense rainfall events and increased<br />
temperatures and evaporation are predicted. <strong>The</strong>se effects could<br />
Figure 2.2: Key rivers in the George, Knysna and Bitou municipalities.<br />
work together to increase flooding, but could also reduce low flow<br />
in rivers (Eden SoER, 2008 and Midgley, 2005). Intense rainfall events<br />
and increased run-off may reduce groundwater recharge and water<br />
availability for human use (Gouritz State of Rivers Report, 2007).<br />
Predictions suggest that South Africa’s water supplies will reach<br />
their limits between 2020 and 2030. Encouraging efficient<br />
water use is therefore crucial, for example through demand<br />
control, recycling, re-use and rainwater harvesting. Compliance<br />
with the water use guidelines associated with the CBA Map will<br />
ensure the protection of our water resources.<br />
<strong>The</strong> well-being of a river ecosystem is largely dependent on the<br />
health of the adjacent natural vegetation or “riparian habitat”.<br />
This vegetation filters pollutants, helps maintain natural water<br />
temperatures, contributes organic matter (‘food’) in support of<br />
aquatic life (fish, insects etc), and acts as a buffer to adjacent landuse.<br />
<strong>The</strong> roots of the riparian plants also reduce the effects of floods,<br />
by binding river banks and thus preventing erosion. Furthermore,<br />
bank storage is increased by slowing run off during floods. For these<br />
reasons, it is essential that new land-use, development or activity<br />
should be separated from a river by a buffer area. See Guidelines<br />
Section 4 (pg 33). An example of inadequate buffer areas due to<br />
infilling and encroachment into flood plains of small seasonal rivers<br />
areas is demonstrated at Glentana near George, where a beach<br />
restaurant has been washed away twice in five years (Roets and<br />
Duffel-Canham, 2009).<br />
See Section 2.6 (pg 19) regarding important fish species living in<br />
the rivers of the <strong>Garden</strong> <strong>Route</strong>.<br />
Key Rivers of the <strong>Garden</strong> <strong>Route</strong> region<br />
Key rivers in the George Municipality include the Maalgate,<br />
Gwaing, Skaapkop and Kaaimans rivers, which arise in the Outeniqua<br />
Mountains. <strong>The</strong> Maalgate and Gwaing Rivers arise east of George, and<br />
flow across the narrow coastal plain, reaching the sea at the coastal<br />
towns of Gwano Bay and Herolds Bay, respectively. <strong>The</strong> Gwaing<br />
and Skaapkops are both urban rivers, running through George and<br />
11 Alternatively, there may be an increase in rainfall in the eastern end of the <strong>Western</strong> Province, most strongly associated with mountainous areas (Eden SoER,<br />
2007 and Midgley et al., 2005).<br />
15
Pacaltsdorp, respectively. <strong>The</strong> Kaaimans River enters the sea just<br />
west of Wilderness. In physical terms it is still in good condition and<br />
is home to important fish species, although infestations of invasive<br />
alien plants in adjacent areas need to be cleared. <strong>The</strong> Touw River<br />
originates in the Outeniqua mountains where it is well protected.<br />
It flows into the Wilderness Estuary and as a key catchment for this<br />
system, should be protected. Flowing into the Swartvlei are the Diep<br />
and Wolwe Rivers, which should be safeguarded as they play a key<br />
role in the hydrology of this water body.<br />
Rivers in the Knysna Municipality include the Höekraal, Karatara,<br />
Goukamma, Homtini and Knysna. <strong>The</strong> Höekraal and Karatara Rivers<br />
drain into the Swartvlei Lake, an important wetland. <strong>The</strong>se two rivers<br />
are critical to maintaining the ecological functioning of this system.<br />
<strong>The</strong> lower reaches of the Goukamma flow through the Goukamma<br />
Nature Reserve, entering the sea to the west of Buffelsbaai, while<br />
the Knysna River enters the Knysna Estuary. <strong>The</strong> upper reaches of<br />
the Goukamma and Homtini are relatively healthy, and those of<br />
the Knysna River have extensive beds of the endemic reed Palmiet<br />
(Prionium serratum) as well as important invertebrates (insects, etc).<br />
<strong>The</strong> Brackenhill River, a tributary of the Noetsie River, is important as a<br />
habitat for the <strong>Cape</strong> Gallaxius (Galaxia zebratus), a key fish species.<br />
In the Bitou Municipality, the Bitou and Keurbooms Rivers join the<br />
Keurbooms Estuary east of Plettenberg Bay, the Salt River reaches<br />
the sea near Nature’s Valley and the Bloukrans flows through the<br />
Tsitsikamma National Park. <strong>The</strong> Salt River is home to freshwater<br />
invertebrate species which have not yet been given scientific names.<br />
<strong>The</strong> Upper Palmiet River, which flows into the Keurbooms River,<br />
is another vital system, as it contains the Endangered fish known<br />
as the Slender Redfin Minnow (Pseudobarbas tenuis). It is the only<br />
locality where this fish does not co-occur with alien fish species. <strong>The</strong><br />
Groot River, entering the ocean at Nature’s Valley, is also a key river<br />
because, in physical terms, it is relatively pristine and is home to two<br />
Near Threatened and endemic fish species, namely the Eastern <strong>Cape</strong><br />
Redfin (Pseudobarbas afer) and the <strong>Cape</strong> Kurper (Sandelia capensis).<br />
<strong>The</strong> Bos River, which runs in an east-west direction across the<br />
municipality, supports all three fish species.<br />
Rivers in the <strong>Garden</strong> <strong>Route</strong> are included in the Breede and Gouritz<br />
Water Management Area (WMA g ). See Figure 2.2 above.<br />
Rivers are protected by various pieces of legislation, such<br />
as:<br />
• <strong>The</strong> NWA lists certain rivers, protecting them from<br />
ad hoc abstraction and other activities which require<br />
that a potential user acquires a license from DWEA<br />
(General Authorisations in terms of Section 39 of the<br />
NWA). Further to the Act, reserve determination studies<br />
must be undertaken to identify the ecological reserve 12<br />
requirements of a river.<br />
• Certain Listed Activities in terms of the NEMA protects all<br />
rivers.<br />
Riverine ecosystem services – What our rivers do for us<br />
Rivers are central to human welfare and economic development.<br />
<strong>The</strong>y provide water for agricultural, industrial and domestic use, flood<br />
attenuation and regulation; food and medicinal plants; transport<br />
and/or purification of biodegradable wastes; tourism, recreational<br />
and cultural use and enhanced property values.<br />
For the RIVERS, see the <strong>Garden</strong> <strong>Route</strong> CBA Mapbook.<br />
2.4.3 CATCHMENTS<br />
A catchment is the area (a geographical region) where water from<br />
rain (or snow) becomes concentrated and drains downhill into a river<br />
or lake. <strong>The</strong> term includes all land surface, streams, rivers, and lakes<br />
between the source and where the water enters the ocean. It follows,<br />
therefore, for the management of an aquatic ecosystem, the entire<br />
catchment must be managed as the management unit. Catchments<br />
may include entire mountain ranges of major river systems and are<br />
essential for maintaining key hydrological (river) processes, involving<br />
both surface and ground water.<br />
<strong>The</strong> extent and condition of natural vegetation in a catchment,<br />
especially wetlands, has a direct impact on the health of a river.<br />
Activities in the higher catchments and also in the upper river<br />
reaches (e.g. water abstraction, agriculture, plantation forestry and<br />
alien vegetation) negatively affect areas lower in the catchments, as<br />
well as those areas downstream. Where catchments have lost natural<br />
plant cover and where rivers have been straightened or cut off from<br />
adjacent wetlands, the impacts are far-reaching. Flood flows are<br />
intensified, the natural ability of the floodplain to absorb flood water<br />
is reduced, erosion is increased and downstream areas experience<br />
increased sedimentation. This emphasises the importance of sound<br />
management of river catchments in ensuring water flows. A good<br />
cover of intact pristine fynbos on high mountain slopes which<br />
receive the highest rainfall will ensure the delivery of reliable water<br />
supplies.<br />
<strong>The</strong> safeguarding of aquatic ecosystems depends on co-operation<br />
and collaboration at the local level between landowners and those<br />
agencies whose decisions and actions impact directly on these<br />
ecosystems, including SANParks, <strong>Cape</strong>Nature, the Agricultural<br />
and Forestry Departments of DAFF, Department of Water and<br />
Environmental Affairs, and Catchment Management Agencies.<br />
<strong>The</strong> rivers of the George, Knysna and Bitou Municipalities rise in the<br />
Outeniqua Mountains, a steeply rising mountain range lying inland<br />
of the relatively narrow coastal plain. About 100 km in length, the<br />
range lies roughly parallel to the coast, located in line with Mossel<br />
Bay and ending at the Keurbooms River Valley, at Plettenberg Bay. All<br />
the catchments within the <strong>Garden</strong> <strong>Route</strong> fall within the Breede and<br />
Gouritz River Water Management Area (WMA). See Figure 2.2 above.<br />
12 <strong>The</strong> Reserve consists of 2 parts, namely the basic human needs reserve and the ecological reserve. <strong>The</strong> ecological reserve refers to that portion of<br />
streamflow which must remain in rivers to ensure the sustainable healthy functioning of aquatic ecosystems (i.e. the river and its associated wetlands<br />
and estuaries). Implementation to ensure the reserve will have a significant impact on the potential yields of existing and future water schemes. Current<br />
provisional assessments indicate, as a national average, about 20% of the total river flow is required as an ecological reserve to maintain a healthy<br />
biophysical environment (PSDF, 2005). However, preliminary estimates for systems in the <strong>Garden</strong> <strong>Route</strong> region are somewhat higher. DWEA (Water Affairs)<br />
must determine the Reserve for all rivers in South Africa, according to the NWA.
Key Catchments of the <strong>Garden</strong> <strong>Route</strong> region<br />
This section describes river catchments that deliver water supplies,<br />
which place pressure on aquatic ecosystems, as well as those that<br />
are of significant importance for biodiversity.<br />
All towns and settlements in the George Municipality, including<br />
George, Herolds Bay and Wilderness, are supplied by the <strong>Garden</strong><br />
<strong>Route</strong> Dam on the Swart River; and a weir on the Touw River.<br />
<strong>The</strong> George Dam is also on the Swart River. In the George region,<br />
croplands are irrigated by numerous farm dams (DWAF, 2007).<br />
Some of the key catchments that have biodiversity importance<br />
include the Kaaimans, Touw and the Diep and Wolwe River<br />
catchments, as they flow into key estuary systems, namely the<br />
Kaaimans Lagoon, Wilderness Lakes and Swartvlei.<br />
<strong>The</strong>re are currently five water supply schemes in the Knysna<br />
municipal area that supply Knysna, Brenton-on-Sea, Belvedere,<br />
Buffels Bay, Sedgefield, Karatara and Rheenendale. <strong>The</strong> raw water<br />
sources are weirs on the Knysna and Gouna Rivers, the Glebe Dam,<br />
the Akkerkloof off-channel storage Dam, the Bigai Springs and the<br />
Belvedere Boreholes. <strong>The</strong> water supply to Sedgefield is drawn from<br />
a run-of-river off-take, located immediately upstream of the town<br />
on the Karatara River, while Rheenendal is supplied by a scheme<br />
on the Homtini River, a tributary of the Goukamma River. Buffels<br />
Bay draws from an offtake about 13 km inland from the mouth of<br />
the Goukamma River and Karatara is supplied from the Karatara<br />
River. Farm dams are scattered in the western and central parts of<br />
the municipality, but are not as numerous as those in the George<br />
Municipality (DWAF, 2007). <strong>The</strong>re is a proposal to upgrade the water<br />
supply to Sedgefield by abstracting water from the Hoekraal River,<br />
whereas desalinization is occurring at the beach by pumping water<br />
from the sea.<br />
Key catchments of biodiversity importance include, for example<br />
the Knysna catchment (including Gouna) that has a diversity of<br />
habitats (big pools, vleis etc), which is very rare. <strong>The</strong> Goukamma/<br />
Homtini upper catchment is in a fairly healthy condition, having<br />
some pristine forest gorges and few impacts on its headwaters.<br />
<strong>The</strong> water supply of the Bitou Municipality is derived from the<br />
Keurbooms and Piesangs River. Supplementary groundwater<br />
resources at Kranshoek along the coast and Kwanokuthula along<br />
the N2 are available when required. <strong>The</strong> ecological condition of the<br />
Keurbooms River (and Bitou where it feeds into the lower reaches<br />
of the Keurbooms) has been negatively impacted by agricultural<br />
practices, urban development, alien plants and fish, as well as water<br />
abstraction.<br />
Key catchments of biodiversity importance include the Groot River<br />
catchment (including Nature’s Valley) as it is a relatively pristine and<br />
diverse system. It serves an important function, acting as a corridor<br />
for ecological processes. Another is the Salt River catchment, which<br />
is also reasonably pristine. <strong>The</strong> upper Keurbooms River catchment is<br />
particularly important as it feeds the rest of the Keurbooms system,<br />
which is home to the Endangered and endemic Knysna Seahorse<br />
(Hippocampus capensis).<br />
2.5 COASTAL AND MARINE ECOSYSTEMS<br />
17<br />
<strong>The</strong> coast of the <strong>Garden</strong> <strong>Route</strong> is characterised by a rocky shoreline<br />
interspersed with bays, sandy beaches, dunes, rivers, estuaries and<br />
lakes. It experiences strong wave action owing to its exposure to<br />
the south-westerly ocean swells. A relatively shallow bank extends<br />
almost 250 km out to sea, known as the Agulhas Bank. As part<br />
of the continental shelf, this bank is of key biological importance,<br />
influenced by warm water plumes from the Agulhas current, as<br />
well as cold, nutrient-rich ‘bottom’ water upwelling in places. As a<br />
consequence, sea temperatures and productivity on the Agulhas<br />
Bank are intermediate between those of the west and east coast<br />
marine systems. It is the centre of the South African fishing industry.<br />
<strong>The</strong> area supports a variety of marine mammals, seabirds, deep water<br />
and open ocean fish, as well as shellfish.<br />
Key coastal and marine habitats of the <strong>Garden</strong> <strong>Route</strong> region<br />
Well-located, Marine Protected Areas can play a substantial role<br />
in ensuring sustainable use of marine resources. <strong>The</strong>y serve in<br />
protecting habitats, breeding stocks and nursery grounds which in<br />
turn, assist in replenishing fish resources in adjacent, exploited areas.<br />
Key priority areas or special habitats for extension of the existing<br />
Marine Protected Areas (MPAs) are proposed to provide better<br />
protection of inter-tidal habitats, areas of high reef fish abundance,<br />
coastal dunes, and subtidal geology types.<br />
Key priority coastal and marine areas or special habitats that fall<br />
within the <strong>Garden</strong> <strong>Route</strong> domain (from west to east) include:<br />
1. <strong>The</strong> Kaaimans River Mouth, to the west of Wilderness (George<br />
Municipality).<br />
2. <strong>The</strong> area from Wilderness, just west of the Touws River mouth<br />
through to Platbank, just east of Sedgefield. This area includes<br />
the dune area of the Groenvlei-Swartvlei mouth, which<br />
could be incorporated with the westward extension of the<br />
Goukamma Nature Reserve, a formal Protected Area (spans<br />
both the George and Knysna municipal areas).<br />
3. <strong>The</strong> area extending from just east of Buffels Bay to Brenton-on-<br />
Sea (Knysna Municipality).<br />
4. A marine extension of the Knysna Heads (Knysna Municipality).<br />
5. <strong>The</strong> area from Noetsie to Toegroeiberg, east of Kranshoek<br />
(Knysna and Bitou Municipalities).<br />
6. <strong>The</strong> marine extension of the Piesangs River Mouth at<br />
Plettenberg Bay (Bitou Municipality).<br />
7. <strong>The</strong> marine extension of the mouth of the Keurbooms Estuary<br />
(Bitou Municipality).<br />
8. <strong>The</strong> area extending from east of Keurboomstrand to the<br />
western boundary of the Tsitsikamma National Park (Bitou<br />
Municipality).
Coastal and marine ecosystem services – what our coastal and<br />
marine ecosystems do for us<br />
<strong>The</strong>se ecosystems deliver a range of services, including sources<br />
of food, opportunities for fishing (subsistence, recreational and<br />
commercial); resources for the pharmaceutical and cosmetic<br />
industries (e.g. algae/seaweed), and for mining (sand and heavy<br />
minerals), as well as scenic beauty for the recreational and tourism<br />
industry.<br />
Human activities that currently impact on coastal and marine<br />
ecosystems in the <strong>Garden</strong> <strong>Route</strong><br />
<strong>The</strong>se include insensitive development or over-development of<br />
the coastline, over-exploitation of resources (e.g. recreational and<br />
commercial fishing), pollution (both non-point and point source),<br />
and sand mining. <strong>The</strong>se activities can result in the depletion of<br />
resources and destroy natural scenery which impacts on tourism.<br />
<strong>The</strong> Coastal and Marine Environment is protected by:<br />
• the Marine Living Resources Act,<br />
• the Outeniqua Sensitive Coastal Area Extension<br />
regulations,<br />
• the National Environmental Management Act; and<br />
• the Integrated Coastal Management Act.<br />
<strong>The</strong> three last-mentioned, list certain activities that are<br />
prohibited in the coastal zone and which require authorization.<br />
Coastal dunes help prevent the erosion of our beaches by supplying<br />
sand and; in so doing protect the coastal zone. Dunes naturally move<br />
but due to stabilization by coastal development and alien plants (e.g.<br />
rooikrans), the erosion or ‘disappearance’ of our beaches is taking<br />
place. Beach erosion threatens the stability of natural ecosystems<br />
and coastal development e.g. along St Francis Bay. With global<br />
warming and the ensuing rise in sea level, it is likely that beach<br />
erosion will intensify. This has significant financial repercussions as<br />
society attempts to protect coastal development against rising sea<br />
levels and storm damage.<br />
Coastal and marine resources<br />
within the CFR generated R1323 million p.a. in 2003<br />
<strong>The</strong> <strong>Garden</strong> <strong>Route</strong> Initiative, in collaboration with the World Wildlife Fund (WWF), has compiled an Integrated Management <strong>Plan</strong> for the<br />
<strong>Garden</strong> <strong>Route</strong> marine and coastal environment, extending from the Kaaimans River in the west to the Groot River at the eastern boundary<br />
of the Tsitsikamma National Park. <strong>The</strong> plan aims to ensure appropriate management and protection of the coastal and marine environment.
Hilton Herd<br />
2.6 SPECIAL HABITATS AND SPECIES OF SPECIAL CONCERN<br />
Special habitats include areas that are rare within the region, or which support important species, ecosystems or ecological processes. <strong>The</strong>y<br />
include those Listed Threatened Ecosystems in terms of the NEMBA. Species of Special Concern refers to red data species, some of which are<br />
listed within the NEMBA Threatened or Protected Species (TOPS); and known locations where these species occur.<br />
Special biodiversity features were identified via expert workshops and from data collected by the Custodians of Rare and Endangered Wildlife<br />
(CREW). Some of the Special habitats and key Species of Special Concern of the <strong>Garden</strong> <strong>Route</strong> region are presented in Table 2.1 and 2.2 below.<br />
Table 2.1: A selection of Special Habitats within the <strong>Garden</strong> <strong>Route</strong><br />
Priority Special<br />
Habitats<br />
Riverine Saltmarsh<br />
Ericaceous Fynbos<br />
Forests<br />
Aquatic dependent<br />
habitats<br />
Groenvlei-Swartvlei<br />
mouth dunes<br />
Kaaimans River<br />
Keurbooms River and<br />
Estuary<br />
Goukamma River<br />
Wilderness Lakes Area<br />
and Swartvlei<br />
Knysna <strong>Western</strong> Heads<br />
Description and location in the <strong>Garden</strong> <strong>Route</strong><br />
This is an important habitat for estuarine species living in the Knysna Estuary (Knysna Municipality), Keurbooms<br />
Estuary (Bitou Municipality) and the Groot River Estuary (Bitou Municipality).<br />
This habitat grows on the steep upper mountain slopes and serves an important water catchment function. It is<br />
the source of most perennial streams. It is found in all three municipalities.<br />
<strong>The</strong> forests are very rich in plant species and are highly conservation worthy. <strong>The</strong>y are protected by the National<br />
Forest Act occurring throughout all 3 municipalities.<br />
<strong>The</strong>se habitats depend on the presence of either fresh or brackish surface water, associated with aquatic<br />
ecosystems and occur within all 3 municipalities.<br />
This dune area includes the Groenvlei Dune Field, a rare and ancient dune field (parabolic) located east of the<br />
Swartvlei Estuary at Sedgefield (Knysna Municipality).<br />
<strong>The</strong> lower reaches of the Kaaimans support the Near Threatened and endemic fish Eastern <strong>Cape</strong> Redfin<br />
(Pseudobarbus afer), and is home to one of five populations classed as belonging to the group (lineage) of redfins<br />
associated with forest (George Municipality).<br />
This system supports several important fish species, e.g. Eastern <strong>Cape</strong> Redfin (Pseudobarbus afer). <strong>The</strong> river and<br />
estuary is also home to several red data bird species, for example the Blue Crane (Anthropooedes paradisea), and<br />
the Half Collared Kingfisher (Alcedo semitorquata) (Bitou Municipality).<br />
This large river system provides habitat for a population of Eastern <strong>Cape</strong> Redfin (Pseudobarbus afer), one of only<br />
four known populations; and <strong>Cape</strong> Kurper (Sandelia capensis), which belongs to a distinct group (or lineage)<br />
associated with forest (Bitou Municipality).<br />
<strong>The</strong>y are considered to be some of the most productive coastal lakes and estuaries in South Africa (George and<br />
Knysna Municipality).<br />
This area is home to several rare plant and butterfly species, and is home to an unusual vegetation type related<br />
to its unique geology (Knysna Municipality).<br />
Refer to Section 2.5 (pg 17) for priority Special habitats within the marine environment. Numerous Special habitats have been identified for<br />
specific Species of Special Concern (plant, animal, bird, fish, etc.) of which a few have been tabled below.<br />
19
Table 2.2: A selection of key Species of Special Concern within the <strong>Garden</strong> <strong>Route</strong> region<br />
Species name Red data book status, habitat description and location in the <strong>Garden</strong> <strong>Route</strong><br />
<strong>Plan</strong>ts Of the many red data species, the following are Critically Endangered<br />
Disa newdigateae<br />
Disa procera<br />
Gladiolus fourcadei<br />
Pentaschistis barbata<br />
orientalis<br />
Protea cynaroides (small<br />
leaved variant)<br />
A Critically Endangered orchid which is thought to be endemic to Knysna Enon Fynbos in the Knysna<br />
municipal area only (even though this vegetation type also extends into the Bitou Municipality).<br />
A Critically Endangered orchid which is locally endemic to Hoogekraal Sandplain Fynbos in the Knysna<br />
municipal area only (even though this vegetation type extends into all three municipalities).<br />
A Critically Endangered plant located in Renosterveld (transitional Fynbos), extending from George to<br />
Humansdorp.<br />
A Critically Endangered grass species which is locally endemic to Hoogekraal Sandplain Fynbos in the<br />
Knysna municipal area only (even though this vegetation type extends into all three municipalities).<br />
A Critically Endangered protea variant that is extremely rare and which occurs in both Hoogekraal<br />
Sandplain Fynbos (located in all three municipalities) and Roodefontein Grassy Fynbos (located in the Bitou<br />
Municipality), although the plant’s range extends from George to Port Elizabeth.<br />
Animals <strong>The</strong> following animals are found in various Special Habitats across the different municipalities<br />
Blue duiker (Philantombo<br />
monticola)<br />
Grysbok (Raphicerus<br />
melanotis)<br />
Honey badger or Ratel<br />
(Mellivora capensis)<br />
Leopard (Panthera pardus)<br />
Birds<br />
African Marsh Harrier (Circus<br />
ranivorus)<br />
Blue Crane (Anthropooedes<br />
paradisea)<br />
Lesser Kestrel (Falco<br />
naumanni)<br />
Martial Eagle (Polematus<br />
bellicosus)<br />
Peregrine Falcon (Falco<br />
peregrinus)<br />
Amphibians<br />
Knysna Spiny Reed Frog<br />
(Afrixalus knysnae)<br />
Reptiles<br />
Blue-spotted Girdled Lizard<br />
(Cordylus coeruleopunctatus)<br />
Knysna Dwarf Chameleon<br />
(Bradypodion damaranum)<br />
Occurs in dense coastal bush, thicket and forest habitats. Its status is Vulnerable.<br />
This buck lives in thick scrub and bush, including fynbos, and is often found in close proximity to coastal<br />
towns. It is Endangered and endemic to South Africa. <strong>The</strong> Grysbok can be subject to local extinctions as<br />
habitat is destroyed.<br />
This animal is Near Threatened and protected in terms of the NEMBA. It is uncommon throughout its range,<br />
which includes a variety of habitats but excludes forest and moist mountain areas.<br />
A large, wild cat that is tolerant of a wide range of habitats, usually with forest or broken rocky country. Its<br />
status is Vulnerable.<br />
An indigenous species of high conservation value, it is protected by the NEMBA in terms of the Protected<br />
Species List. It inhabits marshland, flooded grassland and adjacent areas.<br />
South Africa’s national bird favours grasslands and other upland habitats. <strong>The</strong>y will nest where shallow<br />
wetlands are available. Its status is Endangered.<br />
Usually a colonial breeder, this kestrel is found in the vicinity of towns. It forages in grasslands, steppe-like<br />
habitats and non-intensive cultivated areas. Its status is Vulnerable.<br />
<strong>The</strong> largest eagle in Africa prefers uninhabited stretches of thicket and open plains. Its status is Vulnerable.<br />
It lives mostly along mountain ranges, coastlines and river valleys. Its status is Vulnerable.<br />
An Endangered and endemic frog species that occurs in shallow wetlands densely<br />
vegetated, with foliage (leaves) above the water level.<br />
This lizard is endemic to the <strong>Garden</strong> <strong>Route</strong>, and is located<br />
in the George and Bitou municipalities.<br />
<strong>The</strong> endemic Knysna Dwarf Chameleon is a forest reptile that occurs<br />
in the wet, coastal temperate forests of the <strong>Garden</strong> <strong>Route</strong>.
Species name Red data book status, habitat description and location in the <strong>Garden</strong> <strong>Route</strong><br />
Insects - Butterflies<br />
Brenton Blue (Orachrysops<br />
niobe)<br />
Brenton Copper (Aloeides<br />
thyra orientis)<br />
Brenton Opal (Chrysoritis<br />
thysbe mithras)<br />
Knysna Skolly (<strong>The</strong>stor<br />
brachycerus)<br />
Fish<br />
<strong>Cape</strong> Gallaxius (Galaxias<br />
zebratus)<br />
<strong>Cape</strong> Kurper (Sandelia<br />
capensis)<br />
Eastern <strong>Cape</strong> Redfin<br />
(Pseudobarbus afer)<br />
Knysna Seahorse<br />
(Hippocampus capensi)<br />
Slender Redfin (Pseudobarbus<br />
tenui)<br />
Disa procera<br />
A Critically Endangered butterfly found only at Brenton-on-Sea (Knysna) within the Brenton Blue Butterfly<br />
Reserve.<br />
<strong>The</strong> Brenton Copper is a red listed butterfly which is found only on the Brenton peninsula, Knysna. Its status<br />
is Vulnerable.<br />
<strong>The</strong> Brenton Opal Butterfly is found only on the Brenton peninsular (Knysna) and is red listed as Endangered.<br />
A Critically Endangered butterfly confined to the Eastern Knysna Heads.<br />
This fish is Near Threatened and endemic to South Africa, occurring in a few George and Knysna municipal<br />
rivers.<br />
Near Threatened and endemic to South Africa, this fish occurs in several rivers from George to the Bitou<br />
Municipality.<br />
This forest fish species is found in a number of rivers in the <strong>Garden</strong> <strong>Route</strong>. Its status is Near Threatened and it<br />
is endemic to South Africa.<br />
This seahorse has been recorded from the Knysna, Swartvlei, and Keurbooms Estuaries. Its status is<br />
Endangered.<br />
An Endangered fish, endemic to South Africa, which is located in few rivers, largely within the Bitou<br />
Municipality.<br />
Leopard<br />
Seahorse<br />
Tinneke Kraaij<br />
All the Species of Special Concern contribute to the biodiversity<br />
of the <strong>Garden</strong> <strong>Route</strong> and should be targeted for conservation. <strong>The</strong> most efficient manner in<br />
which to conserve a species is it to ensure that its habitat is protected.<br />
Martial Eagle<br />
Lucas Galuzi<br />
Frank Lane<br />
Grysbok<br />
21<br />
Peet Joubert<br />
Nigel Dennis
2.7 ECOLOGICAL PROCESS AREAS 14<br />
As described earlier in Section 1.2 (pg 2), biodiversity<br />
encompasses not only all living things, but also the series of actions<br />
and interactions that sustain them, termed ecological processes g<br />
(e.g. pollination, seed dispersal, nutrient cycling, fire in fynbos<br />
ecosystems). <strong>The</strong> physical “spaces” where these actions and<br />
interactions take place are known as ecological process areas.<br />
In the case of evolutionary processes, these seem far removed<br />
from our everyday lives. We perhaps forget that new species are<br />
evolving all the time. With impending climate change, it is even<br />
more important that those areas where species generate are<br />
safeguarded. For example, in areas where different soil types meet,<br />
this juxtaposition enables certain plant species to become adapted<br />
to different soils, and new plant species are able to generate.<br />
<strong>The</strong>se processes are not obvious to everybody, but scientists are able<br />
to identify and locate critical examples which are often associated<br />
with landscape features. Amongst the largest ecological process<br />
areas are landscape corridors comprising large tracts of natural<br />
habitat, such as major river systems or mountain ranges. <strong>The</strong>y serve<br />
as landscape-scale “highways”, allowing plant and animal species to<br />
migrate along them in response to any changes in climate. <strong>The</strong>se<br />
highways run along river courses from the high inland mountains,<br />
across the lower coastal plain and to the coast, or else along<br />
mountain ranges and the coastal area in an east-west gradient.<br />
Smaller ecological process areas include, for example the natural<br />
buffer area of an isolated wetland.<br />
A landscape corridor may cover a variety of habitats such as pristine<br />
fynbos vegetation, or disturbed and/or degraded habitats or special<br />
habitats or even the alternate narrow strips of natural vegetation<br />
14 See also <strong>Cape</strong>Nature Fact Sheet: Biodiversity in an agricultural landscape.<br />
growing between cultivated crops such as honeybush (tea). If<br />
such degraded, disturbed or agricultural lands are identified as<br />
components of a landscape corridor, no further hardening of the<br />
surface should be allowed as this poses threats to the functioning of<br />
the corridor.<br />
<strong>The</strong> objective of sustainability is to ensure the persistence of critical<br />
ecological processes along a number of gradients and for these to<br />
interlink where possible. For example, a river corridor following the<br />
gradient from inland mountains to the sea serves to link areas of<br />
different soil types, as well as coastal corridors spanning an east-west<br />
gradient. Such a network of corridors provides the best design in<br />
enabling biodiversity migrations.<br />
<strong>The</strong>se landscape corridors, which often extend beyond local<br />
municipal and provincial boundaries, also serve to protect the<br />
source of rivers to ensure water yield from mountain catchments<br />
and support rare or threatened species. <strong>The</strong>y deliver invaluable<br />
ecosystem services that are too costly or impossible to produce<br />
artificially, functioning at scales impossible for humans to replicate.<br />
In the face of escalating water needs and global climate change, it<br />
is vital that landscape corridors are safeguarded against the loss of<br />
intact habitat and that the natural landscape is not fragmented into<br />
disconnected portions.<br />
Key Landscape Corridors in the <strong>Garden</strong> <strong>Route</strong> region<br />
Landscape corridors in the <strong>Garden</strong> <strong>Route</strong> are interlinked with<br />
formal Protected Areas that are managed by SANParks, <strong>Cape</strong>Nature,<br />
or the Department of Forestry, many of which are located in the<br />
mountainous areas. <strong>The</strong>se key landscapes corridors are either CBA or<br />
ESA (see Figure 2.3 below).<br />
<strong>The</strong> Wilderness National Park situated in the George<br />
Municipality. Photo: Andrew Brown
Figure 2.3: Key landscape corridors (ecological process areas) in the George, Knysna and Bitou municipalities that are designated as Critical<br />
Biodiversity Areas or Ecological Support Areas.<br />
a. Coastal corridor<br />
<strong>The</strong> <strong>Garden</strong> <strong>Route</strong>’s coastal corridor is a band (a minimum of 1 km<br />
wide outside of urban areas) which broadly accommodates the<br />
coastal zone and dynamic/mobile ecosystems, as well as intact<br />
coastal vegetation where it occurs. It incorporates shifting sand<br />
dunes, river mouths, estuaries, lagoons and is important in enabling<br />
the persistence of ecological and evolutionary processes. It was<br />
identified in the <strong>Western</strong> <strong>Cape</strong> Spatial Development Framework<br />
(2005) and spans municipal boundaries.<br />
b. River corridors<br />
Rivers and their associated riparian or riverbank habitats provide<br />
the core for many large-scale (landscape level) ecological corridors,<br />
linking the coastline to inland mountains, as well as upland to<br />
lowland habitats. <strong>The</strong> river corridors are along the major perennial<br />
rivers in the <strong>Garden</strong> <strong>Route</strong>, as represented in Figure 2.3 below.<br />
c. Upland-lowland Corridor<br />
An upland-lowland corridor links upland and lowland habitats<br />
outside of the river corridors. Only one such corridor occurs within<br />
the <strong>Garden</strong> <strong>Route</strong> and it is located near the border of the Knysna<br />
and Bitou municipalities, running from Noetsie River to Harkeville,<br />
just east of Kranshoek. It encompasses numerous small perennial<br />
and non-perennial rivers and streams, a formal protected area and<br />
forestry plantations, while linking the coastal area to the Outeniqua<br />
Mountain Range.<br />
Ecosystem services – what our Landscape Corridors do for us<br />
Ecological or landscape corridors provide valuable ecosystem<br />
services that are often impossible or very costly to replicate or offset.<br />
<strong>The</strong>y support the long-term persistence of plant and animal species<br />
and their ecological processes (e.g. fire, pollination, seed dispersal)<br />
and enable migration of species which is of increasing importance<br />
with the threat of global climate change.<br />
Landscape corridors, including mountain catchments, absorb rainfall<br />
over immense areas, and act as vast sponges storing the water and<br />
then releasing it slowly through the dry season. In this way, corridors<br />
serve to protect the source of rivers and ensure water yield from<br />
23<br />
mountain catchments. <strong>The</strong> quality and quantity of water supplies<br />
are maintained, providing for human consumption and ensuring the<br />
survival of downstream estuaries, wetlands (vleis) and streams, which<br />
in turn deliver other ecosystem services.<br />
Corridors contribute to the protection and preservation of Critical<br />
Biodiversity Areas, or support rare or threatened species. <strong>The</strong>ir scenic<br />
value contributes significantly towards tourism and recreation, and<br />
provides a region’s ‘sense of place’.<br />
Developing within frontal dune systems or within close proximity to<br />
the high water mark of the sea can have significant negative impacts<br />
for society. Sand bank erosion is a major problem requiring costly<br />
measures to prevent property damage. This is especially important<br />
given the predicted sea level rise as climate change takes effect.<br />
To locate the landscape corridors, see the <strong>Garden</strong> <strong>Route</strong> CBA<br />
Mapbook, wall map and GIS maps.<br />
2.8 PROTECTED AREAS AND CONSERVATION<br />
AREAS<br />
Protected Areas are the core areas in the network of ecological areas<br />
and are vital in supporting ecological sustainability and enhancing<br />
resilience to climate change. Protected Areas within the <strong>Garden</strong><br />
<strong>Route</strong> can be divided into two main categories, namely protected<br />
areas and conservation areas.<br />
Protected Areas are areas of land or sea that are formally protected<br />
by law and managed mainly for biodiversity conservation. Protected<br />
Areas which are recognised in the National Environmental<br />
Management: Protected Areas Act (Act 57 of 2003) (NEMPAA)<br />
are considered formal Protected Areas in the National Protected<br />
Areas Expansion Strategy. <strong>The</strong> Protected Areas Act distinguishes<br />
between several categories of Protected Areas, namely Special<br />
Nature Reserves, National Parks, Nature Reserves, and Protected<br />
Environments. It also recognises World Heritage Sites declared in<br />
terms of the World Heritage Convention Act 49 of 1999; marine<br />
protected areas (MPAs) in terms of the Marine Living Resources<br />
Act (18 of 1998) and/or the NEMPAA; specially protected Forest<br />
Areas declared in terms of the National Forests Act 84 of 1998; and
Table 2.3: Coverage (hectares and percentage) of Protected Areas in the George, Knysna and Bitou Local Municipalities (LM).<br />
MUNICIPALITY <br />
CATEGORY <br />
Protected Areas<br />
Total ha<br />
Approximate size of municipality in<br />
ha<br />
Total Protected Areas<br />
(% of municipality)<br />
Mountain Catchment Areas declared in terms of the Mountain<br />
Catchment Areas Act 63 of 1970. Note that these can include<br />
privately-owned areas if they have been formally declared as<br />
National Parks, Nature Reserves or Protected Environments under<br />
NEMPAA. Formal Protected Areas allow for long term security of<br />
tenure and are gazetted in terms of the NEMPAA.<br />
Formal Protected Areas that occur within the <strong>Garden</strong> <strong>Route</strong> include<br />
National Parks (managed by the national conservation agency,<br />
SANParks); Provincial Nature Reserves (managed by the provincial<br />
It is important to note that the existing Protected Areas and<br />
Conservation Aeas do not protect or conserve examples of all<br />
the different ecosystem types which occur in the <strong>Garden</strong> <strong>Route</strong><br />
i.e. not all types are represented. However, the network of CBA<br />
and ESA presented on the CBA Map (pg 28) does include<br />
a representative sample of all ecosystem types. <strong>The</strong>y should<br />
be proactively targeted for formal protection or management<br />
via other mechanisms e.g. conservation areas, zoning. Once<br />
verified on the ground, these biodiversity priority areas need<br />
to be coupled to an implementation strategy developed in<br />
collaboration with the key stakeholders (e.g. municipalities,<br />
conservation agencies, DWEA etc) in the area. Stakeholders<br />
should also be urged to develop a catchment planning<br />
approach for their implementation strategy. See section 5.3.1.7<br />
and 5.3.1.8 (pg 51).<br />
conservation agency, <strong>Cape</strong>Nature); Forest Nature Reserves<br />
(managed by the Department of Forestry) and Local Authority<br />
Nature Reserves (managed by a municipality). Those situated along<br />
the coast and within the marine waters include the Goukamma<br />
and Robberg MPAs in the <strong>Western</strong> <strong>Cape</strong>, whilst the Tsitsikamma<br />
MPA overlaps both the <strong>Western</strong> and Eastern <strong>Cape</strong>. SANParks intends<br />
proclaiming the <strong>Garden</strong> <strong>Route</strong> domain as a World Heritage Site in<br />
terms of the World Heritage Convention Act.<br />
Conservation Areas are those areas of land not formally protected<br />
by law, but informally protected by the current owners and<br />
users, and managed at least partly for biodiversity conservation.<br />
Conservation Areas are therefore not considered as formal Protected<br />
Areas as they are not gazetted in terms of the NEMPAA and do<br />
not allow for long-term security of tenure. <strong>The</strong>y could include<br />
areas covered by Biodiversity Agreements in terms of the National<br />
GEORGE MUNICIPALITY KNYSNA MUNICIPALITY BITOU MUNICIPALITY<br />
24 630.4 31 999.2 49 779.7<br />
10 6873.3 10 5931.7 99 104.2<br />
22.8% 29.5% 50.0%<br />
Environmental Management: Biodiversity Act (10 of 2004), nondeclared<br />
Private Nature Reserves and conservancies. <strong>The</strong> last<br />
mentioned are agreements for co-operation among neighbouring<br />
landowners, and require no legal long-term commitment from the<br />
landowners.<br />
Refer to Table 2.3 above for the sizes (in hectares) of Protected Areas<br />
located in the <strong>Garden</strong> <strong>Route</strong> municipalities.<br />
For the PROTECTED AREAS MAP, both FORMAL Protected Areas,<br />
and MARINE Protected Areas, see the <strong>Garden</strong> <strong>Route</strong> CBA Mapbook,<br />
CBA wall map and GIS maps.<br />
2.9 LAND COVER IN THE GARDEN ROUTE:<br />
LEVELS OF TRANSFORMATION AND<br />
DEGRADATION<br />
In this document, the term land cover describes the level of change<br />
or transformation of natural ecosystems, which can range from<br />
natural land, to degraded and overgrazed areas, to areas which<br />
have been irreversibly transformed (e.g. urban development). Thus,<br />
land cover has implications for the maintenance and persistence of<br />
biodiversity.<br />
<strong>The</strong>se measures of land cover, together with the national biodiversity<br />
thresholds g , were used by biodiversity (conservation) planners to<br />
identify the categories on the CBA Map, namely CBA, ESA, Other<br />
Natural Areas and No Natural Areas Remaining (NNAR). For example,<br />
Critical Biodiversity Areas were identified based on the extent of an<br />
existing ecosystem (e.g. a particular vegetation type) relative to its<br />
original extent, prior to modern human activities. NNAR on the other<br />
hand, are transformed areas e.g. agriculture, urban development.<br />
Land cover areas for the <strong>Garden</strong> <strong>Route</strong> were mapped at a scale of<br />
1:10 000, and infestations of invasive alien plants was mapped at 1:15<br />
000. Refer to Figure 2.4 and Table 2.4 for broad land cover categories<br />
in the <strong>Garden</strong> <strong>Route</strong>.
Table 2.4: Summarized land cover categories for the <strong>Garden</strong> <strong>Route</strong> (Refer to Appendix A for further biodiversity statistics) showing levels of<br />
transformation and degradation<br />
Land cover category<br />
George Knysna Bitou<br />
ha % ha % ha %<br />
1) Natural 36051.0 33.7 48063.4 45.4 64191.7 64.8<br />
2) Degraded g (e.g. alien infestation, overgrazed) 25506.5 23.9 16289.4 15.4 16237.0 16.4<br />
3) Transformed g 52904.2 49.5 44293.9 41.8 22139.2 22.3<br />
• intensive agriculture 24507.1 22.9 8236.9 7.8 8060.3 8.1<br />
• plantations 15129.2 14.2 30176.3 28.5 8695.1 8.8<br />
• urban and infrastructure (includes dams) 5631.1 5.3 3140.9 3.0 1850.1 1.9<br />
(Note: <strong>The</strong> transformed category includes heavy alien transformation as these areas are not required for meeting national biodiversity<br />
thresholds).<br />
<strong>The</strong> dominant land or water use activities in the <strong>Garden</strong> <strong>Route</strong> that cause transformation (damage/destruction) or degradation (deterioration)<br />
of the natural environment are listed below:<br />
Terrestrial ecosystems (on land) Aquatic ecosystems (associated with water)<br />
urbanization water abstraction and modification of water flow (e.g. dams, hard surfaces)<br />
intensive agriculture (cultivation and dairy farming)<br />
development within the 1 in 20 year floodline (e.g. housing, sand-mining,<br />
cultivation)<br />
plantation forestry development and infilling (particularly in urban areas or expanding urban areas)<br />
sand mining cultivation of wetland areas<br />
groundwater abstraction groundwater abstraction<br />
invasion by alien plant species invasion by alien plant species<br />
inappropriate fire management invasion by alien fish species<br />
over-harvesting waste water discharge or effluent of poor quality<br />
over-grazing eutrophication as a result of fertilizer runoff from cultivated lands<br />
species loss through climate change (caused by air<br />
pollution)<br />
artificial breaching of estuary mouths<br />
•species loss through climate change (caused by air pollution)<br />
Figure 2.4: Broad land cover within the <strong>Garden</strong> <strong>Route</strong><br />
For the A3 LAND COVER MAP, see the <strong>Garden</strong> <strong>Route</strong> CBA Mapbook; and GIS maps.<br />
25
All human life is entirely dependent on the natural<br />
resources and services delivered by ecosystems.<br />
<strong>The</strong>se are not infinite, meaning that there are<br />
ecological limits to development.
<strong>The</strong> Critical Biodiversity Areas Map<br />
3<br />
3.1 WHAT IS A CRITICAL BIODIVERSITY AREAS (CBA) MAP?<br />
A CBA Map is a fine-scale systematic biodiversity plan g that delineates on a map Critical Biodiversity Areas<br />
and Ecological Support Areas. <strong>The</strong>se areas require safeguarding to ensure the continued existence of<br />
biodiversity, its ecological processes (e.g. animal migration, fire, pollination) and its ecosystem services e.g.<br />
water supply. <strong>The</strong> map also delineates formal Protected Areas, Other Natural Areas and No Natural Areas<br />
Remaining (See Section 3.2 below). <strong>The</strong> CBA Map is the central component of the Biodiversity <strong>Sector</strong> <strong>Plan</strong>.<br />
<strong>The</strong> broad objective of the CBA Map is to ensure appropriate land-use and planning for the best possible<br />
long-term benefits, to prevent cumulative impacts and to promote integrated management of natural<br />
resources.<br />
<strong>The</strong> CBA Map aims to guide sustainable development by providing a synthesis of biodiversity information<br />
to decision makers. It serves as the common reference for all multi-sectoral planning procedures g , advising<br />
which areas can be lost to development, and which areas of critical biodiversity value; and their supporting<br />
zones should be protected against impacts.<br />
3.2 HOW WAS THE CRITICAL BIODIVERSITY AREAS (CBA) MAP<br />
PRODUCED?<br />
Production of the CBA Map involved assessing the condition of the region’s biodiversity, and the<br />
development of a long-term strategy to safeguard biodiversity i.e. by guiding development away<br />
from those areas where biodiversity is endangered to the point of extinction, encouraging the wise<br />
use of natural resources, and promoting sustainable land-use.<br />
<strong>The</strong> <strong>Garden</strong> <strong>Route</strong> Critical Biodiversity Areas Map was produced through a systematic biodiversity<br />
planning process conducted at a fine-scale 15 (1:10 000) 16 . This methodology is compatible with the<br />
guidelines for publishing bioregional plans in terms of Chapter 3 of the NEMBA 17 . See Section 3.5 (pg<br />
28) for the areas covered by the CBA Map.<br />
Systematic biodiversity (conservation) planning g identifies those areas which are most in need of<br />
conservation (i.e. safeguarding) in order to meet national biodiversity thresholds g . <strong>The</strong> aim of this<br />
planning approach is to assist land-use management in ensuring sustainable development, which is<br />
especially important in the face of climate change. It is a scientifically defensible plan that prioritises<br />
actions by setting quantitative thresholds for biodiversity features (e.g. vegetation types). It aims<br />
to identify for safeguarding a representative sample of biodiversity pattern g, including species and<br />
habitats, as well as areas for ecological and evolutionary processes g that maintain biodiversity.<br />
<strong>The</strong> network of areas on the CBA Map is designed to be spatially efficient (i.e. to meet biodiversity<br />
thresholds g on the least amount of land possible) and aims to avoid conflict with other land-uses,<br />
where feasible. Refer to the technical report (Holness, et al., 2010) for further detail.<br />
3.3 DEFINITIONS OF THE CATEGORIES ON THE CRITICAL BIODIVERSITY<br />
AREAS MAP<br />
Protected Areas (PAs)<br />
<strong>The</strong>se are terrestrial, aquatic (water) and/or marine areas that are formally protected in terms of the<br />
National Environment Management: Protected Areas Act (57 of 2003) and/or Marine Living Resources Act<br />
(107 of 1998).<br />
Critical Biodiversity Areas (CBA)<br />
<strong>The</strong> CBA Map indicates areas of land as well as aquatic (water) features which must to be safeguarded in<br />
their natural to near-natural state if biodiversity is to persist and ecosystems are to continue functioning.<br />
Land in this category is referred to as a Critical Biodiversity Area. CBA incorporate: (i) areas that need to be<br />
safeguarded in order to meet national biodiversity thresholds g ;(ii) areas required to ensure the continued<br />
15 Fine-scale biodiversity plans are more accurate maps prepared at a scale of 1:3 000 – 1:50 000.<br />
16 <strong>The</strong> technical term for the CBA Map is the <strong>Garden</strong> <strong>Route</strong> Fine-Scale Systematic Biodiversity <strong>Plan</strong> (Holness, 2010).<br />
17 Refer ‘Guideline regarding the Determination of Bioregions and the Preparation and Publication of Bioregional <strong>Plan</strong>s<br />
Government Gazette No 32006 (No. # 291) March, 2009. See glossary for further explanation of a Bioregional <strong>Plan</strong>.<br />
27
existence and functioning of species g and ecosystems g , including the<br />
delivery of ecosystem services g ; and/or (iii) important locations for<br />
biodiversity features or rare species.<br />
Ecological Support Areas (ESA)<br />
Ecological Support Areas (ESA) are supporting zones required to<br />
prevent the degradation of Critical Biodiversity Areas and Protected<br />
Areas. An ESA may be an ecological process area that connects<br />
and therefore sustains Critical Biodiversity Areas or a terrestrial<br />
feature. Although many ESA consist of natural veld, there are areas<br />
of land (partially or wholly transformed or degraded) that have<br />
been classified as ESA even though they are no longer in a natural<br />
state. Although these areas are heavily degraded or transformed,<br />
they still play an important role in supporting ecological processes.<br />
This is particularly the case with riparian areas, some key catchment<br />
areas and key pieces of corridors (especially the coastal corridor).<br />
No further intensification of land-use activities should be permitted<br />
and they should be prioritized for rehabilitation, where possible. ESA<br />
also include many areas that would have been identified as Critical<br />
Biodiversity Areas but have been subject to significant degradation<br />
or even transformation. <strong>The</strong>se areas retain importance for supporting<br />
ecological processes.<br />
Other Natural Areas (ONAs)<br />
Those areas of natural vegetation identified on the map as Other<br />
Natural Areas are areas that are not currently required to meet<br />
biodiversity thresholds or support important ecological processes.<br />
It is important to note that in the future, if there is loss of Critical<br />
Biodiversity Areas or Ecological Support Areas, such areas may<br />
eventually be reclassified as Critical Biodiversity Areas. <strong>The</strong>refore, in all<br />
decision-making, the precautionary principle needs to be applied.<br />
No Natural Areas Remaining (NNAR)<br />
<strong>The</strong> CBA Map identifies areas that have been irreversibly transformed<br />
through development (e.g. urban development, plantation,<br />
agriculture), contain no natural areas and are not required as<br />
Ecological Support Areas. <strong>The</strong>se areas are referred to as No Natural<br />
Areas Remaining. NNAR also include areas that have been utilized<br />
in the past (e.g. farmed, mined) and are currently unused or are<br />
heavily infested with alien plants. <strong>The</strong>y no longer contribute to the<br />
biodiversity of the area and are favoured areas for development.<br />
3.4 THE GARDEN ROUTE CRITICAL<br />
BIODIVERSITY AREAS MAP<br />
Refer to Figure 3.1 below for the Critical Biodiversity Areas Map for<br />
the George, Knysna and Bitou municipalities and Table 3.2 for the<br />
criteria used to define the CBA Map categories.<br />
Sustainable development depends on where and how development<br />
occurs. <strong>The</strong> CBA Map assists with identifying appropriate areas<br />
for development within the <strong>Garden</strong> <strong>Route</strong> from a biodiversity<br />
perspective. It provides the biodiversity information for a credible<br />
IDP and SDF. Section 5 (pg 43) demonstrates how the map can<br />
be used in land-use planning and decision-making, whilst Section<br />
6 (pg 53) provides answers to ‘Frequently Asked Questions’ when<br />
interpreting the CBA Map.<br />
Refer to Appendix A (pg 62) for additional biodiversity statistics,<br />
including to the GR CBA Mapbook and GIS maps for all the other<br />
mapped ecosystem types or biodiversity features.<br />
3.5 AREAS COVERED BY THE CRITICAL<br />
BIODIVERSITY AREAS MAP<br />
<strong>The</strong> CBA Map covers the George, Knysna, and Bitou municipal areas<br />
in the <strong>Western</strong> <strong>Cape</strong>. It encompasses the entire catchment areas<br />
of the rivers that drain south from the Outeniqua and Tsitsikamma<br />
Mountains. See Figure 3.1 below.<br />
Figure 3.1: <strong>The</strong> <strong>Garden</strong> <strong>Route</strong> CBA Map which identifies a network of CBA and ESA that need to be safeguarded.
Important Note: <strong>The</strong> <strong>Garden</strong> <strong>Route</strong> CBA Map is aligned to the three municipal boundaries for ease of implementation and to allow<br />
for the publication of a bioregional plan in terms of Chapter 3 of the NEMBA.<br />
<strong>The</strong> <strong>Garden</strong> <strong>Route</strong> CBA Map was ‘extracted’ from the <strong>Garden</strong> <strong>Route</strong> Fine-Scale Systematic Biodiversity <strong>Plan</strong> (Holness et al, 2010), the<br />
technical term for the CBA Map. <strong>The</strong> biophysical planning domain of the <strong>Garden</strong> <strong>Route</strong> Fine-Scale Systematic Biodiversity <strong>Plan</strong> (or<br />
CBA Map) covers, for the most part, the region of South Africa known as the <strong>Garden</strong> <strong>Route</strong>. More specifically, it covers the George,<br />
Knysna, and Bitou municipal areas, and beyond their northern boundaries, up to the N9 and R62 roads in the <strong>Western</strong> <strong>Cape</strong>. It<br />
also includes the southern regions of the Koukamma and Kouga Local Municipalities in the Eastern <strong>Cape</strong>. In this way, the entire<br />
catchment areas of the rivers that drain south from the Outeniqua and Tsitsikamma Mountains are encompassed, including the<br />
Kouga and Suuranys Mountains, Baviaanskloof and parts of the Elands Mountains to the east.<br />
Critical Biodiversity Area Maps that lie adjacent to the <strong>Garden</strong> <strong>Route</strong> CBA Map are; to the west the Mossel Bay Municipality CBA<br />
Map and to the north the Little Karoo CBA Map, which overlays the Eden DM, Kannaland and Oudtshoorn Municipalities. <strong>The</strong><br />
Baviaanskloof CBA Map covers the northern parts of the Koukamma and Kouga Municipalities.<br />
Noetzie Proteoid Fynbos is a unit of the Proteoid Quartz Grassy<br />
Fynbos. It occurs within the coastal corridor of the Knysna and<br />
George Municipalities. Some of the geophytes, such as Pterygodium<br />
newdigateae, are threatened species.<br />
29
3.6 CRITERIA USED TO MAP THE CATEGORIES ON THE CRITICAL BIODIVERSITY AREAS MAP<br />
Criteria defining the CBA Map categories are presented in Table 3.1 below. For more detail, refer to the <strong>Garden</strong> <strong>Route</strong> Conservation <strong>Plan</strong>ning<br />
Report (Holness, et al., 2010).<br />
Table 3.1: Criteria used to define the CBA Map categories<br />
CBA MAP<br />
CATEGORY<br />
Protected Areas<br />
Critical<br />
Biodiversity<br />
Areas<br />
Ecological<br />
Support Areas<br />
Other Natural<br />
Areas<br />
No Natural Areas<br />
Remaining<br />
Formal Protected Areas<br />
Source Reference: Holness et al., 2010<br />
CRITERIA DEFINING THE CATEGORY<br />
a) Terrestrial<br />
• Nature Reserves and National Parks (protected by the National Environment Management: Protected Areas Act<br />
57 of 2003).<br />
• Forest Nature Reserves (declared in terms of the National Forest Act 84 of 1998).<br />
• Ramsar Sites (protected by the Ramsar Convention).<br />
• Mountain Catchment Areas (declared in terms of the Mountain Catchment Area Act 63 of 1970).<br />
• World Heritage Sites (declared in terms of the World Heritage Convention Act 49 of 1999).<br />
b) Marine<br />
• Marine Protected Areas (protected by the National Environment Management: Protected Areas Act (57 of 2003)<br />
or Marine Living Resources Act (107 of 1998).<br />
Any terrestrial, freshwater aquatic or marine area required to meet biodiversity pattern and/or process<br />
thresholds<br />
a) Any area that is required for meeting biodiversity pattern thresholds, namely:<br />
• Remaining areas of Critically Endangered habitat types.<br />
• Special habitats (areas required to protect special species and habitats).<br />
• Listed Threatened Ecosystems in terms of the National Biodiversity Act (10 of 2004).<br />
• Remaining areas protected by the National Forest Act (84 of 1998).<br />
b) Any area that is required for meeting ecological process thresholds including:<br />
• Ecological or landscape corridors (comprising upland-lowland, river, coastal and sand-movement corridors)<br />
c) Hydrological process areas (estuaries, wetlands, important catchment areas).<br />
d) All ‘best design’ sites (largest, most intact, least disturbed, connected and/or adjacent) in terms of meeting<br />
pattern and process thresholds. ‘Best design’ refers to an identified network of natural sites that meet pattern<br />
and process thresholds in all vegetation types in a spatially efficient and ecologically robust way, and aim to<br />
avoid conflict with other activities (e.g. economic activity) where it is possible to achieve biodiversity thresholds<br />
elsewhere.<br />
Supporting zone required to prevent degradation of Critical Biodiversity Areas and Protected Areas.<br />
a) Areas required to prevent degradation of Critical Biodiversity Areas and formal Protected Areas.<br />
b) Remaining catchment and other process areas (river, fire, etc) that are required to prevent degradation of Critical<br />
Biodiversity Areas and formal Protected Areas.<br />
c) Areas that are already transformed or degraded g , but which are currently or potentially still important for<br />
supporting ecological processes e.g. transformed or alien plant infested areas that have transformed or<br />
degraded the natural buffer area of a wetland or river. <strong>The</strong>se areas are a focus for rehabilitation, and the<br />
intensification of land-use should be avoided.<br />
Natural areas not included in the above categories.<br />
<strong>The</strong>se areas include cultivated areas (intensive agriculture), afforested areas (plantation forestry), farmland (areas that<br />
have been farmed in the past), mined areas (currently or in the past), urban areas, infrastructure, dams and areas<br />
under coastal development.
3.7 QUANTITATIVE VALUES (HECTARES/PERCENTAGE) OF THE CATEGORIES ON THE CRITICAL<br />
BIODIVERSITY AREAS MAP<br />
<strong>The</strong> quantitative values (hectares and percentage) of Critical Biodiversity Areas and Ecological Support Areas are represented in Table 3.2<br />
below. <strong>The</strong>se values represent the amount of land in existing Protected Areas as well as those areas, namely CBA and ESA, which should be<br />
protected through appropriate mechanisms. <strong>The</strong>se mechanisms could include formal Protected Areas in terms of NEMPAA, appropriate zoning<br />
(in terms of the Land-use <strong>Plan</strong>ning Ordinance) and other Conservation Areas (see Section 2.8 pg 23 and 5.3.1.7 pg 51).<br />
Table 3.2: A summary of quantitative values for each mapped category (hectares and percentage)<br />
MUNICIPALITY <br />
CATEGORY ON THE CBA MAP <br />
GEORGE KNYSNA BITOU<br />
ha % ha % ha %<br />
Protected Areas 24318.8 22.8 31271.4 29.5 49570.6 50.0<br />
Critical Biodiversity Areas 15383.2 14.4 22701.8 21.4 18876.2 19.1<br />
Ecological Support Areas 23074.9 21.6 11962.8 11.3 11575.6 11.7<br />
Other Natural Areas 311.6 0.29 727.8 0.69 209.1 0.21<br />
No Natural Areas Remaining 43784.8 41.0 39220.6 37.0 18844.1 19.0<br />
TOTAL AREA 106 873.3 100 105 931.7 100 99 104.2 100<br />
Ruitersberg Mesic Proteiod Fynbos is an<br />
Endangered vegetation type that grows<br />
in the George Municipality only<br />
Photo: Jan Vlok<br />
31
A key priority coastal and marine area stretches from<br />
Noetsie to Toegroeiberg, east of Kranshoek, located in the<br />
Knysna and Bitou Municipalities.<br />
Photo: Jan Vlok
Land-Use Guidelines<br />
4<br />
This section provides land-use guidelines for land-use planning and decision-making, and guidelines for<br />
the sound management of land and water resource use i.e. land-use management guidelines. All the<br />
guidelines are informed by the Desired Management Objective for the different categories on the CBA<br />
Map as well as the relative impact of a land-use activity on biodiversity.<br />
<strong>The</strong> aim of the guidelines is the effective management of biodiversity as required in terms of Section<br />
41(a) of the Biodiversity Act (10 of 2004), the National Environment Management Act (89 of 1998) and the<br />
Integrated Coastal Management Act (24 of 2009).<br />
<strong>The</strong>se guidelines were derived from the biodiversity sector and identify activities which are<br />
biodiversity-compatible. As such, they consider information from only one sector in the multisectoral<br />
process of spatial planning and land-use management. For further land-use policy<br />
recommendations applicable to areas outside of the urban edge, refer to the <strong>Western</strong> <strong>Cape</strong><br />
Provincial SDF and the associated Rural Land-Use <strong>Plan</strong>ning and Management Guidelines (in prep.).<br />
4.1 DESIRED MANAGEMENT OBJECTIVES<br />
<strong>The</strong> Desired Management Objective for a parcel of land or aquatic ecosystem refers to the ecological<br />
state or condition in which it should be maintained (or managed). Different categories require specific<br />
management objectives according to their biodiversity priority. In broad terms, the biodiversity priority<br />
areas need to be managed in a healthy and functioning condition while the heavily impacted or<br />
transformed areas can be further developed.<br />
<strong>The</strong> Desired Management Objective provides the broad direction for appropriate land or water resource<br />
use activities and management guidelines (see Table 4.2 and 4.3, including Section 4.4 below). Only land<br />
or water resource use activities that are compatible with maintaining the Desired Management Objective<br />
should be encouraged. Refer to Table 4.1 below for Desired Management Objectives.<br />
Table 4.1: Desired Management Objectives for the CBA Map categories.<br />
CBA MAP<br />
CATEGORY<br />
<br />
DESIRED<br />
MANAGEMENT<br />
OBJECTIVE<br />
Formal<br />
Protected<br />
Areas<br />
Critical<br />
Biodiversity<br />
Areas<br />
Maintain natural land.<br />
Rehabilitate degraded to<br />
natural or near natural<br />
and manage for no further<br />
degradation.<br />
Ecological<br />
Support<br />
Areas<br />
Maintain<br />
ecological<br />
processes<br />
Other<br />
Natural Areas<br />
Sustainable<br />
Management<br />
within general<br />
rural land-use<br />
principles<br />
33<br />
No Natural<br />
Areas<br />
Remaining<br />
Sustainable<br />
Management<br />
within general<br />
rural land-use<br />
principles.<br />
Favoured<br />
areas for<br />
development.<br />
<strong>The</strong> Desired Management Objective refers to the management of both biodiversity pattern and/or<br />
ecological process (see Section 1.2 pg 2). In formal Protected Areas and Critical Biodiversity Areas, it is<br />
important to maintain biodiversity pattern and ecological processes, while in Ecological Support Areas the<br />
emphasis is on safeguarding ecological processes only.<br />
Terrestrial and aquatic resources are interdependent, with one affecting the other. For example, to<br />
ensure the healthy functioning of rivers, wetlands and estuaries, it is essential to protect mountain<br />
catchment areas where the water originates, and to safeguard riverside vegetation as the plants<br />
prevent soil erosion, sedimentation and water pollution.
4.2 RECOMMENDED BIODIVERSITY-COMPATIBLE LAND-USE GUIDELINES MATRIX<br />
For the biodiversity priority areas, namely formal Protected Areas, Critical Biodiversity Areas and Ecological Support Areas, the guidelines have<br />
been informed by:<br />
1. the Desired Management Objective (described above in Table 4.1); and<br />
2. the likely impact of land and water resource use activities on biodiversity (i.e. the choice of development should be guided by the<br />
potential impact on the receiving environment).<br />
In Other Natural Areas and No Natural Areas Remaining no guidelines are offered, and decisions regarding development should take all sectors<br />
into consideration. If the proposed development lies beyond the urban edge, guidance should be obtained from the provincial Rural Land-<br />
Use <strong>Plan</strong>ning and Management Guidelines (in prep). All development should strive to be sustainable.<br />
Refer to Table 4.2 below for the biodiversity compatible land-use guidelines recommended by the biodiversity sector.<br />
Andrew Brown<br />
<strong>The</strong> purpose of the guidelines is to encourage development which avoids or has minimal biodiversity impacts, especially in<br />
Critical Biodiversity Areas and Ecological Support Areas. In general, land-uses that result in irreversible loss of natural habitat<br />
(such as cultivation, afforestation, urban development, mining) have the highest impact on biodiversity; and are considered<br />
biodiversity-incompatible land-use activities. Land-uses that allow for natural habitat to remain intact (such as appropriately<br />
managed grazing by either livestock or game or sustainable harvesting of natural products from the wild), have the lowest<br />
impact on biodiversity; and are therefore considered biodiversity-compatible land-use activities.
Table 4.2: Recommended biodiversity-compatible land-use guidelines matrix<br />
KEY: Biodiversity sector land-use recommendations<br />
• Yes = Encouraged;<br />
• No = Discouraged;<br />
• Restricted = Land-use possible under strict controls in order to avoid impacts on biodiversity.<br />
CBA MAP CATEGORY<br />
DESIRED MANAGEMENT<br />
OBJECTIVE<br />
PSDF SPATIAL PLANNING<br />
CATEGORY<br />
LAND-USE ACTIVITY<br />
1) CONSERVATION<br />
Refer to Table 4.3 (pg 36) for the land-use activity descriptions as per pre-defined Town and Regional planning terms<br />
Formal Protected<br />
Areas<br />
Maintain natural<br />
land. Rehabilitate<br />
degraded to natural<br />
or near natural and<br />
manage for no<br />
further degradation.<br />
Critical<br />
Biodiversity Areas<br />
Maintain natural<br />
land. Rehabilitate<br />
degraded to natural<br />
or near natural and<br />
manage for no<br />
further degradation.<br />
Ecological<br />
Support<br />
Areas<br />
Maintain<br />
ecological<br />
processes<br />
Core 1 Core 1 Core 2<br />
LAND-USE<br />
GOVERNED BY<br />
THE NATIONAL<br />
ENVIRONMENTAL<br />
MANAGEMENT:<br />
PROTECTED AREAS<br />
ACT (NEMPAA)<br />
AND A<br />
PROTECTED<br />
AREA<br />
MANAGEMENT<br />
PLAN<br />
Yes Yes<br />
2a) AGRICULTURE -HIGH IMPACT :<br />
Intensive Agriculture<br />
(includes forestry plantation and space<br />
extensive agricultural enterprises)<br />
No No<br />
2b) AGRICULTURE - LOW IMPACT:<br />
Extensive Agriculture<br />
Restricted Yes<br />
3) HOLIDAY ACCOMMODATION<br />
4a) RURAL HOUSING:<br />
Restricted Restricted<br />
Low Density Rural Housing (Consolidation<br />
of rural erven for conservation)<br />
Restricted Restricted<br />
4b) RURAL HOUSING:<br />
On-Farm Workers Settlement<br />
5a) TOURIST and RECREATIONAL<br />
FACILITIES - LOW IMPACT: Lecture rooms,<br />
restrooms, restaurants, gift shops and<br />
outdoor recreation<br />
5b) TOURIST and RECREATIONAL<br />
FACILITIES - HIGH IMPACT: Golf , polo, and<br />
housing eco-estates<br />
6a) RURAL BUSINESS:<br />
Place Bound<br />
6b) RURAL BUSINESS:<br />
Non Place Bound<br />
No Restricted<br />
Restricted Restricted<br />
No No<br />
Restricted Restricted<br />
No No<br />
7) RURAL INDUSTRY No No<br />
8) SMALL HOLDINGS No No<br />
9) COMMUNITY FACILITIES and<br />
INSTITUTIONS<br />
No No<br />
10) INFRASTRUCTURE INSTALLATIONS Restricted Restricted<br />
11a) SETTLEMENT:<br />
Existing Settlements (Urban Expansion)<br />
No No<br />
11b) SETTLEMENT:<br />
New Settlements<br />
No No<br />
Other Natural<br />
Areas<br />
Sustainable<br />
Management<br />
within general<br />
rural land-use<br />
principles<br />
Buffer 1 or 2<br />
at the discretion<br />
of Town and<br />
Regional<br />
<strong>Plan</strong>ners<br />
35<br />
No Natural Areas<br />
Remaining<br />
Sustainable<br />
Management<br />
within general rural<br />
land-use principles.<br />
Favoured areas for<br />
development.<br />
Intensive<br />
Agriculture and<br />
Settlement<br />
REFER TO THE PROVINCIAL RURAL<br />
LAND-USE PLANNING AND<br />
MANAGEMENT GUIDELINES18 FOR GUIDANCE IN IDENTIFYING<br />
APPROPRIATE LAND-USE ACTIVITIES<br />
ALWAYS MANAGE FOR SUSTAINABLE<br />
DEVELOPMENT WHEN CONSIDERING<br />
LAND and WATER RESOURCE USE<br />
APPLICATIONS IN NATURAL AREAS<br />
IMPORTANT NOTE: <strong>The</strong>se land-use guidelines serve as the primary biodiversity informant to land-use planning and decision-making,<br />
and cannot grant or take away existing land-use rights.<br />
18 Available@ http://www.capegateway.gov.za
4.3 DESCRIPTIONS OF LAND-USE ACTIVITIES<br />
Table 4.3: Land-use activity descriptions adopted from the provincial Rural Land-Use <strong>Plan</strong>ning and Management Guidelines (Draft, 2009), including<br />
additional biodiversity-related conditions/controls.<br />
1. Conservation<br />
2. Agriculture<br />
This is a land-use activity where conservation is the major objective. Subject to stringent controls the following biodiversitycompatible<br />
land-use activities (i.e. those of very low impact) may be accommodated in Critical Biodiversity Areas:<br />
1a) Conservation management activities such as the clearing of invasive alien species, research and environmental education.<br />
1b) Low intensity eco-tourism activities such as recreation and tourism (e.g. hiking trails, bird and game watching, and visitor<br />
overnight accommodation) with limited access points.<br />
1c) Sustainable consumptive activities: Harvesting of natural resources (e.g. wild flowers for medicinal, culinary or commercial use).<br />
Assumes the following conditions/controls:<br />
• <strong>The</strong>se land-uses are limited to very low transformation levels for infrastructure development. Unless existing infrastructure already<br />
exists, this should be used. Alternatively transformed areas should be utilized.<br />
• Environmental Management <strong>Plan</strong>s are required to ensure appropriate protection of the receiving environment e.g. harvesting<br />
volumes, periods etc.<br />
• Green technology and architectural design principles have been adopted.<br />
• <strong>The</strong> entire property or a part thereof (depending on the land-use activity above) is under some form of conservation agreement<br />
or mechanism. <strong>The</strong>se mechanisms would include formal Protected Areas in terms of NEMPAA, appropriate zoning (in terms of the<br />
Land Use <strong>Plan</strong>ning Ordinance) and other Conservation Areas, such as stewardship agreements or conservancies.<br />
2a) Intensive agriculture, including:<br />
• All areas of High Potential and Unique Agricultural Land, together with areas of lower agricultural potential where particular<br />
agricultural practices may themselves contribute to the character of the environment, the agricultural working landscape or the<br />
local economy<br />
• Forestry or Timber <strong>Plan</strong>tations (Timber Production)<br />
Includes: all timber plantations, mainly Pinus, Eucalyptus and Acacia plant species;<br />
Assumes the following conditions/controls: monoculture of alien timber species with heavy impact on hydrology and soil<br />
erosion and introduction and spread of a variety of the most aggressive alien invasive plants.<br />
• Irrigated Crop Cultivation<br />
Includes: all irrigated crops (vegetables) and irrigated tree crops (orchards);<br />
Assumes the following conditions/controls: intensive production activity with high nutrient and agro-chemical inputs and often<br />
two crops per year (but even just ploughing, with no chemicals etc., results in irreversible loss of natural habitat).<br />
• Dryland Crop Cultivation -<br />
Includes: all tillage cultivation of non-irrigated crops, mostly single-season annuals, but including perennial and orchard-type tree<br />
crops if cultivated with an indigenous grass layer;<br />
Assumes the following conditions/controls: crop production methods that conserve water and protect against soil erosion;<br />
limited and responsible use of fertilisers, pesticides and other agrochemicals and genetically modified organisms.<br />
Space extensive agricultural enterprises (e.g. intensive feed-lots, poultry battery houses) -<br />
Includes: all intensive animal production systems, that are dependent primarily on imported foodstuffs and confinement; includes<br />
dairy farming and all areas in production support for dairy, including pastures, fodder and grain crops, much of which is usually<br />
irrigated;<br />
Assumes the following conditions/controls: To be located in close proximity to regional routes (including rail) to facilitate<br />
product and requisite (e.g. feed) movement and supply<br />
2b) Extensive agriculture, including extensive livestock or game farming<br />
Includes: livestock or game production and related tourism activities on extensive land portions of natural land cover. Could<br />
include private game reserves, sustainable commercial hunting along with other consumptive and non-consumptive use of<br />
natural resources. Private game reserves to be officially protected through various mechanisms (e.g. NEMPAA or other conservation<br />
agreements), with strict limits on the level of development considered acceptable for lodge and other accommodation<br />
infrastructure.<br />
Assumes the following conditions/controls: application of minimum size criteria for economic sustainability as are applied to<br />
rangeland livestock farming; strictly limited development for revenue generating purposes such as intensified tourism or sectional<br />
ownership. Stringent management conditions applied, such as –<br />
• Faunal specialist to undertake carrying capacity study for game reserves/production.<br />
• Ensure riparian and wetland buffer areas are protected.<br />
• Strict adherence to stocking rates for extensive agriculture.<br />
• For game reserves, indigenous species only to be stocked<br />
• Environmental Management <strong>Plan</strong>, including fire management measures, if necessary.<br />
• <strong>The</strong>se land-uses are limited to very low transformation levels for infrastructure development.<br />
• Location of infrastructure, either within disturbed/transformed areas or in existing buildings, where possible.
3. Holiday Accommodation<br />
4. Rural Housing<br />
Provides tourist/holiday accommodation in rural areas.<br />
Includes:<br />
• B&B establishment, backpackers accommodation, guesthouse, boutique hotel, lodge;<br />
• Resort;<br />
• Camping Sites; and<br />
• Farm rental units<br />
Assumes the following conditions/controls: All forms of holiday accommodation are encouraged within existing structures or<br />
on existing disturbed or transformed areas and within close proximity to existing infrastructure (e.g. roads and electricity). Although<br />
encouraged for resort developments too, this is not always possible given the unique nature of the setting required, which will most<br />
likely be place-bound. Most holiday accommodation should be provided in or adjacent to existing towns and rural settlements, although<br />
it can be accommodated in the rural landscape. However, the form and scale of facilities should be aligned with the character, quality<br />
and environmental sensitivity of the rural landscape. Certain norms (e.g. number of guesthouses or B&B per farm) must be applied, as per<br />
the Rural Land-Use <strong>Plan</strong>ning and Management Guidelines.<br />
<strong>The</strong>se land-use activities are restricted to small footprints and will be subject to the <strong>Western</strong> <strong>Cape</strong> Rural Land-Use <strong>Plan</strong>ning and<br />
Management Guidelines, which restricts the number of new structures etc., within the larger landscape and encourages densification to<br />
reduce cumulative impacts. Resort developments are subject to a density norm or formulae and the resort units are restricted to 120m²<br />
footprints in terms of these guidelines.<br />
4a) Low density rural housing (consolidation of rural erven for conservation)<br />
This land use facilitates residential development rights outside the urban edge, is of a low density and occurs on extensive pieces of<br />
land thereby increasing the size of the conservation area or land under conservation, i.e. consolidation of the conservation estate or<br />
area in hectares that is conserved through various mechanisms (e.g. NEMPAA or other conservation agreements), within the province.<br />
<strong>The</strong> following density norms, in addition to other land-use factors, environmental constraints and strategic context, including the<br />
desirability to consolidate erven, shall be used to establish the maximum number of units permitted on land units outside the urban<br />
edge, namely:<br />
• Divide the total extent in hectares of the to-be-consolidated cadastral units by 1 000 and multiply the answer by the number of cadastral<br />
units to be consolidated. Refer to the Rural Land-Use <strong>Plan</strong>ning and Management Guidelines (in prep.), if this calculation yields a number<br />
of dwelling units that is less than or equal to, or less than one-third more than, the total number of individual cadastral units to be<br />
consolidated.<br />
Includes: development for ‘lifestyle’ or investment-type recreational ownership such as share-block schemes, multi-ownership<br />
reserves, but only for extensive land portions with limited development (NB: excludes golf estates or residential eco-estates).<br />
Assumes the following conditions/controls:<br />
• Maintenance of a large measure of natural land cover and biodiversity-friendly management; the development footprint should<br />
be extremely limited in relation to the property size.<br />
• Individual footprints to be limited to 250m² with maximum permissible floor space of 120m².<br />
• Clustered layout, sensitively placed to limit the transformation impact, development within already transformed or disturbed areas<br />
or use of existing buildings or built on timber piers (this will also ensure corridor linkages throughout the cadastral area).<br />
• Sustainable water supply (within the allocated Reserve of the water resource).<br />
• Use of off-grid services (solar power, rainwater harvesting, grey water recycling, urine diversion/environmentally friendly toilet<br />
facilities) and built from local recyclable materials.<br />
• No formal gardening.<br />
• Development outside of ecologically sensitive areas e.g. river-beds and their riparian zones, wetlands and their natural buffers,<br />
flood-lines.<br />
• Areas not developed are under some form of agreement or mechanism. <strong>The</strong>se mechanisms would include formal Protected Areas<br />
in terms of NEMPAA, appropriate zoning (in terms of the Land Use <strong>Plan</strong>ning Ordinance) and other Conservation Areas, such as<br />
stewardship agreements or conservancies.<br />
4b) “On-Farm” Settlement of Farm Workers<br />
Includes: This land-use includes residences for farm workers and retirees “on-farm” i.e. where housing is available to farm workers<br />
who currently live on the farm and will be living there in future, either due to personal preference (e.g. their tenure rights, rural<br />
surroundings, place for retirement etc.) or because circumstances require it (e.g. working hours etc.).<br />
Assumes the following conditions/controls:<br />
• Fragmentationg of agricultural landscape and land for agricultural purposes is not being threatened by the “urbanization” of rural<br />
areas.<br />
• Where possible, clustering of units in distinct housing precincts located in visually unobtrusive locations and existing footprints,<br />
but enjoying convenient access to the rural access network.<br />
37
5. Tourist and Recreational Facilities<br />
6. Rural Business<br />
7. Rural Industry<br />
Includes a broad range of rural tourist and recreational facilities in support of sustainable rural tourism, rural businesses and<br />
communities, as well as to provide for the rural recreational and leisure needs of urban dwellers, namely:<br />
5a) Low impact facilities<br />
Lecture rooms, restrooms, restaurants, gift shops<br />
Outdoor recreation (e.g. 4x4 trails and hiking trails)<br />
Non-place bound tourist and recreational activities and facilities (e.g. water parks, paint ball); and<br />
5b) High impact facilities<br />
Golf Courses, Golf Estates, Polo Fields and Polo Estates (with or without residential component)<br />
Assumes the following conditions/controls:<br />
• Non-place bound tourist and recreational activities and facilities located in or peripheral to existing rural settlements<br />
• Rural tourist and recreational activities and facilities to be linked to a natural setting or feature.<br />
• Location of infrastructure either within disturbed/transformed areas and existing buildings, where possible.<br />
• Restricting large-scale recreational developments including a residential component to a location in the “urban fringe”, allowing for<br />
their longer term inclusion inside the urban edge.<br />
• Development outside of ecologically sensitive areas e.g. river-beds and their riparian zones, wetlands and their natural buffers,<br />
flood-lines.<br />
• High impact facilities outside of priority ecological or landscape corridors i.e. CBA and ESA.<br />
This land-use broadens tourist and visitor demand and strengthens rural and settlement economies. It includes Rural<br />
businesses ranging from a curio-shop in a National Park to a conference venue on a game farm, namely:<br />
6a) Place-bound business -<br />
Farm stall and farm shop<br />
Restaurant/tavern<br />
Venue facility (e.g. conference/ wedding)<br />
AND<br />
6b) Non-place-bound business e.g. agricultural co-operative, filling station/petro-port, tourist retail outlet, plant nursery, hotel/motel,<br />
tourism office, commercial kennel.<br />
Assumes the following conditions/controls:<br />
• Farm stall restricted to selling products produced and processed on the farm to the general public, located either in the<br />
farmstead precinct or abutting a tourist route, if present.<br />
• Restaurant, tavern and venue facility located within the farmstead precinct.<br />
• Non-place-bound business located in and peripheral to rural settlements, outside of environmentally sensitive areas i.e. CBA and<br />
ESA.<br />
• Location of infrastructure either within disturbed/transformed areas and existing buildings, where possible<br />
This land-use accommodates a range of industry types serving rural areas, and includes:<br />
7(a) Non-place-bound rural industry, for example:<br />
Manufacturing agricultural requisites such as pallet making, bottle labeling;<br />
Processing of regionally sourced product such as fruit cannery, meat processing plant, abattoir;<br />
Transport contractors, dairy depots, builder’s yards; and<br />
Processing rural sourced materials (e.g. pottery manufacturing from kaolin).<br />
7(b) Extractive industry which is place-bound given that it depends on the location of the mineral resource i.e. quarrying and mining;<br />
including secondary beneficiation (e.g. cement block manufacturing plants, concrete batch plants, pre-mix asphalt plants). Includes<br />
all strip and opencast mining excavations or quarrying (sand mining); plus the visual, physical and chemical impacts of these<br />
activities, particularly on ground water reserves; all mine waste and refuse dumps, urban waste sites and landfill sites for whatever<br />
purposes.<br />
Assumes the following conditions/controls:<br />
• All non-place-bound industry (i.e. rural industry and service trades) to be located in and peripheral to rural settlements outside of<br />
environmentally sensitive areas e.g. CBA and ESA.<br />
• Extractive industry to be located at the mineral source within the rural area, and informed by environmental considerations and<br />
post mining rehabilitation.
8. Smallholdings<br />
9. Community facilities<br />
and institutions<br />
10. Infrastructure installations<br />
11. Settlement<br />
This land-use accommodates smaller agricultural properties which may be used for agriculture, but may also be occupied as<br />
places of residence by people who seek a rural lifestyle, and usually includes agriculture, dwelling house, home occupation.<br />
Assumes the following conditions/controls:<br />
• New smallholding developments for rural lifestyles to be restricted to inside the medium to long term urban edge.<br />
• Bona-fide small-scale agricultural properties (e.g. agricultural allotments) should be located outside the urban edge within areas of<br />
intensive agriculture (existing or potential).<br />
• Minimum smallholding unit size: 8 000 m².<br />
• Compilation of a Management <strong>Plan</strong> for new and existing smallholding areas.<br />
This land-use provides facilities in support of rural community socio-economic development and well-being; including:<br />
• schools, places of assembly, churches;<br />
• primary and secondary health care;<br />
• institutions requiring extensive land or isolated location (e.g. infectious disease recovery facility); and<br />
• institutions requiring an agricultural production location, servicing such production (e.g. agricultural research stations and<br />
agricultural schools).<br />
Assumes the following conditions/controls:<br />
• Facilities located within existing towns and rural settlements; in close proximity to a settlement or located on a regional route,<br />
outside of environmentally sensitive areas e.g. flood-lines, river and wetland buffers and Special Habitats.<br />
• In the absence of public land, establish facilities “on-farm”, utilizing existing farm structures or existing footprints.<br />
• Location of facilities to target disturbed areas and areas of low agricultural potential in order to avoid fragmentation of super-blocks.<br />
This land-use accommodates infrastructure installations serving both the urban and rural areas where such installations include:<br />
• Wastewater treatment works, airports, water extraction purification plants, safety and security (e.g. police) stations, irrigation<br />
infrastructure, roads, power lines, railways and pipelines;<br />
• Nuclear power stations, wind farms or other alternative energy technologies requiring large areas of undeveloped land; and<br />
• All substantial impoundments, reservoirs or dams and weirs, with associated pipelines, canals, access roads and bulk water transfer<br />
schemes).<br />
Assumes the following conditions/controls:<br />
• Installations to be located on transformed, disturbed or low-value agricultural land, where possible.<br />
• A shared location and/or facility (e.g. police and clinic in a community service centre).<br />
• Infrastructure installations requiring a location outside the urban edge is restricted to extensive agricultural areas peripheral to<br />
settlements in close proximity to regional routes to facilitate access and restrict fragmentation of the agricultural landscape.<br />
• Installations in intensive agricultural areas are restricted to essential services (e.g. irrigation infrastructure, safety and security).<br />
• Energy generating developments (i.e. nuclear power, wind farms, etc) are associated with large areas of land left undeveloped thereby<br />
maintaining low transformation levels relative to the property size.<br />
• Avoidance of sensitive areas such as floodlines, river and wetland buffers and Special Habitats.<br />
• All water-use developments should be subject to the Ecological Reserve in terms of the National Water Act.<br />
This category includes all human settlements, consisting of the following two sub-categories:<br />
11.a) Existing settlements (and urban expansion), which include:<br />
Metropolitan areas, cities, larger towns, small towns, villages and hamlets.<br />
It comprises all physical, residential, educational, recreational elements (e.g. sports facilities, fields, parks), cemeteries, industrial and<br />
business development, including associated infrastructure etc., which are commonly known as urban land-use activities (or the built<br />
environment). Existing settlements are frequently under significant pressure to expand due to in-migration and population increases,<br />
which require the provision of housing and services etc., therefore causing urban expansion.<br />
Assumes the following conditions/controls:<br />
• <strong>The</strong> control of urban expansion through the delineation of an urban edge to prevent urban sprawl.<br />
• <strong>The</strong> delineation process is guided by the provincial urban edge guideline document and informed by a fine-scale biodiversity plan or<br />
map, for example: a Critical Biodiversity Areas Map is used to delineate a boundary of the urban edge.<br />
• <strong>The</strong> promotion of compact urban settlements, whilst maintaining an open space system (where possible) that is informed by a finescale<br />
biodiversity plan or map.<br />
11.b) New settlements include areas that will -<br />
Service geographically isolated farming areas (i.e. agri-village);<br />
Service rural resource exploitation (e.g. mines) and significant infrastructural developments (e.g. power plants); or<br />
Proclaim the urban component of existing Act 9 and church settlements.<br />
Assumes the following conditions/controls:<br />
• New settlements located in the rural area when necessitated by unique circumstances (e.g. servicing of isolated large infrastructural<br />
projects outside the servicing sphere of existing settlements) or in order to proclaim the urban component of existing rural church,<br />
forestry or conservation settlements (i.e. Transformation of Certain Rural Areas).<br />
39
4.4 GUIDELINES FOR THE SOUND MANAGEMENT OF LAND AND WATER RESOURCES<br />
<strong>The</strong> land and water resource use management guidelines in the boxes 1- 3 below can be used by all parties involved in land-use planning<br />
and decision-making e.g. provincial and local government (as part of the municipal LUMS), landowners, Interested and Affected Parties and<br />
developers etc.<br />
<strong>The</strong> guidelines must be read in conjunction with -<br />
1. <strong>The</strong> Fynbos Forum (FF) Ecosystem Guidelines (de Villiers et al., 2005); and<br />
2. <strong>The</strong> C.A.P.E Fine-Scale <strong>Plan</strong>ning (FSP) Aquatic Ecosystem Guidelines (Job et al., 2008).<br />
Both documents provide additional management guidelines for specific ecosystem type(s) verified on a property (e.g. freshwater,<br />
lowland fynbos etc) and are available from the BGIS Unit at www.<strong>bgis</strong>.<strong>sanbi</strong>.org or (021) 799 8738.<br />
Nigel Dennis<br />
Noetzie Thicket-Fynbos is a Vulnerable vegetation type growing in<br />
the Knysna and Bitou Municipalities along the coastal corridor.
BOX 1: MANAGEMENT GUIDELINES FOR AREAS CLASSIFIED AS CRITICAL BIODIVERSITY AREAS (CBA)<br />
• Minimise loss of any natural habitat.<br />
• Minimise further fragmentation of habitat.<br />
• If degraded or disturbed lands are identified as components of a landscape corridor, no further hardening of the surface should be allowed as<br />
this poses threats to the functioning of the corridor.<br />
• Prioritise as prime candidates for biodiversity offset receiving areas g .<br />
• Implement management programmes to maintain natural ecological processes; e.g. fire management in fynbos vegetation types.<br />
• Implement regular environmental monitoring and reporting of biodiversity and/or change of land-use to prevent unauthorized development<br />
or degradation by neglect or ignorance.To be carried out by DEADP, Department of Water Affairs (of DWEA), and the Department of<br />
Agriculture (of DAFF).<br />
• Prioritise as prime areas for conservation projects or activities and alien clearance programmes etc. by LandCare, Working for Water, Working<br />
for Wetlands, Working for the Coast, (CoastCare) and NGOs.<br />
• Implement restoration or rehabilitation programmes in degraded or disturbed sites i.e. an integrated alien management plan.<br />
• Compile Environmental Management <strong>Plan</strong>s, where possible, to include, e.g. alien plant control, fire management etc.<br />
• Prioritise for incorporation into the protected areas network, and for stewardship agreements. See Section 5.3.1.7 (pg 51).<br />
• Prioritize for rates rebates by Municipalities (in terms of the Municipal Property Rates Act 6 of 2004).<br />
• Use CBA boundaries to demarcate urban edges to limit lateral expansion of urban development along landscape corridors.<br />
• Incorporate CBA into Urban Open Space Systems.<br />
• All the management conditions/controls provided in Table 4.3 (pg 36) that correlate to the recommended land-uses (Table 4.2 pg 35)<br />
in CBA should be adhered to. <strong>The</strong>se should be further supported by the <strong>Western</strong> <strong>Cape</strong> Provincial Rural Land-Use <strong>Plan</strong>ning and Management<br />
Guidelines.<br />
• Any loss in CBA should be recorded, preferably in GIS format, to encourage monitoring of the CBA Map.<br />
GUIDANCE TO ALL PARTIES INVOLVED IN LAND-USE CHANGE APPLICATIONS IN CBA<br />
(and as part of municipal LUMS)<br />
• Land-use activities that are not compatible with a CBA should not be approved or applied for (see Table 4.2 pg 35), unless an adequate<br />
biodiversity offset receiving area is identified.<br />
• Land-use activities that will result in major loss in natural habitat are incompatible with the Desired Management Objectives of a CBA (Table<br />
4.1 pg 33).<br />
• Subdivision of land likely to result in natural areas or more intensive use of CBA should be discouraged.<br />
• Where developments are unavoidable in a CBA, some form of conservation agreement or mechanism should be adopted in the<br />
undeveloped areas e.g. formal Protected Area status in terms of NEMPAA, appropriate zoning (in terms of LUPO) and other conservation areas,<br />
such as stewardship agreements or conservancies. See Section 2.8 (pg 23). Appropriate biodiversity offset receiving areas must also be<br />
identified to compensate for the CBA loss.<br />
• Specialist Ecologist to conduct the environmental assessment, or in consultation with <strong>Cape</strong>Nature, the Department of Water Affairs (where<br />
aquatic features are present), the Department of Forestry (where forests are present) and/or SANParks.<br />
SPECIFIC MANAGEMENT GUIDELINES FOR AQUATIC ECOSYSTEMS<br />
• Do not permit development within at least 30m of the delineated wetland/estuary boundary or riparian edge, the 5m contour around<br />
estuaries or within the 1:100 year floodline (or higher where increased flooding has occurred), whichever is the more restrictive. This reduces<br />
the incidence or severity of natural hazards.<br />
• <strong>The</strong> “buffer” may need to be wider than 30m. This should be determined on a case-by-case basis by a specialist ecologist in consultation with<br />
the Department of Water Affairs and <strong>Cape</strong>Nature (and SANPArks) to reflect site-specific factors. <strong>The</strong> approach for determining buffer width<br />
should consider the current condition of the aquatic ecosystem and existing and proposed buffer, as well as the functioning of the system in<br />
the broader landscape, plus an assessment of the impacts to the ecosystem of the existing and proposed adjacent land-use.<br />
• Maintain water quantity, quality and flow regimes as close to natural as possible (desired Eco-status19 or Ecological Management Class of A:<br />
Natural or B: Largely Natural) e.g. water quantity component of Ecological Reserve of > 80% of Mean Annual Runoff (MAR).<br />
• Large-scale groundwater abstraction should be avoided.<br />
• Areas that are degraded or disturbed should be rehabilitated through programmes such as Working for Water, Working for Wetlands, Working<br />
for the Coast (CoastCare); and a systematic alien vegetation (and where possible fish) eradication programme implemented to improve<br />
biodiversity and water supply, especially upstream areas of estuaries and wetlands.<br />
• Ensure implementation of the CBA Map and guidelines through Catchment Management Agencies.<br />
Consult the FF Ecosystem Guidelines (de Villiers et al., 2005) and the C.A.P.E. FSP Aquatic Ecosystem Guidelines (Job et al., 2008); for detailed<br />
management guidelines for terrestrial and aquatic ecosystems identified on the property (Refer to Appendix A for summary data on the<br />
<strong>Garden</strong> <strong>Route</strong> vegetation types).<br />
19 Eco-status: <strong>The</strong> overall ecological status of an aquatic resource in which it should be managed as determined by the Reserve in terms of the NWA e.g. Ecostatus<br />
A requires that a river be managed in its natural state with no impacts. It indicates the level of protection a river should receive.<br />
41
BOX 2: MANAGEMENT GUIDELINES FOR AREAS CLASSIFIED AS ECOLOGICAL SUPPORT AREAS (ESA)<br />
• Further loss of habitat within ecological process areas should be minimized i.e. avoid further urban and intensive agriculture in<br />
landscape corridors.<br />
• Fragmentation of habitat should be avoided within ecological process areas.<br />
• Natural linkages should be maintained and encouraged between ecosystems, e.g. rivers to associated wetlands.<br />
• Maintain ESA to ensure that ecological processes remain intact e.g. hydrological [river] processes and riparian areas, fire processes,<br />
vegetation boundaries which reflect soil interfaces or upland-lowland interfaces etc.), especially within landscape corridors.<br />
• ESA should be a focus for rehabilitation, where possible e.g. alien clearing through an integrated alien management plan.<br />
• If degraded, disturbed or agricultural lands are identified as components of a landscape corridor, no further hardening of the surface<br />
should be allowed as this poses threats to the functioning of the corridor.<br />
• No intensification of land-use should be allowed in these areas.<br />
• In fynbos and fire-prone thicket systems appropriate fire regimes should be maintained.<br />
• All the management conditions/controls provided in Table 4.3 (pg 36) relating to the recommended land-uses (Table 4.2 pg<br />
35) in ESA should be adhered to. <strong>The</strong>se should be further supported by the <strong>Western</strong> <strong>Cape</strong> Provincial Rural Land-Use <strong>Plan</strong>ning and<br />
Management Guidelines.<br />
• Any loss in ESA should be recorded, preferably in GIS format, to encourage monitoring of the CBA Map.<br />
SPECIFIC MANAGEMENT GUIDELINES FOR AQUATIC ECOSYSTEMS<br />
• To protect river integrity a minimum buffer of 32m, including all riparian habitat, around rivers in ESA should be maintained. Where<br />
possible, the 1:100 year flood line should be used (or higher in areas that have experienced increased flooding). This reduces the<br />
incidence or severity of natural hazards.<br />
• Do not permit infilling, excavation, drainage, hardened surfaces (including buildings and asphalt), intensive agriculture or any new<br />
developments within a wetland and its associated buffer of natural vegetation (i.e. wetland marginal habitat).<br />
• In ESA around estuaries it is recommended that no new development be permitted within 500m from the high water mark, the 5m<br />
contour or the 1:100 year floodline.<br />
• Maintain water quantity, quality and flow regimes as close to natural as possible (desired Eco-statusg or Ecological Management Class<br />
of A: Natural or B: Largely Natural) e.g. water quantity component of Ecological Reserve of > 80% of Mean Annual Runoff (MAR).<br />
• Large-scale groundwater abstraction should be avoided.<br />
• Areas that are degraded or disturbed should be rehabilitated through programmes such as Working for Water, Working for Wetlands;<br />
and a systematic alien vegetation (and where possible fish) eradication programme implemented to improve biodiversity and water<br />
supply, especially upstream areas of estuaries and wetlands.<br />
• Ensure implementation of the CBA Map and guidelines through Catchment Management Associations.<br />
Consult the FF Ecosystem Guidelines (de Villiers et al., 2005) and the C.A.P.E. FSP Aquatic Ecosystem Guidelines (Job et al., 2008); for<br />
detailed management guidelines for terrestrial and aquatic ecosystems identified on the property (Refer to Appendix A for summary<br />
data on the <strong>Garden</strong> <strong>Route</strong> vegetation types).<br />
BOX 3: MANAGEMENT GUIDELINES FOR AREAS CLASSIFIED AS OTHER NATURAL AREAS (ONAs)<br />
<strong>The</strong>se are areas that have not been flagged as having critical biodiversity importance. However, it is possible that they contain important<br />
biodiversity features which are worthy of safeguarding, but which were not identified in the CBA Map, e.g. a previously unidentified rare<br />
species on the site.<br />
• Developments should attempt to avoid fragmentation of natural habitat.<br />
• Developments must still meet the NEMA principles and EIA requirements, including all other planning procedures (e.g. town and<br />
regional planning, water use licensing, agricultural subdivisions and cultivation).<br />
Proposals should follow all relevant guidelines to minimize the impact of the proposed development. <strong>The</strong>re are a host of guidelines offered<br />
by the <strong>Western</strong> <strong>Cape</strong> Department of Environmental Affairs and Development <strong>Plan</strong>ning available on the website www.capegateway.gov.za.<br />
Any loss in ONA should be recorded, preferably in GIS format, to encourage monitoring of the CBA Map.<br />
Consult the Fynbos Forum Ecosystem Guidelines (de Villiers et al., 2005) for detailed management guidelines with regards to terrestrial<br />
ecosystems identified on the property (Refer to Appendix A for summary data on the <strong>Garden</strong> <strong>Route</strong> vegetation types).
How And When To Use the Biodiversity <strong>Sector</strong> <strong>Plan</strong><br />
in Land-Use <strong>Plan</strong>ning and Decision-Making<br />
5<br />
<strong>The</strong> Biodiversity <strong>Sector</strong> <strong>Plan</strong> (BSP) is intended to support land-use planning and decision-making in areas<br />
identified as biodiversity priorities (i.e. CBA and ESA); and to help inform the planning and management<br />
tools that municipalities are required to develop. This section therefore gives guidance on how and when<br />
to use the BSP (most importantly the CBA Map, GIS layers and land-use guidelines) within the field of landuse<br />
planning and decision-making.<br />
By applying the recommendations provided in the BSP, sustainable development will be promoted. This<br />
will be achieved through the effective protection and management of biodiversity in the <strong>Garden</strong> <strong>Route</strong>,<br />
as required in Section 41(a) of the Biodiversity Act (10 of 2004) and in terms of the National Environment<br />
Management Act (89 of 1998) and the Integrated Coastal Management Act (24 of 2009).<br />
5.1 REACTIVE LAND-USE DECISION-MAKING<br />
A wide range of authorities can benefit from consulting the Biodiversity <strong>Sector</strong> <strong>Plan</strong>:<br />
• Municipalities (LUPO applications, EIAs);<br />
• National and provincial Environmental Departments (EIAs, LUPO applications);<br />
• National and provincial Agricultural Departments when i) assessing land-use applications in terms of<br />
LUPO, the NEMA (EIAs) and the Subdivision of Agricultural Land Act; or ii) in processing applications<br />
for the cultivation of virgin land20 in terms of the Conservation of Agricultural Resources Act;<br />
• Department of Mineral Resources to inform mining applications;<br />
• Water Affairs (of DWEA) in processing water use licenses and commenting on EIAs that affect water<br />
resources; and<br />
• Forestry (of DAFF) in processing land or resource use applications affecting indigenous forests.<br />
Municipalities play a specific role in ensuring that appropriate environmental authorisations are in place<br />
and that correct procedures are followed before they allow any change in land-use. It is the obligation of a<br />
municipality to:<br />
• issue an approval only once other required authorisations are in place (e.g. EIA, DWEA licensing), or<br />
• make it explicit that work can begin only once other authorisations are in place.<br />
In most situations, a full investigation into biodiversity importance is triggered only when a “listed activity”<br />
in terms of NEMA is proposed 21 . However, if the Critical Biodiversity Areas Map indicates that a proposed<br />
activity is located within a Critical Biodiversity Area, Ecological Support Area, Other Natural Area or natural<br />
habitat (not indicated on the CBA Map) then further investigation is needed before any decision is made<br />
regarding a land-use change. <strong>The</strong> CBA Map indicates potential constraints to development on a site and<br />
provides an early warning signal that an in-depth biodiversity assessment may be required.<br />
<strong>The</strong> Biodiversity <strong>Sector</strong> <strong>Plan</strong>, comprising the CBA Map and guidelines, provides a summary of the best<br />
available biodiversity information for use in the decision-making process. However, it is important to note<br />
that while the CBA Map can assist with a desk-top assessment of the site at a local and strategic level, it<br />
should not, under any circumstances, replace a site assessment by a relevant biodiversity specialist (Step 3<br />
below).<br />
If a site is located within a CBA or ESA a specialist assessment of the biodiversity is essential.<br />
A full set of guidelines to assist with planning and decision-making has been prepared by the Department<br />
of Environmental Affairs and Development <strong>Plan</strong>ning (DEADP) and is available at www.capegateway.gov.<br />
za/deadp. <strong>The</strong> Biodiversity <strong>Sector</strong> <strong>Plan</strong> should, however, be used to support the approaches outlined in<br />
the DEADP guideline documents when making land-use decisions.<br />
20 Virgin land is considered virgin if it has not been cultivated in the past or within the last 10 years.<br />
21 Environmental impact assessment may be prescribed by national legislation or may be required by the Municipal<br />
Council where it is of the opinion that a proposed land-use or activity is likely to have a significant impact on the<br />
environment. <strong>The</strong> <strong>Western</strong> <strong>Cape</strong> Provincial Zoning Scheme Model By-law creates the mechanism and procedure<br />
whereby the Municipal Council may require and manage an environment impact assessment not provided for in<br />
other legislation.<br />
43
A detailed guide to pre-application biodiversity assessments is<br />
given in the Fynbos Forum Ecosystem Guidelines (de Villiers et<br />
al., 2005), which can be accessed via the BGIS website (http://<br />
<strong>bgis</strong>.<strong>sanbi</strong>.org). Note that the CBA Map represents the most<br />
accurate and up to date information, i.e. it supersedes the<br />
NSBA, STEP and CAPE.<br />
When processing an application or considering a proposed<br />
development, follow the 4 steps below to interpret the <strong>Garden</strong> <strong>Route</strong><br />
Critical Biodiversity Areas Map.<br />
5.1.1 STEPS TO FOLLOW WHEN USING THE CBA MAP<br />
Below are the steps to follow when using the CBA Map to inform<br />
decisions regarding land-use applications. <strong>The</strong>y are aimed at decisionmakers<br />
and developers/applicants, together with environmental<br />
assessment practitioners and/or town planning professionals.<br />
STEP 1: ASSESS THE INFORMATION ON THE CBA MAP AND ITS<br />
ASSOCIATED MAPS (I.E. THE BSP INFORMATION)<br />
Refer to the CBA Map, <strong>Garden</strong> <strong>Route</strong> CBA Mapbook and GIS data to<br />
determine:<br />
(a) <strong>The</strong> biodiversity category of the property i.e. does the proposed<br />
development fall within a Protected Area, Critical Biodiversity<br />
Area, Ecological Support Area, Other Natural Area or No Natural<br />
Areas Remaining?<br />
(b) <strong>The</strong> Desired Management Objective of the property (Table 4.1<br />
pg 33).<br />
(c) <strong>The</strong> biodiversity features on the property e.g. wetland,<br />
ecological process area, vegetation type; ecosystem types (e.g.<br />
Fynbos, Freshwater or Coastal), Species of Special Concern and<br />
ecosystem status.<br />
(d) <strong>The</strong> land cover category of the property i.e. does the proposed<br />
development fall within Natural, Degraded or Transformed?<br />
(e) <strong>The</strong> Spatial <strong>Plan</strong>ning Category (SPC) of the property i.e. Core<br />
1, Core 2 and Buffer 1 or 2 (Go to Table 5.1 pg 47 or the GIS<br />
data).<br />
• Refer to the CBA Lookup Table (provided as part of the GIS data)<br />
for criteria that determined whether a site is a CBA or ESA.<br />
STEP 2: ASSESS OTHER AVAILABLE INFORMATION (I.E. NOT THE<br />
BSP INFORMATION)<br />
Consult other available information to gain an overview of the<br />
biodiversity of the area, the ecological condition of the site and other<br />
related policy recommendations.<br />
(a) Refer to the Provincial Spatial Development Framework,<br />
the <strong>Western</strong> <strong>Cape</strong> Coastal Zone Policy Document (where<br />
applicable) and the Rural Land-Use <strong>Plan</strong>ning and Management<br />
Guidelines (in preparation22 ) for the SPC’s overarching set of<br />
principles, policy objectives and recommendations as set out<br />
by these documents (available from www.capegateway.co.za/<br />
deadp).<br />
22 Available @ http://www.capegateway.gov.za<br />
(b) Other information could include the most recent site<br />
photographs, technical reports and other documents,<br />
information on red data book species locations or phone<br />
conversations, etc.<br />
(c) Make use of up-to-date orthophotos and aerial photos of the<br />
area to assess the presence of natural vegetation on site or the<br />
level of impacts/transformation (REMEMBER: outdated aerial<br />
photographs will misrepresent the condition of the site).<br />
(d) <strong>The</strong> Land-use Decision Support Tool on the BGIS website<br />
(http://<strong>bgis</strong>.<strong>sanbi</strong>.org) can be used to determine property<br />
specific details, and includes aerial photography via google<br />
earth.<br />
It is very important that information on the CBA Map is verified by<br />
making use of other supporting data, especially if it is more up to date or<br />
more accurate.<br />
STEP 3: SITE VISIT<br />
<strong>The</strong> next essential step should be a site assessment to verify the CBA<br />
Map information.<br />
(a) Verify that the CBA Map and GIS data used to develop the CBA<br />
Map (i.e. vegetation type, land cover category, presence of<br />
aquatic features, special habitats etc) are spatially correct i.e.<br />
• does the property fall within a CBA, ESA, ONA and/or NNAR?<br />
• does the property fall within a Natural, Degraded or<br />
Transformed land cover category?<br />
Note when verifying the land cover category: Numerous<br />
degraded (e.g. alien invaded) and transformed areas (e.g.<br />
agricultural land) are categorized as ESA. This is because they<br />
are currently or potentially still important for supporting<br />
ecological processes (e.g. floodplains and riparian areas,<br />
buffers around wetlands and lakes, or key linkages for animal<br />
movement). In this case the land cover category will match<br />
site conditions. Some degraded sites have been categorized<br />
as CBA due to their importance as ecological process areas.<br />
In such instances the land cover category will also match<br />
site conditions. However, no known transformed site was<br />
categorized as a CBA during mapping. This would only be the<br />
case if the land cover has changed subsequent to mapping or<br />
if it was incorrectly mapped. In such instances the land cover<br />
category will not match site conditions. See queries 6.1 and 6.2<br />
(pg 53).<br />
Refer to Frequently Asked Questions when verifying the information<br />
on these maps (Section 6 pg 53).<br />
(b) Verify whether the proposed land-use change (or<br />
development) requires an EIA in terms of the NEMA regulations<br />
or whether it falls within a CBA and/or ESA?
(i) Where an EIA is required:<br />
<strong>The</strong> site assessment should be conducted by a specialist consultant; and a <strong>Cape</strong>Nature, Department of Water Affairs (if an aquatic<br />
feature is present), Department of Forestry (if forest is present) and a SANParks official (where possible).<br />
• Refer to available supporting tools for assessing a site -<br />
(i) Recommended Terms of Reference for the Consideration of Biodiversity in Environmental Assessment available at www.<br />
botanicalsociety.org.za (select: conservation unit, then CU downloads); and<br />
(ii) DEADP’s Guideline for Involving Biodiversity Specialists (www.capegateway.gov.za).<br />
• Both publications promote the early consideration of potentially significant impacts and assist in improving specialist input<br />
into EIAs.<br />
As a minimum the specialist consultant should:<br />
1. Produce an Ecological Sensitivity Map that delineates:<br />
(a) vegetation type(s) on site of varying sensitivity i.e. whether it is a CBA, ESA or ONA etc., and the ecosystem status (Refer<br />
Appendix A pg 62);<br />
(b) disturbance of the vegetation type(s) and levels of disturbance on site i.e. pristine (high sensitivity), moderately degraded<br />
(moderate sensitivity) or highly degraded (low sensitivity); stating the degree of intactness, including the identification of<br />
alien invasive species;<br />
(c) potential for rehabilitation/restoration;<br />
(d) presence of or likelihood of presence of species of special concerng and/or special habitats; and<br />
(e) ecological process areas which delineates either the presence of a mapped CBA or ESA corridor (ecological process area<br />
or landscape corridor – see section 2.7, Figure 2.1) or the potential for small scale corridors on site e.g. along a stream,<br />
drainage lines, or processes e.g. wetland and its buffer.<br />
2. Verify the CBA Map category i.e. CBA, ESA, ONA etc. <strong>The</strong> degree of intactness of the vegetation is an important indicator of<br />
whether the site is situated within a CBA or not. In addition, the GIS data (refer to the CBA Lookup Table) provides the criteria<br />
determining the category of the site under investigation.<br />
Note: Where the site has been categorized as a CBA or ESA, the specialist consultant must interrogate all the underlying information of<br />
the CBA Map (e.g. land cover, landscape corridors, ecosystem status, species of special concern etc) to verify why the property has been<br />
cateogorized as a CBA or ESA. This is particularly the case for degradedg sites. In such instances, the specialist must clearly identify why the<br />
site is a CBA or ESA even though it is degraded e.g. because it is located in a landscape corridor, is Critically Endangered or contains rare<br />
species etc. <strong>The</strong> specialist must therefore evaluate the site in terms of its contribution to meeting the underlying biodiversity objectives<br />
identified within the CBA Map.<br />
3. Identify whether there are any biodiversity features that have not been mapped (e.g. rare species, wetlands, natural areas that<br />
were not properly identified) and that would/should have been classified as a CBA or ESA.<br />
4. Correlate the ecosystem types on site with the FF Ecosystem Guidelines (de Villiers et al, 2005) and the C.A.P.E FSP Aquatic<br />
Ecosystem Guidelines (Job et al, 2008), where possible.<br />
5. Provide the above in shapefile format, including the proposed development area in hectares (extent of transformation per<br />
cadastral unit).<br />
<strong>The</strong> Endangered Afrixalus knysnae or Knysna Spiny<br />
Reed Frog (Photo: Miguel Vences)<br />
45
(ii) Where an EIA is not required; but the property falls within a<br />
CBA and/or ESA:<br />
This could happen where an EIA is not triggered in terms<br />
of the NEMA listed activities, but a land-use application<br />
is contemplated in terms of: (a) <strong>Plan</strong>ning legislation (e.g.<br />
LUPO) i.e. zoning change, subdivision; (b) the Subdivision of<br />
Agricultural Land Act (i.e. agricultural subdivision); or (c) CARA<br />
(i.e. ploughing permit).<br />
<strong>The</strong> site assessment should be conducted by a <strong>Cape</strong>Nature,<br />
Department of Water Affairs (if an aquatic feature is present),<br />
Department of Forestry (if forest is present), Department of<br />
Agriculture (where agricultural applications are being made)<br />
and a SANParks official (where possible).<br />
As a minimum the various officials can make use of the<br />
biodiversity information to produce an environmentally friendly<br />
layout or development.<br />
<strong>The</strong> relevant legislation i.e. LUPO, CARA, Subdivision of<br />
Agricultural Land Act will need to be complied with.<br />
<strong>Cape</strong>Nature’s Land-use Advisory Unit is a commenting<br />
authority and should be consulted if impacts to CBA and ESA<br />
could occur. <strong>The</strong> unit can assist with Terms of Reference for<br />
a specialist study and the desirability of a proposed change<br />
in land-use. Phone the branch in George on (044) 802 5300.<br />
<strong>The</strong> South African National Parks (<strong>Garden</strong> <strong>Route</strong> Cluster)<br />
should also be contacted for comment and advice on landuse<br />
applications that impact CBA and ESA. Phone the Knysna<br />
Branch on (044) 302 5600 (<strong>Plan</strong>ning and Implementation).<br />
STEP 4: FOLLOW THE GUIDELINES OFFERED IN SECTION 4<br />
(a) Consult the land-use recommendations provided in Table 4.2<br />
(pg 35). <strong>The</strong> accompanying CBA Map (hard copy and GIS)<br />
also presents the land-use recommendations.<br />
Note: If the proposed land-use activity is not listed in this<br />
table, or if the proposed development description differs<br />
from that specified in Table 4.3 (pg 36), then assess<br />
whether the proposed land-use activity is compatible with<br />
the Desired Management Objective in Table 4.1 (pg 33).<br />
(b) Consult the land and water use management guidelines<br />
provided in Section 4.4 (pg 40).<br />
Steps 1- 4 can serve as a Screening Phase to identify potential<br />
fatal flaws to a proposed development prior to proceeding<br />
with a land-use change application e.g. EIA or LUPO etc; or can<br />
provide early biodiversity input into the project concept or<br />
design phase.<br />
For example: if ground truthing g of the actual site verifies that<br />
the property is located within a CBA, then, according to the<br />
recommended land-use guidelines (Table 4.2 pg 35), only<br />
low impact biodiversity-compatible land-use activities should<br />
be encouraged. If the proposed development is in conflict with<br />
the recommended land-use, then this would represent a fatal<br />
flaw.<br />
5.2 LAND-USE PLANNING: SPATIAL<br />
DEVELOPMENT FRAMEWORKS (SDF)<br />
AND ENVIRONMENTAL MANAGEMENT<br />
FRAMEWORKS (EMF)<br />
<strong>The</strong> SDF is a legally binding spatial framework that promotes<br />
sustainable environmental, economic and social development in<br />
a municipality. Municipalities are obliged to develop maps termed<br />
Spatial Development Frameworks 23 (SDFs) which indicate desired<br />
patterns of land-use and provide strategic guidance in the location<br />
and nature of development and conservation. <strong>The</strong> SDF map is<br />
also accompanied by the SDF report. <strong>The</strong> SDF map is the spatial<br />
depiction of an Integrated Development <strong>Plan</strong> (IDP); and should<br />
be interpreted as the tool which integrates all sector plans. Such a<br />
plan and framework must ensure sustainability (Section 26 of the<br />
Municipal Systems Act, 32 of 2000). Refer to Figure 5.1 (pg 48) and<br />
Table 5.2 (pg 49) demonstrating the alignment of the IDP and SDF<br />
processes.<br />
According to the <strong>Western</strong> <strong>Cape</strong> Provincial Spatial Development<br />
Framework 24 , local SDFs should divide the entire municipal landscape<br />
into a set of Spatial <strong>Plan</strong>ning Categories (SPCs) “to reflect a vision of<br />
how the area should develop spatially, so as to ensure sustainability”.<br />
<strong>The</strong> PSDF also provides policies, management objectives and<br />
guidance for appropriate land-use within each SPC, further<br />
developed through the Rural Land-Use <strong>Plan</strong>ning and Management<br />
Guidelines (DEADP, 2009).<br />
From a biodiversity perspective, SPCs indicate areas where limitations<br />
to land-use need to be applied in order to protect biodiversity. <strong>The</strong><br />
two SPCs relevant to biodiversity conservation and the CBA Map are<br />
those referred to as “Core” and “Buffer”. <strong>The</strong> “Core” includes areas that<br />
are currently protected as well as areas that need protection because<br />
they are important areas for biodiversity i.e. CBA and ESA. Using<br />
the SPCs as set out in the PSDF will ensure consistency across the<br />
province (refer to Table 5.1 below).<br />
23 Section 26 of the MSA stipulates: An integrated development <strong>Plan</strong> must reflect - (e) a spatial development framework which must include the provision of<br />
basic guidelines for a land-use management system for the municipality.<br />
24 Available from www.capegateway.gov.za or DEADP Branches.
Table 5.1: Categories on the CBA Map and the corresponding <strong>Western</strong> <strong>Cape</strong> PSDF Spatial <strong>Plan</strong>ning Categories “Core and Buffer”. <strong>The</strong> classification of<br />
Other Natural Areas into the SPCs Buffer 1 or Buffer 2 is at the discretion of Town and Regional <strong>Plan</strong>ners.<br />
CBA Map<br />
Category →<br />
PSDF SPC “Core<br />
and Buffer” →<br />
Formal Protected<br />
Areas<br />
Critical Biodiversity<br />
Areas (terrestrial/<br />
Aquatic)<br />
<strong>The</strong> CBA Map and guidelines provide crucial information which assist<br />
in the development of an SDF, namely:<br />
• Strategic Environmental Assessment26 (SEA): According to<br />
legislation27 , SDFs should include an SEA and must be aligned<br />
with those of neighbouring municipalities. A municipal SEA<br />
identifies areas where particular development types can occur<br />
and “red-flags” or cautions against development in sensitive<br />
areas. <strong>The</strong> CBA Map provides more accurate spatial information<br />
and policy guidelines for incorporation into an SEA map.<br />
• Urban Edge Demarcationg : <strong>The</strong> SDF must delineate urban<br />
edges around existing urban nodes to protect the rural<br />
environment from urban sprawl and to encourage efficient<br />
settlement patterns. <strong>The</strong> CBA Map should be used to delineate<br />
the urban edge.<br />
• Zoning Schemesg identify areas where development<br />
should not take place, “to protect the special natural and<br />
environmental characteristics of an area…and to promote<br />
sustainable development”. Furthermore, their ‘implementation<br />
has to be consistent with, and give effect to, the SDF’ (adapted<br />
from the <strong>Western</strong> <strong>Cape</strong> Provincial Zoning Scheme Model<br />
By-Law, 2004). Section 4(1) and 36(2) of LUPO requires the<br />
conservation and preservation of the natural environment.<br />
When zoning schemes are revised or where rezoning or<br />
subdivision applications are being processed, a CBA Map<br />
should be consulted in order to avoid environmentally sensitive<br />
areas.<br />
• Environmental Management Frameworksg (EMF) designate<br />
areas on a map where development can or cannot occur<br />
without an authorization, thereby streamlining the process<br />
of authorising development. EMFs also provide management<br />
priorities. <strong>The</strong> CBA Map can inform both these aspects.<br />
• Urban Open Space Systems provide ecosystem services at<br />
the local level e.g. clean air, fresh water, wastewater purification,<br />
flood protection and recreational space. <strong>The</strong> CBA Map assists in<br />
identifying certain areas that provide ecosystem services within<br />
urban settlements.<br />
• Policy guidelines: <strong>The</strong> land and water resource use guidelines<br />
(Section 4.2, 4.3 and 4.4) provide key policy recommendations<br />
for input into an SDF Land Use Management System.<br />
Ecological Support<br />
Areas<br />
CORE 1 CORE 1 CORE 2<br />
Other Natural<br />
Areas<br />
BUFFER 1<br />
or BUFFER 2<br />
47<br />
No Natural Areas<br />
Remaining<br />
INTENSIVE<br />
AGRICULTURE 25 or<br />
SETTLEMENT<br />
<strong>The</strong> CBA Map and guidelines can be used to guide the location<br />
and nature of development and conservation, whilst aligning<br />
with adjacent municipal SDFs. <strong>The</strong>se products also promote<br />
the establishment of ‘Sustainable Human Settlements’ g by<br />
encouraging nodal development and protecting ecosystem<br />
services. Refer to the GIS map for the recommended Spatial<br />
<strong>Plan</strong>ning Category map provided on the DVD.<br />
5.3 MULTI-SECTORAL PLANNING: INTEGRATED<br />
DEVELOPMENT PLANS (IDP)<br />
<strong>The</strong> Biodiversity <strong>Sector</strong> <strong>Plan</strong> should be used in various multisectoral<br />
planning procedures to promote sustainable development,<br />
especially at the municipal level. It forms the basis of a bioregional<br />
plan g (in terms of the NEMBA) which, once gazetted, must be used to<br />
inform all multi-sectoral planning.<br />
<strong>The</strong> Integrated Development <strong>Plan</strong> (IDP) reflects multi-sectoral<br />
planning at the municipal level. It must comply with the<br />
‘Environmental Right’ of the Constitution (Section 24) and the<br />
NEMA principles (Section 2). In order to ensure environmental<br />
sustainability 28 , it usually includes an Environmental <strong>Sector</strong> <strong>Plan</strong> (or<br />
Integrated Environmental Management Programme).<br />
Part of the Environmental <strong>Sector</strong> <strong>Plan</strong> (see Section 5.3.1 below) can<br />
comprise a range of environmental management tools to promote<br />
sustainability and compliance with various pieces of legislation. <strong>The</strong><br />
Biodiversity <strong>Sector</strong> <strong>Plan</strong> (or published Bioregional <strong>Plan</strong>) should be<br />
used as the input from the biodiversity sector into the Environmental<br />
<strong>Sector</strong> <strong>Plan</strong> (Figure 5.1).<br />
25 <strong>The</strong> proposed PSDF category which includes areas that are currently under cultivation, have been cultivated in the last 10 years or represent areas that have<br />
agricultural potential.<br />
26 DEAT has published (1) A Guideline Document - Strategic Environmental Assessment in South Africa (2000); and (2) Strategic Environmental Assessment<br />
Guideline - Integrated Environmental Guideline Series 4 (2007).<br />
27 Local Government: Municipal <strong>Plan</strong>ning and Performance Management Regulations 21 (published in terms of section 120 of the Municipal Systems Act).<br />
28 Refer to ‘<strong>The</strong> <strong>Western</strong> <strong>Cape</strong>: IDP Environmental Toolkit Handbook: Making the IDP Sustainable’ and ‘A Pathway to sustainability: Local Agenda 21’ Prepared by<br />
the Environmental Evaluation Unit (University of <strong>Cape</strong> Town) for the Department of Environmental Affairs and Tourism.
BIODIVERSITY SECTOR PLAN<br />
[Based on a systematic finescale<br />
biodiversity plan]<br />
BIOREGIONAL PLAN<br />
in terms of the NEMBA<br />
MULTI-SECTORAL PLANNING<br />
INTEGRATED DEVELOPMENT PLAN<br />
[ALL PHASES]<br />
and<br />
SPATIAL DEVELOPMENT FRAMEWORK<br />
[LAND USE MANAGEMENT SYSTEM and<br />
ZONING SCHEMES]<br />
Figure 5.1: How the Biodiversity <strong>Sector</strong> <strong>Plan</strong> can be used in municipal planning. <strong>The</strong> SDF is the tool that integrates all sector plans in the IDP<br />
process.<br />
<strong>The</strong> Biodiversity <strong>Sector</strong> <strong>Plan</strong> provides a CBA Map and guidelines for<br />
use in developing the IDP through the SDF. <strong>The</strong> SDF (see section<br />
5.2 above) indicates the location of identified projects during the<br />
‘projects phase’ of the IDP, thereby integrating the two processes (see<br />
Table 5.2 below), including the various sector plans (e.g. transport,<br />
water). <strong>The</strong> CBA and ESA should be the spatial focus of biodiversity<br />
conservation projects identified in the projects phase. See Section<br />
5.3.1.9 (pg 51).<br />
THE IDPs ENVIRONMENTAL SECTOR PLAN<br />
Integrating CBAs and ESAs into environmental projects or programmes for<br />
integrated development planning<br />
ENVIRONMENTAL MANAGEMENT<br />
FRAMEWORK<br />
INTEGRATED COASTAL<br />
MANAGEMENT PLAN<br />
STRATEGIC ENVIRONMENTAL<br />
ASSESSMENT<br />
STATE OF ENVIRONMENT REPORTS<br />
LAND AND WATER USE<br />
APPLICATIONS<br />
IDENTIFYING CBAs and ESAs FOR -<br />
Stewardship, Rates exemptions<br />
andother biodiversity projects for<br />
LED; including municipal<br />
environmental management<br />
plans, urban open space systems,<br />
urban edge demarcation, alien<br />
clearing, agriculture sector plans,<br />
cooperative governance<br />
For additional information on managing for environmental<br />
sustainability at the municipal level, refer to Section 4 of the<br />
Putting Biodiversity <strong>Plan</strong>s to Work Booklets (Job and Driver,<br />
2006) and the STEP Handbook (Pierce and Mader, 2006).<br />
Contact the BGIS Unit: 021 799 8738 or <strong>bgis</strong>help@<strong>sanbi</strong>.org.<br />
<strong>The</strong> STEP handbook can be downloaded from http://<strong>bgis</strong>.<strong>sanbi</strong>.<br />
org/STEP/project.asp.
Table 5.2: A guide to incorporating the <strong>Garden</strong> <strong>Route</strong> Biodiversity <strong>Sector</strong> <strong>Plan</strong> into integrated development planning (IDP) and spatial development<br />
frameworks (SDF); as adapted from the STEP Handbook (Pierce and Mader, 2006):<br />
IDP Phases Basic elements in developing the SDF<br />
Phase 1: Analysis<br />
Gather all information.<br />
Analyse information for -<br />
i) trends; and<br />
ii) issues that can be shown on a map.<br />
Identify needs, including normalisation after<br />
apartheid, transport etc.<br />
Report for public comment.<br />
Phase 2: Strategy<br />
Identify vision, mission, objectives,<br />
strategies for dealing with needs, problems<br />
and issues, such as Local Economic<br />
Development (LED), poverty alleviation, the<br />
natural environment, possible projects.<br />
Reports for public comment.<br />
Phase 3: Projects<br />
Identify priorities, refine projects. Prioritise<br />
projects and finances, which together<br />
influence the SDF. Assess environmental<br />
impacts of projects.<br />
Phase 4: Integration<br />
5-yr financial plan and programmes<br />
for capital investment, integrated LED,<br />
environment (including biodiversity),<br />
poverty alleviation, gender equity etc.<br />
Draft IDP report for public comment.<br />
Phase 5: Approval<br />
Final IDP report approved based on the<br />
Critical Biodiversity Areas Map and other<br />
BSP information.<br />
Biodiversity importance of land (or category<br />
on the CBA Map), current land-use, agriculture,<br />
the built environment, infrastructure, transport<br />
routes, watersheds, geology etc., heritage sites,<br />
State of Environment Reporting, Strategic<br />
Environmental Assessment.<br />
i) trends (e.g. the direction in which the town is<br />
growing, land suitable for development);<br />
ii) issues (e.g. a need for housing, schools or a<br />
clinic in a certain area; protecting ecosystem<br />
services).<br />
Critical Biodiversity Areas Map indicates:<br />
Priority areas for conservation, opportunities<br />
and constraints on developments.<br />
Report(s) for public comment.<br />
Critical Biodiversity Areas Map indicates<br />
areas where restoration projects or other<br />
biodiversity related projects for poverty<br />
alleviation can take place e.g. SANParks People<br />
and Conservation, Working for Water etc.<br />
Draft report and map based on the Critical<br />
Biodiversity Areas Map with overlying<br />
infrastructure and land-uses, sites for integrated<br />
projects (e.g. large scale housing development,<br />
poverty alleviation projects e.g. restoration),<br />
open spaces, urban edge, development nodes,<br />
corridors, cemeteries, waste sites, social and<br />
emergency services.<br />
Draft SDF report and map for public comment.<br />
Final SDF report and map approved based<br />
on the Critical Biodiversity Areas Map and<br />
other BSP information.<br />
49<br />
Use of the <strong>Garden</strong> <strong>Route</strong> Biodiversity<br />
<strong>Sector</strong> <strong>Plan</strong> (CBA Map and guidelines)<br />
<strong>Plan</strong>ners and decision-makers use the<br />
<strong>Garden</strong> <strong>Route</strong> Biodiversity <strong>Sector</strong><br />
<strong>Plan</strong> (Critical Biodiversity Areas Map<br />
and guidelines) to identify which<br />
areas to develop and which to leave<br />
undeveloped and conserved.<br />
<strong>Plan</strong> which areas to develop and which<br />
to leave undeveloped and conserved.<br />
Identify areas for restoration projects, or<br />
other biodiversity related projects.<br />
Provincial officials, NGOs and public to<br />
ensure that the Biodiversity <strong>Sector</strong><br />
<strong>Plan</strong> is upheld.<br />
Councillors, municipal officials, provincial<br />
officials, NGOs and public to ensure that<br />
the Biodiversity <strong>Sector</strong> <strong>Plan</strong> is upheld.<br />
* <strong>The</strong> IDP and SDF should therefore be integrated both from a time-line and content perspective, as indicated in the table above
5.3.1 THE ENVIRONMENTAL SECTOR PLAN OF THE IDP<br />
<strong>The</strong> Biodiversity <strong>Sector</strong> <strong>Plan</strong> is only one component of the<br />
Environmental <strong>Sector</strong> <strong>Plan</strong> which covers a range of environmental<br />
management issues e.g. control of wastewater discharge, air<br />
pollution.<br />
<strong>The</strong> Environmental <strong>Sector</strong> <strong>Plan</strong> of the IDP comprises projects or<br />
programmes that aim at achieving environmental sustainability.<br />
<strong>The</strong>se can be mechanisms or tools for ensuring the protection of<br />
CBA and ESA. Note that this is not an exhaustive list of all potential<br />
environmental projects.<br />
5.3.1.1 MUNICIPAL COASTAL MANAGEMENT PROGRAMMES<br />
In terms of the Integrated Coastal Management Act, No 24 of 2009,<br />
each coastal municipality must secure public access to coastal public<br />
property, compile a municipal coastal management programme29 (which may form part of their adopted IDP and SDF) and may<br />
establish a Coastal Zoning Scheme. <strong>The</strong> CBA Map defines the 1<br />
km coastal protection zone, assists with informing municipal SDFs<br />
and zoning schemes; and, as a consequence, municipal coastal<br />
management programmes. It also identifies formal Protected Areas<br />
and can assist with identifying coastal access land.<br />
5.3.1.2 STATE OF THE ENVIRONMENT REPORTING<br />
A key mechanism in monitoring the state of biodiversity in a<br />
municipality is a State of Environment Report (SOER). <strong>The</strong> SOER<br />
uses indicators to monitor improvement or deterioration of<br />
environmental conditions, and provides recommendations for areas<br />
of concern. <strong>The</strong> Biodiversity <strong>Sector</strong> <strong>Plan</strong> can be used to inform the<br />
SOER as it provides information on the extent of CBA and ESA (see<br />
Table 3.2 pg 31). Municipalities are therefore encouraged to record<br />
the conservation or loss of CBA and ESA.<br />
Loss of natural habitat within each mapped category could be<br />
recorded by the municipality at the time of processing each<br />
development application, allowing for the evaluation of future<br />
applications. Applicants could provide the final approved<br />
development area (ha) as a GIS shapefileg (map) for inclusion into<br />
the municipal Land-use Management System. This will assist in the<br />
monitoring of the CBA Map.<br />
Other indicators30 could include:<br />
• protection levels of CBA and ESA (how many hectares / what<br />
percentage are formally protected);<br />
• how effectively are CBA and ESA protected in the municipal<br />
zoning scheme (i.e. what portion of CBA and ESA are<br />
appropriately zoned);<br />
• the extent (in hectares) of invasive alien plant species clearing;<br />
and<br />
• the number or proportion of threatened or extinct species, and<br />
threatened ecosystems listed by NEMBA.<br />
<strong>The</strong> biodiversity indicators identified in a published bioregional<br />
plan must be used in municipal SOERs.<br />
5.3.1.3 AN ENVIRONMENTAL MANAGEMENT PLAN FOR<br />
MUNICIPAL-OWNED LAND<br />
<strong>The</strong> management of natural resources is a cross-cutting exercise,<br />
requiring the collaboration of a range of agencies and departments<br />
(e.g. SANParks, <strong>Cape</strong>Nature, DWEA, DoA). <strong>The</strong>se agencies should<br />
provide assistance to municipalities in developing management<br />
plans for all municipal-owned land that include CBA and ESA. In<br />
addition, projects with biodiversity benefits (e.g. invasive alien plant<br />
clearing, eco-tourism, sustainable medicinal harvesting) can be<br />
identified and implemented as part of IDP and LED processes (see<br />
section 5.3.1.9 below). Refer to Section 7 for agencies that can help<br />
protect and manage biodiversity (pg 55).<br />
5.3.1.4 A MUNICIPAL INVASIVE ALIEN SPECIES CONTROL PLAN<br />
Infestations of invasive alien plants pose serious threats to municipal<br />
infrastructure and functioning, as well as to biodiversity. <strong>The</strong>ir<br />
massive fuel loads often lead to uncontrollable fires, and they reduce<br />
water supply and spoil scenery, impacting negatively on tourism and<br />
agricultural potential. Municipalities are responsible for preparing<br />
an invasive species control plan for municipal-owned land as part of<br />
their IDP and for controlling listed invasive species on municipal land<br />
(in terms of NEMBA Sections 76(2) and 73(2) respectively). <strong>The</strong>y are<br />
encouraged to form partnerships with agencies involved in clearing<br />
invasive species, such as SANParks, DWEA, <strong>Cape</strong>Nature and DoA.<br />
5.3.1.5 AREA WIDE PLANNING<br />
<strong>The</strong> Biodiversity <strong>Sector</strong> <strong>Plan</strong> can be used as the biodiversity informant<br />
to Area Wide <strong>Plan</strong>s (AWPs). AWPs map existing farm lands, potential<br />
agricultural expansion areas and important natural areas to identify<br />
possible conflict areas and to ensure biodiversity is protected for<br />
sustainable agricultural development. Although the LandCare Area<br />
Wide <strong>Plan</strong>ning process is a DoA process, municipalities which have<br />
a strong agricultural economy could request AWPs as part of their<br />
agricultural sector plans.<br />
5.3.1.6 USING FINANCIAL MEASURES TO PROTECT BIODIVERSITY<br />
AND PROMOTE SUSTAINABLE DEVELOPMENT<br />
Opportunities to promote the protection of biodiversity are<br />
presented by the Municipal Property Rates Act31 (6 of 2004). In<br />
terms of Chapter 2, the council of a municipality must adopt a<br />
policy consistent with the Act on the levying of rates on rateable<br />
property in the municipality (Section 3). In the case of private land<br />
that includes CBA and ESA, municipalities can encourage sound<br />
management of biodiversity by applying the following:<br />
• Rates Exemption: this may be applied on land where there is a<br />
conservation management plan, a contractual agreement and<br />
title deed restrictions (i.e. not a formal protected area in terms<br />
of the Protected Areas Act, which is subject to ‘rates exclusions’).<br />
• Rates Rebate: where there is a conservation management<br />
plan, the rebate agreement is short-term (e.g. 5 years) and<br />
is at least on a par with the agricultural rebate extended to<br />
landowners in some areas.<br />
29 To be compiled within 4 years of the establishment of the Act.<br />
30 Refer National DEAT Guidelines: National Core Set of Environmental Indicators for state of environment reporting in South Africa (CSIR, 2001).<br />
31 See also Botha, M., 2004. Environmental analysis of the Property Rates Act (Act no. 6 of 2004). Botanical Society Conservation Unit. See Section 7 pg 55 of<br />
this handbook for contact details.
• Rates Re-evaluation: where the valuation system reflects a<br />
reduction in property value (for rates purposes) if the land is<br />
managed for conservation. <strong>The</strong> municipality can approach a<br />
landowner with a proposal of environmental servitude and<br />
re-evaluation. If the land owner agrees, a notarial deed is drawn<br />
up, and upon signature, the municipality can revalue the land.<br />
• Not reducing land value (and therefore rates) where land is<br />
infested with invasive alien species; nor increasing rates where<br />
land contains CBA and ESA.<br />
CBA and ESA should be used to inform biodiversity rates<br />
exemptions, rebates and re-evaluations, including the<br />
valuation of land. <strong>The</strong>y should be accurately delineated by<br />
municipalities (in consultation with conservation agencies) to<br />
prevent indiscriminate applications for rebates or exemptions.<br />
<strong>The</strong> Revenue Laws Amendment Act (60 of 2008) sets out<br />
income tax deductions for landowners who preserve<br />
biodiversity on their land. Policy changes are underway that<br />
are intended to allow landowners to receive income tax rebates<br />
for conservation management costs (and even capital costs<br />
for long term agreements); if they have signed a Biodiversity<br />
Agreement, are part of a Protected Environment or are<br />
included within a Contractual Nature Reserve or National Park.<br />
5.3.1.7 PROTECTING BIODIVERSITY THROUGH STEWARDSHIP<br />
<strong>The</strong> National Environmental Management: Protected Areas Act<br />
(NEMPA) 57 of 2003 provides for any land, including private,<br />
communal or municipal land, to be declared a formal Protected<br />
Area, and allows for co-management of such a Protected Area by<br />
the landowner(s) or any suitable person or organisation. Stewardship<br />
Programmes (e.g. <strong>Cape</strong>Nature) work with private landowners and<br />
municipalities to secure CBA and ESA as formal Protected Areas,<br />
namely Contract Nature Reserves, National Parks or Protected<br />
Environments; or through other suitable stewardship options.<br />
Significant benefits and incentives are available to landowners of<br />
formal Protected Areas. Municipalities should facilitate stewardship<br />
in CBA and ESA through rates exclusions etc., (see Section 5.3.1.6<br />
above).<br />
All formal Protected Areas are eligible for rates exclusions in terms<br />
of the Municipal Property Rates Act (6 of 2004). <strong>The</strong> National<br />
Biodiversity Framework promotes the establishment and<br />
strengthening of provincial stewardship programmes and identifies<br />
local authorities as one of the lead agents. CBA and ESA are an<br />
important focus for stewardship programmes.<br />
5.3.1.8 CO-OPERATIVE MANAGEMENT MEASURES FOR<br />
PROTECTING BIODIVERSITY<br />
51<br />
• Catchment Management Agencies (CMA): <strong>The</strong> delegation<br />
of water resource management and protection from central<br />
government to catchment level is being achieved through the<br />
establishment of CMA 32 . <strong>The</strong>se agencies comprise all relevant<br />
water users. <strong>The</strong> Biodiversity <strong>Sector</strong> <strong>Plan</strong> is the precursor to a<br />
bioregional plan and should therefore be incorporated into<br />
the work of CMA, as indicated by the National Biodiversity<br />
Framework (2009).<br />
• Fire Protection Associations (FPA): FPA are voluntary<br />
associations that may be formed by landowners to prevent,<br />
predict, manage and extinguish veldfires under the National<br />
Veld and Forest Fire Act (101 of 1998). Municipalities are obliged<br />
to be members and should encourage landowners to join their<br />
local FPA. <strong>The</strong> Department of Forestry assists with developing<br />
area-specific Fire Action <strong>Plan</strong>s. <strong>The</strong> Biodiversity <strong>Sector</strong> <strong>Plan</strong> can<br />
be used to inform Fire Action <strong>Plan</strong>s (visit www.firewisesa.org.za).<br />
• Co-operative Governance: Conservation agencies such as<br />
<strong>Cape</strong>Nature, SANParks and provincial authorities (DWEA, DoA<br />
and DEADP), together with municipalities, should investigate<br />
possible structures for this purpose. Such cooperative<br />
management measures are promoted by the National<br />
Biodiversity Framework (Section 4.2.6); and the NEMA Principle<br />
which states that there must be intergovernmental coordination<br />
and organization of policies, legislation and actions<br />
relating to the environment. <strong>The</strong> CBA Map and guidelines serve<br />
as the common reference point for cooperative governance<br />
in relation to biodiversity and sustainable development.<br />
See Section 7 ‘Agencies that can help protect and manage<br />
biodiversity’ below (pg 55).<br />
5.3.1.9 PROTECTING BIODIVERSITY AND SUPPORTING LOCAL<br />
ECONOMIC DEVELOPMENT (LED)<br />
Biodiversity-compatible LED includes a range of activities which<br />
should be focused in CBA and ESA, such as alien clearing, wetland<br />
rehabilitation, community-based tourism projects, craft markets<br />
based on sustainable harvesting, wildflower harvesting, bee farming,<br />
natural products sector (medicinal herbs, aromatherapy oils etc),<br />
the protection of eco-tourism assets and protected areas. <strong>The</strong><br />
Biodiversity <strong>Sector</strong> <strong>Plan</strong> also provides a mechanism for streamlining<br />
land-use decision-making outside of CBA and ESA, thereby<br />
contributing to ASGISA 33 whilst ensuring that economic growth does<br />
not compromise our natural capital (see Section 1.7 pg 5).<br />
<strong>The</strong> craft sector in the <strong>Western</strong> <strong>Cape</strong> generates over R100 million<br />
annually, while providing employment to 18 000-28 000 people.<br />
32 Refer to the Guidelines for the development of Catchment Management Strategies http://www.dwaf.gov.za/<br />
33 <strong>The</strong> ‘Accelerated and Shared Growth Initiative for South Africa’ is a national initiative supported by key groups in the economy that aim to halve<br />
unemployment and poverty by 2014 by achieving 6% growth per year by 2010.
<strong>The</strong>re are programmes that assist with protecting biodiversity, while<br />
creating jobs, and are implemented by various government agencies.<br />
Some of these are:<br />
• People and Conservation (SANParks)<br />
• People and Parks (Environmental Affairs Department of DWEA)<br />
• LandCare (Agricultural Department of DAFF)<br />
• Working for Water (Water Affairs Department of DWEA,<br />
SANParks)<br />
• Working for Fire (Forestry Department of DAFF)<br />
• Working for Wetlands (Water Affairs Department of DWEA and<br />
SANBI)<br />
• Working for the Coast (Water Affairs Department of DWEA).<br />
Most of these programmes fall within the Expanded Public Works<br />
Programme led by the Department of Public Works (visit www.epwp.<br />
gov.za). Municipalities, with the assistance of other agencies, could<br />
encourage the development of small scale community projects<br />
that provide benefits for poor rural and urban communities and the<br />
environment. Further details on biodiversity and job creation can be<br />
obtained from the STEP Handbook (Pierce and Mader, 2006).<br />
1<br />
<strong>The</strong> BSP assists municipalities in complying with environmental<br />
and planning legislation, which promote the protection and<br />
management of biodiversity for SUSTAINABLE DEVELOPMENT<br />
(See the Legislative User Guide).<br />
Projects related to the safeguarding or restoring of<br />
biodiversity should be located in CBA and ESA.<br />
In this way, the CBA Map enables the identification of IDP projects and supports LED and poverty alleviation,<br />
while promoting sustainable economic growth.
Frequently Asked Questions<br />
6<br />
1. What if the CBA map or associated maps (e.g. land cover map)<br />
indicate that the property is located within a CBA or ESA but the site<br />
visit reveals that the property is degraded or that no natural habitat<br />
(transformed) occurs on the site?<br />
<strong>The</strong>re are a number of possible explanations for this:<br />
If there is a match between site conditions and the land cover map, then the CBA Map is correct.<br />
(a) Example A: <strong>The</strong> site is categorized as a CBA, the land cover category is degraded and the physical site<br />
assessment reveals that the property is degraded.<br />
- A large number of degraded sites are deliberately classified as CBA. In these cases the land-cover<br />
map will show the site as degraded. <strong>The</strong> systematic planning process ‘chooses’ pristine (natural)<br />
vegetation over degraded vegetation unless there are no more options or no more pristine sites<br />
left, i.e. when irreplaceable features are present on a degraded site, the national biodiversity<br />
threshold cannot be met elsewhere (therefore the degraded site becomes critical for meeting<br />
thresholds) or where an area is required for ecological processes e.g. landscape corridors. In<br />
such a case, the management guideline is to rehabilitate if possible, and to discourage land-use<br />
activities that have any further impact on biodiversity.<br />
(b) Example B: <strong>The</strong> site is categorized as an ESA, the land cover category is degraded (or transformed)<br />
and the physical site assessment reveals that the property is degraded (or transformed).<br />
- Numerous degraded (e.g. invaded by invasive alien plants) and transformed areas (e.g.<br />
agricultural land) are categorized as ESA. <strong>The</strong> land-cover map will show the site as degraded<br />
or transformed. This is because they are currently or potentially still important for supporting<br />
ecological processes (e.g. riparian areas and floodplainsg, linkages important for pollination and<br />
animal movement). In such instances, the management guideline is to rehabilitate if possible,<br />
and to discourage further hardening of the land in transformed areas.<br />
If there is a mismatch between site conditions and the land cover map, then the CBA Map is in<br />
question.<br />
- <strong>The</strong> site may have been incorrectly classified as CBA/ESA due to an error in the land cover map,<br />
or alternatively a disturbance to the site has occurred subsequent to the development of the<br />
CBA Map. In these cases the site visit will show that the actual land cover on site is different<br />
to that indicated in the land cover map. <strong>The</strong> site must then be assessed for its potential to be<br />
rehabilitated and/or its role as part of a landscape corridor. Further, the proposed activity at the<br />
site should be investigated in terms of its potential impact on adjacent correctly classified CBA<br />
and ESA.<br />
<strong>The</strong> bottom line is that a suitably qualified specialist is needed to interpret the site in relation to the<br />
CBA Map and associated data (e.g. land cover, vegetation type, ecosystem status etc). Confirmation<br />
through a site visit i.e. ground- truthing is essential in all cases because a site that is infested with<br />
invasive alien species or otherwise degraded, may still be of great biodiversity significance.<br />
2.<br />
What if natural habitat is found on a site but this is not indicated on<br />
the land cover map (and therefore not classified as a CBA or ESA)?<br />
Such inaccuracies may result from inconsistencies in scale or classification error. If the map shows that no<br />
vegetation remains, but a site visit reveals the presence of natural habitat, refer to the vegetation data (GIS<br />
maps or CBA Mapbook) to determine the vegetation type and then determine its ecosystem status. If the<br />
vegetation type is Critically Endangered (CR), it is automatically a CBA and should have been classified as<br />
such. If the vegetation type is Endangered (E), the site is most likely a CBA. <strong>The</strong> site must then be assessed<br />
for the presence of features that would make it important for biodiversity conservation (e.g. wetlands,<br />
special habitats or Species of Special Concern), which would classify it as a CBA. By identifying these<br />
biodiversity features (selection criteria) in Table 3.1 (pg 30), it may be possible to determine the correct<br />
CBA Map status. <strong>The</strong> precautionary principle g , and all applicable objectives and recommended policies<br />
(Section 4 of this handbook) should still be applied during decision-making.<br />
53
3. Do ‘Other Natural Areas’ still require a<br />
biodiversity assessment?<br />
Yes, in Other Natural Areas it is important to check for special<br />
biodiversity features, e.g. wetlands or Species of Special Concern.<br />
Knowledge of special features or species is incomplete, and therefore<br />
it is critical to verify that they do not occur on the site e.g. not all<br />
wetlands have been mapped.<br />
4. How does ecosystem status relate to the<br />
CBA Map?<br />
All natural intact patches of Critically Endangered (CR) ecosystems<br />
or features are included as a CBA. For Endangered (E), Vulnerable (V)<br />
or Least Threatened (LT) vegetation types, the most efficient areas<br />
(i.e. on the least amount of land possible) that can meet national<br />
biodiversity thresholds have been included in CBA. All remaining<br />
areas are categorized as Other Natural Areas. This is done to ensure<br />
that an optimal layout of E, V and LT vegetation types is conserved<br />
and to prevent further fragmentation of these categories over time.<br />
5. How do Biodiversity Offsets g relate to the<br />
CBA Map?<br />
Critical Biodiversity Areas are ideal biodiversity offset receiving areas.<br />
<strong>Cape</strong>Nature, DEADP and/or SANParks should be consulted to identify<br />
CBA offset receiving areas. <strong>The</strong> ‘Provincial Guideline on Biodiversity<br />
Offsets’ is available at www.capegateway.gov.za/deadp.<br />
In order to ensure the achievement of safeguarding national<br />
biodiversity thresholds, no CBA (or part thereof ) or CR vegetation<br />
type should be lost to development. If this is unavoidable, such a<br />
loss should be offset so that thresholds for that vegetation type or<br />
other ecosystem type are minimized. It is likely that any loss of a CBA<br />
will require more area of land (than that covered by the CBA lost) to<br />
compensate for that loss.<br />
6. How do CBA and ESA affect existing landuse<br />
rights?<br />
CBA Maps cannot grant or take away existing land-use rights. <strong>The</strong>y<br />
are intended to inform proposed land-use changes.<br />
7. Will all CBA become Protected Areas?<br />
It is not feasible for all CBA to be formally conserved in Protected<br />
Areas. Nonetheless, it is extremely important that they are all<br />
afforded some protection through an appropriate mechanism.<br />
In addition to formal Protected Areas in terms of NEMPAA, other<br />
mechanisms include appropriate zoning (in terms of the Landuse<br />
<strong>Plan</strong>ning Ordinance) and other Conservation Areas, such as<br />
stewardship agreements or conservancies. CBA Maps will be used to<br />
inform the ideal location of future Protected Areas, priority landscape<br />
corridors, stewardship activities and conservancies etc.<br />
8. What does it mean if we lose a CBA?<br />
<strong>The</strong> CBA Map identified areas crucial for conserving critical<br />
biodiversity pattern and process thresholds on the least amount of<br />
land possible. <strong>The</strong> conversion of habitat within a CBA means that<br />
there will be a permanent loss of an important ecological feature or<br />
part (or whole) of a landscape corridor. Furthermore, that more land<br />
will be required to meet the same thresholds.<br />
9. Will the CBA Map ever change?<br />
<strong>The</strong> CBA Map is likely to remain generally the same, however landuse<br />
is dynamic and all maps need updating. It may be updated<br />
due to (1) errors in the land cover data used (which will affect the<br />
accuracy of the CBA Map boundaries), (2) unavoidable loss of CBA<br />
and ESA (additional areas would need to be identified to meet<br />
national biodiversity thresholds); and (3) improved biodiversity<br />
knowledge (e.g. identifying the location of special species). Note that<br />
if the map is used as the basis for a bioregional plan g, it would have<br />
to be updated every five years in terms of NEMBA. <strong>The</strong> current CBA<br />
network would form the basis for the update.<br />
10. How does the mapping of the <strong>Garden</strong><br />
<strong>Route</strong> vegetation types relate to that in<br />
other vegetation maps? For example the<br />
‘Vegetation of South Africa, Lesotho and<br />
Swaziland (Mucina and Rutherford, 2006)’,<br />
STEP and CAPE<br />
<strong>The</strong> <strong>Garden</strong> <strong>Route</strong> vegetation map should supersede any other<br />
vegetation maps. This is because the vegetation types have been<br />
mapped at a more accurate scale, namely 1:50 000. Furthermore,<br />
all fine-scale vegetation maps, such as the GR vegetation map, will<br />
eventually be incorporated into the national vegetation map.<br />
11. Are fine-scale biodiversity plans replacing<br />
broad-scale biodiversity plans (e.g. NSBA,<br />
CAPE, STEP)?<br />
Fine-scale biodiversity plans (i.e. the <strong>Garden</strong> <strong>Route</strong> CBA Map) provide<br />
more accurately mapped information for site-specific decisions (but<br />
still require verification). <strong>The</strong> most recent biodiversity plans at the<br />
finest scale should take precedence over other biodiversity plans<br />
when informing land-use planning and decision-making.
Agencies that can Help<br />
Protect and Manage Biodiversity<br />
7<br />
<strong>The</strong> management of natural resources and healthy ecosystems is a cross-cutting exercise that requires the<br />
coordination and collaboration of a range of conservation agencies. <strong>The</strong>ir input is required for detailed<br />
assessments and consideration of proposed impacts to biodiversity on specific sites. Agencies able to assist<br />
with biodiversity related inputs are listed below:<br />
South African National Parks (SANParks): <strong>The</strong> national<br />
authority for protected areas involved in incorporating<br />
biodiversity into land-use planning and decisionmaking,<br />
park planning and expansion; community<br />
projects and the management of National Parks (www.<br />
sanparks.co.za) - <strong>Garden</strong> <strong>Route</strong> Region (044) 302 5600<br />
(<strong>Plan</strong>ning and Implementation).<br />
<strong>Cape</strong>Nature/<strong>Western</strong> <strong>Cape</strong> Nature Conservation<br />
Board: This is the principal managing authority<br />
for biodiversity in the <strong>Western</strong> <strong>Cape</strong>, involved in<br />
commenting on decision-making where biodiversity<br />
may be impacted, as well as providing guidance on<br />
the incorporation of biodiversity concerns into landuse<br />
planning and decision-making and stewardship<br />
agreements (www.capenature.co.za – Scientific<br />
Services: Land-use Advisory Unit in George on (044) 802<br />
5328.<br />
South African National Biodiversity Institute (SANBI):<br />
<strong>The</strong> national body responsible for the management and<br />
conservation of South Africa’s biodiversity. It is involved<br />
in the implementation of bioregional programmes (e.g.<br />
C.A.P.E.), policy development, alien eradication, research<br />
and monitoring, including other conservation initiatives,<br />
such as the Custodians of Rare and Endangered<br />
Wildflowers or CREW (www.<strong>sanbi</strong>.org). - Pretoria Head<br />
Office (012) 843 5000 or Kirstenbosh (021) 799 8738.<br />
<strong>The</strong> Biodiversity GIS (BGIS) Unit: This unit is<br />
responsible for the management of SANBI’s spatial<br />
biodiversity planning information. It is the South African<br />
portal for the provision of biodiversity information in<br />
an easily accessible and freely available format on its<br />
website. All information relating to the biodiversity<br />
planning projects in South Africa can be downloaded or<br />
obtained from BGIS (www.<strong>bgis</strong>.<strong>sanbi</strong>.org) - <strong>Cape</strong> Town<br />
(021) 799 8738.<br />
Departments of Water and Environmental Affairs<br />
(DWEA) <strong>The</strong> principal national decision making<br />
and managing authorities for aquatic and terrestrial<br />
ecosystems respectively. <strong>The</strong> Department of<br />
Environmental Affairs (DEA) is involved in land-use<br />
decisions and the protection of biodiversity. <strong>The</strong>y also<br />
run various programmes that can assist municipalities<br />
in the protection of the environment (http://www.<br />
environment.gov.za/) - For the Local Government<br />
Support unit contact (012) 310 3042; National Branch<br />
(012) 310 3955. <strong>The</strong> Department of Water Affairs<br />
(DWA) is the custodian of aquatic ecosystems and<br />
is involved in water use decisions, including the<br />
55<br />
development of Fire Action <strong>Plan</strong>s, the rehabilitation of<br />
rivers and wetlands and the removal of alien invasive<br />
species (www.dwaf.gov.za) – National Branch (012) 336<br />
7500– <strong>Cape</strong> Town (021) 941 6000; Knysna Branch (044)<br />
302 6900.<br />
Department of Environmental Affairs and<br />
Development <strong>Plan</strong>ning (DEADP): <strong>The</strong> principal<br />
decision-making authority for development activities<br />
that impact on natural habitat in the <strong>Western</strong> <strong>Cape</strong>,<br />
including spatial planning, integrated environmental<br />
management, waste and pollution management,<br />
promoting sustainable resource-use and developing<br />
policy in this regard. <strong>The</strong> DEADP has developed a series<br />
of guidelines to assist with environmental decisionmaking,<br />
available at www.capegateway.gov.za - <strong>Cape</strong><br />
Town (021) 483 2700; George Branch (044) 874 2160.<br />
Department of Agriculture, Forestry and Fisheries<br />
(DAFF): <strong>The</strong> Department of Agriculture - LandCare/<br />
Area Wide <strong>Plan</strong>ning: This department supports farm<br />
planning, the clearing of invasive alien species, and<br />
encourages communities to adopt an ecologically<br />
sustainable approach to the management of the<br />
environment and natural resources, while improving<br />
their quality of life (www.nda.agric.za or www.wcape.<br />
agric.za) - <strong>Cape</strong> Town (021) 873 3523; George Branch<br />
(044) 803 3721; National Branch (021) 799 8790.<br />
<strong>The</strong> Department of Forestry is the principal national<br />
decision-making and managing authority for forest<br />
ecosystems, and is involved in the development of Fire<br />
Action <strong>Plan</strong>s – Knysna Branch (044) 302 6900.<br />
Botanical Society of South Africa (BotSoc): <strong>The</strong><br />
Conservation Unit of the Botanical Society undertakes<br />
strategic conservation projects, often in partnership with<br />
other organizations, to achieve long-term conservation<br />
and sustainable use of the greater <strong>Cape</strong> Floristic Region<br />
(www.botanicalsociety.org.za) - <strong>Cape</strong> Town (021) 797-<br />
2090 or info@botanicalsociety.org.za..<br />
<strong>Cape</strong> Action for People and the Environment<br />
(C.A.P.E.): A bioregional programme that aims to<br />
protect the biodiversity of the <strong>Cape</strong> Floristic Region<br />
whilst delivering significant benefits to the people of the<br />
region. <strong>The</strong> programme includes a long-term strategy<br />
and vision for biodiversity conservation in the region.<br />
Key executing agencies include <strong>Cape</strong>Nature, SANParks,<br />
DEADP, DWEA, the departments of Agriculture and<br />
Forestry (of DAFF), as well as SANBI and several NGOs<br />
(www.capeaction.org.za) - <strong>Cape</strong> Town (021) 799 8874 or<br />
info@capeaction.org.za.<br />
<strong>The</strong> CBA Map and guidelines are not intended to inform only EIAs, SDFs or other municipal planning<br />
tools. <strong>The</strong> information can also be used by local, provincial and national authorities to implement<br />
national and provincial policies, strategies and guidelines. <strong>The</strong> data provides the spatial and policy<br />
recommendations for promoting sustainable development, in terms of South African developmental<br />
and environmental policy and legislation. This demonstrates its usefulness as a COMMON REFERENCE<br />
point for policy developers, planners and decision-makers at all levels. See Section 1.5 (pg 4).
Glossary 34<br />
Aquatic features or ecosystems refer to rivers, wetlands and<br />
estuaries or natural water features.<br />
Aquifer Underground water-bearing areas.<br />
‘Best design’ refers to an identified network of natural sites that<br />
meet pattern and process thresholds in all vegetation types in a<br />
spatially efficient and ecologically robust way, and aim to avoid<br />
conflict with other activities (e.g. economic activity) where it is<br />
possible to achieve biodiversity thresholds elsewhere. <strong>The</strong> ‘best<br />
design’ sites include the largest, most intact, least disturbed,<br />
connected and/or adjacent areas required in terms of meeting<br />
pattern and process thresholds.<br />
Biodiversity <strong>The</strong> wide variety of plant and animal species in their<br />
natural environment. It not only refers to species (plants, animals<br />
and micro-organisms), but also to ecosystems, landscapes, and the<br />
ecological and evolutionary processes that allow biodiversity to<br />
persist over time. It includes the diversity within species, between<br />
species, and of ecosystems.<br />
Biodiversity offsets Conservation activities intended to<br />
compensate for the residual, unavoidable harm to biodiversity<br />
caused by development projects. It usually involves setting aside<br />
land in a similar ecosystem elsewhere, at the cost of the developer.<br />
See biodiversity receiving areas below.<br />
Biodiversity offset receiving areas <strong>The</strong>se are areas in the landscape<br />
that are selected to compensate for the unavoidable and negative<br />
impacts of a proposed development. <strong>The</strong>y are usually of equal or<br />
greater biodiversity importance to the area of land impacted on or<br />
lost.<br />
Biodiversity Pattern is the term for the way in which the<br />
components of biodiversity are spatially arranged, and in this<br />
document, refers to specific vegetation types or habitat types, e.g.<br />
forest or fynbos, a population of rare and endemic species, or other<br />
biodiversity features, e.g. a river, wetland (vlei). <strong>The</strong> habitat type or<br />
feature is home to specific animals, plants, birds, insects and other<br />
organisms, for example Blue Duiker in forests.<br />
Biodiversity <strong>Plan</strong>(ning) A map of information about biodiversity<br />
features (species, ecosystems, ecological processes), existing<br />
protected areas; current patterns of land-use; and potential and<br />
conflicting patterns of land-use. <strong>The</strong>se mapped features can be<br />
linked for further analysis using Geographic Information Systems<br />
(GIS) to identify areas of highest biodiversity importance and to<br />
determine priority areas for action.<br />
Biodiversity priority areas In this handbook the term refers to<br />
formal Protected Areas, Critical Biodiversity Areas and Ecological<br />
Support Areas.<br />
Biodiversity <strong>Sector</strong> <strong>Plan</strong> A tool which feeds into a range of multisectoral<br />
planning and assessment processes to inform land-use<br />
planning and decision-making. As a minimum, it should include a<br />
Critical Biodiversity Areas Map with all relevant GIS shapefiles, and<br />
a Biodiversity <strong>Sector</strong> <strong>Plan</strong> handbook with land-use management<br />
guidelines and a municipal biodiversity profile. It is the precursor to a<br />
gazetted bioregional plan. See ‘Bioregional <strong>Plan</strong>’ below.<br />
Biodiversity Threshold (or target) This threshold is, in essence, a<br />
target area which must be safeguarded in order for the component<br />
plants and animals to exist and for ecosystems to continue<br />
functioning (e.g. pollination, migration of animals). If the threshold<br />
for a feature is exceeded (i.e. the extent of the feature is reduced<br />
through human activities), the threat arises that ecosystems will<br />
deteriorate/collapse, which will severely impact on the delivery<br />
of ecosystem services. <strong>The</strong> thresholds drive the ‘amount’ of an<br />
ecosystem type selected on the CBA Map. It answers the query:<br />
‘How much do we need to achieve a living landscape’ (e.g. number<br />
of hectares).<br />
Bioregion A land and water territory, the limits of which are not<br />
politically bound, but which are defined by the geographical<br />
boundaries of human communities and ecological systems. Also<br />
a geographical space that contains one whole, or several nested,<br />
ecosystems characterised by landforms, vegetative cover, human<br />
culture and history as identified by local communities, governments<br />
and scientists.<br />
Bioregional <strong>Plan</strong> (published in terms of the NEMBA) A<br />
bioregional plan is based on a systematic fine-scale biodiversity<br />
plan (ideally at a scale of 1: 50 000 or less), and includes a Critical<br />
Biodiversity Areas map and land and water resource use guidelines.<br />
As a result, the CBA Map, associated guidelines and this handbook<br />
form the basis for the compilation of a bioregional plan. <strong>The</strong><br />
compilation and monitoring of bioregional plans is usually<br />
the responsibility of the conservation authority or provincial<br />
environmental department or of a municipality, if the capacity exists.<br />
Municipalities must be consulted in the publishing process. After<br />
its publication, the bioregional plan must be taken into account<br />
in all future planning by a municipality. A bioregional plan should<br />
be compiled for a municipality or cluster of municipalities. Refer to<br />
the ‘Guideline regarding the Determination of Bioregions and the<br />
Preparation and Publication of Bioregional <strong>Plan</strong>s’.<br />
Bioregional planning refers to land-use planning and management<br />
that promotes sustainable development by recognising the<br />
relationship between, and giving practical effect to, environmental<br />
integrity, human-well-being and economic efficiency within<br />
a defined geographical space, the boundaries of which are<br />
determined in accordance with environmental and social criteria. It is<br />
an internationally recognised planning concept aimed at achieving<br />
sustainable development.<br />
Cadastral unit A single property or erf.<br />
<strong>Cape</strong> Floristic Region (CFR) <strong>The</strong> <strong>Cape</strong> Floristic Region is a region<br />
of 90 000 km2 that extends from Nieuwoudtville southwards to<br />
<strong>Cape</strong> Town and then eastwards to Grahamstown. Most of this vast<br />
region is covered in fynbos, while the remaining areas are covered<br />
in renosterveld, forest, succulent karoo or thicket. <strong>The</strong> region<br />
holds close to 9 000 plant species, most of which grow in fynbos<br />
34 Part of this glossary is drawn from the Putting Biodiversity <strong>Plan</strong>s to Work (Job and Driver, 2006) and the Eastern <strong>Cape</strong> Biodiversity Conservation <strong>Plan</strong><br />
(Berliner and Desmet, 2008).
vegetation. <strong>The</strong> region coincides with the area known as the <strong>Cape</strong><br />
Floral Kingdom that originates from an old system of classification<br />
which divided the world into six major plant kingdoms, based on<br />
their number of endemic plant families, genera and species, and<br />
which recognised the <strong>Cape</strong> as the smallest in area, yet one of the<br />
richest in species. <strong>The</strong> Kingdom concept is considered outdated by<br />
modern botanists, but it still holds charm amongst plant enthusiasts.<br />
Carbon storage (or carbon sequestration) is the storage of carbon<br />
dioxide or other forms of carbon through biological, chemical or<br />
physical processes. This reduces the impact of carbon, a greenhouse<br />
gas, on climate change. In this handbook carbon storage refers to<br />
the storage of carbon in plants (via biological processes).<br />
Catchment A catchment is the area (a geographical region) where<br />
water from rain (or snow) becomes concentrated and drains<br />
downhill into a river or lake. <strong>The</strong> term includes all land surface,<br />
streams, rivers, and lakes between the source and where the water<br />
enters the ocean.<br />
Coastal protection zone In terms of Section 16 of the Integrated<br />
Coastal Management Act, this zone includes (amongst others), land<br />
that is situated within 1km or 100m of the high water mark, any<br />
coastal wetland, lake or dam and land which is situated within the<br />
1:50 year flood line. <strong>The</strong>se areas cannot be developed without an<br />
authorization in terms of the Act.<br />
Connectivity “Functional” connectivity refers to the ability of<br />
connective corridors to sustain ecosystem processes common to<br />
linked patches (it is the opposite of fragmentation).<br />
Conservancy Agreements for co-operation among neighbouring<br />
landowners for conservation purposes, and which require no legal<br />
long-term commitment from landowners.<br />
Conservation <strong>The</strong> safeguarding of biodiversity and its processes<br />
(often referred to as biodiversity conservation).<br />
Conservation areas (in the context of this document) Land<br />
under some form of conservation agreement other than those via<br />
the NEMPAA. <strong>The</strong>y are not considered formally protected areas, as<br />
they are not gazetted in terms of the NEMPAA and do not allow for<br />
long term security of tenure. For example Private Nature Reserves<br />
declared in terms of provincial ordinances, Biodiversity Agreements<br />
in terms of the Biodiversity Act, and conservancies.<br />
Corridor/s - see ecological process area<br />
Critical Biodiversity Areas (CBA) <strong>The</strong>se are terrestrial (land)<br />
and aquatic (water) features (e.g. vleis, rivers and estuaries) in<br />
the landscape that are critical for conserving biodiversity and<br />
maintaining ecosystem functioning in the long term (which is<br />
particularly important in the face of climate change). <strong>The</strong>y are<br />
identified through a systematic biodiversity planning approach (see<br />
below).<br />
Critical Biodiversity Areas Map A fine-scale systematic biodiversity<br />
plan that delineates on a map Critical Biodiversity Areas and<br />
Ecological Support Areas which require safeguarding to ensure<br />
the continued existence of biodiversity, its ecological processes<br />
(e.g. animal migration, pollination) and its ecosystem services e.g.<br />
57<br />
water supply. <strong>The</strong> map also delineates formal Protected Areas, Other<br />
Natural Areas and No Natural Areas Remaining.<br />
Delineate [a wetland] Determine the boundary of a wetland based<br />
on soil, vegetation, and/or hydrological indicators.<br />
Degraded landscapes are areas of indigenous habitat that are<br />
infested with alien plants, overgrazed or have been impacted in<br />
some other manner. <strong>The</strong>se areas are still able to function ecologically<br />
(e.g. animals still make use of these areas); albeit in a deteriorated<br />
stated. Degraded areas have the potential to be restored or<br />
rehabilitated.<br />
Demand control Controlling the use of water to ensure that the<br />
volume of water use for domestic, industrial and other uses by<br />
society is reduced and controlled. This is implemented through<br />
various mechanisms, such as recycling, re-use of water, limiting<br />
water use to certain periods etc.<br />
Ecological process Natural operations which occur within<br />
ecosystems and maintain them as working systems. Ecosystems<br />
work because they are kept “alive” by ecological processes such as<br />
pollination, nutrient cycling, natural disturbance (e.g. fire, grazing),<br />
migration of species, and soil maintenance. Other examples of<br />
processes include plant-herbivore processes, lowland to upland<br />
gradients, predator-prey relationships, migration and exchange<br />
between inland and coastal systems (often along river corridors),<br />
seasonal migration of animals, and hydrological regimes (e.g. rivers,<br />
wetlands).<br />
Ecological process areas are important for maintaining ecological<br />
processes (see above). <strong>The</strong>se can either be large scale corridors<br />
stretching across entire mountain ranges or from the mountain<br />
range to the sea (i.e. landscape, ecological or regional corridors), or<br />
they can be small scale such as the buffer area around an isolated<br />
wetland.<br />
Ecological Reserve <strong>The</strong> ecological reserve refers to that portion of<br />
streamflow which must remain in rivers to ensure the sustainable<br />
healthy functioning of aquatic ecosystems (i.e. the river and its<br />
associated wetlands and estuaries).<br />
Ecological Sensitivity Map is a map indicating the relative<br />
ecological sensitivity and vulnerability of a planning domain/ area. A<br />
sensitivity analysis is conducted to guide the project design in terms<br />
of layouts and to determine the most appropriate development<br />
scenario. <strong>The</strong> sensitivity analysis is based on ecological criteria.<br />
<strong>The</strong> map should delineate (a) vegetation type(s) on site of varying<br />
sensitivity i.e. whether it is a CBA or Other Natural Area etc., and<br />
the ecosystem status (Refer to Appendix A); (b) disturbance of the<br />
vegetation type(s) and levels of disturbance on site i.e. pristine<br />
(high sensitivity), moderately degraded (moderate sensitivity) or<br />
highly degraded (low sensitivity), including the identification of<br />
alien invasive species; (c) potential for rehabilitation/restoration; (d)<br />
presence of or likelihood of presence of Species of Special Concerng ;<br />
(e) any special features (if applicable); and (f ) ecological process<br />
areas which delineate either the presence of a mapped CBA corridor<br />
(ecological process area or landscape corridor) or the potential for<br />
small-scale corridors on site, e.g. along a stream, drainage lines.
Ecological Support Area A supporting zone (ecological) or area<br />
required to prevent degradation of Critical Biodiversity Areas and<br />
formal Protected Areas, usually located adjacent to or which link<br />
CBA and/or Protected Areas. Some of these areas may already be<br />
transformed or degraded, but they still support ecological processes.<br />
Ecosystem A natural system that represents the interactions<br />
between plants, animals, insects, micro-organisms and the nonliving<br />
environment (e.g. soil, air, water). Ecosystems can operate at<br />
different scales – from very small (a pond) to whole landscapes (an<br />
entire water catchment area). In the CBA Map, different types of<br />
vegetation were recognised as ecosystems.<br />
Ecosystem services <strong>The</strong> benefits that people get from nature,<br />
such as a regular supply of clean water, flood control, prevention<br />
of erosion, pollination (important to the fruit industry, for example),<br />
carbon storage (to counteract global warming), stone and sand for<br />
building, and clean air vital for our survival i.e. ‘what nature does for<br />
us’.<br />
Ecosystem status (also known as conservation status) Describes<br />
the condition of an areas biodiversity relative to past, present<br />
and future threats, and is an indicator of the level of safeguarding<br />
required for the continued existence of the biodiversity which<br />
is found in that particular area. Ecosystem status of terrestrial<br />
ecosystems is based on the degree of habitat loss that has occurred<br />
in each ecosystem, relative to two thresholds: one for maintaining<br />
healthy ecosystem functioning, and one for conserving the majority<br />
of species associated with the ecosystem. As natural habitat is lost in<br />
an ecosystem, its functioning is increasingly compromised, leading<br />
eventually to the collapse of the ecosystem and to loss of species<br />
associated with that ecosystem. Four Ecosystem status classifications<br />
types exist, namely Critically Endangered, Endangered, Vulnerable<br />
and Least Threatened. <strong>The</strong> National Equivalent ecosystem status<br />
has been used in the production of the GR CBA Map, which<br />
means that the SANBI national criteria for determining ecosystem<br />
status were applied. <strong>The</strong> ecosystem status for the <strong>Garden</strong> <strong>Route</strong> is,<br />
therefore, the most accurately classified and supersedes all other<br />
biodiversity plan classifications.<br />
Eco-status: <strong>The</strong> overall ecological status of an aquatic resource<br />
in which it should be managed as determined by the Reserve<br />
Determination Methodology (developed by the Department of<br />
Water Affairs). For example, Eco-status A requires that a river or<br />
wetland be managed in its natural state and is not subject to<br />
impacts. It indicates the level of protection a river or wetland should<br />
receive.<br />
Ecotone A transitional zone between two or more ecosystems (such<br />
as a forest and fynbos) which may display characteristics of both. For<br />
example, between forests and fynbos, the ecotone comprises hardy<br />
pioneer plants that can recover rapidly after disturbance and can<br />
protect the forest from fire and the drying effects of the sun.<br />
Endemic A plant or animal species, or a vegetation type, which is<br />
naturally restricted to a particular defined region (not to be confused<br />
with indigenous). For example, a plant may be endemic to South<br />
Africa in which case it grows naturally anywhere in the country, or<br />
endemic only to the <strong>Garden</strong> <strong>Route</strong>, which means it is restricted to<br />
this area and grows naturally nowhere else in the country or world.<br />
Environmental Management Framework (EMF) An EMF allows<br />
environmental constraints and opportunities to be examined at a<br />
regional level to influence project-specific decisions before they are<br />
made. <strong>The</strong>y identify opportunities and constraints to developments,<br />
and also allow for the consideration of cumulative effects that<br />
may be expected in the study area. <strong>The</strong>y inform land-use decisionmaking<br />
processes once development proposals are submitted.<br />
Environmental Management <strong>Plan</strong> (EMP) <strong>The</strong> EMP provides<br />
specifications that the landowner shall adhere to, in order to<br />
minimise adverse environmental impacts associated with a landuse<br />
activity e.g. alien plant management on land for conservation.<br />
In terms of proposed developments, an EMP can be defined as “an<br />
environmental management tool used to ensure that undue or<br />
reasonably avoidable adverse impacts of the construction, operation<br />
and decommissioning of a project are prevented; and that the<br />
positive benefits of the projects are enhanced”. EMPs are therefore<br />
important tools for ensuring that the management actions arising<br />
from Environmental Impact Assessment (EIA) processes are clearly<br />
defined and implemented through all phases of the project lifecycle.<br />
Floodplain a smooth, relatively flat valley floor next to and formed<br />
by a river or stream subject to periodic overflows.<br />
Fine-Scale Biodiversity <strong>Plan</strong>s are more accurate maps of<br />
biodiversity prepared at a scale of 1:5 000 – 1:50 000 (or finer) and<br />
which identify important areas for conservation and sustainable<br />
management. See systematic biodiversity plan below.<br />
Fragmentation [of habitat] <strong>The</strong> breaking up of a continuous<br />
habitat, ecosystem, or land-use type into smaller fragments.<br />
Function/functioning/functional Used here to describe natural<br />
systems working or operating in a healthy way (opposite to<br />
dysfunctional which means working poorly or in an unhealthy way)<br />
Fynbos Forum Ecosystem Guidelines: A handbook that provides<br />
a set of guidelines prepared for several <strong>Western</strong> <strong>Cape</strong> ecosystem<br />
groups, e.g. Lowland Fynbos, Coastal Ecosystems. Its aim is to assist<br />
all stakeholders involved in land-use planning and environmental<br />
assessment with integrating biodiversity into these procedures.<br />
Available from the BGIS Unit on (021) 799 8738 or downloadable<br />
www.<strong>bgis</strong>.<strong>sanbi</strong>.org.<br />
GIS and GIS shapefiles A GIS is a computer technology that<br />
combines geographic data (the location of man-made and natural<br />
features on the earth’s surface) and other types of information<br />
(names, classifications, addresses and much more) to generate<br />
visual maps and reports. A GIS can play a major role in integrating<br />
information from a variety of databases to identify problems and<br />
explore solutions (Adapted from Looney 2000 Beyond Maps – GIS and<br />
Decision-making in Local Government).<br />
Ground truthing is the verification of mapped information with real<br />
features on the site.<br />
Groundwater is the term for any water found subsurface in the<br />
saturated zone below the water table, i.e. the water table marks the<br />
upper surface of the groundwater systems.<br />
Habitat <strong>The</strong> natural home of a plant or animal species. Generally<br />
those features of an area inhabited by animal or plant which are<br />
essential to its survival. <strong>The</strong> habitat of a frog might be a wetland.
Hotspot Biodiversity hotspots are areas of high species diversity,<br />
which are also under serious threat.<br />
Indigenous Naturally occurring or “native” to a broad area, such as<br />
South Africa.<br />
Intact/ecological integrity Used here to describe natural<br />
environment that is not badly damaged, and is still operating<br />
healthily.<br />
Integrated management in this handbook refers to the<br />
management of land-use in an integrated fashion. This implies<br />
the need to consider the socio-economic and environmental<br />
(biodiversity) impact of land-use change and development to<br />
ensure sustainable development. <strong>The</strong> principles of accountability,<br />
participation, equitability and sustainability are promoted.<br />
Invasive alien species Invasive alien species means any nonindigenous<br />
plant or animal species whose establishment and spread<br />
outside of its natural range threatens natural ecosystems, habitats or<br />
other species or has the potential to threaten ecosystems, habitats<br />
or other species; and may result in economic or environmental<br />
harm, or harm to human health.<br />
Land cover <strong>The</strong> substance which covers the land, e.g. natural<br />
vegetation, roads, factory, or bare ground. In the context of<br />
this document, land cover gives an indication of the level of<br />
transformation of natural ecosystems and can range from natural<br />
through to irreversibly transformed. Land cover cannot always be<br />
equated to land-use, e.g. bare land can either be borrow pits (where<br />
the land-use is mining) or natural bare soil (where the land-use may<br />
be conservation). It is one of the crucial components of systematic<br />
biodiversity planning (see below).<br />
Landscape corridor – see ecological process area.<br />
Land-use is the human alteration of the natural environment into<br />
the built environment (e.g. agriculture, mining, plantation, and<br />
settlements) or the human preservation of the natural environment<br />
(e.g. conservation).<br />
Land-use planning and decision-making (LUPDM) Land-use<br />
planning and decision-making takes the form of both reactive<br />
decision-making and proactive planning. <strong>The</strong> former refers<br />
to decisions and recommendations made by authorities and<br />
professionals dealing with land-use development applications (e.g.<br />
EIA and LUPO); whilst the latter refers to the compilation of forward<br />
planning documents and maps, such as SDFs, SEAs etc., that guide<br />
land-use development. LUPDM is a multi-sectoral planning process.<br />
Listed Threatened Ecosystems are ecosystems that are threatened<br />
(CR, E and V – see ecosystem status) and have been listed in terms of<br />
Section 52 of the National Biodiversity Act (10 of 2004).<br />
Mainstreaming biodiversity means integrating biodiversity<br />
considerations and the sustainable use of biological resources<br />
into the policies, strategies and day-to-day operations of a range<br />
of sectors whose core business is not biodiversity conservation<br />
(e.g. into economic sectors and development models and<br />
programmes) and in so doing, integrating it into all human<br />
behaviour. Mainstreaming biodiversity is essential for overcoming<br />
the “conservation versus development” mindset, and for ensuring<br />
sustainable development.<br />
59<br />
Multi-sectoral planning procedures consider all available sector<br />
plans (biodiversity, agricultural, mining, economic, social, etc.)<br />
in order to make informed decisions and promote sustainable<br />
development. IDPs and SDFs are examples of multi-sectoral<br />
planning tools.<br />
National Equivalent ecosystem status. See ecosystem status above.<br />
Place-bound versus non-place-bound Place bound is where a<br />
proposed development is dependent on a certain location, e.g.<br />
mining only occurs where minerals are located, versus non-place<br />
bound development which is not dependent on a certain location<br />
e.g. a paint ball centre or water park.<br />
<strong>Plan</strong>ning Unit <strong>The</strong> minimum unit of land-used in the biodiversity<br />
(conservation) planning process to identify Critical Biodiversity Areas<br />
(and the other mapped categories of land).<br />
Precautionary principle In the face of uncertainty about the<br />
workings of ecosystems and the effects of human activities, we<br />
should always err on the side of caution. Incomplete or inadequate<br />
data are generally the norm in conservation and resource<br />
management activities; however, the lack of data should not be used<br />
to justify a delay in taking conservation actions. Actions or refraining<br />
from potentially harmful actions should be based on the probable<br />
consequences to species, habitats and ecosystems, especially when<br />
long-term, or irreversible, consequences are more likely than not.<br />
Referred to in the NEMA.<br />
Pristine Unspoiled, used here to describe the natural environment<br />
in its undisturbed state.<br />
Protected Areas <strong>The</strong>se are formally protected areas declared in<br />
terms of the National Environmental Management: Protected Areas<br />
Act.<br />
Ramsar Convention and List: Known as the ‘Convention on<br />
Wetlands of International Importance’, where certain wetlands<br />
have been listed and have acquired a new status at the national<br />
level and are recognised by the international community as being<br />
of significant value, not only for the country, but for humanity as a<br />
whole (see www.ramsar.org).<br />
Red data species <strong>Plan</strong>t or animal species that are named in a list<br />
(the Red Data Book) because their survival is under threat. <strong>The</strong>y have<br />
been assessed according to their potential extinction in the near<br />
future and are either categorized as Extinct, Critically Endangered,<br />
Endangered, Vulnerable or Least Threatened.<br />
Rehabilitate/rehabilitation - see also restore/restoration<br />
Meaning (roughly) restoration, especially after mining activities or<br />
quarrying, but where the natural environment is not repaired to its<br />
original pristine state. Rehabilitation emphasizes the reparation of<br />
ecosystem processes, productivity and services.<br />
Restore/restoration (Ecological restoration) <strong>The</strong> process of assisting<br />
the recovery of an ecosystem that has been degraded, damaged, or<br />
destroyed, which involves the repair of the natural environment to<br />
a state close to its original state. For example, this can be achieved<br />
through the removal of alien invasive plants, or the repair of eroded<br />
sites and the replanting of indigenous plants. Restoration involves,<br />
not only the reparation of ecosystem processes, productivity and<br />
services, but also the re-establishment of species composition and<br />
community structure.
Rezoning and Zoning Schemes <strong>The</strong> general purpose of zoning<br />
is to determine use rights, manage urban growth, develop and<br />
utilise land, as well as conservation of the natural and cultural<br />
environment.<br />
Shapefile Several GIS files that together produce a geographical/<br />
mapped feature e.g. dam, road, vegetation type, also known as a GIS<br />
layer or map (see GIS above).<br />
Spatial <strong>Plan</strong>ning Categories: delineate the landscape into Core<br />
1, Core 2, Buffer 1 and Buffer 2, according to the <strong>Western</strong> <strong>Cape</strong><br />
Provincial SDF. <strong>The</strong>y represent the level of importance of biodiversity<br />
attached thereto and include land-use recommendations based<br />
on the principles of bioregional planning (see above). <strong>The</strong>y are<br />
intended to manage activities in the four main physiographic<br />
components of the <strong>Western</strong> <strong>Cape</strong>.<br />
Species Any living organism e.g. plant, animal, insect, bird, etc., of a<br />
particular kind and name.<br />
Species of Special Concern (SSC) in this handbook refers to red<br />
data species (see above) that are classified as Critically Endangered,<br />
Endangered or Vulnerable. SSC are also referred to as Species of<br />
Conservation Concern.<br />
Sustainable development Development that meets the needs<br />
of both present and future development, equitably. In terms of<br />
the NEMA, (sustainable) development is the integration of social,<br />
economic and environmental factors into planning, implementation<br />
and decision-making so as to ensure that development serves<br />
present and future generations.”<br />
‘Sustainable Human Settlements’ Integrated and sustainable<br />
human settlements that redress the legacy of racial and social<br />
divisions, combat urban sprawl, ensure centrality for the poor and<br />
create empowered communities through social capital formation<br />
(PSDF, 2005). Encouraging nodal development and the protection of<br />
nature’s ecosystem services, to promote sustainable development.<br />
Systematic biodiversity plan (technically known as a systematic<br />
conservation plan) A map which indicates priority areas for<br />
conservation and sustainable management to ensure the continued<br />
existence of biodiversity. Systematic biodiversity planning is<br />
an approach to conservation that prioritises actions by setting<br />
quantitative thresholds for biodiversity features (e.g. vegetation<br />
types). It is premised on conserving a representative sample of<br />
biodiversity pattern, including species and habitats (the principle of<br />
representation), as well as the ecological and evolutionary processes<br />
that maintain biodiversity over time (the principle of persistence).<br />
<strong>The</strong> configuration of priority areas identified in the plan is designed<br />
to be spatially efficient (i.e. to meet biodiversity thresholds as<br />
efficiently as possible in terms of the amount of land required) and<br />
where possible to avoid conflict with other land-use where these<br />
are known to exist (principles of efficiency and conflict avoidance).<br />
It recognizes that the whole landscape must be planned and<br />
managed strategically to ensure sustainable development.<br />
Thresholds See biodiversity threshold above.<br />
Transformation [habitat loss] Clearing an area of its indigenous<br />
vegetation. <strong>The</strong>se transformed parts of the landscape no longer<br />
contain indigenous habitat. In many areas, this has led to the<br />
breakdown of natural ecological processes.<br />
Urban Edge An urban edge is ‘a defined line drawn around an<br />
urban node as a growth boundary i.e. the outer limit of urban areas’.<br />
It is intended to protect the rural environment from urban sprawl<br />
and to encourage efficient settlement patterns. Refer to the DEADP<br />
Guideline Document ‘Urban Edge Guidelines in the <strong>Western</strong> <strong>Cape</strong>’.<br />
Vegetation <strong>The</strong> collective term for plants in an area. Often referred<br />
to as “bush” or “veld”.<br />
Water Management Area South Africa is divided into 19 Water<br />
Management Areas (WMAs), according to the National Water<br />
Act (36 of 1998). A WMA is an area established as a management<br />
unit in the national water resource strategy within which a<br />
catchment management agency will conduct the protection, use,<br />
development, conservation, management and control of water<br />
resources.<br />
<strong>The</strong> Rare Gladiolus sempervirens found in Tsitsikamma Perennial<br />
Stream and Knysna Island Fynbos.<br />
Photo: Tinneke Kraaij
References<br />
Allanson, B. 2000. <strong>The</strong> Knysna Basin Project reviewed – research<br />
findings and implications for management. Transactions of the Royal<br />
Society of South Africa, 55 (2).<br />
Apps, P. 2000. Mammals of Southern Africa: A Field Guide. Struik Publishers.<br />
<strong>Cape</strong> Town, South Africa.<br />
Arcus Gibb. 2007. Eden State of Environment Report. Phase 1 Report.<br />
Draft Report for the Project Steering Committee for Comment. Prepared<br />
for the Eden District Municipality.<br />
Arcus Gibb. 2008. Eden State of Environment Report. Draft Final Report.<br />
Prepared for the Eden District Municipality.<br />
Berliner, D., Desmet, P., Hayes, R., and Young Hayes, A. 2007.<br />
Eastern <strong>Cape</strong> Biodiversity Conservation <strong>Plan</strong> Handbook. Prepared for the<br />
Department of Water Affairs and Forestry Project No 2005-012, King<br />
William’s Town.<br />
Clark, B. and Lombard, M. 2007. A Marine Conservation <strong>Plan</strong> for the<br />
Agulhas Bioregion (conducted for the <strong>Garden</strong> <strong>Route</strong> Initiative project).<br />
<strong>Cape</strong> Town.<br />
Cowling, R.M. 2002. New perspectives on the tree richness of South<br />
Africa’s forests. Veld and Flora 88: 48-49.<br />
Department of Environmental Affairs and Development <strong>Plan</strong>ning.<br />
2003. Bioregional <strong>Plan</strong>ning Manual. Bioregional <strong>Plan</strong>ning in the <strong>Western</strong><br />
<strong>Cape</strong>. Prepared by Dennis Moss Partnership.<br />
Department of Environmental Affairs and Development <strong>Plan</strong>ning.<br />
2004. <strong>Western</strong> <strong>Cape</strong> Provincial Zoning Scheme Model By-Law. Prepared<br />
by <strong>Plan</strong>ning Partners in association with Du Plessis and Hofmeyr<br />
Attorneys Dr. P.E. Claassen.<br />
Department of Environmental Affairs and Development <strong>Plan</strong>ning.<br />
2005. <strong>Western</strong> <strong>Cape</strong> Provincial Spatial Development Framework.<br />
Prepared by CNdV Africa (Environmental planning, Landscape<br />
architecture, Urban design).<br />
Department of Environmental Affairs and Development <strong>Plan</strong>ning.<br />
2009. DRAFT <strong>Western</strong> <strong>Cape</strong> Provincial Rural Land Use <strong>Plan</strong>ning and<br />
Management Guidelines (May 2009). Prepared by Setplan (<strong>Cape</strong> Town).<br />
Department of Environmental Affairs and Tourism, 2007. Draft<br />
Guideline regarding the Determination of Bioregions and the Preparation<br />
and Publication of Bioregional <strong>Plan</strong>s.<br />
Department of Environmental Affairs and Tourism, 2008. A National<br />
Framework for Sustainable Development in South Africa.<br />
Department of Environmental Affairs and Tourism. 2009 National<br />
Biodiversity Framework. Government Gazelte, 3 August 2009. No 32474.<br />
De Villiers, C.C., Driver, A., Clark, B., Euston-Brown, D.I.W., Day, E.G.,<br />
Job, N., Helme, N,A., Holmes, P.M. Brownlie S. and Rebelo AB. 2005.<br />
Fynbos Forum Ecosystem Guidelines for Environmental Assessment in<br />
the <strong>Western</strong> <strong>Cape</strong>. Fynbos Forum and Botanical Society of South Africa,<br />
Kirstenbosch.<br />
Department of Water Affairs and Forestry. 2007. State of Rivers<br />
Report. Rivers of the Gouritz Water Management Area. River Health<br />
programme.<br />
Department of Water Affairs and Forestry. 2007. Policy principles and<br />
guidelines for control of development affecting natural forests.<br />
Department of Water Affairs and Forestry. 2007(2). Resource<br />
Directed Measures: Reserve Determination studies for selected surface<br />
water, groundwater, estuaries and wetlands in the Outeniqua (Knysna<br />
and Swartvlei) catchment. Delineation Report. Prepared by Coastal and<br />
Environmental Services. Report no. RDM/K40-K50/00/CON/0207<br />
Department of Water Affairs and Forestry. 2008. Outeniqua Coast<br />
Water Situation Study. Supporting Report No. 6: Existing Bulk Supply<br />
Infrastructure and Water Use. Prepared by UWP Consulting (Pty) Ltd, in<br />
association with BKS (Pty) Ltd. Project No: 2005-021.<br />
61<br />
Ferrar, A.A. and Lötter, M.C. 2007. Mpumalanga Biodiversity<br />
Conservation Handbook. Mpumalanga Tourism and Parks Agency,<br />
Nelspruit.<br />
Hewitson, BC. and Crane, RG. 2006. Consensus between GCM<br />
climate change projections with empirical downscaling: Precipitation<br />
downscaling over South Africa. International Journal of Climatology. 26:<br />
1315–1337.<br />
Holness, S.D., Bradshaw, P. and Brown, A.E. 2010. Critical<br />
Biodiversity Areas of the <strong>Garden</strong> <strong>Route</strong>. Conservation <strong>Plan</strong>ning<br />
Report. <strong>Garden</strong> <strong>Route</strong> Initiative. South African National Parks. Knysna.<br />
Intergovernmental Panel on Climate Change (IPCC). 2007. Climate<br />
Change 2007: Synthesis Report. Summary for Policymakers. Synthesis<br />
Report of the IPCC Fourth Assessment Report.<br />
Job, N. and Driver, A. 2006. Biodiversity Priority Areas: Supporting<br />
land-use planning and decision-making in threatened ecosystems and<br />
special habitats. Botanical Society of South Africa: Conservation Unit.<br />
Kirstenbosch, <strong>Cape</strong> Town. Booklets compiled for the Drakenstein,<br />
Swartland and <strong>Cape</strong> Agulhas Municipalities in the <strong>Western</strong> <strong>Cape</strong>.<br />
Job, N. and Driver, A. 2006(2). Putting Biodiversity <strong>Plan</strong>s to Work: Project<br />
Report and Recommendations (Draft). Botanical Society of South Africa:<br />
Conservation Unit. Kirstenbosch, <strong>Cape</strong> Town.<br />
Job, N., Snaddon, K., Day, L., Nel, J., Smith-Adoa, L. and Kotze,<br />
I. 2008. <strong>The</strong> Freshwater Consulting Group and CSIR. C.A.P.E. fine-scale<br />
biodiversity planning project: Aquatic Ecosystems of the Sandveld – Saldanha<br />
<strong>Plan</strong>ning Domain.<br />
Midgley, G.F., Chapman, R.A., Hewitson, B., Johnston, P., de Wit, M.,<br />
Ziervogel, G., Mukheibir, P., van Niekerk, L., Tadross, M., van Wilgen,<br />
B.W., Kgope, B., Morant, P.D., <strong>The</strong>ron, A., Scholes, R.J. and Forsyth,<br />
G.G. 2005. A Status Quo, Vulnerability and Adaptation Assessment of the<br />
Physical and Socio-economic Effects of Climate Change in the <strong>Western</strong><br />
<strong>Cape</strong>. Report to the <strong>Western</strong> <strong>Cape</strong> Government, <strong>Cape</strong> Town, South Africa.<br />
CSIR Report No. ENV-S-C 2005-073, Stellenbosch.<br />
Nel, J.L., Belcher, A., Impson, N.D., Kotze, I.M., Paxton, B., 2006.<br />
Conservation assessment of freshwater biodiversity in the Olifants/Doorn<br />
Water Management Area: Final report. CSIR Report Number CSIR/NRE/<br />
ECO/ER/2006/0182/C, CSIR, Stellenbosch.<br />
Pierce, S.M. and Mader, A.D. 2006. <strong>The</strong> STEP Handbook. Integrating<br />
the natural environment into land-use decisions at the municipal level:<br />
towards sustainable development. Centre for African Conservation<br />
Ecology (ACE). Report Number 47 (Second Edition). Nelson Mandela<br />
Metropolitan University, South Africa.<br />
Roets, W. and Duffell-Canham, A. 2009. Implementing Setback Lines:<br />
Development <strong>Plan</strong>ning for Climate Change. Conference proceedings IAIA.<br />
Wilderness.<br />
Tolley, K. and Burger, M. 2007. Chameleons of Southern Africa. Struik<br />
Publishers. <strong>Cape</strong> Town, South Africa.<br />
Turpie, J.K., Adams, JB., Joubert, A., Harrison, TD., Colloty. BM.,<br />
Maree, EC., Whitfield, AK., Wooldridge, TH., Lamberth, SJ., Taljaard,<br />
S. and Van Niekerk, L. 2002. Assessment of the conservation priority<br />
of status of South African estuaries for use in management and water<br />
allocation. Water SA Vol. 28 NO. 2.<br />
Turpie J.K., Heydenrych, BJ. and Lamberth, SJ. 2003. Economic<br />
value of terrestrial and marine biodiversity in the <strong>Cape</strong> Floristic Region:<br />
implications for defining effective and socially optimal conservation<br />
strategies. Biological Conservation 112:233-273.<br />
Vlok, J.H.J., Euston-Brown D.I.W. and Wolf, T. 2008. A vegetation map<br />
for the <strong>Garden</strong> <strong>Route</strong> Initiative. Unpublished 1:50 000 maps and report<br />
supported by CAPE FSP task team.
APPENDIX A:<br />
SUMMARY BIODIVERSITY STATISTICS FOR THE GARDEN ROUTE<br />
VEGETATION TYPES<br />
For summary data for each municipality, refer to the GIS vegetation map or GR CBA Mapbook.<br />
Key:<br />
• Vegetation types written in blue = aquatic dependent vegetation types i.e. vegetation types that depend on the presence of either fresh<br />
or brackish surface water; Vegetation types written in green = the Coastal Forests; Vegetation types and/or ecosystem status written in<br />
red = Critically Endangered vegetation types, which are automatically classed as Critical Biodiversity Areas.<br />
• GR: <strong>Garden</strong> <strong>Route</strong> region = the entire planning domain, namely the municipal areas of the George, Knysna, and Bitou, and north of<br />
their boundaries, up to the N9 and R62 roads within the Eden District Municipality in the <strong>Western</strong> <strong>Cape</strong>. <strong>The</strong> GR region also overlaps the<br />
Koukamma and Kouga municipalities south of the R62 road, and from east of where the R62 joins the N2, south of the N2 and Seekoei<br />
River in the Eastern <strong>Cape</strong>. It encompasses the entire catchment areas of the rivers that drain south from the Outeniqua and Tsitsikamma.<br />
• CR = Critically Endangered; EN = Endangered; VU = Vulnerable; LT = Least Threatened.<br />
Leopard. Photo: Luca Galuzzi<br />
<strong>The</strong> extent and condition of natural vegetation in a catchment, especially<br />
wetlands, has a direct impact on the health of a river<br />
Photo: Andrew Brown)
MAJOR THREATS (% OF ORIGINAL<br />
EXTENT)<br />
Urban<br />
Degradation<br />
and<br />
<strong>Plan</strong>tation Farm<br />
and aliens<br />
infra<br />
(%) (%) structure<br />
(%)<br />
(%)<br />
VEGETATION TYPE , THRESHOLD AND ECOSYSTEM STATS etc CONDITION CLASSES (HECTARES)<br />
Urban and<br />
infrastructure<br />
Farm<br />
<strong>Plan</strong>tation<br />
Degradation<br />
and aliens<br />
Natural<br />
National<br />
Equivalent<br />
Ecosystem<br />
Status<br />
Threshold<br />
hectares<br />
Threshold<br />
%<br />
Original<br />
Extent<br />
MUNICIPAL<br />
LOCATION<br />
VEGETATION NAME<br />
(ha)<br />
(ha)<br />
(ha)<br />
(ha)<br />
(ha)<br />
Baviaanskloof Sandolienveld Koukamma 37.4 23 8.6 LT 32.5 1.2 3.7 3 0 10 0<br />
Baviaanskloof Spekboom<br />
Koukamma 33 19 6.3 CR 2.8 9.8 20.4 30 0 0 62<br />
Thicket<br />
Covie Coastal Proteoid<br />
Bitou 2054 23 472.4 LT 1778.2 213.6 16.3 43.3 2.8 10 1 2 0<br />
Fynbos<br />
De Vlugt Forest-Waboomveld Eden DMA 861.5 23 198.1 LT 703.1 146.2 12.1 17 0 1 0<br />
De Vlugt Sandolien-<br />
Eden DMA 1197.5 29 347.3 EN 400 404.2 393.3 34 0 33 0<br />
Renosterveld<br />
Doornrivier Mesic Proteoid<br />
George, Knysna 14597.7 23 3357.5 VU 7298.8 5463.4 28.2 1805.1 2.9 37 0 12 0<br />
Fynbos<br />
Doringrivier Arid Proteoid<br />
George 2297.3 23 528.4 VU 1108.3 1154.1 3.7 31.3 50 0 1 0<br />
Fynbos<br />
Doringrivier Waboomveld George 2325.7 23 534.9 CR 331.2 1726.7 3.5 263.1 1.3 74 0 11 0<br />
63<br />
Eensaamheid Renosterveld Eden DMA 6529.8 29 1893.6 CR 274.3 434.6 11 5808.1 2 7 0 89 0<br />
Bitou, Koukamma,<br />
<strong>Garden</strong> <strong>Route</strong> Estuary<br />
2964.8 24 711.6 LT 2866.6 40.5 14.3 11.2 31.3 5.4 2.5 0.9 1.4<br />
Kouga<br />
George, Knysna,<br />
<strong>Garden</strong> <strong>Route</strong> Wetlands<br />
434.6 20 86.9 LT 337.7 47.4 14.5 11 0 0 3<br />
Bitou, Kouga<br />
Groenvlei Coastal Forest Knysna 44.6 24 10.7 VU 18.6 0.5 25.5 1 0 57 0<br />
Groot Brak River and<br />
George, Knysna,<br />
3507.7 31 1087.4 EN 1594.2 960.4 224.5 558.6 170.9 27 6 16 5<br />
floodplain<br />
Bitou, Eden DMA<br />
Haarlem Fynbos-<br />
Koukamma, Eden<br />
161.1 24 38.7 LT 151.5 1.1 3.7 4.9 1 0 2 3<br />
Renosterveld<br />
DMA<br />
George, Knysna,<br />
Hartenbos Primary Dune Bitou, Koukamma, 3817.9 40 1527.2 EN 1821.6 701.2 340 290.7 664.5 18 9 8 17<br />
Kouga<br />
Hartenbos Strandveld George 23360.6 31 7241.8 VU 13228.17 5089.64 2628.97 2014.06 397.9 22 11 9 2<br />
Herold Renoster-<br />
George 6034 29 1749.9 VU 3182 339.6 2499.5 13.2 6 0 41 0<br />
Sandolienveld<br />
Herolds Bay Asteraceous<br />
George 976.9 20 195.4 LT 648.9 106.5 0.5 181.5 11 0 0 19<br />
Fynbos<br />
George, Knysna,<br />
Herolds Bay Littoral-Thicket<br />
144.8 36 52.1 CR 31.2 22 16.9 74.7 15 0 12 52<br />
Bitou, Koukamma<br />
Herolds Bay Thicket-Grassy<br />
George 2657.7 23 611.3 CR 134.1 698.1 21.2 1802 2.5 26 1 68 0<br />
Fynbos<br />
Hoogekraal Sandplain George, Knysna,<br />
818.8 23 188.3 EN 259.4 189.1 1 230.7 138.8 23 0 28 17<br />
Fynbos<br />
Bitou
MAJOR THREATS (% OF ORIGINAL<br />
VEGETATION TYPE , THRESHOLD AND ECOSYSTEM STATS etc CONDITION CLASSES (HECTARES)<br />
EXTENT)<br />
VEGETATION NAME<br />
MUNICIPAL<br />
Urban<br />
National<br />
Degra<br />
Urban and Degradation<br />
and<br />
Original Threshold Threshold Equivalent Natural dation <strong>Plan</strong>tation Farm<br />
<strong>Plan</strong>tation Farm<br />
infrastructure and aliens<br />
infra<br />
LOCATION Extent % hectares Ecosystem<br />
and aliens<br />
(ha)<br />
(ha) (ha)<br />
(%) (%) structure<br />
Status<br />
(ha)<br />
(%)<br />
(ha)<br />
(%)<br />
Humansdorp Perennial<br />
Kouga 1086.6 36 391.2 LT 908.2 34 0.4 37.6 64 3 0 3 6<br />
Stream<br />
Humansdorp Thicket-Grassy<br />
Kouga 2388.1 23 549.3 CR 273.8 921.4 50.5 953.8 188.6 39 2 40 8<br />
Fynbos<br />
Inland Drift Sands Koukamma, Kouga 753.3 24 180.8 VU 332.8 8.9 373 38.9 1 0 50 5<br />
Inland Primary Dune Koukamma, Kouga 7867.1 23 1809.4 EN 2233.8 236.2 5126.1 275.6 3 0 65 4<br />
Kabeljous Valley Thicket Kouga 2431 20 486.2 VU 1111 1147.2 13.9 159 47 0 1 7<br />
Kamanassie Waboomveld George, Eden DMA 800 23 184 VU 468.4 21.3 268.4 41.8 3 34 5 0<br />
Keurbooms River and<br />
Knysna, Eden DMA 770.6 19 146.4 LT 564.5 0.1 179.6 26.9 0 0 23 3<br />
Perennial Streams<br />
Keurbooms Thicket-Forest Bitou 471.8 23 108.5 VU 282.8 9.6 179.5 2 0 38 0<br />
Geroge, Knysna,<br />
Kleinkrantz Drift Sands<br />
6611.7 24 1586.8 LT 4085.4 2269.6 256.8 34 0 4 0<br />
Kouga<br />
Kleinkrantz Littoral-Thicket George, Knysna 2799.9 40 1120 LT 2493.7 151.2 13.7 121.3 20.3 5 0 4 1<br />
George, Knysna,<br />
Kleinplaat Grassy Fynbos<br />
639.4 20 127.9 LT 455.3 101.6 2.1 1.4 76.8 16 0 0 12<br />
Bitou, Eden DMA<br />
Knysna Enon Fynbos Knysna, Bitou 182.8 36 65.8 LT 150 31.7 1.2 17 0 1 0<br />
Knysna Island Fynbos Knysna, Bitou 978 20 195.6 LT 906.8 42.8 0.1 28.8 4 0 0 3<br />
Knysna Saltmarsh Knysna, Btou 27549.3 23 6336.3 CR 4725.2 5796.1 16429.7 598.7 21 60 2 0<br />
Knysna, Bitou,<br />
Kouga Grassy Fynbos Koukamma, Kouga, 4820.6 23 1108.7 VU 1996.5 1167.6 921.8 573.1 161.8 24 19 12 3<br />
Eden DMA<br />
Koukamma, Kouga,<br />
Kouga Mesic Proteoid Fynbos 502.5 24 120.6 LT 416.2 28.6 3.3 54.4 6 0 1 11<br />
Eden DMA<br />
Kouga Perennial Stream Eden DMA 14497.8 23 3334.5 LT 10991 2546.5 41.7 628.4 291.4 18 0 4 2<br />
Kouga Subalpine Fynbos Eden DMA 8790.9 23 2021.9 LT 6446 823.1 1.4 1490 34.1 9 0 17 0<br />
Kromrivier Thicket-Forest Koukamma, Kouga 2170.8 24 521 VU 993.4 270 808.6 98.8 12 0 37 5<br />
Langkloof Grassy Fynbos Koukamma, Kouga 260.9 23 60 LT 260.9 0 0 0 0<br />
2389.9 40 956 EN 1277.8 347.4 410 356 15 0 17 15<br />
Koukamma, Eden<br />
DMA<br />
Langkloof Renosterveld
MAJOR THREATS (% OF ORIGINAL<br />
VEGETATION TYPE , THRESHOLD AND ECOSYSTEM STATS etc CONDITION CLASSES (HECTARES)<br />
EXTENT)<br />
VEGETATION NAME<br />
MUNICIPAL<br />
Urban<br />
National<br />
Degra<br />
Urban and Degradation<br />
and<br />
Original Threshold Threshold Equivalent Natural dation <strong>Plan</strong>tation Farm<br />
<strong>Plan</strong>tation Farm<br />
infrastructure and aliens<br />
infra<br />
LOCATION Extent % hectares Ecosystem<br />
and aliens<br />
(ha)<br />
(ha) (ha)<br />
(%) (%) structure<br />
Status<br />
(ha)<br />
(%)<br />
(ha)<br />
(%)<br />
Langkloof Thicket-Grassy<br />
Koukamma 2510.3 23 577.4 EN 937.2 954.3 613.8 6.3 38 0 24 0<br />
Fynbos<br />
Langkloof Thicket-<br />
Koukamma 4693.1 29 1361 CR 220.4 261.4 3736.4 475 6 0 80 10<br />
Renosterveld<br />
Langkloof Waboomveld Bitou, Koukamma 480.3 23 110.5 EN 165.2 93.8 79 142.3 20 0 16 30<br />
Mellville Mesic Proteoid Geroge, Knysna,<br />
443.5 29 128.6 CR 19.6 111.7 312.2 25 0 70 0<br />
Fynbos<br />
Eden DMA<br />
Moordkuils Perennial Stream George 10521.4 23 2419.9 EN 3590.3 1299.1 5539.4 94.5 12 0 53 1<br />
Noetzie Proteoid Fynbos Knysna, Bitou 21882.9 23 5033.1 LT 19180.8 2631.3 72.6 0.7 12 0 0 0<br />
Noetzie Thicket-Fynbos Knysna, Bitou 20510.9 23 4717.5 VU 11149.3 6031.9 3326 2.4 1.7 29 16 0 0<br />
Olienboomkop Grassy<br />
Koukamma 34737.3 24 8337 VU 17796.1 7448.7 4010.4 5272.3 206.4 21 12 15 1<br />
Fynbos-Forest<br />
Olifants River and floodplain George, Eden DMA 4903.3 24 1176.8 EN 1477.6 1412.3 834 938.8 240.8 29 17 19 5<br />
Osbosch Thicket-<br />
Koukamma 1722.8 23 396.2 VU 807.3 169.2 274.7 152.6 319 10 16 9 19<br />
Renosterveld<br />
Outeniqua Forest George 860 23 197.8 LT 763.2 12.8 2.2 3.8 78.1 1 0 0 9<br />
Outeniqua Montane Forest George 13 40 5.2 EN 6.6 6.4 0 49 0 0<br />
George, Knysna,<br />
Outeniqua Perrenial Stream<br />
458.9 31 142.3 CR 91.5 17.4 350.1 4 0 76 0<br />
Eden DMA<br />
George, Knysna,<br />
Outeniqua Plateau Forest<br />
7236.9 29 2098.7 CR 1416.5 46.1 5749.9 29.3 1 0 79 0<br />
Bitou<br />
Outeniqua Subalpine Fynbos George 85.6 34 29.1 CR 5.7 18.2 61.6 21 72 0 0<br />
Outeniqua Waboomveld George, Eden DMA 410.5 34 139.6 LT 313.8 9 87.7 2 21 0 0<br />
Oyster Bay Thicket-Grassy<br />
Koukamma, Kouga 5202.5 24 1248.6 EN 1249.2 1669.8 22.3 2239 22.2 32 0 43 0<br />
Fynbos<br />
Paardeberg Mesic Proteoid<br />
George 28939.2 34 9839.3 LT 23249.3 1847.6 2655.3 1081.3 106 6 9 4 0<br />
Fynbos<br />
Piesang River Fynbos-Forest Bitou 99.6 23 22.9 LT 99.6 0 0 0 0<br />
Potjiesrivier Waboomveld Eden DMA 7908.9 23 1819 VU 3908 2878.3 14 1104.2 4.4 36 0 14 0<br />
65<br />
Roodefontein Grassy Fynbos Bitou 12210.9 23 2808.5 CR 2242.4 775.9 9193 6.1 6 0 75 0
MAJOR THREATS (% OF ORIGINAL<br />
VEGETATION TYPE , THRESHOLD AND ECOSYSTEM STATS etc CONDITION CLASSES (HECTARES)<br />
EXTENT)<br />
VEGETATION NAME<br />
MUNICIPAL<br />
Urban<br />
National<br />
Degra<br />
Urban and Degradation<br />
and<br />
Original Threshold Threshold Equivalent Natural dation <strong>Plan</strong>tation Farm<br />
<strong>Plan</strong>tation Farm<br />
infrastructure and aliens<br />
infra<br />
LOCATION Extent % hectares Ecosystem<br />
and aliens<br />
(ha)<br />
(ha) (ha)<br />
(%) (%) structure<br />
Status<br />
(ha)<br />
(%)<br />
(ha)<br />
(%)<br />
Ruitersberg Ericaceous<br />
George 334.3 23 76.9 EN 86.1 248.2 74 0 0 0<br />
Fynbos<br />
Ruitersbos Mesic Proteoid<br />
George 3346.5 40 1338.6 EN 1739.3 829.1 298.6 339 140.7 25 9 10 4<br />
Fynbos<br />
Sand River Pans Koukamma, Kouga 1224.4 23 281.6 LT 836.5 110.6 277.2 9 0 23 0<br />
George, Knysna,<br />
Sedgefield Coastal Grassland<br />
18934.7 36 6816.5 CR 1581.4 2915 11152.5 2281.8 1004.3 15 59 12 5<br />
Bitou<br />
Sedgefield Sandplain Fynbos Knysna 3804.6 23 875.1 CR 355.5 1187.8 287.6 1181.8 792.1 31 8 31 21<br />
Sedgefield Thicket-Fynbos George, Knysna 892.8 23 205.4 LT 771.8 121 14 0 0 0<br />
Soutvlei Inland Pans Kouga 5318.9 23 1223.4 VU 2621.6 361.5 2323.9 9.1 3.4 7 44 0 0<br />
St Francis Dune Stream Koukamma, Kouga 15.4 24 3.7 LT 13.5 0.3 1.6 2 0 11 0<br />
St Francis Riverine Saltmarsh Bitou, Kouga 1451.4 25 362.8 CR 202 305.6 0.6 388.9 554.2 21 0 27 38<br />
Bitou, Koukamma,<br />
St Francis Strandveld<br />
331.2 36 119.3 LT 311.1 9 11.2 0 3 0 3<br />
Kouga<br />
Storms River Thicket-Forest Bitou, Koukamma 4460.9 36 1605.9 LT 3053.6 526 404.9 173.9 302.6 12 9 4 7<br />
Tsitsikamma Coastal Plateau<br />
Bitou, Koukamma 1325.8 24 318.2 LT 1042.2 193.5 91 0 0 15 7<br />
Forest<br />
Bitou, Koukamma,<br />
Tsitsikamma Dune Forest<br />
250.1 24 60 VU 111 77.6 8.1 53.1 31 0 3 21<br />
Kouga<br />
George, Knysna,<br />
Tsitsikamma Ericaceous<br />
Bitou, Koukamma, 12487.1 36 4495.3 CR 3326.6 7316.3 975.8 870.9 59 0 8 7<br />
Fynbos<br />
Eden DMA<br />
Tsitsikamma Forest Fynbos Bitou, Koukamma 515.7 40 206.3 LT 492.2 2.4 13.1 8 0 3 2 0<br />
Tsitsikamma Fynbos Forest Bitou, Koukamma 1811 34 615.7 LT 1424.3 100.2 207.9 78.9 6 11 4 0<br />
Tsitsikamma Mesic Proteoid Bitou, Koukamma,<br />
25603.8 23 5888.9 LT 18508.5 5982.6 963.1 148.4 1.5 23 4 1 0<br />
Fynbos<br />
Kouga, Eden DMA<br />
Tsitsikamma Mountain Forest Bitou, Koukamma 1761.3 23 405.1 VU 752.4 275.3 468.8 263.7 1.3 16 27 15 0<br />
Tsitsikamma Mountain Bitou, Koukamma,<br />
274.5 34 93.3 LT 167.5 25 60.4 21.6 9 22 8 0<br />
Proteoid Fynbos<br />
Kouga<br />
Tsitsikamma Pans Koukamma, Kouga 1972 34 670.5 LT 1797.6 161.1 13.6 8 1 0 0<br />
Eden DMA 440 24 105.6 CR 105 335.1 0 0 76 0<br />
Tsitsikamma Perennial<br />
Stream
MAJOR THREATS (% OF ORIGINAL<br />
EXTENT)<br />
Urban<br />
Degradation<br />
and<br />
<strong>Plan</strong>tation Farm<br />
and aliens<br />
infra<br />
(%) (%) structure<br />
(%)<br />
(%)<br />
VEGETATION TYPE , THRESHOLD AND ECOSYSTEM STATS etc CONDITION CLASSES (HECTARES)<br />
Urban and<br />
infrastructure<br />
Farm<br />
<strong>Plan</strong>tation<br />
Degradation<br />
and aliens<br />
Natural<br />
National<br />
Equivalent<br />
Ecosystem<br />
Status<br />
Threshold<br />
hectares<br />
Threshold<br />
%<br />
Original<br />
Extent<br />
MUNICIPAL<br />
LOCATION<br />
VEGETATION NAME<br />
(ha)<br />
(ha)<br />
(ha)<br />
(ha)<br />
(ha)<br />
Tsitsikamma Plateau Forest Bitou, Koukamma 76005.9 23 17481.4 LT 57406 10920.9 4179.6 3303.5 211.3 14 5 4 0<br />
Tsitsikamma Plateau Proteoid Bitou, Koukamma,<br />
14583.4 34 4958.4 LT 12404.7 1261.7 702.9 204.5 11.5 9 5 1 0<br />
Fynbos<br />
Kouga<br />
Tsitsikamma River and Bitou, Koukamma,<br />
36827.5 23 8470.3 CR 2129.7 2576.9 16250.2 15261.9 618.2 7 44 41 2<br />
Floodplain<br />
Kouga<br />
Bitou, Koukamma,<br />
Tsitsikamma Riverine Forest<br />
2397.2 40 958.9 LT 1621.3 555.7 34.7 171.7 12.8 23 1 7 1<br />
Kouga<br />
Tsitsikamma Subalpine<br />
Bitou, Koukamma 178.5 23 41 LT 178.5 0 0 0 0<br />
Fynbos<br />
Tsitsikamma Thicket-Grassy<br />
Koukamma 3083.9 23 709.3 CR 155.3 35.3 0.8 2880.1 13.5 1 0 93 0<br />
Fynbos<br />
Tstsikamma Littoral<br />
Bitou, Koukamma,<br />
434.6 20 86.92 LT 337.7 47.4 14.5 10.9 0.0 0.0 3.3<br />
Vegetation<br />
Kouga<br />
Uplands Grassy Fynbos Knysna, Bitou 7165.2 23 1648 EN 2458.4 1235.2 870.7 2593.5 7.6 17 12 36 0<br />
Victoria Bay Thicket-Fynbos George 698.7 23 160.7 EN 189.1 175.1 299.6 35 25 0 43 5<br />
George, Knysna,<br />
Wilderness Forest-Thicket<br />
2157.5 36 776.7 VU 1131.6 336.4 101.9 116 471.5 16 5 5 22<br />
Bitou<br />
Wilderness Fynbos-Forest George, Knysna 8121.9 40 3248.8 EN 4076.4 1575.6 1010.8 1417.4 41.8 19 12 17 1<br />
Witberg Waboomveld George 316.1 23 72.7 LT 246.1 70.1 22 0 0 0<br />
Wolwedans Grassy Fynbos George, Knysna 33155 23 7625.6 CR 628.1 3628.1 3938.8 20462.6 4499.3 11 12 62 14<br />
Wolwedans Thicket-Forest George 523.8 40 209.5 EN 253 211.3 3.1 41.8 14.8 40 1 8 3<br />
Kouga 574.7 32 183.9 LT 417.1 26.7 131.3 0 0 5 23<br />
Zeekoei Limestone<br />
Strandveld<br />
67
Numerous herds of Loxodonta africana, the southern most wild elephants of the African continent, used<br />
to roam the forest and open fynbos of the Outeniqua and Tsitsikamma regions (the <strong>Garden</strong> <strong>Route</strong>). It<br />
is believed that there are 3 remaining elephants still living in the Knysna forests, a female known as<br />
the “Matriarch”, a young bull sighted in 2000 and another elephant sighted in 2001 (<strong>The</strong> Knysna and<br />
Tsitsikamma Forests, van de Merwe, 2002).