TOURISMOS is an international, multi-disciplinary, refereed (peer ...
TOURISMOS is an international, multi-disciplinary, refereed (peer ... TOURISMOS is an international, multi-disciplinary, refereed (peer ...
TOURISMOS: AN INTERNATIONAL MULTIDISCIPLINARY JOURNAL OF TOURISM Volume 6, Number 1, Spring 2011, pp. 165-191 UDC: 338.48+640(050) After peak oil production, the second half of the available oil’s production will fall increasingly quickly, until it levels off to exhaustion point. Considerable attention was given to Hubbert as he correctly predicted that the US would reach Peak Oil in 1970 (Leigh. 2008, p. 15). His theory is typically known as Peak Oil and is shown in the graph below: THE REALITY OF PEAK OIL? Many voices are increasingly warning that we have reached the era of Peak Oil now. Although not universally accepted, many facts do indicate that we are now rapidly approaching Peak Oil, or are already at the beginning of the phenomenon now. For example, as shown in the table below, conventional crude oil production worldwide declined from a peak of 73.81 million barrels per day (mbpd) in 2005 through 2007 at 73.27 mbpd, but re-peaked slightly at 74.48 mbpd in 2008 – hardly lifting off the bumpy plateau with an increase of less than 1% above the 2005 year: Table 2 Oil Production Worldwide Crude Oil Production Year Production (mbpd) 2005 73.81 2006 73.54 2007 73.27 2008 74.48 (EIA; The Oil Drum, 2008) However, this flat production level of world crude oil confronted increasing high levels of world crude oil demand due to high levels of economic development in less developed countries like China and India, both growing at around 9% annually. Also, the maintenance of a high level of economic development in more slowly growing, already developed economies, like in Europe and the US, has continued the ongoing high demand for crude oil. Both Europe and the US have to import more than half their petroleum needs. In China alone the daily consumption has increased from 3.4 mbpd to 6.7 mbpd, a massive increase of approaching 100 % in the years 1995 to 2004. China alone consumed almost 13% of the world’s total oil production in 2004. Similar trends in oil demand have occurred 169
James Leigh and are projected for India, although not from the same high base level. Even so China and India together in 2004 consumed a massive amount of about 18% of the world oil supply (Leigh, 2008, p 16). The chart below from Stanford (2005) shows the historic continuing increase in demand for oil, in China and India, to fire up their impressive economic development. Figure 2 China and India Oil Consumption It has been estimated that the extra oil supply equivalent to three Saudi Arabias will have to come on tap by 2030 just to keep pace with world demand (Landers, 2007). This extra supply doesn’t appear to be remotely possible to be achieved. The following table of peaks and troughs of oil price tend to bear out the assertion that it was the market forces pushed oil prices up dramatically in the early third millennium: The table above shows the average yearly price for crude oil rose 225% from 1984 to 2008, but most of that increase actually occurred in the last seven years since 2002. Crude’s recent rising prices, far beyond inflation, would suggest that the markets were anxious in the last few years, possibly due to world economic forces of rising demand confronting flat production levels. However, the collapsing price of oil since July 2008, when it reached $147 bbl, to the February price of $31 bbl in 2009, shocked most of the world with an oil price freefall of almost 80%. 170
- Page 120 and 121: TOURISMOS: AN INTERNATIONAL MULTIDI
- Page 122: TOURISMOS: AN INTERNATIONAL MULTIDI
- Page 125 and 126: Maria Alebaki & Olga Iakovidou “w
- Page 127 and 128: Maria Alebaki & Olga Iakovidou Desc
- Page 129 and 130: Maria Alebaki & Olga Iakovidou 2006
- Page 131 and 132: Maria Alebaki & Olga Iakovidou the
- Page 133 and 134: Maria Alebaki & Olga Iakovidou In s
- Page 135 and 136: Maria Alebaki & Olga Iakovidou It i
- Page 137 and 138: Maria Alebaki & Olga Iakovidou Blij
- Page 139 and 140: Maria Alebaki & Olga Iakovidou McDo
- Page 141 and 142: 140 Maria Alebaki & Olga Iakovidou
- Page 143 and 144: Juan Gabriel Brida, Linda Osti & Es
- Page 145 and 146: Juan Gabriel Brida, Linda Osti & Es
- Page 147 and 148: Juan Gabriel Brida, Linda Osti & Es
- Page 149 and 150: Juan Gabriel Brida, Linda Osti & Es
- Page 151 and 152: Juan Gabriel Brida, Linda Osti & Es
- Page 153 and 154: Juan Gabriel Brida, Linda Osti & Es
- Page 155 and 156: Juan Gabriel Brida, Linda Osti & Es
- Page 157 and 158: Juan Gabriel Brida, Linda Osti & Es
- Page 159 and 160: Juan Gabriel Brida, Linda Osti & Es
- Page 161 and 162: Juan Gabriel Brida, Linda Osti & Es
- Page 163 and 164: Juan Gabriel Brida, Linda Osti & Es
- Page 166 and 167: TOURISMOS: AN INTERNATIONAL MULTIDI
- Page 168 and 169: TOURISMOS: AN INTERNATIONAL MULTIDI
- Page 172 and 173: TOURISMOS: AN INTERNATIONAL MULTIDI
- Page 174 and 175: TOURISMOS: AN INTERNATIONAL MULTIDI
- Page 176 and 177: TOURISMOS: AN INTERNATIONAL MULTIDI
- Page 178 and 179: TOURISMOS: AN INTERNATIONAL MULTIDI
- Page 180 and 181: TOURISMOS: AN INTERNATIONAL MULTIDI
- Page 182 and 183: TOURISMOS: AN INTERNATIONAL MULTIDI
- Page 184 and 185: TOURISMOS: AN INTERNATIONAL MULTIDI
- Page 186 and 187: TOURISMOS: AN INTERNATIONAL MULTIDI
- Page 188 and 189: TOURISMOS: AN INTERNATIONAL MULTIDI
- Page 190 and 191: TOURISMOS: AN INTERNATIONAL MULTIDI
- Page 192: TOURISMOS: AN INTERNATIONAL MULTIDI
- Page 195 and 196: A. Akın Aksu & Sevcan Yildiz Gener
- Page 197 and 198: A. Akın Aksu & Sevcan Yildiz level
- Page 199 and 200: A. Akın Aksu & Sevcan Yildiz Accor
- Page 201 and 202: A. Akın Aksu & Sevcan Yildiz great
- Page 203 and 204: DATA FINDINGS A. Akın Aksu & Sevca
- Page 205 and 206: A. Akın Aksu & Sevcan Yildiz 7. Th
- Page 207 and 208: A. Akın Aksu & Sevcan Yildiz Table
- Page 209 and 210: A. Akın Aksu & Sevcan Yildiz *YTL:
- Page 211 and 212: A. Akın Aksu & Sevcan Yildiz the f
- Page 213 and 214: 212 A. Akın Aksu & Sevcan Yildiz A
- Page 215 and 216: Filippo Monge & Paolo Brandimarte r
- Page 217 and 218: Filippo Monge & Paolo Brandimarte s
- Page 219 and 220: Filippo Monge & Paolo Brandimarte T
James Leigh<br />
<strong>an</strong>d are projected for India, although not from the same high base level.<br />
Even so China <strong>an</strong>d India together in 2004 consumed a massive amount of<br />
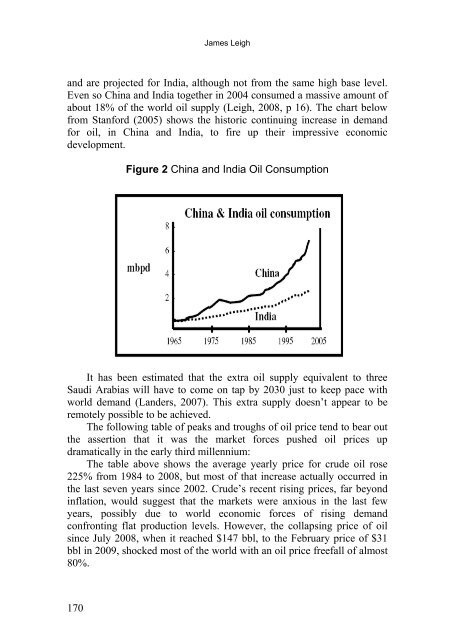
about 18% of the world oil supply (Leigh, 2008, p 16). The chart below<br />
from St<strong>an</strong>ford (2005) shows the h<strong>is</strong>toric continuing increase in dem<strong>an</strong>d<br />
for oil, in China <strong>an</strong>d India, to fire up their impressive economic<br />
development.<br />
Figure 2 China <strong>an</strong>d India Oil Consumption<br />
It has been estimated that the extra oil supply equivalent to three<br />
Saudi Arabias will have to come on tap by 2030 just to keep pace with<br />
world dem<strong>an</strong>d (L<strong>an</strong>ders, 2007). Th<strong>is</strong> extra supply doesn’t appear to be<br />
remotely possible to be achieved.<br />
The following table of peaks <strong>an</strong>d troughs of oil price tend to bear out<br />
the assertion that it was the market forces pushed oil prices up<br />
dramatically in the early third millennium:<br />
The table above shows the average yearly price for crude oil rose<br />
225% from 1984 to 2008, but most of that increase actually occurred in<br />
the last seven years since 2002. Crude’s recent r<strong>is</strong>ing prices, far beyond<br />
inflation, would suggest that the markets were <strong>an</strong>xious in the last few<br />
years, possibly due to world economic forces of r<strong>is</strong>ing dem<strong>an</strong>d<br />
confronting flat production levels. However, the collapsing price of oil<br />
since July 2008, when it reached $147 bbl, to the February price of $31<br />
bbl in 2009, shocked most of the world with <strong>an</strong> oil price freefall of almost<br />
80%.<br />
170


