Reconciliation of Non-Gaap Financial Measures and Regulation G ...
Reconciliation of Non-Gaap Financial Measures and Regulation G ...
Reconciliation of Non-Gaap Financial Measures and Regulation G ...

You also want an ePaper? Increase the reach of your titles
YUMPU automatically turns print PDFs into web optimized ePapers that Google loves.
<strong>Reconciliation</strong> <strong>of</strong> <strong>Non</strong>-GAAP <strong>Financial</strong><br />
<strong>Measures</strong> <strong>and</strong> <strong>Regulation</strong> G Disclosures<br />
2011 Shareholders Meeting<br />
Page 1
<strong>Regulation</strong> G Disclosures<br />
To supplement our condensed consolidated financial statements presented in accordance with U.S.<br />
generally accepted accounting principles (GAAP), we provide additional measures <strong>of</strong> segments’<br />
operating income; cost <strong>of</strong> product sales <strong>and</strong> services; engineering, selling <strong>and</strong> administrative<br />
expenses; income before income taxes; income taxes; net income; net income attributable to Harris<br />
Corporation; <strong>and</strong> net income per diluted common share attributable to Harris Corporation common<br />
shareholders. Harris management believes that these non-GAAP financial measures, when<br />
considered together with the GAAP financial measures, provide information that is useful to investors<br />
in underst<strong>and</strong>ing period-over-period operating results separate <strong>and</strong> apart from items that may, or<br />
could, have a disproportionately positive or negative impact on results in any particular period. Harris<br />
management also believes that these non-GAAP financial measures enhance the ability <strong>of</strong> investors<br />
to analyze Harris’ business trends <strong>and</strong> to underst<strong>and</strong> Harris’ performance. In addition, Harris may<br />
utilize non-GAAP financial measures as a guide in its forecasting, budgeting, <strong>and</strong> long-term planning<br />
process <strong>and</strong> to measure operating performance for some management compensation purposes. Any<br />
analysis <strong>of</strong> non-GAAP financial measures should be used only in conjunction with results presented in<br />
accordance with GAAP. A reconciliation <strong>of</strong> these non-GAAP financial measures with the most directly<br />
comparable financial measures calculated in accordance with GAAP follows:<br />
2011 Shareholders Meeting<br />
Page 2
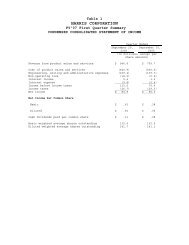
<strong>Reconciliation</strong> <strong>of</strong> <strong>Non</strong>-GAAP <strong>Financial</strong> <strong>Measures</strong><br />
Revenue from product sales <strong>and</strong> services<br />
Operating Income<br />
<strong>Non</strong>-operating loss<br />
Net Interest expense<br />
Income before income taxes<br />
Income taxes<br />
Net income<br />
<strong>Non</strong>controlling interests, net <strong>of</strong> income taxes<br />
Net income attributable to Harris Corporation<br />
Net income per diluted common share attributable to<br />
2011 Shareholders Meeting<br />
$ 5,924.6<br />
Total Company Results<br />
$ ―<br />
$ 5,924.6<br />
$ 5,206.1<br />
$ ―<br />
<strong>Non</strong>-GAAP<br />
% Change<br />
$ 5,206.1 13.8%<br />
970.2 46.6 (2) 1,016.8 912.8 26.1 (1) 938.9 8.3%<br />
(1.9) ― (1.9) (1.9) ― (1.9)<br />
(87.6) ― (87.6) (70.6) ― (70.6)<br />
880.7 46.6 927.3 840.3 26.1 866.4 7.0%<br />
(293.6) (9.8) (303.4) (278.7) (6.2) (284.9)<br />
$ 588.0<br />
Fiscal 2011<br />
587.1 36.8 623.9 561.6 19.9 581.5<br />
0.9 ― 0.9 ― ― ―<br />
$ 36.8<br />
(In millions, except per share amounts)<br />
$ 624.8<br />
$ 561.6<br />
$ 19.9<br />
$ 581.5 7.4%<br />
Harris Corporation common shareholders $ 4.60 $ 0.29 $ 4.89 $ 4.28 $ 0.15 $ 4.43 10.4%<br />
(1) Adjustments relate to costs associated with our acquisitions <strong>of</strong> Wireless Systems, Crucial Security, SolaCom ATC, Patriot, SignaCert <strong>and</strong> CapRock.<br />
(2) Adjustments relate to costs associated with our acquisitions <strong>of</strong> CapRock, Schlumberger GCS, Core180 <strong>and</strong> Carefx.<br />
Fiscal 2010<br />
As Reported Adjustment <strong>Non</strong>-GAAP As Reported Adjustment <strong>Non</strong>-GAAP<br />
Page 3
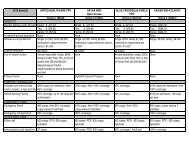
<strong>Reconciliation</strong> <strong>of</strong> <strong>Non</strong>-GAAP <strong>Financial</strong> <strong>Measures</strong><br />
2011 Shareholders Meeting<br />
FY07 FY08 FY09 FY10 FY11 FY12P<br />
GAAP EPS $ 2.49 $ 3.31 $ 2.33 $ 4.28 $ 4.60 $4.92-5.12<br />
<strong>Non</strong>-GAAP adjustments 0.22<br />
Earnings Per Share<br />
Fiscal '07 Actual to Fiscal '12 Guidance<br />
(1) 0.02<br />
(2) 1.52<br />
(3) 0.15<br />
(4) 0.29<br />
(5) 0.18 (6)<br />
<strong>Non</strong>-GAAP EPS $ 2.71 $ 3.33 $ 3.85 $ 4.43 $ 4.89 $5.10-5.30<br />
(1) Adjustments relate to the impact <strong>of</strong> cost-reduction actions in Broadcast Communications, a charge resulting from a decision to discontinue<br />
a s<strong>of</strong>tware development effort in Broadcast Communications, <strong>and</strong> impairment to our investment in Terion.<br />
(2) Adjustments relate to costs associated with our acquisitions <strong>of</strong> Multimax <strong>and</strong> Z<strong>and</strong>ar.<br />
(3) Adjustments relate to impairment <strong>of</strong> goodwill <strong>and</strong> other long-lived assets in Broadcast Communications, <strong>and</strong> to costs associated with our<br />
acquisitions <strong>of</strong> Wireless Systems <strong>and</strong> Crucial Security.<br />
(4) Adjustments relate to costs associated with our acquisitions <strong>of</strong> Wireless Systems, Crucial Security, SolaCom ATC, Patriot, SignaCert <strong>and</strong> CapRock.<br />
(5) Adjustments relate to costs associated with our acquisitions <strong>of</strong> CapRock, Schlumberger GCS, Core180 <strong>and</strong> Carefx.<br />
(6) Based on fiscal 2012 guidance provided on October 26, 2011.<br />
Page 4
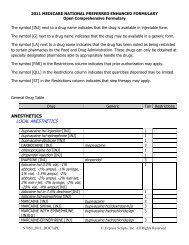
<strong>Reconciliation</strong> <strong>of</strong> <strong>Non</strong>-GAAP <strong>Financial</strong> <strong>Measures</strong><br />
2011 Shareholders Meeting<br />
Total Debt to Total Capital<br />
($ in millions)<br />
Short-term debt<br />
FY11<br />
$ 180.0<br />
Current portion <strong>of</strong> long-term debt 4.9<br />
Long-term debt 1,887.2<br />
Total debt (A) 2,072.1<br />
Equity 2,512.0<br />
Debt plus equity (total capital) (B) $ 4,584.1<br />
Total debt to total capital (A)/(B) 45.2%<br />
Page 5