Volume II - The Northern Cape Provincial Spatial Development ...
Volume II - The Northern Cape Provincial Spatial Development ... Volume II - The Northern Cape Provincial Spatial Development ...
Table 3.2: Summary of indicator groupings for towns and municipalities Natural Resources (11)∗ Human Resources (3) Composite Resource Potential Index (14) Transportation and Composite Infrastructure Communications (4) Institutional Services (8) Economic Sectors (5) Index (12) Composite Development Potential Index (40) Commercial Services (3) Composite Economic Market and Accessibility (4) Property Market (2) Activities Index (14) Human Development Composite Needs Needs (19) Composite Needs Index (19) Index (19) ∗This number refers to the number of variables in each indicator group (See Table 3.4) Although the main focus of this study is to identify those towns in the province that have inherent positive growth and development potential, it is also incumbent upon the analysis to provide guidelines that will allow formulation of nuanced policies for handling places with low growth potential, but where human needs are high. To this end another set of variables measuring a fourth dimension on human development needs was derived. These themes and sub-themes not only comply with the requirements set out in the NSDP and Northern Cape PGDS policy documents, but also with the guidelines distilled from the international literature. Apart from giving a cross-sectional perspective on the status quo in the 115 urban places, the study also endeavours to add a regional and contextual element to the analysis by computing and mapping the same set of indices ∗ for the 32 local municipalities, principally based on 2007 data. Change analysis at local municipality level is done by comparing 2001 data with 2007 data. Unfortunately not all variables included in the analysis for towns were available to measure changes at the municipal level between 2001 and 2007. Some variables are not meaningful at a municipal level for comparative purposes, such as the presence of a municipal seat, whilst others don’t change over time. The 27 variables in Table 3.3 were used for the measurement of change at municipal level. ∗ In the case of municipalities, two variables (municipal seat and urban functional index) were not significant and omitted – thus leaving 57 variables for the measurements at municipal level and 59 at town level. 27
Table 3.3: Summary of indicator groupings for change at municipality level. Human Resources (3) Composite Development Potential Economic Sectors (5) Index (10) Market Potential (2) Human Development Needs (17) Composite Needs Index (17) A detailed explanation of how the values for different variables in the data matrix were derived will now be provided. Combined quantitative indicators indexing each of the urban development dimensions were devised by standardizing the selected individual variables and summing the standardized z-scores to derive compound indices. Standardized z-scores are computed by the formula: z = ( x − x ) / sd ik Where: ik k k x ik = Raw value of variable k for town i x k = Mean value of variable k for all towns in the province sdk = Standard deviation of variable k. The z-score of variable k has an average value of zero and a standard deviation of 1.0. This means that towns that have values above the provincial average for a particular variable have positive z-scores, whereas towns that have negative z-scores have values below the provincial average. Those towns with values close to the average have small deviations from zero, whereas those that have large positive or negative z-scores are substantially above or below the mean for the province. As z-scores for different variables are comparable, these were aggregated to create the various indices. The index values represent the mean of the z-scores. See Table 3.4 for details regarding the specific variables used to create the compound indices for each of the levels of analysis. The table provides a brief explanation of the data sources and statistical procedures used to generate each of the variables for respectively the 115 towns and the 32 municipalities. Each of the indices and their derivation is discussed in the following section. 3.3 Indices for present status of towns and municipalities Firstly the indicators for the “present” cross-sectional profiles of the towns and municipalities will be explained. 28
- Page 225 and 226: MAPPING OF SPCs & SUB‐CATEGORIES
- Page 227 and 228: 2. ENSURING HIGH QUALITY DEVELOPMEN
- Page 229 and 230: A MODEL FOR SUBSIDISED HOUSING: RES
- Page 231 and 232: 3. ESTABLISHING INTEGRATED LAND MAN
- Page 233 and 234: NATIONAL/PROVINCIAL AREAS OF OVERLA
- Page 235 and 236: BASIS FOR FORMULATION OF PROPOSALS
- Page 237 and 238: 6. ENHANCING OPPORTUNITIES FOR & MA
- Page 239 and 240: CONCLUSION PSDF provides for the fo
- Page 241 and 242: VOLUME 1 CONTEXT & OVER‐ARCHING P
- Page 243 and 244: CLOSURE Provincial Spatial Developm
- Page 245 and 246: CONTENTS Maps…………………
- Page 247 and 248: MAPS Figure 1.1 Research agenda ...
- Page 249 and 250: ADDENDA 1. Data Matrix 1.1 Town pro
- Page 251 and 252: struggling to survive - to the detr
- Page 253 and 254: CHAPTER 2 CONCEPTUAL FRAMEWORK: INS
- Page 255 and 256: • Social Capital concerns investm
- Page 257 and 258: It is now widely recognised that an
- Page 259 and 260: 2.1.3 Criteria influencing growth a
- Page 261 and 262: for the economic activities of a to
- Page 263 and 264: Africa is not unique. The NSDP (200
- Page 265 and 266: • Future economic growth should p
- Page 267 and 268: different. The NSDP argues that the
- Page 269 and 270: following empirical analysis of tow
- Page 271 and 272: Figure 3.1: Towns and administrativ
- Page 273 and 274: Table 3.1: List of towns and munici
- Page 275: 97 Griekwastad Siyancuma Pixley Ka
- Page 279 and 280: generating jobs and income such as
- Page 281 and 282: Transportation and communications A
- Page 283 and 284: Racial composition (Empowerment eli
- Page 285 and 286: Table 3.5: Variables for Municipal
- Page 287 and 288: 3.6 Presenting the quantitative pro
- Page 289 and 290: 21 Kimberley 2 Victoria West 3 22 K
- Page 291 and 292: 14 Nababeep 2 Noupoort 2 Colesberg
- Page 293 and 294: Hopetown 1 1 1 High Dev/High Need J
- Page 295 and 296: Vioolsdrif 2 1 3 Transitional Vosbu
- Page 297 and 298: Kimberley 1 2 2 High Dev/Low Need K
- Page 299 and 300: Figure 3.3: Development potential i
- Page 301 and 302: Figure 3.5: Composite resources ind
- Page 303 and 304: Figure 3.7: Composite economic acti
- Page 305 and 306: Figure 3.9: Investment typology of
- Page 307 and 308: 8 Umsobomvu 2 Emthanjeni 2 Kai !Gar
- Page 309 and 310: Figure 3.10: Development potential
- Page 311 and 312: Figure 3.12: Composite resource ind
- Page 313 and 314: Figure 3.14: Composite economic ind
- Page 315 and 316: Figure 3.16: Investment typology of
- Page 317 and 318: Figure 3.18: Human needs index of t
- Page 319 and 320: 3.6.3 Temporal profiles of municipa
- Page 321 and 322: (b) SORTED ALPHABETICALLY Developme
- Page 323 and 324: Figure 3.21: Development Potential
- Page 325 and 326: 3.7 Qualitative evaluation In the m
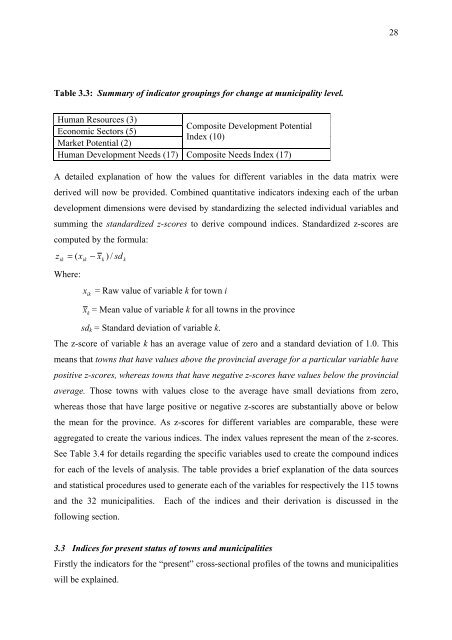
Table 3.3: Summary of indicator groupings for change at municipality level.<br />
Human Resources (3)<br />
Composite <strong>Development</strong> Potential<br />
Economic Sectors (5)<br />
Index (10)<br />
Market Potential (2)<br />
Human <strong>Development</strong> Needs (17) Composite Needs Index (17)<br />
A detailed explanation of how the values for different variables in the data matrix were<br />
derived will now be provided. Combined quantitative indicators indexing each of the urban<br />
development dimensions were devised by standardizing the selected individual variables and<br />
summing the standardized z-scores to derive compound indices. Standardized z-scores are<br />
computed by the formula:<br />
z = ( x − x ) / sd<br />
ik<br />
Where:<br />
ik<br />
k<br />
k<br />
x ik = Raw value of variable k for town i<br />
x k = Mean value of variable k for all towns in the province<br />
sdk = Standard deviation of variable k.<br />
<strong>The</strong> z-score of variable k has an average value of zero and a standard deviation of 1.0. This<br />
means that towns that have values above the provincial average for a particular variable have<br />
positive z-scores, whereas towns that have negative z-scores have values below the provincial<br />
average. Those towns with values close to the average have small deviations from zero,<br />
whereas those that have large positive or negative z-scores are substantially above or below<br />
the mean for the province. As z-scores for different variables are comparable, these were<br />
aggregated to create the various indices. <strong>The</strong> index values represent the mean of the z-scores.<br />
See Table 3.4 for details regarding the specific variables used to create the compound indices<br />
for each of the levels of analysis. <strong>The</strong> table provides a brief explanation of the data sources<br />
and statistical procedures used to generate each of the variables for respectively the 115 towns<br />
and the 32 municipalities. Each of the indices and their derivation is discussed in the<br />
following section.<br />
3.3 Indices for present status of towns and municipalities<br />
Firstly the indicators for the “present” cross-sectional profiles of the towns and municipalities<br />
will be explained.<br />
28


