
You also want an ePaper? Increase the reach of your titles
YUMPU automatically turns print PDFs into web optimized ePapers that Google loves.
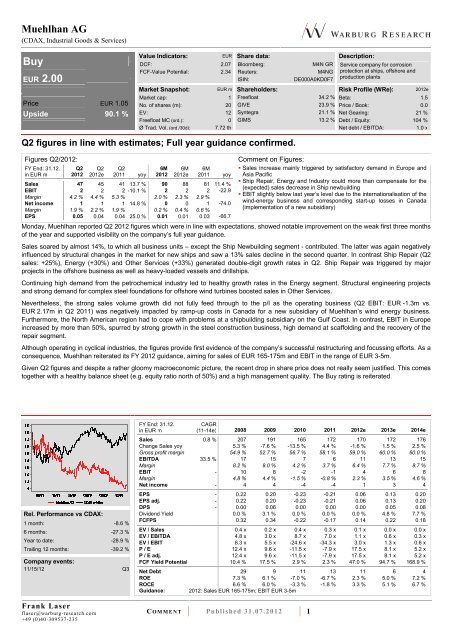
<strong>Muehlhan</strong> <strong>AG</strong><br />
(CDAX, Industrial Goods & Services)<br />
<strong>Buy</strong><br />
EUR 2.00<br />
Price EUR 1.05<br />
Upside 90.1 %<br />
Frank Laser<br />
flaser@warburg-research.com<br />
+49 (0)40-309537-235<br />
Value Indicators: EUR Share data: Description:<br />
DCF: 2.07<br />
FCF-Value Potential: 2.34<br />
Bloomberg: M4N GR<br />
Reuters: M4NG<br />
ISIN: DE000A0KD0F7<br />
C O M M E N T Published 31.07.2012 1<br />
Service company for corrosion<br />
protection at ships, offshore and<br />
production plants<br />
Market Snapshot: EUR m Shareholders: Risk Profile (WRe): 2012e<br />
Market cap: 1<br />
No. of shares (m): 20<br />
EV: 12<br />
Freefloat MC (ord.): 0<br />
Ø Trad. Vol. (ord./30d): 7.72 th<br />
Freefloat 34.2 %<br />
GIVE 23.9 %<br />
Syntegra 21.1 %<br />
GIMS 13.2 %<br />
Q2 figures in line with estimates; Full year guidance confirmed.<br />
Figures Q2/2012: Comment on Figures:<br />
FY End: 31.12.<br />
in EUR m<br />
Q2<br />
2012<br />
Q2<br />
2012e<br />
Q2<br />
2011 yoy<br />
6M<br />
2012<br />
6M<br />
2012e<br />
6M<br />
2011 yoy<br />
Beta: 1.5<br />
Price / Book: 0.0<br />
Net Gearing: 21 %<br />
Debt / Equity: 104 %<br />
Net debt / EBITDA: 1.0 x<br />
Sales increase mainly triggered by satisfactory demand in Europe and<br />
Asia Pacific<br />
Ship Repair, Energy and Industry could more than compensate for the<br />
(expected) sales decrease in Ship newbuilding<br />
EBIT slightly below last year’s level due to the internationalisation of the<br />
wind-energy business and corresponding start-up losses in Canada<br />
(implementation of a new subsidiary)<br />
Sales 47 45 41 13.7 % 90 88 81 11.4 %<br />
EBIT 2 2 2 -10.1 % 2 2 2 -22.9<br />
Margin 4.2 % 4.4 % 5.3 % 2.0 % 2.3 % 2.9 % %<br />
Net income 1 1 1 14.8 % 0 0 1 -74.0<br />
Margin 1.9 % 2.2 % 1.9 % 0.2 % 0.4 % 0.6 % %<br />
EPS 0.05 0.04 0.04 25.0 % 0.01 0.01 0.03 -66.7<br />
%<br />
Monday, <strong>Muehlhan</strong> reported Q2 2012 figures which were in line with expectations, showed notable improvement on the weak first three months<br />
of the year and supported visibility on the company’s full year guidance.<br />
Sales soared by almost 14%, to which all business units – except the Ship Newbuilding segment - contributed. The latter was again negatively<br />
influenced by structural changes in the market for new ships and saw a 13% sales decline in the second quarter. In contrast Ship Repair (Q2<br />
sales: +25%), Energy (+30%) and Other Services (+33%) generated double-digit growth rates in Q2. Ship Repair was triggered by major<br />
projects in the offshore business as well as heavy-loaded vessels and drillships.<br />
Continuing high demand from the petrochemical industry led to healthy growth rates in the Energy segment. Structural engineering projects<br />
and strong demand for complex steel foundations for offshore wind turbines boosted sales in Other Services.<br />
Nevertheless, the strong sales volume growth did not fully feed through to the p/l as the operating business (Q2 EBIT: EUR -1.3m vs.<br />
EUR 2.17m in Q2 2011) was negatively impacted by ramp-up costs in Canada for a new subsidiary of <strong>Muehlhan</strong>’s wind energy business.<br />
Furthermore, the North American region had to cope with problems at a shipbuilding subsidiary on the Gulf Coast. In contrast, EBIT in Europe<br />
increased by more than 50%, spurred by strong growth in the steel construction business, high demand at scaffolding and the recovery of the<br />
repair segment.<br />
Although operating in cyclical industries, the figures provide first evidence of the company’s successful restructuring and focussing efforts. As a<br />
consequence, <strong>Muehlhan</strong> reiterated its FY 2012 guidance, aiming for sales of EUR 165-175m and EBIT in the range of EUR 3-5m.<br />
Given Q2 figures and despite a rather gloomy macroeconomic picture, the recent drop in share price does not really seem justified. This comes<br />
together with a healthy balance sheet (e.g. equity ratio north of 50%) and a high management quality. The <strong>Buy</strong> rating is reiterated.<br />
Rel. Performance vs CDAX:<br />
1 month: -8.6 %<br />
6 months: -27.3 %<br />
Year to date: -28.9 %<br />
Trailing 12 months: -39.2 %<br />
Company events:<br />
11/15/12 Q3<br />
FY End: 31.12.<br />
in EUR m<br />
C<strong>AG</strong>R<br />
(11-14e) 2008 2009 2010 2011 2012e 2013e 2014e<br />
Sales 0.8 % 207 191 165 172 170 172 176<br />
Change Sales yoy 5.3 % -7.6 % -13.5 % 4.4 % -1.6 % 1.5 % 2.5 %<br />
Gross profit margin 54.9 % 52.7 % 56.7 % 58.1 % 59.0 % 60.0 % 60.0 %<br />
EBITDA 33.5 % 17 15 7 6 11 13 15<br />
Margin 8.2 % 8.0 % 4.2 % 3.7 % 6.4 % 7.7 % 8.7 %<br />
EBIT - 10 8 -2 -1 4 6 8<br />
Margin 4.8 % 4.4 % -1.5 % -0.8 % 2.3 % 3.5 % 4.6 %<br />
Net income - 4 4 -4 -4 1 3 4<br />
EPS - 0.22 0.20 -0.23 -0.21 0.06 0.13 0.20<br />
EPS adj. - 0.22 0.20 -0.23 -0.21 0.06 0.13 0.20<br />
DPS - 0.00 0.06 0.00 0.00 0.00 0.05 0.08<br />
Dividend Yield 0.0 % 3.1 % 0.0 % 0.0 % 0.0 % 4.8 % 7.7 %<br />
FCFPS 0.32 0.34 -0.22 -0.17 0.14 0.22 0.18<br />
EV / Sales 0.4 x 0.2 x 0.4 x 0.3 x 0.1 x 0.0 x 0.0 x<br />
EV / EBITDA 4.8 x 3.0 x 8.7 x 7.0 x 1.1 x 0.6 x 0.3 x<br />
EV / EBIT 8.3 x 5.5 x -24.6 x -34.3 x 3.0 x 1.3 x 0.6 x<br />
P / E 12.4 x 9.6 x -11.5 x -7.9 x 17.5 x 8.1 x 5.2 x<br />
P / E adj. 12.4 x 9.6 x -11.5 x -7.9 x 17.5 x 8.1 x 5.2 x<br />
FCF Yield Potential 10.4 % 17.5 % 2.9 % 2.3 % 47.0 % 94.7 % 168.9 %<br />
Net Debt 29 9 11 13 11 6 4<br />
ROE 7.3 % 6.1 % -7.0 % -6.7 % 2.3 % 5.0 % 7.2 %<br />
ROCE 6.6 % 6.0 % -3.3 % -1.8 % 3.3 % 5.1 % 6.7 %<br />
Guidance: 2012: Sales EUR 165-175m; EBIT EUR 3-5m
<strong>Muehlhan</strong> <strong>AG</strong><br />
Sales development<br />
in EUR m<br />
Source: Warburg Research<br />
Company Background<br />
Sales by regions<br />
2011; in %<br />
Source: Warburg Research<br />
C O M M E N T Published 31.07.2012 2<br />
EBIT development<br />
in EUR m<br />
Source: Warburg Research<br />
<strong>Muehlhan</strong> is one of the leading providers of specialized services in connection with corrosion protection of surfaces, particularly for<br />
ships, infrastructural facilities like bridges, drilling rigs + wind generators.<br />
The coating is applied on newly built objects first and is renewed in regular maintenance intervals of 5-10 years.<br />
Ship Newbuilding and Ship Repair are the company's important pillars. As a result of the diversification of the business activities,<br />
however, the Industry Services segment has the highest sales contribution by now.<br />
This is partly due to the regional diversification for which the Middle East is playing an increasingly important role and where<br />
<strong>Muehlhan</strong> solely provides industry services.<br />
Competitive Quality<br />
The competitive quality vis-à-vis a high number of mainly smaller competitors is a result of...<br />
...the comparably strong financing power, the long-standing customer relationships as well as the brand name resulting from quality<br />
and tradition.<br />
The capital intensity of larger and more complex orders limits the ROCE to some extent but it also creates barriers to market entry for<br />
smaller competitors.<br />
Although the shipping segments should continue to be challenging <strong>Muehlhan</strong> is likely to benefit from the expected market<br />
consolidation as less diversified and financially weaker competitors will withdraw from the market.<br />
EBT development<br />
in EUR m<br />
Source: Warburg Research<br />
Sales by segments<br />
2011; in %<br />
Source: Warburg Research<br />
Net income development<br />
in EUR m<br />
Source: Warburg Research
<strong>Muehlhan</strong> <strong>AG</strong><br />
DCF model<br />
Detailed forecast period Transitional period Term. Value<br />
Figures in EUR m 2012e 2013e 2014e 2015e 2016e 2017e 2018e 2019e 2020e 2021e 2022e 2023e 2024e<br />
Sales 170 172 176 181 185 190 195 199 203 208 212 216 220<br />
Sales change -1.6 % 1.5 % 2.5 % 2.5 % 2.5 % 2.5 % 2.5 % 2.5 % 2.0 % 2.0 % 2.0 % 2.0 % 2.0 % 2.0 %<br />
EBIT 4 6 8 7 7 7 7 7 7 7 7 8 8<br />
EBIT-margin 2.3 % 3.5 % 4.6 % 4.0 % 4.0 % 3.5 % 3.5 % 3.5 % 3.5 % 3.5 % 3.5 % 3.5 % 3.5 %<br />
Tax rate (EBT) 34.0 % 34.0 % 34.0 % 34.0 % 34.0 % 35.0 % 35.0 % 35.0 % 35.0 % 35.0 % 35.0 % 35.0 % 35.0 %<br />
NOPAT 3 4 5 5 5 4 4 5 5 5 5 5 5<br />
Depreciation 7 7 7 6 6 6 7 7 7 7 7 7 7<br />
in % of Sales 4.1 % 4.2 % 4.1 % 3.4 % 3.4 % 3.4 % 3.4 % 3.4 % 3.4 % 3.4 % 3.4 % 3.4 % 3.4 %<br />
Changes in provisions 0 0 0 0 0 0 0 0 0 0 0 0 0<br />
Change in Liquidity from<br />
- Working Capital -7 -1 1 1 2 2 1 1 1 2 1 1 1<br />
- Capex 6 6 7 6 6 7 7 7 7 7 7 7 7<br />
Capex in % of Sales 3.8 % 3.8 % 3.8 % 3.5 % 3.5 % 3.5 % 3.5 % 3.5 % 3.5 % 3.4 % 3.4 % 3.4 % 3.4 %<br />
Other 0 0 0 0 0 0 0 0 0 0 0 0 0<br />
Free Cash Flow (WACC<br />
Model)<br />
10 6 5 3 3 3 4 4 4 3 4 4 4 4<br />
PV of FCF 10 5 4 2 2 2 2 2 2 1 2 1 1 18<br />
share of PVs 34.51 % 31.92 % 33.57 %<br />
Model parameter Valuation (m)<br />
Derivation of WACC: Derivation of Beta: Present values 2024e 36<br />
Terminal Value 18<br />
Debt ratio 25.00 % Financial Strength 1.50 Financial liabilities 23<br />
Cost of debt 4.6 % Liquidity 1.50 Pension liabilities 1<br />
Market return 9.00 % Cyclicality 1.50 Hybrid capital 0<br />
Risk free rate 4.00 % Transparency 1.50 Minority interest 0<br />
Others 1.50 Market val. of investments 0<br />
Liquidity 11 No. of shares (m) 19.5<br />
WACC 9.76 % Beta 1.50 Equity Value 40 Value per share (EUR) 2.07<br />
Sensitivity Value per Share (EUR)<br />
Terminal Growth Delta EBIT-margin<br />
Beta (WACC) 1.25 % 1.50 % 1.75 % 2.00 % 2.25 % 2.50 % 2.75 % Beta (WACC) -1.5 pp -1.0 pp -0.5 pp 0.0 +0.5 pp +1.0 pp +1.5 pp<br />
1.77 (10.8 %) 1.75 1.77 1.79 1.81 1.83 1.85 1.88 1.77 (10.8 %) 0.76 1.11 1.46 1.81 2.16 2.51 2.85<br />
1.63 (10.3 %) 1.86 1.88 1.90 1.93 1.95 1.98 2.01 1.63 (10.3 %) 0.82 1.19 1.56 1.93 2.30 2.67 3.04<br />
1.57 (10.0 %) 1.92 1.94 1.97 2.00 2.02 2.05 2.09 1.57 (10.0 %) 0.85 1.23 1.62 2.00 2.38 2.76 3.14<br />
1.50 (9.8 %) 1.99 2.01 2.04 2.07 2.10 2.13 2.17 1.50 (9.8 %) 0.89 1.28 1.67 2.07 2.46 2.85 3.24<br />
1.43 (9.5 %) 2.05 2.08 2.11 2.14 2.18 2.21 2.25 1.43 (9.5 %) 0.93 1.33 1.74 2.14 2.55 2.95 3.36<br />
1.37 (9.3 %) 2.13 2.16 2.19 2.22 2.26 2.30 2.35 1.37 (9.3 %) 0.97 1.39 1.81 2.22 2.64 3.06 3.48<br />
1.23 (8.8 %) 2.29 2.32 2.36 2.41 2.45 2.50 2.55 1.23 (8.8 %) 1.06 1.51 1.96 2.41 2.85 3.30 3.75<br />
High beta due to low visibility and high cyclicality<br />
Long term growth rates in line with market growth<br />
C O M M E N T Published 31.07.2012 3
<strong>Muehlhan</strong> <strong>AG</strong><br />
Free Cash Flow Value Potential<br />
Warburg Research's valuation tool "FCF Value Potential" reflects the ability of the company to generate sustainable free cash flows. It is based on the<br />
"FCF potential" - a FCF "ex growth" figure - which assumes unchanged working capital and pure maintenance capex. A value indication is derived by<br />
discounting the “FCF potential” of a given year with the weighted costs of capital. The fluctuating value indications over time add a timing element to the<br />
DCF model (our preferred valuation tool).<br />
in EUR m 2008 2009 2010 2011 2012e 2013e 2014e<br />
Net Income before minorities 5 4 -4 -4 1 3 4<br />
+ Depreciation + Amortisation 7 7 9 8 7 7 7<br />
- Net Interest Income -2 -2 -1 -2 -2 -2 -2<br />
- Maintenance Capex 6 5 5 5 5 5 5<br />
+ Others 0 0 0 0 0 0 0<br />
= Free Cash Flow Potential 9 8 2 1 5 7 8<br />
Free Cash Flow Yield Potential 10.4 % 17.5 % 2.9 % 2.3 % 47.0 % 94.7 % 168.9 %<br />
WACC 9.76 % 9.76 % 9.76 % 9.76 % 9.76 % 9.76 % 9.76 %<br />
= Enterprise Value (EV) 82 46 61 45 12 7 5<br />
= Fair Enterprise Value 87 83 18 11 56 72 86<br />
- Net Debt (Cash) 12 12 12 12 10 6 3<br />
- Pension Liabilities 1 1 1 1 1 1 1<br />
- Others 0 0 0 0 0 0 0<br />
- Market value of minorities 0 0 0 0 0 0 0<br />
+ Market value of investments 0 0 0 0 0 0 0<br />
= Fair Market Capitalisation 74 69 5 n.a. 46 66 82<br />
No. of shares (total) (m) 20 20 20 20 20 20 20<br />
= Fair value per share (EUR) 3.80 3.56 0.26 n.a. 2.34 3.38 4.20<br />
premium (-) / discount (+) in % 122.5 % 221.7 % 304.8 %<br />
Sensitivity Fair value per Share (EUR)<br />
12.76 % 2.75 2.56 0.04 n.a. 1.66 2.51 3.16<br />
11.76 % 3.04 2.84 0.10 n.a. 1.85 2.75 3.45<br />
10.76 % 3.38 3.16 0.17 n.a. 2.07 3.04 3.79<br />
WACC 9.76 % 3.80 3.56 0.26 n.a. 2.34 3.38 4.20<br />
8.76 % 4.31 4.04 0.37 n.a. 2.67 3.81 4.70<br />
7.76 % 4.95 4.65 0.50 0.00 3.08 4.34 5.33<br />
6.76 % 5.78 5.44 0.68 0.10 3.62 5.03 6.15<br />
Cash flows about to stabilise due to restructuring and new focus<br />
Long term potential significantly above current share price<br />
C O M M E N T Published 31.07.2012 4
<strong>Muehlhan</strong> <strong>AG</strong><br />
Valuation<br />
2008 2009 2010 2011 2012e 2013e 2014e<br />
Price / Book 0.8 x 0.6 x 0.8 x 0.6 x 0.0 x 0.0 x 0.0 x<br />
Book value per share ex intangibles 1.82 2.01 2.01 1.86 1.49 1.63 1.77<br />
EV / Sales 0.4 x 0.2 x 0.4 x 0.3 x 0.1 x 0.0 x 0.0 x<br />
EV / EBITDA 4.8 x 3.0 x 8.7 x 7.0 x 1.1 x 0.6 x 0.3 x<br />
EV / EBIT 8.3 x 5.5 x -24.6 x -34.3 x 3.0 x 1.3 x 0.6 x<br />
EV / EBIT adj.* 8.3 x 5.5 x -24.6 x -34.3 x 3.0 x 1.3 x 0.6 x<br />
P / FCF 8.6 x 5.6 x -12.3 x -9.9 x 7.6 x 4.8 x 5.6 x<br />
P / E 12.4 x 9.6 x -11.5 x -7.9 x 17.5 x 8.1 x 5.2 x<br />
P / E adj.* 12.4 x 9.6 x -11.5 x -7.9 x 17.5 x 8.1 x 5.2 x<br />
Dividend Yield 0.0 % 3.1 % 0.0 % 0.0 % 0.0 % 4.8 % 7.7 %<br />
Free Cash Flow Yield Potential 10.4 % 17.5 % 2.9 % 2.3 % 47.0 % 94.7 % 168.9 %<br />
*Adjustments made for: -<br />
C O M M E N T Published 31.07.2012 5
<strong>Muehlhan</strong> <strong>AG</strong><br />
Consolidated profit & loss<br />
In EUR m 2008 2009 2010 2011 2012e 2013e 2014e<br />
Sales 207 191 165 172 170 172 176<br />
Change Sales yoy 5.3 % -7.6 % -13.5 % 4.4 % -1.6 % 1.5 % 2.5 %<br />
Increase / decrease in inventory 0 0 0 0 0 0 0<br />
Own work capitalised 0 0 0 0 0 0 0<br />
Total Sales 207 191 165 172 170 172 176<br />
Material Expenses 93 90 71 72 69 69 71<br />
Gross profit 113 101 94 100 100 103 106<br />
Gross profit margin 54.9 % 52.7 % 56.7 % 58.1 % 59.0 % 60.0 % 60.0 %<br />
Personnel expenses 71 63 62 66 64 64 65<br />
Other operating income 7 6 5 4 4 4 4<br />
Other operating expenses 32 29 29 31 29 30 30<br />
Unfrequent items 0 0 0 0 0 0 0<br />
EBITDA 17 15 7 6 11 13 15<br />
Margin 8.2 % 8.0 % 4.2 % 3.7 % 6.4 % 7.7 % 8.7 %<br />
Depreciation of fixed assets 7 7 6 8 7 7 7<br />
EBITA 10 8 1 -1 4 6 8<br />
Amortisation of intangible assets 0 0 3 0 0 0 0<br />
Goodwill amortization 0 0 0 0 0 0 0<br />
EBIT 10 8 -2 -1 4 6 8<br />
Margin 4.8 % 4.4 % -1.5 % -0.8 % 2.3 % 3.5 % 4.6 %<br />
EBIT adj. 10 8 -2 -1 4 6 8<br />
Interest income 0 1 0 0 0 0 0<br />
Interest expenses 3 2 2 2 2 2 2<br />
Other financial income (loss) 0 0 0 0 0 0 0<br />
EBT 8 7 -4 -3 2 4 6<br />
Margin 3.7 % 3.4 % -2.4 % -2.0 % 1.1 % 2.2 % 3.3 %<br />
Total taxes 3 2 1 1 1 1 2<br />
Net income from continuing operations 5 4 -4 -4 1 3 4<br />
Income from discontinued operations (net of tax) 0 0 0 0 0 0 0<br />
Net income before minorities 5 4 -4 -4 1 3 4<br />
Minority interest -1 -1 0 0 0 0 0<br />
Net income 4 4 -4 -4 1 3 4<br />
Margin 2.1 % 2.0 % -2.6 % -2.3 % 0.7 % 1.5 % 2.2 %<br />
Number of shares, average 20 19 19 19 19 19 19<br />
EPS 0.22 0.20 -0.23 -0.21 0.06 0.13 0.20<br />
EPS adj. 0.22 0.20 -0.23 -0.21 0.06 0.13 0.20<br />
*Adjustments made for:<br />
Guidance: 2012: Sales EUR 165-175m; EBIT EUR 3-5m<br />
Financial Ratios<br />
2008 2009 2010 2011 2012e 2013e 2014e<br />
Total Operating Costs / Sales 91.8 % 92.0 % 95.8 % 96.3 % 93.6 % 92.3 % 91.3 %<br />
Operating Leverage 46.3 x 2.0 x n.a. -10.7 x n.a. 35.0 x 14.1 x<br />
EBITDA / Interest expenses 6.8 x 6.4 x 4.1 x 3.0 x 4.9 x 5.7 x 6.4 x<br />
Tax rate (EBT) 34.1 % 33.0 % -15.3 % -17.0 % 34.0 % 34.0 % 34.0 %<br />
Dividend Payout Ratio 0.0 % 26.7 % 0.0 % 0.0 % 0.0 % 38.0 % 39.8 %<br />
Sales per Employee 83,674 83,180 66,002 68,910 67,800 68,800 70,520<br />
Sales, EBITDA<br />
in EUR m<br />
Source: Warburg Research<br />
Operating Performance<br />
in %<br />
Source: Warburg Research<br />
C O M M E N T Published 31.07.2012 6<br />
Performance per Share<br />
Source: Warburg Research
<strong>Muehlhan</strong> <strong>AG</strong><br />
Consolidated balance sheet<br />
In EUR m 2008 2009 2010 2011 2012e 2013e 2014e<br />
Assets<br />
Goodwill and other intangible assets 25 26 23 21 21 21 21<br />
thereof other intangible assets 1 1 1 1 0 0 0<br />
thereof Goodwill 25 25 22 21 21 21 21<br />
Property, plant and equipment 30 28 23 23 23 22 22<br />
Financial assets 10 0 0 0 0 0 0<br />
Other long-term assets 0 0 0 0 0 0 0<br />
Fixed assets 65 54 46 45 44 43 42<br />
Inventories 4 4 4 4 3 3 4<br />
Accounts receivable 40 36 37 43 35 35 36<br />
Liquid assets 8 12 12 11 13 18 20<br />
Other short-term assets 14 10 9 10 10 10 10<br />
Current assets 66 61 62 67 61 66 69<br />
Total Assets 131 116 108 112 105 109 111<br />
Liabilities and shareholders' equity<br />
Subscribed capital 20 20 20 20 20 20 20<br />
Capital reserve 28 28 28 28 28 28 28<br />
Retained earnings 4 4 10 9 0 1 3<br />
Other equity components 10 14 4 0 1 3 4<br />
Shareholder's equity 61 65 61 57 49 52 54<br />
Minority interest 2 2 0 0 3 3 3<br />
Total equity 63 66 61 57 52 54 57<br />
Provisions 2 1 2 2 2 2 2<br />
thereof provisions for pensions and similar obligations 1 1 1 1 1 1 1<br />
Financial liabilites (total) 36 21 22 23 23 23 23<br />
thereof short-term financial liabilities 1 1 1 1 1 1 1<br />
Accounts payable 17 13 12 17 15 16 16<br />
Other liabilities 14 14 12 14 14 14 14<br />
Liabilities 68 49 47 55 53 54 54<br />
Total liabilities and shareholders' equity 131 116 108 112 105 109 111<br />
Financial Ratios<br />
2008 2009 2010 2011 2012e 2013e 2014e<br />
Efficiency of Capital Employment<br />
Operating Assets Turnover 3.6 x 3.5 x 3.1 x 3.2 x 3.7 x 3.9 x 3.9 x<br />
Capital Employed Turnover 2.1 x 2.2 x 2.0 x 2.1 x 2.2 x 2.2 x 2.2 x<br />
ROA 6.6 % 7.1 % -9.5 % -8.7 % 2.8 % 5.8 % 9.0 %<br />
Return on Capital<br />
ROCE 6.6 % 6.0 % -3.3 % -1.8 % 3.3 % 5.1 % 6.7 %<br />
ROE 7.3 % 6.1 % -7.0 % -6.7 % 2.3 % 5.0 % 7.2 %<br />
Adj. ROE 7.3 % 6.1 % -7.0 % -6.7 % 2.3 % 5.0 % 7.2 %<br />
Balance sheet quality<br />
Net Debt 29 9 11 13 11 6 4<br />
Net Financial Debt 28 8 10 12 10 6 3<br />
Net Gearing 45.7 % 13.7 % 17.5 % 23.2 % 20.6 % 11.8 % 6.9 %<br />
Net Financial Debt / EBITDA 165.8 % 54.7 % 143.0 % 193.3 % 90.1 % 42.4 % 19.8 %<br />
Book Value / Share 3.1 3.3 3.2 3.0 2.6 2.7 2.9<br />
Book value per share ex intangibles 1.8 2.0 2.0 1.9 1.5 1.6 1.8<br />
ROCE Development<br />
Source: Warburg Research<br />
Net debt<br />
in EUR m<br />
Source: Warburg Research<br />
C O M M E N T Published 31.07.2012 7<br />
Book Value per Share<br />
in EUR<br />
Source: Warburg Research
<strong>Muehlhan</strong> <strong>AG</strong><br />
Consolidated cash flow statement<br />
In EUR m 2008 2009 2010 2011 2012e 2013e 2014e<br />
Net income 5 4 -4 -4 1 3 4<br />
Depreciation of fixed assets 7 7 6 8 7 7 7<br />
Amortisation of goodwill 0 0 0 0 0 0 0<br />
Amortisation of intangible assets 0 0 3 0 0 0 0<br />
Increase/decrease in long-term provisions 0 0 0 0 0 0 0<br />
Other non-cash income and expenses -1 2 0 0 -3 0 0<br />
Cash Flow 11 13 5 4 5 10 11<br />
Increase / decrease in inventory 0 0 0 -1 1 0 0<br />
Increase / decrease in accounts receivable 1 3 -2 -5 8 0 -1<br />
Increase / decrease in accounts payable 2 -3 -2 5 -2 1 0<br />
Increase / decrease in other working capital positions 0 0 -1 1 -3 0 0<br />
Increase / decrease in working capital 4 0 -4 0 4 1 -1<br />
Net cash provided by operating activities 15 13 1 4 9 11 10<br />
Investments in intangible assets 0 -1 0 0 0 0 0<br />
Investments in property, plant and equipment -9 -6 -5 -7 -6 -6 -7<br />
Payments for acquisitions -2 0 0 0 0 0 0<br />
Financial investments -10 0 0 0 0 0 0<br />
Income from asset disposals 12 10 5 1 0 0 0<br />
Net cash provided by investing activities -8 4 1 -6 -6 -6 -7<br />
Change in financial liabilities -1 0 1 1 0 0 0<br />
Dividends paid 0 0 -1 0 0 0 -1<br />
Purchase of own shares 0 -1 -1 0 0 0 0<br />
Capital measures 0 -15 0 0 0 0 0<br />
Others -5 4 -1 0 0 0 0<br />
Net cash provided by financing activities -6 -12 -2 1 0 0 -1<br />
Change in liquid funds 1 5 -1 -1 2 4 2<br />
Effects of exchange-rate changes on cash 0 0 1 0 0 0 0<br />
Cash and cash equivalent at end of period 8 12 12 11 13 18 20<br />
Financial Ratios<br />
2008 2009 2010 2011 2012e 2013e 2014e<br />
Cash Flow<br />
Free Cash Flow 6 7 -4 -3 3 4 4<br />
Free Cash Flow / Sales 3.0 % 3.5 % -2.5 % -1.8 % 1.5 % 2.4 % 2.0 %<br />
Free Cash Flow Potential 9 8 2 1 5 7 8<br />
Free Cash Flow / Sales 3.0 % 3.5 % -2.5 % -1.8 % 1.5 % 2.4 % 2.0 %<br />
Free Cash Flow / Net Profit 142.5 % 171.4 % 93.9 % 81.1 % 213.6 % 168.4 % 92.0 %<br />
Interest Received / Avg. Cash 3.1 % 5.1 % 2.5 % 0.6 % 1.2 % 0.9 % 0.8 %<br />
Interest Paid / Avg. Debt 6.9 % 8.4 % 8.0 % 9.3 % 9.5 % 9.9 % 10.5 %<br />
Management of Funds<br />
Investment ratio 4.2 % 3.3 % 3.0 % 4.0 % 3.8 % 3.8 % 3.8 %<br />
Maint. Capex / Sales 2.8 % 2.8 % 2.8 % 2.8 % 2.8 % 2.8 % 2.8 %<br />
Capex / Dep 123.3 % 91.6 % 52.3 % 89.3 % 91.7 % 89.5 % 91.6 %<br />
Avg. Working Capital / Sales 12.4 % 13.9 % 16.8 % 17.3 % 15.8 % 13.3 % 12.9 %<br />
Trade Debtors / Trade Creditors 232.3 % 270.4 % 321.8 % 256.2 % 232.2 % 217.9 % 223.4 %<br />
Inventory Turnover 20.9 x 24.0 x 19.5 x 17.2 x 20.1 x 20.0 x 20.0 x<br />
Receivables collection period (days) 70 68 83 90 75 74 74<br />
Payables payment period (days) 67 53 59 84 79 85 83<br />
Cash conversion cycle (Days) -46 -35 -36 -58 -57 -63 -61<br />
CAPEX and Cash Flow<br />
in EUR m<br />
Source: Warburg Research<br />
Free Cash Flow Generation<br />
Source: Warburg Research<br />
C O M M E N T Published 31.07.2012 8<br />
Working Capital<br />
Source: Warburg Research
<strong>Muehlhan</strong> <strong>AG</strong><br />
LEGAL DISCLAIMER<br />
This research report was prepared by the Warburg Research GmbH, a subsidiary of the M.M.Warburg & CO KGaA and is passed on<br />
by the M.M.Warburg & CO KGaA. It contains selected information and does not purport to be complete. The report is based on<br />
publicly available information and data ("the information") believed to be accurate and complete. Warburg Research GmbH neither<br />
does examine the information to be accurate and complete, nor guarantees its accuracy and completeness. Possible errors or<br />
incompleteness of the information do not constitute grounds for liability of M.M.Warburg & CO KGaA or Warburg Research GmbH for<br />
damages of any kind whatsoever, and M.M.Warburg & CO KGaA and Warburg Research GmbH are not liable for indirect and/or direct<br />
and/or consequential damages. In particular, neither M.M.Warburg & CO KGaA nor Warburg Research GmbH are liable for the<br />
statements, plans or other details contained in these analyses concerning the examined companies, their affiliated companies,<br />
strategies, economic situations, market and competitive situations, regulatory environment, etc. Although due care has been taken in<br />
compiling this research report, it cannot be excluded that it is incomplete or contains errors. M.M.Warburg & CO KGaA and Warburg<br />
Research GmbH, their shareholders and employees are not liable for the accuracy and completeness of the statements, estimations<br />
and the conclusions derived from the information contained in this document. Provided a research report is being transmitted in<br />
connection with an existing contractual relationship, i.e. financial advisory or similar services, the liability of M.M.Warburg & CO KGaA<br />
and Warburg Research GmbH shall be restricted to gross negligence and wilful misconduct. In case of failure in essential tasks,<br />
M.M.Warburg & CO KGaA and Warburg Research GmbH are liable for normal negligence. In any case, the liability of M.M.Warburg &<br />
CO KGaA and Warburg Research GmbH is limited to typical, expectable damages. This research report does not constitute an offer or<br />
a solicitation of an offer for the purchase or sale of any security. Partners, directors or employees of M.M.Warburg & CO KGaA,<br />
Warburg Research GmbH or affiliated companies may serve in a position of responsibility, i.e. on the board of directors of companies<br />
mentioned in the report. Opinions expressed in this report are subject to change without notice. All rights reserved.<br />
COPYRIGHT NOTICE<br />
This work including all its parts is protected by copyright. Any use beyond the limits provided by copyright law without permission is<br />
prohibited and punishable. This applies, in particular, to reproductions, translations, microfilming, and storage and processing on<br />
electronic media of the entire content or parts thereof.<br />
DISCLOSURE ACCORDING TO § 34B OF THE GERMAN SECURITIES TRADING ACT AND FINANV<br />
The valuation underlying the rating of the company analysed in this report is based on generally accepted and widely used methods of<br />
fundamental valuation, such as the DCF model, Free Cash Flow Value Potential, peer group comparison and – where applicable – a<br />
sum-of-the-parts model.<br />
M.M.Warburg & CO KGaA and Warburg Research GmbH have set up internal organisational and administrative arrangements to<br />
prevent and avoid possible conflicts of interest and, where applicable, to disclose them.<br />
Valuations, ratings and price targets for the companies analysed by Warburg Research GmbH are subject to constant reviews and<br />
may therefore change, if any of the fundamental factors underlying these items do change.<br />
All share prices given in this equity analysis are closing prices on the date given in the analysis, except where stated otherwise.<br />
Neither Warburg Research GmbH’s analysts nor M.M.Warburg & CO KGaA’s analysts do receive any payments directly or indirectly<br />
from any investment banking activity of M.M.Warburg Bank or an affiliated company.<br />
M.M.Warburg & CO KGaA and Warburg Research GmbH are under supervision of the BaFin – German Federal Financial Supervisory<br />
Authority.<br />
SOURCES<br />
All data and consensus estimates have been obtained from FactSet except where stated otherwise.<br />
C O M M E N T Published 31.07.2012 9
<strong>Muehlhan</strong> <strong>AG</strong><br />
Section 34b of the German Securities Trading Act in combination with the FinAnV requires an enterprise preparing a<br />
securities analysis to point out possible conflicts of interest with respect to the company that is the subject of the analysis.<br />
A conflict of interest is assumed, in particular, when the enterprise preparing the analysis …<br />
-1- … or companies affiliated with this enterprise holds 5% or more of the share capital of the analysed company<br />
-2-<br />
-3-<br />
-4-<br />
… or companies affiliated with this enterprise was a member in a consortium which acquired the shares of the<br />
analysed company within the last twelve months<br />
… or companies affiliated with this enterprise manages the securities of the analysed company on the basis of<br />
an existing contract<br />
… or companies affiliated with this enterprise over the previous 12 months has been providing investment<br />
banking services for the analysed company for which a compensation has been or will be paid<br />
-5- … effected an agreement with the analysed company for the preparation of the financial analysis<br />
-6- … or companies affiliated with this enterprise regularly trade in shares or derivatives of the analysed company<br />
-7-<br />
… or the analyst responsible for this company has other important financial interests in relation to the analysed<br />
company such as e.g. the performance of mandates for the analysed company<br />
Company Disclosure Link to the historical price targets and rating changes (last 12 months)<br />
<strong>Muehlhan</strong> <strong>AG</strong> 5, 6 http://www.mmwarburg.com/disclaimer/disclaimer_en/DE000A0KD0F7.htm<br />
C O M M E N T Published 31.07.2012 10
<strong>Muehlhan</strong> <strong>AG</strong><br />
INVESTMENT RECOMMENDATION<br />
Investment recommendation: expected direction of the share price development of the financial instrument up to the given price target<br />
in the opinion of the analyst who covers this financial instrument.<br />
-B- <strong>Buy</strong>: The price of the analysed financial instrument is expected to rise over the next 12 months.<br />
-H- Hold:<br />
The price of the analysed financial instrument is expected to remain mostly flat over the<br />
next 12 months.<br />
-S- Sell: The price of the analysed financial instrument is expected to fall over the next 12 months.<br />
“-“ Rating suspended: The available information currently does not permit an evaluation of the company.<br />
WARBURG RESEARCH GMBH – RESEARCH UNIVERSE BY RATING<br />
Rating Number of stocks % of Universe<br />
<strong>Buy</strong> 116 62<br />
Hold 59 31<br />
Sell 9 5<br />
Rating suspended 4 2<br />
Total 188 100<br />
WARBURG RESEARCH GMBH – ANALYSED RESEARCH UNIVERSE BY RATING …<br />
… Looking only at companies for which a disclosure according to § 34b of the Germany Securities Trading Act and the<br />
FinAnV has to be made.<br />
Rating Number of stocks % of Universe<br />
<strong>Buy</strong> 101 66<br />
Hold 43 28<br />
Sell 7 5<br />
Rating suspended 3 2<br />
Total 154 100<br />
PRICE AND RATING HISTORY MUEHLHAN <strong>AG</strong> AS OF 31.07.2012<br />
C O M M E N T Published 31.07.2012 11<br />
The chart has markings if Warburg Research GmbH<br />
changed its rating in the last 12 months. Every marking<br />
represents the date and closing price on the day of the<br />
rating change.
<strong>Muehlhan</strong> <strong>AG</strong><br />
RESEARCH<br />
Christian Bruns +49 40 309537-253 Henner Rüschmeier +49 40 309537-270<br />
Head of Research cbruns@warburg-research.com Head of Research hrueschmeier@warburg-research.com<br />
Christian Cohrs +49 40 309537-175 Roland Rapelius +49 40 309537-220<br />
Engineering, Logistics ccohrs@warburg-research.com Engineering, Logistics rrapelius@warburg-research.com<br />
Felix Ellmann +49 40 309537-120 Jochen Reichert +49 40 309537-130<br />
Software, IT fellmann@warburg-research.com Telco, Internet, Media jreichert@warburg-research.com<br />
Jörg Philipp Frey +49 40 309537-258 Christopher Rodler +49 40 309537-290<br />
Retail, Consumer Goods jfrey@warburg-research.com Utilities crodler@warburg-research.com<br />
Ulrich Huwald +49 40 309537-255 Malte Schaumann +49 40 309537-170<br />
Health Care, Pharma uhuwald@warburg-research.com Technology mschaumann@warburg-research.com<br />
Thilo Kleibauer +49 40 309537-257 Susanne Schwartze +49 40 309537-155<br />
Retail, Consumer Goods tkleibauer@warburg-research.com Telco, Internet, Media sschwartze@warburg-research.com<br />
Torsten Klingner +49 40 309537-260 Oliver Schwarz +49 40 309537-250<br />
Real Estate tklingner@warburg-research.com Chemicals oschwarz@warburg-research.com<br />
Eggert Kuls +49 40 309537-256 Marc-René Tonn +49 40 309537-259<br />
Engineering ekuls@warburg-research.com Automobiles, Car Suppliers mtonn@warburg-research.com<br />
Frank Laser +49 40 309537-235 Björn Voss +49 40 309537-254<br />
Construction, Industrials flaser@warburg-research.com Car Suppliers, Steel bvoss@warburg-research.com<br />
Andreas Pläsier +49 40 309537-246 Andreas Wolf +49 40 309537-140<br />
Banks, Financial Services aplaesier@warburg-research.com Software, IT awolf@warburg-research.com<br />
Malte Räther +49 40 309537-185 Stephan Wulf +49 40 309537-150<br />
Technology mraether@warburg-research.com Utilities swulf@warburg-research.com<br />
SALES SALES TRADING<br />
Holger Nass +49 40 3282-2669 Oliver Merckel +49 40 3282-2634<br />
Head of Equity Sales hnass@mmwarburg.com Head of Sales Trading omerckel@mmwarburg.com<br />
Klaus Schilling +49 40 3282-2664 Gudrun Bolsen +49 40 3282-2679<br />
Deputy Head of Equity Sales kschilling@mmwarburg.com Sales Trading gbolsen@mmwarburg.com<br />
Christian Alisch +49 40 3282-2667 Bastian Quast +49 40 3282-2701<br />
Scandinavia calisch@mmwarburg.com Sales Trading bquast@mmwarburg.com<br />
Robert Conredel +49 40 3282-2633 Patrick Schepelmann +49 40 3282-2700<br />
Germany rconredel@mmwarburg.com Sales Trading pschepelmann@mmwarburg.com<br />
Matthias Fritsch +49 40 3282-2696 Thekla Struve +49 40 3282-2668<br />
United Kingdom mfritsch@mmwarburg.com Sales Trading tstruve@mmwarburg.com<br />
Michael Kriszun +49 40 3282-2695 Jörg Treptow +49 40 3262-2658<br />
United Kingdom mkriszun@mmwarburg.com Sales Trading jtreptow@mmwarburg.com<br />
Marc Niemann +49 40 3282-2660<br />
Germany mniemann@mmwarburg.com Support<br />
Dirk Rosenfelder +49 40 3282-2692 Katharina Bruns +49 40 3282-2694<br />
Austria, Switzerland drosenfelder@mmwarburg.com Roadshow/Marketing kbruns@mmwarburg.com<br />
Julian Straube +49 40 3282-2666<br />
Germany jstraube@mmwarburg.com<br />
Philipp Stumpfegger +49 40 3282-2635<br />
Australia pstumpfegger@mmwarburg.com<br />
Our research can be found under:<br />
MACRO RESEARCH<br />
C O M M E N T Published 31.07.2012 12<br />
Carsten Klude +49 40 3282-2572<br />
Macro Research cklude@mmwarburg.com<br />
Matthias Thiel +49 40 3282-2401<br />
Macro Research mthiel@mmwarburg.com<br />
Dr. Christian Jasperneite +49 40 3282-2439<br />
Investment Strategy cjasperneite@mmwarburg.com<br />
Warburg Research research.mmwarburg.com/en/index.html Thomson www.thomson.com<br />
Bloomberg MMWA GO Reuters www.knowledge.reuters.com<br />
FactSet www.factset.com Capital IQ www.capitaliq.com<br />
For access please contact:<br />
Andrea Carstensen +49 40 3282-2632 Kerstin Muthig +49 40 3282-2703<br />
Sales Assistance acarstensen@mmwarburg.com Sales Assistance kmuthig@mmwarburg.com