Marloth Park Management Plan. - Nkomazi Local Municipality
Marloth Park Management Plan. - Nkomazi Local Municipality Marloth Park Management Plan. - Nkomazi Local Municipality
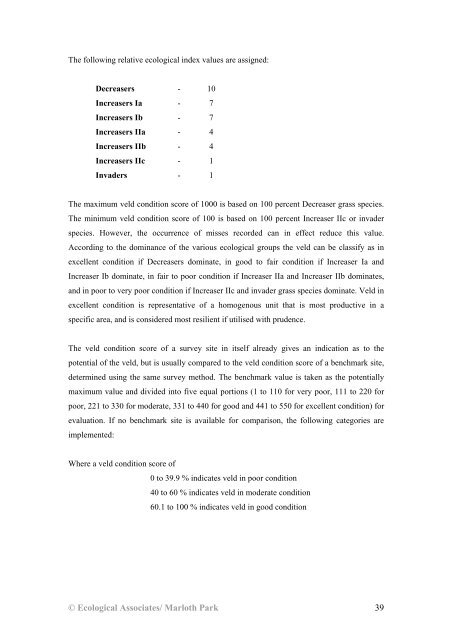
The following relative ecological index values are assigned: Decreasers - 10 Increasers Ia - 7 Increasers Ib - 7 Increasers IIa - 4 Increasers IIb - 4 Increasers IIc - 1 Invaders - 1 The maximum veld condition score of 1000 is based on 100 percent Decreaser grass species. The minimum veld condition score of 100 is based on 100 percent Increaser IIc or invader species. However, the occurrence of misses recorded can in effect reduce this value. According to the dominance of the various ecological groups the veld can be classify as in excellent condition if Decreasers dominate, in good to fair condition if Increaser Ia and Increaser Ib dominate, in fair to poor condition if Increaser IIa and Increaser IIb dominates, and in poor to very poor condition if Increaser IIc and invader grass species dominate. Veld in excellent condition is representative of a homogenous unit that is most productive in a specific area, and is considered most resilient if utilised with prudence. The veld condition score of a survey site in itself already gives an indication as to the potential of the veld, but is usually compared to the veld condition score of a benchmark site, determined using the same survey method. The benchmark value is taken as the potentially maximum value and divided into five equal portions (1 to 110 for very poor, 111 to 220 for poor, 221 to 330 for moderate, 331 to 440 for good and 441 to 550 for excellent condition) for evaluation. If no benchmark site is available for comparison, the following categories are implemented: Where a veld condition score of 0 to 39.9 % indicates veld in poor condition 40 to 60 % indicates veld in moderate condition 60.1 to 100 % indicates veld in good condition © Ecological Associates/ Marloth Park 39
Calculation of grazing capacity The combined veld condition and rainfall method, based on the following equation, is applied to calculate the grazing capacity in this study area. GC = -0.03 + (0.00289 * X1) + (X2 – 419.7) * 0.000633 Where: GC = grazing capacity in Large Stock Units (LSU) per hectare X1 = percentage veld condition score X2 = mean annual rainfall in mm per year. It is recommended that long-term rainfall data be used, as this will result in a grazing capacity value that is suitable for sustainable stocking rates. The use of short-term rainfall data, covering only 2 to 3 years, can result in unsustainable values due to the inability of a rancher to implement the required fluctuations in applying suitable stocking rates. As the veld condition and rainfall method was originally designed to calculate grazing capacities for cattle production, the values obtained from the equation should be tailored to fit the purposes of a wildlife ranch. Adjustment of the calculated grazing capacity value is necessary, due to the inability of the rancher to implement an effective rotational resting system, and to compensate for the selective feeding behaviour of wildlife. It is recommended that the calculated grazing capacity be reduced by 30 percent to facilitate these factors and ensure sustainable use of the natural resources without deterioration of the habitat. RESULTS AND DISCUSSION Veld condition All grass species are identified (Appendix 2) in the step-point field surveys on Marloth Park and the frequency of each grass species in every plant community calculated. A veld condition score and potential grazing capacity are calculated according to the relative frequency occurrence (Table 1) of the grass species in the various monitoring survey sites on Marloth Park. Plant community 1: The Chloris virgata – Acacia grandicornuta Low thicket This plant community is approximately 22 ha in size, and dominated by broad-leaved panicum Panicum deustum from the Decreaser category. The sub-dominant grass species is common carrot-seed grass Tragus berteronianus from the Increaser IIc (3) category. The veld condition score of 652 (Table 2) indicate that the veld is in good condition. © Ecological Associates/ Marloth Park 40
- Page 1 and 2: Ecological Associates Environmental
- Page 3 and 4: THE ASSESSMENT OF AVAILABLE BROWSE
- Page 5 and 6: LIST OF FIGURES Figure 1: Location
- Page 7 and 8: LIST OF APPENDICES Appendix 1: A li
- Page 9 and 10: Three different scenarios are analy
- Page 11 and 12: Ecosystems disturbed by clearing op
- Page 13 and 14: INTRODUCTION Although only a few ve
- Page 15 and 16: Figure 1: Location of the Marloth P
- Page 17 and 18: GEOMORPHOLOGY Looking down from the
- Page 19 and 20: Figure 4: Geology of the Marloth Pa
- Page 21 and 22: Tonalitic granite and gneiss A sect
- Page 23 and 24: Figure 6: Soil depth of the Marloth
- Page 25 and 26: Figure 7: Land Types of the Marloth
- Page 27 and 28: Figure 8: Land use in the Marloth P
- Page 29 and 30: A 610.1 B 104.0 C 7.4 D 19.9 E 39.8
- Page 31 and 32: INTRODUCTION VEGETATION CLASSIFICAT
- Page 33 and 34: METHOD For an initial and broad sca
- Page 35 and 36: RESULTS AND DISCUSSION Analysis and
- Page 37 and 38: The dominant grass species are broa
- Page 39 and 40: The characteristic tree species are
- Page 41 and 42: VELD CONDITION ASSESSMENT AND THE C
- Page 43 and 44: Degradation gradients are models th
- Page 45: The nearest grass species to each s
- Page 49 and 50: Table 2: Contribution of ecological
- Page 51 and 52: Table 3: Grazing capacities for the
- Page 53 and 54: THE ASSESSMENT OF AVAILABLE BROWSE
- Page 55 and 56: X Y D1 Y Dimensional measurements:
- Page 57 and 58: RESULTS AND DISCUSSION The browsing
- Page 59 and 60: Table 6: Browsing capacities for th
- Page 61 and 62: INTRODUCTION ESTIMATION OF HERBACEO
- Page 63 and 64: The resulting Large Stock Units are
- Page 65 and 66: INTRODUCTION GAME MANAGEMENT ON MAR
- Page 67 and 68: STOCKING RATES Current stocking The
- Page 69 and 70: Table 10: The current stocking dens
- Page 71 and 72: Recommendations on stocking rates C
- Page 73 and 74: High selectivity grazers Blue wilde
- Page 75 and 76: Waterbuck Kobus ellipsiprymnus Ogil
- Page 77 and 78: Space requirements: Kudu have range
- Page 79 and 80: Recommendation: The range requireme
- Page 81 and 82: Food preference: Steenbok utilise A
- Page 83 and 84: Table 12: The potential stocking de
- Page 85 and 86: Table 14: The potential stocking de
- Page 87 and 88: Table 15: The recommended stocking
- Page 89 and 90: The proteins may be less available
- Page 91 and 92: When urea is incorporated into a ph
- Page 93 and 94: Recommended intake for game is 150
- Page 95 and 96: Ticks The main parasite of concern
The following relative ecological index values are assigned:<br />
Decreasers - 10<br />
Increasers Ia - 7<br />
Increasers Ib - 7<br />
Increasers IIa - 4<br />
Increasers IIb - 4<br />
Increasers IIc - 1<br />
Invaders - 1<br />
The maximum veld condition score of 1000 is based on 100 percent Decreaser grass species.<br />
The minimum veld condition score of 100 is based on 100 percent Increaser IIc or invader<br />
species. However, the occurrence of misses recorded can in effect reduce this value.<br />
According to the dominance of the various ecological groups the veld can be classify as in<br />
excellent condition if Decreasers dominate, in good to fair condition if Increaser Ia and<br />
Increaser Ib dominate, in fair to poor condition if Increaser IIa and Increaser IIb dominates,<br />
and in poor to very poor condition if Increaser IIc and invader grass species dominate. Veld in<br />
excellent condition is representative of a homogenous unit that is most productive in a<br />
specific area, and is considered most resilient if utilised with prudence.<br />
The veld condition score of a survey site in itself already gives an indication as to the<br />
potential of the veld, but is usually compared to the veld condition score of a benchmark site,<br />
determined using the same survey method. The benchmark value is taken as the potentially<br />
maximum value and divided into five equal portions (1 to 110 for very poor, 111 to 220 for<br />
poor, 221 to 330 for moderate, 331 to 440 for good and 441 to 550 for excellent condition) for<br />
evaluation. If no benchmark site is available for comparison, the following categories are<br />
implemented:<br />
Where a veld condition score of<br />
0 to 39.9 % indicates veld in poor condition<br />
40 to 60 % indicates veld in moderate condition<br />
60.1 to 100 % indicates veld in good condition<br />
© Ecological Associates/ <strong>Marloth</strong> <strong>Park</strong> 39


