Minitab
Minitab
Minitab

You also want an ePaper? Increase the reach of your titles
YUMPU automatically turns print PDFs into web optimized ePapers that Google loves.
<strong>Minitab</strong><br />
The Leading Provider of Quality<br />
Improvement Software
2<br />
Quality Solutions for<br />
Quality Professionals<br />
Today’s quality improvement projects are more<br />
complex than ever. Leading methodologies<br />
such as Six Sigma require that they be<br />
rooted in an analysis of hard data and produce<br />
measurable results, and as their size and scope<br />
have grown, so too has the amount of work required to manage all the<br />
people and communications involved.<br />
With all these responsibilities – and your<br />
company insisting that your project<br />
provide a quick return on investment –<br />
the last thing you need is to waste your<br />
time and money trying to produce<br />
a project using software that wasn’t<br />
specifically developed to help you. Or by<br />
trying to support a range of tools that<br />
come from different vendors and have<br />
different standards.<br />
Wouldn’t it be better if there was one<br />
company you could trust to understand<br />
your goal of improving quality and<br />
that offered you the ideal collection of<br />
software, support materials, and services<br />
to help you achieve it?<br />
There is: <strong>Minitab</strong>.
We Are on Your Team<br />
With <strong>Minitab</strong>, you have one company<br />
you can count on to help you face the<br />
many challenges of your quality initiative.<br />
Whether you have to define the scope of<br />
your project or understand and apply<br />
the statistics that drive it, we offer you<br />
accurate, reliable, easy-to-use software<br />
specifically designed to meet your needs.<br />
And if it is training or support you need,<br />
you can depend on us to provide the<br />
highest quality available in the friendliest<br />
and most convenient manner possible.<br />
“<strong>Minitab</strong> listens to their<br />
customers, building our<br />
suggestions into each new<br />
release. I highly recommend<br />
MINITAB Statistical Software<br />
as the primary tool<br />
for data analysis geared<br />
toward quality improvement.”<br />
Tim Voegtle<br />
Quality Engineer<br />
AMP Incorporated<br />
We can say this with confidence because<br />
for more than 30 years we have been<br />
satisfying the data analysis needs of<br />
education and quality professionals<br />
with our flagship product – MINITAB ®<br />
Statistical Software. And our customers<br />
have responded by making MINITAB<br />
the package of choice in hundreds of<br />
thousands of quality improvement<br />
projects in more than 80 countries.<br />
Thousands of distinguished companies<br />
such as 3M, LG, General Electric,<br />
Siemens AG, Ford Motor Company<br />
and the leading Six Sigma consultants<br />
use MINITAB every day to make<br />
data-driven decisions and achieve<br />
world-class quality.<br />
Our customers are loyal because we<br />
listen to their problems and respond to<br />
their needs. And we have a reputation<br />
for excellence because – like our<br />
customers – we are committed to it.<br />
Companies that<br />
successfully improve<br />
quality rely on <strong>Minitab</strong><br />
3M<br />
Air France Industries<br />
Alcoa<br />
American Express<br />
Avery Dennison<br />
Bank of America<br />
Becton Dickinson<br />
Black & Decker<br />
Boeing<br />
Bombardier<br />
British Telecom<br />
Brook Hansen<br />
DuPont<br />
Eastman Kodak<br />
Elan Pharmaceutical Technologies<br />
ExxonMobil<br />
Ford Motor Company<br />
General Electric<br />
General Motors<br />
Goodyear<br />
Hewlett-Packard<br />
Honeywell International<br />
International Paper<br />
ITT Industries<br />
J. P. Morgan Chase & Co.<br />
Leading Six Sigma consultants<br />
LG<br />
Monsanto<br />
Multibase<br />
Multibras Eletrodomesticos SA<br />
Nokia<br />
Paturle Aciers<br />
Polaroid<br />
PricewaterhouseCoopers<br />
Reckitt & Colman<br />
Rhodia<br />
Samsung Aerospace<br />
Seagate<br />
Siebe<br />
Siemens AG<br />
Toshiba<br />
Whirlpool<br />
www.minitab.com 3
Software<br />
4<br />
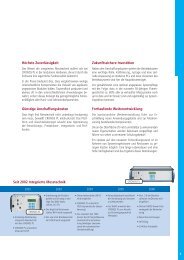
MINITAB ® Release 14<br />
Statistical Software<br />
for Windows ®<br />
The most effective quality improvement projects are the ones in which a thorough<br />
analysis of hard data drives the conception, execution, and evaluation of each step.<br />
Regardless of the process you are trying to improve – or even the industry in which<br />
you are working – you must be able to apply the right statistical methods and trust<br />
that your results are accurate.<br />
To succeed, you need a statistical software package that contains all the methods<br />
you might use, makes it easy to understand and access them, and helps you<br />
illustrate and interpret your results.<br />
You need MINITAB.
Welcome to the Next Generation<br />
of Statistical Software<br />
With even more power than our previous release and an easy-to-use design that<br />
helps you harness it, MINITAB 14 is statistical software made for the twenty-first century<br />
professional. Customizable profiles and graphs that will update automatically when<br />
you add new data are just a few of the valuable new features that make MINITAB 14<br />
one of the smartest quality improvement investments you can make.<br />
And the best news is that our latest release includes the same value<br />
and benefits our customers have received with every version of<br />
MINITAB since our first release more than 30 years ago:<br />
• The ideal collection of methods –with<br />
expanded functionality<br />
• Unsurpassed ease of use, even<br />
for professionals unfamiliar<br />
with statistics<br />
• FREE technical support<br />
from our highly skilled<br />
specialists<br />
• Access to exceptional<br />
training by statisticians<br />
with industry experience<br />
• Outstanding customer<br />
service from a<br />
knowledgeable sales team<br />
that puts your satisfaction first<br />
Download a FREE, 30-day<br />
demo of MINITAB 14 at<br />
www.minitab.com/minitab14<br />
MINITAB in Other Languages<br />
<strong>Minitab</strong> serves customers<br />
around the world. We maintain a<br />
network of global resellers and<br />
sales representatives in more<br />
than 50 countries, and offer<br />
versions of MINITAB in a number<br />
of languages:<br />
MINITAB in French<br />
A full French translation of MINITAB 13<br />
software and support materials.<br />
For more information in French, visit:<br />
www.minitab.fr<br />
MINITAB Japanese/English<br />
A complete version of MINITAB 13<br />
with the addition of translated Help,<br />
Tutorials, StatGuide, and the<br />
MINITAB Quick Reference Guide.<br />
For more information, visit:<br />
www.minitab.com or<br />
www.minitab.jp<br />
MINITAB Korean/English<br />
A complete version of MINITAB 13<br />
with the addition of translated Help,<br />
Tutorials, StatGuide, and the<br />
MINITAB Quick Reference Guide.<br />
For more information, visit:<br />
www.minitab.com or<br />
www.minitab.co.kr<br />
www.minitab.com 5
“MINITAB is intuitive to<br />
use, which makes it easy<br />
to train all employees in an<br />
organization on the application<br />
of statistics without the heavy<br />
fi nancial burden that so many<br />
other packages make on the<br />
individual or corporate user.”<br />
Scott Wentz<br />
Program Manager<br />
6<br />
Features That Make Your Work Easy<br />
Project Files<br />
Save all the parts of your MINITAB<br />
analysis in one file so you can open<br />
the project later and resume your work<br />
exactly as it was when you saved it, or<br />
even retrace your steps if needed.<br />
ReportPad <br />
Create a professional report within<br />
MINITAB with this useful tool that lets<br />
you choose the results you want to<br />
highlight and easily assemble them into<br />
a coherent, formatted report.<br />
▼<br />
StatGuide <br />
Interpret your analyses with this<br />
powerful reference tool that offers<br />
clear examples of relevant concepts,<br />
detailed descriptions of the important<br />
components of your output, and links to<br />
definitions and in-depth information.<br />
Smart Dialog Boxes <br />
MINITAB’s dialog boxes remember your<br />
previous settings so you do not have to<br />
repeatedly enter your choices.<br />
PLUS quick and easy import<br />
capabilities and the ability to save<br />
all the parts of your MINITAB project<br />
– the ReportPad, graphs, session<br />
output, even your worksheet – in<br />
web-friendly file formats.
Software<br />
MINITAB Release 14 Statistical Software<br />
Customizable Menus, Toolbars, Preferences, and Profiles<br />
▼<br />
Customize your menus and<br />
toolbars to conveniently<br />
access the methods you use<br />
most often.<br />
Set preferences for the default behaviors<br />
you prefer, and save this in a profile for<br />
your own or your team’s use.<br />
www.minitab.com 7
“MINITAB 14’s new graphics<br />
are outstanding. They are<br />
more versatile and much<br />
easier to use, and they<br />
produce even more handsome<br />
pictures than before.”<br />
Pat Marriott<br />
Six Sigma Process Consultant<br />
8<br />
Seeing is Believing<br />
MINITAB 14 Graphics Clarify Every Step<br />
of Your Improvement Project<br />
When it comes to realizing a successful quality initiative, the ability to visualize your<br />
statistical findings is just as important as having access to the right methods. MINITAB<br />
14’s new state-of-the-art graphics help you investigate and understand your data,<br />
and reveal underlying patterns that can guide you in transforming your processes.<br />
By clearly and vividly illustrating the results of your analysis, our graphs allow you<br />
to make informed decisions, evaluate their effectiveness, and share your findings<br />
with colleagues.
Software<br />
MINITAB Release 14 Statistical Software<br />
MINITAB 14’s New Graphic Capabilities Include:<br />
▲ An easy way to place several<br />
graphs together in one window.<br />
A dynamic link between a<br />
graph and its worksheet that<br />
lets you automatically update<br />
the graph when data are<br />
added or changed.<br />
▼ An effortless method to create<br />
graphs – select the one you want<br />
from a pictorial gallery and use data<br />
entry dialog boxes that are simplified<br />
for that graph.<br />
Interactive graph brushing that lets you select and subset groups of points<br />
on a graph and identify common characteristics of those points.<br />
Plus:<br />
A faster and easier way to edit graphs<br />
once you've made them–click on<br />
the aspect of the graph you want to<br />
change and a dialog box opens that<br />
lets you modify it.<br />
MINITAB gives you precise control over<br />
the look of your graphics by letting you modify<br />
virtually any graph attribute and then save your<br />
preferences as default settings for future graphs.<br />
You can alter your graphs’ colors, fonts, symbols,<br />
fills and more.<br />
www.minitab.com 9
“I have always been impressed<br />
with MINITAB’s ability to load<br />
such statistical power into<br />
an incredibly user-friendly<br />
package. Now, with graphs<br />
that will update automatically<br />
and an easy-to-use interface<br />
and layout tool available to help<br />
create them, I’m even more<br />
enamored with Release 14.<br />
Way to go <strong>Minitab</strong>!”<br />
Kunita R. Gear<br />
Continuous Improvement Manager/<br />
Master Black Belt<br />
10<br />
▼<br />
The Statistical Methods You Need<br />
to Improve Your Processes<br />
Basic Statistics<br />
MINITAB gives you a comprehensive<br />
collection of basic statistical methods<br />
you can apply to your quality projects,<br />
including Descriptive Statistics,<br />
Normality Tests, 1- and 2-sample t-tests<br />
and much more.<br />
▼<br />
Statistical Process Control (SPC)<br />
Analyze complex data and identify and<br />
solve process-related problems using<br />
MINITAB’s extensive set of SPC tools,<br />
including Pareto Charts; Variables,<br />
Attributes, and Multivariate Control Charts;<br />
and Historical/Shift-in-Process Charts.
Process Capability<br />
Once your processes are in control, MINITAB<br />
provides a complete set of process capability<br />
analysis tools –including our frequently used<br />
Process Capability Sixpack – to help you<br />
determine if they will consistently meet your<br />
specifications over time.<br />
▼<br />
MINITAB 14 offers two new capability analyses:<br />
• Capability analysis for multiple variables<br />
performs an individual capability analysis on<br />
many variables and comparatively displays<br />
graphical and numerical output.<br />
• Capability analysis for non-normal data<br />
determines the best-fitting distribution for your<br />
data and estimates the capability indices based<br />
on the results.<br />
Software<br />
MINITAB Release 14 Statistical Software<br />
▼<br />
Measurement Systems Analysis<br />
Because your data are only as good as<br />
the measurement system you use,<br />
MINITAB provides you with a<br />
complete collection of Gage R&R tools<br />
to help identify and quantify sources<br />
of variation, and assess your system’s<br />
precision and accuracy:<br />
• Gage Run Chart<br />
• Gage Linearity and Bias Study<br />
• Gage R&R Study<br />
• Attribute Gage Study<br />
• Attribute Agreement Analysis<br />
www.minitab.com 11
“MINITAB 14’s graphical<br />
enhancements will greatly<br />
improve blackbelts’ graphical<br />
presentations.”<br />
Robert L. Perry<br />
Six Sigma Coach<br />
12<br />
The Statistical Methods You Need to<br />
Improve Your Processes<br />
Design of Experiments (DOE)<br />
MINITAB gives you the tools you need<br />
to design and analyze all popular<br />
types of experiments so you can<br />
determine which changes will most<br />
improve a product or service’s quality<br />
and reliability.<br />
�<br />
Reliability<br />
Whether your goal is to predict the<br />
failure time of a product for warranty<br />
purposes, analyze data for repairable<br />
systems, or perform Accelerated Life<br />
Testing, MINITAB has the tools you<br />
need, including the ability to deal with<br />
right-, left-, and interval-censored<br />
data, parametric and nonparametric<br />
methods, and much more.<br />
MINITAB’s DOE tool set includes:<br />
• Factorial designs<br />
• Screening designs<br />
• Response surface designs<br />
• D-optimal and distance-based designs<br />
• Mixture designs<br />
• Taguchi designs<br />
• Response optimization<br />
• Analysis of Variability<br />
MINITAB 14 also<br />
includes:<br />
• Regression and ANOVA<br />
• Power and Sample Size<br />
• Time Series and Forecasting<br />
• Powerful Data Import, Export<br />
and Manipulation<br />
• An Extensive Macro Language
MINITAB Statistical Software<br />
Capabilities List/What’s New<br />
▼ = New or enhanced in Release 14<br />
Ease of Use<br />
▼ Customizable menus and toolbars<br />
• Project Manager: logically<br />
organizes analysis<br />
▼ StatGuideTM : explains output<br />
▼ ReportPadTM : report generator<br />
• Online tutorials<br />
• Smart Dialog Boxes TM : remember<br />
recent settings<br />
▼ Clear, comprehensive Help system<br />
▼ Extensive preferences and user<br />
editable profiles<br />
Data and File Management<br />
▼ Save output and data as HTML<br />
• Unlimited worksheet size<br />
• Import/export: Excel, text, etc.<br />
▼ Import Excel workbooks into<br />
separate worksheets within a<br />
MINITAB Project<br />
▼ Import currency format<br />
• ODBC querying<br />
• Autofill<br />
• Hide and unhide columns<br />
• Data manipulation: merge, subset,<br />
sort, transpose, change data type<br />
• Find and replace in Data window<br />
• 4000 columns per worksheet<br />
• Matrix functions<br />
• Double-precision worksheets<br />
Graphics<br />
▼ New state-of-the-art graphics<br />
engine<br />
▼ Simplified, pictorial graphics<br />
dialog boxes<br />
▼ Interactively edit attributes<br />
(axes, scale, etc.) and recreate<br />
custom graphs with new data<br />
▼ Intuitive tool to place multiple<br />
graphs on one page<br />
Display data from different<br />
variables or By groups in panels on<br />
the same page<br />
▼<br />
▼ Information display tools: tooltips,<br />
crosshairs, plant flags<br />
▼ Set your own preferences for graph<br />
attribute defaults<br />
▼ Graphs can update as data change<br />
▼ Built-in graphs: a variety of displays<br />
available with a single click<br />
• Scatterplots, boxplots, dotplots,<br />
histograms, charts, time series plots<br />
▼<br />
▼ Rotating 3D graphs<br />
Probability plots, contour plots<br />
▼ Interval plots, individual value plots,<br />
area graphs, ECDF plots<br />
• Matrix plots, pie charts<br />
• Numerous special-purpose graphs<br />
• OLE: edit MINITAB graphs in other<br />
applications<br />
• Graph brushing<br />
• Save as TIF, JPEG, PNG, BMP<br />
Macros and Command Language<br />
• Complete command language<br />
• Powerful macro capability for<br />
automating tasks or creating new<br />
capabilities<br />
Basic Statistics<br />
Descriptive statistics<br />
• Confidence intervals, one- and twosample<br />
t-tests, paired t-tests<br />
• Estimation and tests for one and<br />
two proportion problems<br />
• Correlation and covariance<br />
• Normality test<br />
• Test for equal variances<br />
Generate basic statistics from<br />
summary data<br />
▼<br />
▼<br />
Regression Analysis<br />
• Linear regression<br />
• Polynomial regression<br />
• Logistic regression<br />
▼ Partial least squares (PLS)<br />
• Stepwise and best subsets<br />
Residual plots<br />
▼<br />
Analysis of Variance<br />
• ANOVA<br />
• General linear model (GLM)<br />
• Unbalanced nested designs<br />
• MANOVA<br />
• Fully nested designs<br />
• Analysis of means<br />
• Multiple comparisons<br />
Residual, main effects, and<br />
interaction plots<br />
▼<br />
Statistical Process Control<br />
• Run chart<br />
• Pareto chart<br />
Fishbone diagram<br />
Control charts: XBar, R, S, XBar-R,<br />
XBar-S, I, MR, I-MR, I-MR-R/S,<br />
MA, EWMA, CUSUM, zone, short<br />
run, p, np, c, u<br />
▼<br />
▼<br />
▼ Multivariate control charts: T2,<br />
generalized variance, MEWMA<br />
• Custom tests for special causes<br />
▼ Individual distribution identification<br />
• Box-Cox transformation<br />
▼ Johnson transformation<br />
• Historical/shift-in-process charts<br />
▼ Process capability: normal,<br />
non-normal, attribute and batch<br />
▼ Process capability for multiple<br />
variables<br />
• Process Capability SixpackTM •<br />
• Symmetry plot<br />
Measurement Systems Analysis<br />
• Gage R&R: ANOVA and XBar-R<br />
methods<br />
• Nested Gage R&R<br />
▼ Attribute Gage Study – AIAG<br />
analytic method<br />
• Attribute agreement analysis<br />
• Gage linearity and bias<br />
• Gage run chart<br />
Design of Experiments<br />
• Two-level factorial designs<br />
• General full factorial designs<br />
• Plackett-Burman designs<br />
• Response surface designs<br />
• Mixture designs<br />
• D-optimal and distance-based<br />
designs<br />
• Taguchi designs<br />
• User-specified designs<br />
▼ Analysis of variability for<br />
factorial designs<br />
▼ Response prediction<br />
• Botched runs<br />
• Mixture plots<br />
• Overlaid contour plot<br />
Plots: residual, main effects,<br />
interaction, cube, contour, surface<br />
and wireframe<br />
• Response optimization<br />
▼<br />
Reliability/Survival Analysis<br />
• Parametric and nonparametric<br />
distribution analysis<br />
• Goodness-of-fit measures<br />
• ML and least squares estimates<br />
• Exact failure, right-, left-, and<br />
interval-censored data<br />
• Accelerated life testing<br />
• Regression with life data<br />
▼ Reliability test plans<br />
▼ Threshold parameter distributions<br />
Software<br />
MINITAB Release 14 Statistical Software<br />
▼ Analysis of repairable systems<br />
▼ Analysis of multiple failure modes<br />
• Probit analysis<br />
• Weibayes analysis<br />
• Hypothesis tests on distribution<br />
parameters<br />
• Plots: distribution, probability,<br />
hazard, and survival<br />
• Confidence intervals<br />
Power and Sample Size<br />
• One-sample Z, t, and proportion<br />
• Two-sample t and proportion<br />
• One-way ANOVA, two-level<br />
factorial and Plackett-Burman<br />
• Solve for number of center points<br />
• Provide any two of: power,<br />
difference, and sample size;<br />
MINITAB will solve for the third<br />
Multivariate Analysis<br />
• Principal component analysis<br />
• Discriminant analysis<br />
• Cluster analysis<br />
• Factor analysis<br />
• Correspondence analysis<br />
Time Series and Forecasting<br />
• Time series plots<br />
• Auto-, partial auto-, and cross<br />
correlations<br />
• ARIMA analysis<br />
• Trend analysis<br />
• Decomposition<br />
• Exponential smoothing<br />
• Winters’ method<br />
• Moving average<br />
Nonparametrics<br />
• Sign test<br />
• Wilcoxon test<br />
• Mann-Whitney test<br />
• Kruskal-Wallis test<br />
• Friedman test<br />
• Runs test<br />
• Mood's median test<br />
Tables<br />
▼ Improved cross-tabulation interface<br />
with new measures of association<br />
• Contingency tables<br />
• Chi-square test<br />
• Tally<br />
▼ Fisher’s exact test for 2x2 tables<br />
Simulation and Distributions<br />
Random number generator<br />
Density, distribution, and inverse<br />
cumulative distribution functions<br />
Random sampling<br />
▼<br />
▼<br />
▼<br />
www.minitab.com<br />
13
“With <strong>Minitab</strong> Quality<br />
Companion, the tool that I need<br />
to bridge the gap between<br />
data and documentation is no<br />
longer missing.”<br />
Wayne Tollefsen<br />
Six Sigma Blackbelt/QA Manager<br />
Electronic Control Unit Division<br />
OMRON Automotive Electronics<br />
▼<br />
14<br />
The Roadmap: Quality Companion’s<br />
core feature makes it easy to outline the<br />
steps in a project and communicate them<br />
to others, and offers direct links to the tools<br />
available to complete each one.<br />
<strong>Minitab</strong><br />
Quality<br />
Companion <br />
As a quality professional, your duties go<br />
far beyond analyzing data. You have to<br />
design, organize, and implement your<br />
project – not to mention manage all<br />
the ideas and meetings necessary for it<br />
to be effective. And if you have other job<br />
responsibilities or are working on more<br />
than one initiative, just coordinating<br />
the many details of a project can<br />
consume all your time and resources.<br />
That is why we created <strong>Minitab</strong> Quality<br />
Companion – a collection of soft tools<br />
designed to make the non-statistical<br />
tasks related<br />
to a quality<br />
improvement<br />
project easy.<br />
Quality<br />
Companion offers<br />
process mapping,<br />
cause and effect<br />
diagrams,<br />
brainstorm/affinity<br />
diagrams, FMEA,<br />
CTQ matrix, and<br />
much more.<br />
Quality professionals also<br />
appreciate Quality Companion<br />
because it:<br />
• Is completely customizable, from the<br />
forms and tools used to the Roadmap<br />
itself. Every component can be<br />
modified or created from scratch.<br />
• Provides templates when customization<br />
is not necessary, so new users can begin<br />
their projects quickly and effortlessly.<br />
• Can be installed on a network drive,<br />
allowing all team members to access<br />
projects both individually and as a<br />
group, and to use the collaborative<br />
tools simultaneously.<br />
• Saves all sections of a project and any<br />
changes that your team makes in one<br />
master file, promoting standardization,<br />
collaboration and communication.<br />
• Allows users to save output in HTML<br />
format or copy it into other programs.<br />
• Comes with excellent Help<br />
documentation.<br />
• Is backed by <strong>Minitab</strong>’s exceptional, free<br />
technical support and customer service.<br />
Download a FREE, 30-day demo of Quality Companion at<br />
www.minitab.com/qualitycompanion
Quality Companion Tools Make<br />
Improving Your Process Easy<br />
FMEA Tool: Conduct Failure<br />
Modes and Effects Analysis (FMEA)<br />
to anticipate problems with a new<br />
process, product or service, and to<br />
compare the relative importance of<br />
different causes.<br />
▼ ▼<br />
XY Matrix: Identify an area of focus for the FMEA or<br />
pinpoint the initial factors for a designed experiment.<br />
Brainstorm/Affinity<br />
Diagram Tool: Record<br />
creative ideas during a<br />
brainstorming session and<br />
then organize the ideas<br />
into an affinity diagram.<br />
▼<br />
▼<br />
Process Mapping<br />
Tool: Construct<br />
high-level, detailed<br />
and deployment flow<br />
charts.<br />
Software<br />
<strong>Minitab</strong> Quality Companion <br />
▼<br />
Cause & Effect Diagram Tool:<br />
Determine the most likely causes of<br />
a given outcome and identify areas<br />
where variation may occur.<br />
Plus:<br />
Meeting Tool: Manage the components of a meeting<br />
including creating an agenda and recording minutes<br />
in real time.<br />
Consensus Builder Tool: Reach team decisions using<br />
voting and rating tools.<br />
Forms Tool: Create customized versions of forms like Cost<br />
of Poor Quality, DOE Planning Worksheet, and more, then<br />
save them as templates for your entire organization to use.<br />
Slide Show Tool: Maximize your training investment by<br />
incorporating your own training slides into the Roadmap,<br />
allowing team members access to training materials when<br />
they need them most.<br />
Hyperlink Tool: Link any external file or web address<br />
directly into the Roadmap.<br />
www.minitab.com 15
Services<br />
16<br />
Without question, the accuracy and reliability<br />
of our software is unsurpassed, but what<br />
truly distinguishes <strong>Minitab</strong> from any other<br />
company that offers quality improvement<br />
tools is our outstanding service.<br />
At <strong>Minitab</strong>, customer support means much more than simply helping<br />
you install our software. Your satisfaction with our products and your<br />
success with your quality initiatives are our priority, and we will always<br />
do whatever we can to ensure both.
Outstanding Training<br />
MINITAB Training is one of the<br />
fastest and most cost-effective ways<br />
to maximize your ability to use our<br />
statistical software. We offer public and<br />
on-site training courses around the<br />
world, and our trainers – among the<br />
most highly regarded in the field –<br />
are expert statisticians and seasoned<br />
professionals with industry experience.<br />
Technical Support<br />
Registered users of all our software<br />
products have free access to our friendly,<br />
highly skilled technical support staff.<br />
That’s right, FREE. No credit card,<br />
no hidden fees, no limit on the time<br />
it takes to help you. And the support<br />
you get is the best in the industry<br />
– every member of our technical<br />
support team is a statistical specialist<br />
experienced in helping customers<br />
involved in quality improvement.<br />
We developed our training materials<br />
specifically for quality improvement<br />
specialists, and offer two series of classes<br />
that focus on either manufacturing<br />
or transactional processes, so you can<br />
select a curriculum that presents case<br />
studies and metrics encountered in<br />
your profession.<br />
If it is easier for you to request help online,<br />
you can visit our <strong>Minitab</strong> Customer Center<br />
at http://customer.minitab.com/<br />
You get the same high quality responses,<br />
and we even log your request and our<br />
answers so you can refer to them later.<br />
“MINITAB Training was one<br />
of the best workshops I have<br />
ever attended and will truly<br />
help me to begin applying<br />
MINITAB immediately. Even<br />
though we all had different<br />
levels of experience going into<br />
the class, everyone learned<br />
a great deal.”<br />
Christine Y. Clifford<br />
Director<br />
First Data<br />
“<strong>Minitab</strong>’s excellent technical<br />
support is particularly useful to<br />
Six Sigma practitioners.”<br />
Jack West<br />
Six Sigma Blackbelt<br />
Northrup Grumman<br />
www.minitab.com 17
“Our <strong>Minitab</strong> renewal went<br />
very well as usual. Our <strong>Minitab</strong><br />
account representatives are<br />
always helpful and pleasant.”<br />
Sherry Harvey<br />
License Coordinator for Seebeck<br />
Computer Center<br />
University of Alabama-Tuscaloosa<br />
18<br />
Exceptional<br />
Customer Service<br />
The <strong>Minitab</strong> sales team is as committed to<br />
your quality improvement as you are. Our<br />
representatives learn how your company<br />
will use our software and then determine the<br />
best and most affordable solution for you.<br />
Whether you are a small business or<br />
a complex, global operation, you can<br />
count on our sales team to:<br />
• Offer you the most flexible licensing<br />
options in the business with great<br />
volume pricing.<br />
• Make ordering easy and then follow-up<br />
to guarantee your satisfaction.<br />
• Oversee a smooth and cost-efficient<br />
deployment, regardless of your<br />
company’s size.<br />
• Communicate with you regularly and<br />
provide enhanced solutions as your<br />
company’s needs grow and change.<br />
We also have Independent Local<br />
Representatives in Europe, Asia,<br />
Australia, and Central and South<br />
America who provide local sales,<br />
customer service, training, and free<br />
technical support in their countries’<br />
local languages. And we send all<br />
interested customers free newsletters<br />
that are filled with technical tips,<br />
customer success stories, interviews with<br />
leaders in quality improvement, and<br />
much more.
Six Sigma Expertise<br />
It is no accident that MINITAB is the<br />
statistical package used by the leading<br />
Six Sigma consultants to train their<br />
global clientele, or that MINITAB has<br />
been used in virtually every major Six<br />
Sigma initiative around the world.<br />
Since 1996, we have been continuously<br />
improving MINITAB to meet the unique<br />
needs of Six Sigma practitioners, and<br />
our sales personnel bring years of Six<br />
Sigma knowledge and experience to<br />
every customer served.<br />
We also have a Six Sigma Business<br />
Coordinator and staff who dedicate<br />
themselves exclusively to Six Sigma<br />
<strong>Minitab</strong> Online<br />
<strong>Minitab</strong> offers a wealth of information<br />
and support on the web including an<br />
Answers Knowledgebase of frequently<br />
asked questions, the latest product<br />
customers. They keep abreast of the<br />
latest advances in the movement and<br />
work closely with Six Sigma consultants<br />
so we can respond quickly to the<br />
demands of their clients.<br />
information, statistical resources, and<br />
free maintenance updates. We also have<br />
websites devoted exclusively to Japanese<br />
and French customers.<br />
You can visit us online at:<br />
• www.minitab.com<br />
• www.minitab.jp<br />
• www.minitab.fr<br />
Services<br />
www.minitab.com 19
Contents<br />
Software ..................................... 4<br />
MINITAB Release 14 Statistical<br />
Software for Windows ® .................. 4<br />
MINITAB in Other Languages ............5<br />
MINITAB in French<br />
MINITAB Japanese/English<br />
MINITAB Korean/English..........................5<br />
Ease of Use Features.......................6-7<br />
StatGuide ................................................6<br />
Project Files.............................................6<br />
ReportPad................................................6<br />
Smart Dialog Boxes ................................6<br />
Import/Export Capabilities......................6<br />
Customizable Menus, Toolbars,<br />
Preferences, and Profiles........................7<br />
New Graphics Capabilities ............8-9<br />
Statistics to Improve<br />
Your Process ................................10-12<br />
Basic Statistics .....................................10<br />
Statistical Process Control ...................10<br />
Measurement Systems Analysis .........11<br />
Process Capability.................................11<br />
DOE........................................................12<br />
Reliability ..............................................12<br />
MINITAB 14 – Capabilities/<br />
What’s New.......................................13<br />
US Office<br />
<strong>Minitab</strong> Inc.<br />
USA/CAN: +1.800.448.3555<br />
Tel: +1.814.238.3280<br />
Fax: +1.814.238-4383<br />
E-mail: sales@minitab.com<br />
or intlsales@mintab.com for<br />
international customers<br />
UK Office<br />
<strong>Minitab</strong> Ltd.<br />
Tel: +44 (0) 24 7643 7500<br />
Fax: +44 (0) 24 7665 2888<br />
E-mail: sales@minitab.co.uk<br />
MINITAB ® and the MINITAB logo ® are registered trademarks of <strong>Minitab</strong> Inc.<br />
MINITAB QUALITY COMPANION and the QUALITY COMPANION logo are trademarks of <strong>Minitab</strong> Inc.<br />
All other marks referenced remain the property of their respective owners.<br />
Testimonials represent the views of the quoted individual and not necessarily those of his/her employer.<br />
<strong>Minitab</strong> Quality Companion ......... 14<br />
Roadmap ...............................................14<br />
Process Mapping Tool ..........................15<br />
FMEA Tool .............................................15<br />
Cause & Effect Diagram Tool ...............15<br />
XY Matrix ..............................................15<br />
Brainstorm/Affinity Diagram Tool ........15<br />
Meeting Tool.........................................15<br />
Consensus Builder Tool ........................15<br />
Forms Tool .............................................15<br />
Slide Show Tool ....................................15<br />
Hyperlink Tool........................................15<br />
Services.................................... 16<br />
MINITAB Training .............................17<br />
Technical Support.............................17<br />
Customer Service .............................18<br />
Six Sigma..........................................19<br />
<strong>Minitab</strong> Online..................................19<br />
French Office<br />
<strong>Minitab</strong> SARL<br />
Tel: +33 (0) 1 55 33 12 36<br />
Fax: +33 (0) 1 55 33 12 39<br />
E-mail: bienvenue@minitab.fr<br />
MBREA.C