- Page 1 and 2:
ENVIRONMENTAL ERGONOMICS XII Procee
- Page 3 and 4:
ENVIRONMENTAL ERGONOMICS XII Procee
- Page 5 and 6:
International Conferences on Enviro
- Page 7 and 8:
TABLE OF CONTENTS Table of contents
- Page 9 and 10:
Table of contents ALTITUDE ATTENUAT
- Page 11 and 12:
Table of contents TOWARDS PREVENTIO
- Page 13 and 14:
Table of contents RATE AFFECT EXERC
- Page 15 and 16:
Table of contents Uroš Dobnikar, S
- Page 17 and 18:
Table of contents TO A HOT ENVIRONM
- Page 19 and 20:
Table of contents Andreas D. Flouri
- Page 21 and 22:
Table of contents PHYSICAL FITNESS
- Page 23 and 24:
Table of contents ESTIMATION OF THE
- Page 25 and 26:
Herman Potocnic Lecture the advanta
- Page 27 and 28:
Invited presentation Gravitational
- Page 29 and 30:
Gravitational Physiology SKELETAL M
- Page 31 and 32:
Lf (mm) 50.0 40.0 30.0 20.0 10.0 Fa
- Page 33 and 34:
Gravitational Physiology maximum is
- Page 35 and 36:
Gravitational Physiology THERMOREGU
- Page 37 and 38:
Gravitational Physiology THE EXERCI
- Page 39 and 40:
Gravitational Physiology Since exer
- Page 41 and 42:
Gravitational Physiology During the
- Page 43 and 44: Gravitational Physiology CARDIOVASC
- Page 45 and 46: as observed at rest after LBNP was
- Page 47 and 48: Gravitational Physiology THERMOREGU
- Page 49 and 50: Gravitational Physiology THE EFFECT
- Page 51 and 52: Gravitational Physiology Fortney SM
- Page 53 and 54: Gravitational Physiology Contractil
- Page 55 and 56: Gravitational Physiology Edgerton V
- Page 57 and 58: Diving Physiology A library of imag
- Page 59 and 60: Diving Physiology Information recal
- Page 61 and 62: Diving Physiology RESULTS Figure 1
- Page 63 and 64: Diving Physiology sensitivity is no
- Page 65 and 66: Diving Physiology Physiological Mea
- Page 67 and 68: Diving Physiology same sequence. Th
- Page 69 and 70: Diving Physiology HYPERVENTILATION
- Page 71 and 72: Diving Physiology software. Individ
- Page 73 and 74: Diving Physiology REFERENCES IMCA.
- Page 75 and 76: Diving Physiology recorded (MIE Med
- Page 77 and 78: Diving Physiology DISCUSSION The ma
- Page 79 and 80: Altitude Physiology vastus laterali
- Page 81 and 82: Altitude Physiology IS INTERMITTENT
- Page 83 and 84: Altitude Physiology Table 2: Lactat
- Page 85 and 86: Altitude Physiology CARBOHYDRATE IN
- Page 87 and 88: Altitude Physiology Figure 1: Mean
- Page 89 and 90: Altitude Physiology HYPOXIA INDUCED
- Page 91 and 92: Altitude Physiology Figure 1. Mean
- Page 93: Altitude Physiology ANALYSIS OF MUS
- Page 97 and 98: Altitude Physiology LOAD CARRIAGE I
- Page 99 and 100: Table 2: Differential ratings of pe
- Page 101 and 102: Altitude Physiology EFFECTS OF INTE
- Page 103 and 104: Cerebral deoxy-Hb (delta, µM) Cere
- Page 105 and 106: Altitude Physiology ENDURANCE RESPI
- Page 107 and 108: Altitude Physiology Wylegala JA, Pe
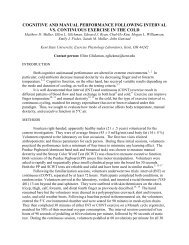
- Page 109 and 110: Invited presentation Cognitive and
- Page 111 and 112: Cognitive and Psycophysiological Fu
- Page 113 and 114: Cognitive and Psycophysiological Fu
- Page 115 and 116: Cognitive and Psycophysiological Fu
- Page 117 and 118: Cognitive and Psycophysiological Fu
- Page 119 and 120: Cognitive and Psycophysiological Fu
- Page 121 and 122: Cognitive and Psycophysiological Fu
- Page 123 and 124: Cognitive and Psycophysiological Fu
- Page 125 and 126: Cognitive and Psycophysiological Fu
- Page 127 and 128: Cognitive and Psycophysiological Fu
- Page 129 and 130: Cognitive and psychophysiological f
- Page 131 and 132: CLOTHING AND TEXTILE SCIENCE 131
- Page 133 and 134: Clothing SPACER FABRICS IN OUTDOOR
- Page 135 and 136: F i / g m -2 4,0 3,5 3,0 2,5 2,0 1,
- Page 137 and 138: Clothing TOTAL EVAPORATIVE RESISTAN
- Page 139 and 140: 9,0 8,0 7,0 6,0 5,0 4,0 3,0 2,0 1,0
- Page 141 and 142: Clothing DIFFERENCES IN CLOTHING IN
- Page 143 and 144: Clothing parallel It values ranged
- Page 145 and 146:
Clothing CORRELATION BETWEEN SUBJEC
- Page 147 and 148:
Clothing and left side chest, scapu
- Page 149 and 150:
Clothing studies using an ice vest
- Page 151 and 152:
Insulation (Clo) (Clo) Clo / kg 6 5
- Page 153 and 154:
Clothing EFFECTS OF MOISTURE TRANSP
- Page 155 and 156:
Clothing the P plots above 60%RH (p
- Page 157 and 158:
Clothing EFFECT OF CLOTHING INSULAT
- Page 159 and 160:
Clothing EFFECTS OF QUILT AND MATTR
- Page 161 and 162:
38 33 28 23 18 0 30 60 90 120 150 m
- Page 163 and 164:
Clothing German) were measured, and
- Page 165 and 166:
Clothing Metabolism decreased and w
- Page 167 and 168:
Clothing Table 1. Comparison of ski
- Page 169 and 170:
Clothing PHYSIOLOGICAL RESPONSES AT
- Page 171 and 172:
Clothing underwear at 25 °C in per
- Page 173 and 174:
Clothing REDUCTION OF HEAT STRESS I
- Page 175 and 176:
Clothing THE INTERACTION BETWEEN PH
- Page 177 and 178:
Relative humidity (%) Clothing Figu
- Page 179 and 180:
Clothing DEVELOPMENT OF THE “WEAR
- Page 181 and 182:
Clothing EFFECTS OF AIR GAPS UNDER
- Page 183 and 184:
Temper at ur e( ˇ ć) 28.5 27.5 26
- Page 185 and 186:
Personal protective equipment Invit
- Page 187 and 188:
Personal protective equipment fabri
- Page 189 and 190:
Personal protective equipment PHYSI
- Page 191 and 192:
Mean skin temperature (ºC) 38.0 37
- Page 193 and 194:
Personal protective equipment the S
- Page 195 and 196:
Personal protective equipment DISCU
- Page 197 and 198:
Personal protective equipment Final
- Page 199 and 200:
Personal protective equipment REFER
- Page 201 and 202:
Personal protective equipment Tc wa
- Page 203 and 204:
Personal protective equipment level
- Page 205 and 206:
F i / g m -2 300 250 200 150 100 50
- Page 207 and 208:
h M / % 90 80 70 60 50 40 activity
- Page 209 and 210:
Personal protective equipment 0.05
- Page 211 and 212:
Personal protective equipment was u
- Page 213 and 214:
Personal protective equipment THERM
- Page 215 and 216:
Personal protective equipment the s
- Page 217 and 218:
Personal protective equipment the c
- Page 219 and 220:
Personal protective equipment wette
- Page 221 and 222:
Table 1 1. Properties of the tested
- Page 223 and 224:
Personal protective equipment HEAT
- Page 225 and 226:
Personal protective equipment Profi
- Page 227 and 228:
Personal protective equipment PHYSI
- Page 229 and 230:
Personal protective equipment REDUC
- Page 231 and 232:
39.0 38.5 38.0 37.5 37.0 36.5 40.0
- Page 233 and 234:
Personal protective equipment EXERC
- Page 235 and 236:
Personal protective equipment appro
- Page 237 and 238:
Personal protective equipment Table
- Page 239 and 240:
Personal protective equipment reduc
- Page 241 and 242:
Invited presentation Non-thermal fa
- Page 243 and 244:
Non-thermal factors heat loss by al
- Page 245 and 246:
Non-thermal factors DOES A FATIGUE-
- Page 247 and 248:
Non-thermal factors cycling, despit
- Page 249 and 250:
Non-thermal factors INDIVIDUAL VARI
- Page 251 and 252:
Non-thermal factors to some categor
- Page 253 and 254:
Non-thermal factors RATES OF TOTAL
- Page 255 and 256:
Non-thermal factors CHANGES IN BLOO
- Page 257 and 258:
Non-thermal factors Table 1. Thresh
- Page 259 and 260:
Non-thermal factors THE DIFFERENCE
- Page 261 and 262:
Water intake(g) 2000 1800 1600 1400
- Page 263 and 264:
Non-thermal factors IMPROVED FLUID
- Page 265 and 266:
Non-thermal factors A tendency for
- Page 267 and 268:
Sweating Table 1: Sweat gland count
- Page 269 and 270:
Sweating Taylor, N.A.S. (2000). Reg
- Page 271 and 272:
Sweating back/waist area and finall
- Page 273 and 274:
Figure 1: A chrome dome following p
- Page 275 and 276:
Sweating Such differences could be
- Page 277 and 278:
Sweating the forearm and thigh skin
- Page 279 and 280:
Sweating dramatically after puberty
- Page 281 and 282:
Sweating In addition local sweating
- Page 283 and 284:
Sweating REGIONAL FOOT SWEAT RATES
- Page 285 and 286:
Sweating REGIONAL SWEAT RATES OF TH
- Page 287 and 288:
Sweating Figure 2 shows the skin te
- Page 289 and 290:
Sweating SWEATY HANDS: DIFFERENCES
- Page 291 and 292:
Sweating Figure 2: Inter-site sweat
- Page 293 and 294:
Sweating REGIONAL DIFFERENCES IN TO
- Page 295 and 296:
Sweating Figure 2: Inter-site sweat
- Page 297 and 298:
Sweating MENSTRUAL CYCLE DOES NOT A
- Page 299 and 300:
Sweating RESULTS On average, the ma
- Page 301 and 302:
Sweating THE SWEAT SECRETION AND SO
- Page 303 and 304:
Sweating Figure 1: A quadrant diagr
- Page 305 and 306:
Invited presentation FINGER COLD IN
- Page 307 and 308:
Cold physiology INTRA-INDIVIDUAL DI
- Page 309 and 310:
Cold physiology number was estimate
- Page 311 and 312:
Cold physiology cold receptors decr
- Page 313 and 314:
Cold physiology EFFECT OF URAPIDIL
- Page 315 and 316:
Cold physiology THE EFFECT OF EXERC
- Page 317 and 318:
TRAINABILITY OF COLD INDUCED VASODI
- Page 319 and 320:
Cold physiology REFERENCES Adams, T
- Page 321 and 322:
Cold physiology THE EFFECT OF REPEA
- Page 323 and 324:
Cold physiology THE EFFECT OF ALTIT
- Page 325 and 326:
Cold physiology SKIN SURFACE MENTHO
- Page 327 and 328:
Cold physiology COGNITIVE PERFORMAN
- Page 329 and 330:
Seconds 6.5 6.0 5.5 5.0 4.5 4.0 3.5
- Page 331 and 332:
Cold water immersion REFERENCES Mek
- Page 333 and 334:
Cold water immersion the formula: M
- Page 335 and 336:
Cold water immersion REFERENCES Cho
- Page 337 and 338:
Cold water immersion were: 1 metre
- Page 339 and 340:
Cold water immersion surf beaches.
- Page 341 and 342:
Cold water immersion Table 1. Break
- Page 343 and 344:
Cold water immersion ARM INSULATION
- Page 345 and 346:
Cold water immersion RESULTS Experi
- Page 347 and 348:
Cold water immersion thermogenesis
- Page 349 and 350:
Cold water immersion The other comp
- Page 351 and 352:
Cold water immersion REFERENCES And
- Page 353 and 354:
Thermal comfort THERMAL SENSATIONS
- Page 355 and 356:
Exer - cise PC Wind (m·s -1 ) 0 ne
- Page 357 and 358:
Thermal comfort and heart rate usin
- Page 359 and 360:
Thermal comfort A NEW METHOD FOR EV
- Page 361 and 362:
Thermal comfort DEVELOPMENT OF AN I
- Page 363 and 364:
Thermal comfort DISCUSSION This new
- Page 365 and 366:
Thermal comfort limit of exposure d
- Page 367 and 368:
Table 2: Statistical summary. Gende
- Page 369 and 370:
Thermal comfort comfortable”), wh
- Page 371 and 372:
Thermal comfort RELATION BETWEEN TH
- Page 373 and 374:
Thermal comfort Figure 2. Skin wett
- Page 375 and 376:
Thermal comfort THE EVALUATION OF T
- Page 377 and 378:
Temp.ˇ ]˘ Jˇ ^ 42 40 38 36 34 32
- Page 379 and 380:
time(min) Thermal comfort WHY DO JA
- Page 381 and 382:
Thermal comfort TCT : THERMAL COMFO
- Page 383 and 384:
Thermal comfort INTERNATIONAL STAND
- Page 385 and 386:
Acute and chronic heat exposure PHY
- Page 387 and 388:
Acute and chronic heat exposure Fig
- Page 389 and 390:
Acute and chronic heat exposure EFF
- Page 391 and 392:
Acute and chronic heat exposure 2.2
- Page 393 and 394:
Acute and chronic heat exposure EFF
- Page 395 and 396:
Acute and chronic heat exposure A N
- Page 397 and 398:
Acute and chronic heat exposure of
- Page 399 and 400:
Acute and chronic heat exposure PHY
- Page 401 and 402:
Acute and chronic heat exposure Tab
- Page 403 and 404:
Acute and chronic heat exposure INT
- Page 405 and 406:
probability plot 99 95 80 60 40 20
- Page 407 and 408:
Acute and chronic heat exposure HAN
- Page 409 and 410:
Acute and chronic heat exposure ALL
- Page 411 and 412:
Acute and chronic heat exposure Tab
- Page 413 and 414:
Acute and chronic heat exposure UNC
- Page 415 and 416:
Thermal Sensation Scale 10 9 8 7 6
- Page 417 and 418:
Acute and chronic heat exposure RES
- Page 419 and 420:
Acute and chronic heat exposure eve
- Page 421 and 422:
Acute and chronic heat exposure 30%
- Page 423 and 424:
Acute and chronic heat exposure REF
- Page 425 and 426:
RADIANT FLOW THROUGH BICYCLE HELMET
- Page 427 and 428:
Figure 2. Difference in heat transf
- Page 429 and 430:
Manikins DEVELOPMENT OF A LYING DOW
- Page 431 and 432:
IT = 6.45( _ ,Tsk - _ ,Tair)/(Q/A)
- Page 433 and 434:
Manikins cases. If the body is even
- Page 435 and 436:
Heat balance components 100% 80% 60
- Page 437 and 438:
Manikins clothing system. This effe
- Page 439 and 440:
Manikins The coupled system was val
- Page 441 and 442:
Manikins A NOVEL APPROACH TO MODEL-
- Page 443 and 444:
Manikins THERMAL MANIKIN EVALUATION
- Page 445 and 446:
SR (g/min) Figure 2. Predictive mod
- Page 447 and 448:
ESTIMATION OF COOLING EFFECT OF ICE
- Page 449 and 450:
Manikins Figure 3: Comparison among
- Page 451 and 452:
Manikins EVALUATION OF THE ARMY BOO
- Page 453 and 454:
Ty [Nm] 60 50 40 30 20 10 0 0 5 10
- Page 455 and 456:
Manikins different black 100% cotto
- Page 457 and 458:
Manikins REFERENCES Bogerd, C.P., H
- Page 459 and 460:
Modelling RESULTS From this kind of
- Page 461 and 462:
Modelling (T , T , V& , ) = 1. 0 +
- Page 463 and 464:
NORMALIZED CVCL 8 7 6 5 4 3 2 1 0 M
- Page 465 and 466:
Modelling illustrated in Figure 1.
- Page 467 and 468:
Modelling MODELLING PATIENT TEMPERA
- Page 469 and 470:
Modelling Figure 1: Blood and mean
- Page 471 and 472:
Modelling simulations the additiona
- Page 473 and 474:
Modelling Table 1. Descriptive summ
- Page 475 and 476:
Modelling concomitant increase in b
- Page 477 and 478:
Modelling REFERENCES 1. U.S. Depart
- Page 479 and 480:
Modelling from the 1988 population.
- Page 481 and 482:
Modelling somatotypes in multivaria
- Page 483 and 484:
Modelling Each scan data was first
- Page 485 and 486:
Modelling The line through the data
- Page 487 and 488:
Hip( width) −Waist ( width ) HW
- Page 489 and 490:
Modelling measurements are extracte
- Page 491 and 492:
Measurement methods not included in
- Page 493 and 494:
Measurement methods humidity. The o
- Page 495 and 496:
Measurement methods DISCUSSION Base
- Page 497 and 498:
Air film Skin surface Skin layer δ
- Page 499 and 500:
Measurement methods and calculated
- Page 501 and 502:
Rectal temperature ( o C) 39.5 39.0
- Page 503 and 504:
Measurement methods work rates, and
- Page 505 and 506:
Measurement methods HUMIDEX: CAN TH
- Page 507 and 508:
Measurement methods highlighted. In
- Page 509 and 510:
Invited presentation Universal Ther
- Page 511 and 512:
Universal Thermal Climate Index dat
- Page 513 and 514:
Universal Thermal Climate Index DYN
- Page 515 and 516:
Universal Thermal Climate Index DIS
- Page 517 and 518:
Universal Thermal Climate Index COM
- Page 519 and 520:
Skin temperature (°C) Universal Th
- Page 521 and 522:
Universal Thermal Climate Index PRO
- Page 523 and 524:
Universal Thermal Climate Index The
- Page 525 and 526:
Universal Thermal Climate Index ASS
- Page 527 and 528:
Universal Thermal Climate Index ima
- Page 529 and 530:
Universal Thermal Climate Index min
- Page 531 and 532:
Working environment EFFECTS OF LIGH
- Page 533 and 534:
Working environment It is interesti
- Page 535 and 536:
30 25 20 15 10 5 0 25 12 Working en
- Page 537 and 538:
Working environment ERGONOMICS OPTI
- Page 539 and 540:
Working environment astigmatism, an
- Page 541 and 542:
Working environment RESULTS The hig
- Page 543 and 544:
Working environment hearing protect
- Page 545 and 546:
Working environment Redistribution
- Page 547 and 548:
Working environment DISCUSSION Thes
- Page 549 and 550:
Working Environment over the phone
- Page 551 and 552:
Working Environment DISCUSSION Diff
- Page 553 and 554:
Working Environment results, conclu
- Page 555 and 556:
Working Environment BP as the refer
- Page 557 and 558:
Working Environment significantly a
- Page 559 and 560:
Working Environment responses betwe
- Page 561 and 562:
Working Environment Casualty handli
- Page 563 and 564:
Working Environment REFERENCES Davi
- Page 565 and 566:
Working Environment RESULTS The sub
- Page 567 and 568:
Temperature (C) 35 33 31 29 27 25 2
- Page 569 and 570:
Working Environment METHODS Student
- Page 571 and 572:
Working Environment ANTHROPOGENIC I
- Page 573 and 574:
Working Environment RESULTS The res
- Page 575 and 576:
Employment Standards VISUAL ACUITY
- Page 577 and 578:
Employment Standards Results are pr
- Page 579 and 580:
Employment Standards to spend free
- Page 581 and 582:
Occupational Thermal Problems and d
- Page 583 and 584:
Occupational Thermal Problems HEAT
- Page 585 and 586:
Occupational Thermal Problems some
- Page 587 and 588:
Occupational Thermal Problems HORSE
- Page 589 and 590:
Occupational Thermal Problems range
- Page 591 and 592:
Occupational Thermal Problems PHYSI
- Page 593 and 594:
Occupational Thermal Problems DISCU
- Page 595 and 596:
Occupational Thermal Problems recom
- Page 597 and 598:
DLEmin [hours] 7,0 6,0 5,0 4,0 3,0
- Page 599 and 600:
Occupational Thermal Problems EFFEC
- Page 601 and 602:
Occupational Thermal Problems PERIP
- Page 603 and 604:
Occupational Thermal Problems durin
- Page 605 and 606:
Occupational Thermal Problems PRODU
- Page 607 and 608:
Time (hours) 4 3,5 3 2,5 2 1,5 1 0,
- Page 609 and 610:
Occupational Thermal Problems (Suun
- Page 611 and 612:
Occupational Thermal Problems highl
- Page 613 and 614:
Occupational Thermal Problems and o
- Page 615 and 616:
1) estimated (208 - 0.7 x age) *P
- Page 617 and 618:
Occupational Thermal Problems of a
- Page 619 and 620:
Occupational Thermal Problems tempe
- Page 621 and 622:
Table 1: Environmental conditions o
- Page 623 and 624:
Occupational Thermal Problems The h
- Page 625 and 626:
Occupational Thermal Problems RESUL
- Page 627 and 628:
Occupational Thermal Problems PHYSI
- Page 629 and 630:
Occupational Thermal Problems corre
- Page 631 and 632:
Occupational Thermal Problems DEVEL
- Page 633 and 634:
Occupational Thermal Problems All i
- Page 635 and 636:
A Adolfsson Niklas 540 Ainslie Phil
- Page 637 and 638:
Kim Myung-Ju 409 Kim Taegyou 189 Kl
- Page 639 and 640:
Sormunen Erja 599 Spindler Uli 145
- Page 641:
SPONSOR 641