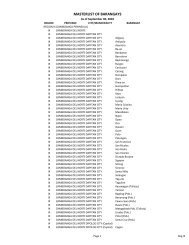
Population Profile Barangay Count - DILG
Population Profile Barangay Count - DILG
Population Profile Barangay Count - DILG

You also want an ePaper? Increase the reach of your titles
YUMPU automatically turns print PDFs into web optimized ePapers that Google loves.
Financial <strong>Profile</strong>:<br />
Revenue Generation<br />
Source: LGPMS, 2011<br />
IRA Dependency<br />
Highest IRA Dependency Lowest IRA<br />
(Local Revenues vs. IRA)<br />
Dependency<br />
Prov’l Ave. 89% Lanao del Sur<br />
99.97%<br />
Bataan<br />
46%<br />
City Ave. 65% Himamaylan City,<br />
Negros Occidental<br />
Municipal Ave. 88% Hadji Panglima<br />
Tahil, Sulu<br />
95.68% Makati City 7%<br />
99.96% Sual, Pangasinan 20%<br />
Locally-Sourced Revenues,<br />
Highest Locally-Sourced Lowest Locally-Sourced<br />
in PhP Million<br />
Revenues<br />
Revenues<br />
Prov’l Ave. 129.07 Cavite 808.24 Lanao del Sur<br />
Tangub City,<br />
0.36<br />
City Ave. 455.14 Makati City 8,355.83 Misamis<br />
Occidental<br />
8.21<br />
Municipal Ave. 12.99<br />
Cabuyao,<br />
Laguna<br />
456.49<br />
Hadji<br />
Panglima Tahil<br />
0.01007<br />
IRA Share, in PhP Million<br />
Highest IRA Share<br />
Lowest IRA Share<br />
Prov’l Ave. 842.53 Pangasinan 1,804.63 Siquijor 203.59<br />
City Ave.<br />
464.89<br />
Davao City 2,615.74<br />
El Salvador City,<br />
Misamis Oriental<br />
San Benito,<br />
60.72<br />
Municipal Ave.<br />
Bacoor, Cavite 368.00 Surigao del<br />
2.30<br />
63.61<br />
Norte<br />
LGUs’ Total Income,<br />
in PhP Million<br />
Highest Total Income<br />
Lowest Total Income<br />
Prov’l Ave. 777.77 Cavite 2,481.57 Siquijor<br />
El Salvador City,<br />
227.93<br />
City Ave. 1,001.58 Quezon City 12,761.67 Misamis<br />
Oriental<br />
San Benito,<br />
89.055<br />
Municipal Ave.<br />
Notes:<br />
82.24 Bacoor, Cavite 750.00 Surigao del<br />
Norte<br />
2.68<br />
1. Computation of IRA Dependency:<br />
IRA Dependency = (IRA/Regular Revenue)*100<br />
Regular Revenue = (IRA+Locally-Sourced Revenues)<br />
2. Computation is based on data from 79 provinces, 135 cities, and 1,468 municipalities.<br />
3. Locally Sourced Revenues are from Local Tax and Non-Tax Revenues.<br />
4. LGUs’ Total Income is obtained from locally-sourced revenues and external sources like IRA, other<br />
shares from national tax collections, inter-local transfer, extraordinary receipts, grants and donations.