Population Profile Barangay Count - DILG
Population Profile Barangay Count - DILG
Population Profile Barangay Count - DILG

You also want an ePaper? Increase the reach of your titles
YUMPU automatically turns print PDFs into web optimized ePapers that Google loves.
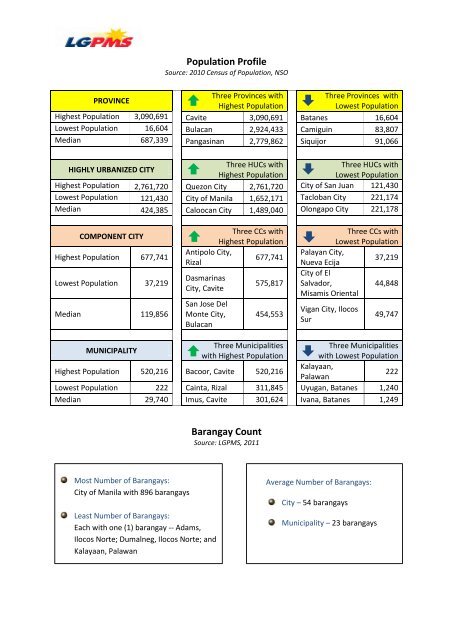
<strong>Population</strong> <strong>Profile</strong><br />
Source: 2010 Census of <strong>Population</strong>, NSO<br />
PROVINCE<br />
Three Provinces with<br />
Highest <strong>Population</strong><br />
Three Provinces with<br />
Lowest <strong>Population</strong><br />
Highest <strong>Population</strong> 3,090,691 Cavite 3,090,691 Batanes 16,604<br />
Lowest <strong>Population</strong> 16,604 Bulacan 2,924,433 Camiguin 83,807<br />
Median 687,339 Pangasinan 2,779,862 Siquijor 91,066<br />
HIGHLY URBANIZED CITY<br />
Three HUCs with<br />
Highest <strong>Population</strong><br />
Three HUCs with<br />
Lowest <strong>Population</strong><br />
Highest <strong>Population</strong> 2,761,720 Quezon City 2,761,720 City of San Juan 121,430<br />
Lowest <strong>Population</strong> 121,430 City of Manila 1,652,171 Tacloban City 221,174<br />
Median 424,385 Caloocan City 1,489,040 Olongapo City 221,178<br />
COMPONENT CITY<br />
Highest <strong>Population</strong> 677,741<br />
Lowest <strong>Population</strong> 37,219<br />
Median 119,856<br />
Three CCs with<br />
Highest <strong>Population</strong><br />
Antipolo City,<br />
677,741<br />
Rizal<br />
Dasmarinas<br />
City, Cavite<br />
San Jose Del<br />
Monte City,<br />
Bulacan<br />
<strong>Barangay</strong> <strong>Count</strong><br />
Source: LGPMS, 2011<br />
575,817<br />
454,553<br />
Three CCs with<br />
Lowest <strong>Population</strong><br />
Palayan City,<br />
37,219<br />
Nueva Ecija<br />
City of El<br />
Salvador,<br />
44,848<br />
Misamis Oriental<br />
Vigan City, Ilocos<br />
Sur<br />
49,747<br />
MUNICIPALITY<br />
Three Municipalities<br />
with Highest <strong>Population</strong><br />
Three Municipalities<br />
with Lowest <strong>Population</strong><br />
Highest <strong>Population</strong> 520,216 Bacoor, Cavite 520,216<br />
Kalayaan,<br />
Palawan<br />
222<br />
Lowest <strong>Population</strong> 222 Cainta, Rizal 311,845 Uyugan, Batanes 1,240<br />
Median 29,740 Imus, Cavite 301,624 Ivana, Batanes 1,249<br />
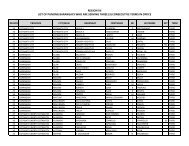
Most Number of <strong>Barangay</strong>s:<br />
City of Manila with 896 barangays<br />
Least Number of <strong>Barangay</strong>s:<br />
Each with one (1) barangay -- Adams,<br />
Ilocos Norte; Dumalneg, Ilocos Norte; and<br />
Kalayaan, Palawan<br />
Average Number of <strong>Barangay</strong>s:<br />
City – 54 barangays<br />
Municipality – 23 barangays
Information Technology <strong>Profile</strong>:<br />
Local Governments with Websites<br />
Source: LGPMS, 2011<br />
No. of<br />
LGUs<br />
No. of LGUs<br />
w/ Websites<br />
Percentage<br />
Province 79 68 86%<br />
City 138 123 89%<br />
Municipality by Income Class<br />
1 st 329 158 48%<br />
2 nd 169 56 33%<br />
3 rd 265 83 31%<br />
4 th 382 105 27%<br />
5 th 280 57 20%<br />
6 th 71 5 7%<br />
Total (Municipality) 1496 464 31%<br />
Total (National)<br />
1713 645 38%<br />
List of Provinces<br />
Without Websites<br />
1. Apayao 7. Masbate<br />
2. Ifugao 8. Negros Oriental<br />
3. Kalinga 9. Biliran<br />
4. Mountain<br />
Province<br />
10. Samar<br />
5. Batanes 11. Tawi-Tawi<br />
6. Nueva Ecija<br />
List of Cities<br />
Without Websites<br />
1. Borongan City 9. Marawi City<br />
2. Danao City 10. El Salvador City<br />
3. Cabadbaran City 11. Victorias City<br />
4. Bayugan City 12. Tanjay City<br />
5. Ligao City<br />
13. San Carlos City,<br />
Pangasinan<br />
6. Valencia City 14. Sorsogon City<br />
7. Malolos City 15. Maasin City<br />
8. Cavite City
Financial <strong>Profile</strong>:<br />
Revenue Generation<br />
Source: LGPMS, 2011<br />
IRA Dependency<br />
Highest IRA Dependency Lowest IRA<br />
(Local Revenues vs. IRA)<br />
Dependency<br />
Prov’l Ave. 89% Lanao del Sur<br />
99.97%<br />
Bataan<br />
46%<br />
City Ave. 65% Himamaylan City,<br />
Negros Occidental<br />
Municipal Ave. 88% Hadji Panglima<br />
Tahil, Sulu<br />
95.68% Makati City 7%<br />
99.96% Sual, Pangasinan 20%<br />
Locally-Sourced Revenues,<br />
Highest Locally-Sourced Lowest Locally-Sourced<br />
in PhP Million<br />
Revenues<br />
Revenues<br />
Prov’l Ave. 129.07 Cavite 808.24 Lanao del Sur<br />
Tangub City,<br />
0.36<br />
City Ave. 455.14 Makati City 8,355.83 Misamis<br />
Occidental<br />
8.21<br />
Municipal Ave. 12.99<br />
Cabuyao,<br />
Laguna<br />
456.49<br />
Hadji<br />
Panglima Tahil<br />
0.01007<br />
IRA Share, in PhP Million<br />
Highest IRA Share<br />
Lowest IRA Share<br />
Prov’l Ave. 842.53 Pangasinan 1,804.63 Siquijor 203.59<br />
City Ave.<br />
464.89<br />
Davao City 2,615.74<br />
El Salvador City,<br />
Misamis Oriental<br />
San Benito,<br />
60.72<br />
Municipal Ave.<br />
Bacoor, Cavite 368.00 Surigao del<br />
2.30<br />
63.61<br />
Norte<br />
LGUs’ Total Income,<br />
in PhP Million<br />
Highest Total Income<br />
Lowest Total Income<br />
Prov’l Ave. 777.77 Cavite 2,481.57 Siquijor<br />
El Salvador City,<br />
227.93<br />
City Ave. 1,001.58 Quezon City 12,761.67 Misamis<br />
Oriental<br />
San Benito,<br />
89.055<br />
Municipal Ave.<br />
Notes:<br />
82.24 Bacoor, Cavite 750.00 Surigao del<br />
Norte<br />
2.68<br />
1. Computation of IRA Dependency:<br />
IRA Dependency = (IRA/Regular Revenue)*100<br />
Regular Revenue = (IRA+Locally-Sourced Revenues)<br />
2. Computation is based on data from 79 provinces, 135 cities, and 1,468 municipalities.<br />
3. Locally Sourced Revenues are from Local Tax and Non-Tax Revenues.<br />
4. LGUs’ Total Income is obtained from locally-sourced revenues and external sources like IRA, other<br />
shares from national tax collections, inter-local transfer, extraordinary receipts, grants and donations.
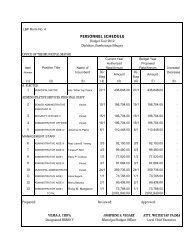
I. Total Expenditures, CY 2010<br />
(in PhP Million)<br />
639.89<br />
42.57<br />
III. Expenditure by Function, CY 2010<br />
(in PhP Million)<br />
Financial <strong>Profile</strong><br />
Operating Expenditures<br />
Source: Statement of Receipts and Expenditures, BLGF-DOF<br />
Prov’l Ave. City Ave. Municipal Ave.<br />
General Public Services 354.95 376.05 40.62<br />
Education, Culture & Sports/<br />
Manpower Development<br />
Health, Nutrition & <strong>Population</strong><br />
Control<br />
31.76 94.85 1.81<br />
137.80 60.79 5.94<br />
Labor and Employment 0.79 0.48 0.09<br />
Housing and Community<br />
Development<br />
781.56<br />
Prov'l Ave. City Ave. Municipal Ave.<br />
Social Security /Social Services &<br />
Welfare<br />
5.40 46.11 1.17<br />
30.29 24.05 3.56<br />
Economic Services 182.73 111.75 11.22<br />
Debt Service (Interest Expense &<br />
Other Charges)<br />
II. Income Surplus or Deficit (-)<br />
from Current Operations, CYs 2008-2010<br />
in PhP Million<br />
2008 2009 2010<br />
Provincial Ave. 110.87 235.69 187.01<br />
City Ave. 156.13 262.04 170.35<br />
Municipal Ave. 7.15 12.05 10.75<br />
Note: Income surplus or deficit is derived after deducting the total<br />
expenditures from total income. If expenditure is more than<br />
income, it is deficit. But in these figures, provinces, cities and<br />
municipalities have surpluses than deficits.<br />
15.07 13.97 0.71<br />
Note: General Public Services covers sector expenditures for services that are indispensable to the existence of<br />
an organized LGU. These include executive and legislative services; overall financial and fiscal services; the<br />
civil service; planning; general research; public order and safety; and centralized services. These exclude<br />
general administration, regulation, research and other services of departments that can be identified directly<br />
under each specific sector. Definition is provided by the Bureau of Local Government Finance. Retrieve the<br />
definitions from http://www.blgf.gov.ph/downloads/manual/SREManual.pdf).
I. Mode of Final Disposal of Solid Wastes<br />
II. <strong>Barangay</strong>s with Material Recovery Facilities<br />
Environmental <strong>Profile</strong><br />
Source: LGPMS, CY 2011<br />
City or municipality with: No. of C/M %<br />
100% of its barangays have MRFs 150 9.18%<br />
75% - 99% of its barangays have MRFs 274 16.77%<br />
50% - 74% of its barangays have MRFs 322 19.71%<br />
25% - 49% of its barangays have MRFs 270 16.52%<br />
0 - 25% of its barangays have MRFs 618 37.82%<br />
Total of Cities<br />
and Municipalities 1,634 100%<br />
III. Local Government Ecosystems <strong>Profile</strong><br />
Local Government<br />
Ecosystem<br />
Mode of Final Disposal<br />
With<br />
Agriculture<br />
With Forest With Freshwater<br />
(river or lake)<br />
With Coastal<br />
No. of C/M: 1,606 1,269 1,406 899<br />
% 98.29% 77.66% 86.05% 55.02%<br />
Total of Cities and Municipalities – 1,634<br />
No. of<br />
C/M<br />
Sanitary Landfill 171 10.47%<br />
Sanitary Landfill and<br />
Controlled Dumpsite<br />
%<br />
139 8.51%<br />
Controlled Dumpsite 613 37.52%<br />
Controlled Dumpsite and<br />
Open Dumpsite<br />
333 20.38%<br />
Open Dumpsite 378 23.13%<br />
Total of Cities<br />
and Municipalities<br />
1,634 100%
Goal 1: Eradicate poverty and hunger<br />
MDG-Related Information<br />
LGPMS, CY 2011<br />
Province City Municipality<br />
Total No. 79 138 1,496<br />
No. % No. % No. %<br />
Local Investment and Incentive Code, enacted 62 78.48% 110 79.71% 649 43.38%<br />
% of local government expenditure on labor and<br />
employment over total expenditure*<br />
0.10% 0.07%<br />
0.14%<br />
Goal 2: Achieve universal primary education<br />
% of local government expenditure on education<br />
over total expenditure*<br />
Goal 3: Promote gender equality and empower women<br />
5% of total budget appropriated for Gender and<br />
Development projects and activities (R.A. 7192<br />
and E.O. 273, s. 1995)<br />
4.19% 13.03%<br />
2.78%<br />
62 78.48% 120 86.96% 1,013 67.71%<br />
Gender and Development Code, enacted 61 77.22% 101 73.19% 793 53.01%<br />
Goal 4: Reduce child mortality<br />
1% of the IRA is appropriated for the<br />
strengthening and implementation of the<br />
programs of the Local Council for the Protection<br />
of Children (LCPC) - R.A. 9344<br />
62 78.48% 115 83.33% 975 65.17%<br />
Functional LCPC** 55 69.62% 101 73.19% 768 51.34%<br />
Code for Children, enacted 73 92.41% 113 81.88% 806 53.88%<br />
Goal 5: Improve Maternal Health<br />
% of RHUs accredited by PhilHealth for Maternity<br />
Care Package ***<br />
% of local government expenditure on health,<br />
nutrition and population control over total<br />
expenditure*<br />
Goal 6: Combat HIV/AIDS, malaria and other diseases<br />
Amount appropriated for the monitoring or<br />
surveillance of the magnitude of Acquired<br />
Immune Deficiency Syndrome or AIDS (RA 8504)<br />
46.3 %<br />
(No. of RHUs – 2281; No. of Accredited MCP- 1,056)<br />
18.16% 8.35% 9.12%<br />
57 72.15% 110 79.71% 619 41.38%<br />
Health and Sanitation Code, enacted 25 31.65% 97 70.29% 624 41.71%<br />
Goal 7: Ensure environmental sustainability<br />
Environmental Code, enacted 59 74.68% 86 62.32% 773 51.67%<br />
Sanitary Landfill as final disposal 17 12.32% 133 8.89%<br />
City or Municipality where 100% of its <strong>Barangay</strong>s<br />
have Material Recovery Facilities<br />
Goal 8: Global partnership for development<br />
47 34.06% 124 8.29%<br />
Local governments with websites 68 86% 123 89% 464 31.02%<br />
*Data source – Statement of Receipts and Expenditure, CY 2010, BLGF-DOF<br />
** Functional LCPC means that the Council: (1) is organized, (2) conducts meeting; (3) documents every<br />
meeting; and (4) is able to cause the approval of a legislation on child survival, protection, participation and<br />
development, including annual appropriation funds for the purpose.<br />
*** Data source – LGU Scorecard on Health, a sub-system of LGPMS, 2011.