the coking properties of coal at elevated pressures. - Argonne ...
the coking properties of coal at elevated pressures. - Argonne ... the coking properties of coal at elevated pressures. - Argonne ...
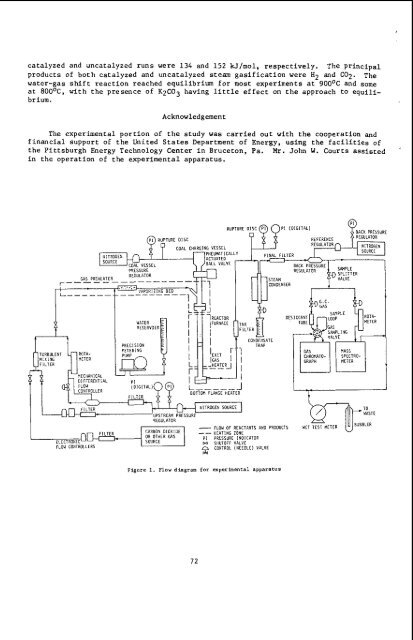
catalyzed and uncatalyzed runs were 134 and 152 W/mol, respectively. The principal products of both catalyzed and uncatalyzed steam gasification were H2 and Cog. The water-gas shift reaction reached equilibrium for most experiments at 900°C and some at 8OO0C, with the presence of K2CO3 having little effect on the approach to equilibrium. Acknowledgement The experimental portion of the study was carried out with the cooperation and financial support of the United States Department of Energy, using the facilities of the Pittsburgh Energy Technology Center in Bruceton, Pa. Mr. John W. Courts assisted in the operation of the experimental apparatus. MIXING MEIER FILTER PRECISION METERING WATER RESERVOIR U 1 REACTOR IFURNACE TAR FILIER ‘EXIT IGAS I 1 -HEATERJ __ I I J OTTOM FLANGE HEATER I CONDENSATE - FLOW OF REACTANIS AND PRODUCTS CARBON DIOXIDE __ HEATING ZONE OR OIHER GAS PI PRESSURE INOICAIDR FLO~ CONTROLLERS SOURCE W SIIUIOFF VALVE f CONTROL (NEEOLE) VALVE Figure 1. Flow diagram for experimental apparatus 72 WASTE
I ! R a + .r. N N m - 0 N 0 7 9 Ln 0 7 0 0 m- ?? 2s W 95 0 w w e+ Ln d 9 0 m 0 Ln 7 9 3
- Page 22 and 23: Flnure 9 SWELLltlG PROPERTIES OF PI
- Page 24 and 25: Fi ure 13 EFFECT OF TOTAL PRESSQRE,
- Page 26 and 27: TABLE 1. OPERATING CONDITIONS Opera
- Page 28 and 29: 1. . 2. 3. 4. 5. 6. 7. 8. 9. REFERE
- Page 30 and 31: Figure 4. SCANNING ELECTRON MICROGR
- Page 32 and 33: Turkgodan et al. (18) studied the p
- Page 34 and 35: Materidl balance on packed bed Boun
- Page 36 and 37: These phenomena iiiay be described
- Page 38 and 39: Walker, P. L., Rusinko, F., and Aus
- Page 40 and 41: -""I- *I,".. I Dlrf".,on Co.1flcl.n
- Page 42 and 43: After a variable residence time, th
- Page 44 and 45: Changes in Char Chemistry The infra
- Page 46 and 47: 20. 21. 22. 23. 24. 25. 26. 27. 28.
- Page 48 and 49: 0s-a 00-a OS'S 00-E os-2 00-2 02.1
- Page 50 and 51: COAL PYROLYSIS AT HIGH TEMPERATURES
- Page 52 and 53: actions, decreasing the secondary c
- Page 54 and 55: 01 40 60 TI MEISeC) 80 100 120 140
- Page 56 and 57: Reaction Temperature OC In-situ Ini
- Page 58 and 59: and the gas velocity is often repre
- Page 60 and 61: The mathematical model developed he
- Page 62 and 63: si sio Fraction of solid species i
- Page 64 and 65: Table 2. Differential Equations Mod
- Page 66 and 67: 1 60 I I RUN KE-5 50 T.1121K(1557'F
- Page 68 and 69: to condense excess steam, the press
- Page 70 and 71: conversion-time data.* The integrat
- Page 74 and 75: CATALYTIC EFFECTS OF ALKALI METAL S
- Page 76 and 77: %me thermogravimetric measurements
- Page 78 and 79: than in steam. Figure 9 shows data
- Page 80 and 81: C - C02 REACTION C - H20 REACTION L
- Page 82 and 83: 1. 2. 3. 4. 5. 6. 7. 8. 9. 10. 11.
- Page 84 and 85: n 'm L u. t m - L 84
- Page 87 and 88: i 5360-096bw \ KINETICS OF POTASSIU
- Page 89 and 90: t 5360-096pj There is an interactio
- Page 91 and 92: 1 I > \ i I 5360-096bw bed data. Be
- Page 93 and 94: I 1. I 5360-096bw ranging from atmo
- Page 95 and 96: uY.ku ICHlMAlIC OF MINI-FLUID BE0 R
- Page 97 and 98: 800-12-1133 -9 FIGURE IO CALCULATED
- Page 99 and 100: Mexico coal. Table 1 shows an analy
- Page 101 and 102: ', Complete results from all runs c
- Page 103 and 104: I the methanol down to atmospheric
- Page 105 and 106: TABLE 3 -----______________________
- Page 107 and 108: \ "I N z 107 c. . 0 0
- Page 109 and 110: I. INTRODUCTION DIRECT METHANATION
- Page 111 and 112: The catalyst development program fo
- Page 113 and 114: Preparing process flow diagrams and
- Page 115 and 116: \ \ i 1. 2,000 4,000 6,000 8,000 10
- Page 117 and 118: (JMS-OlBM-2). The mass spectra were
- Page 119 and 120: I I Fairbridge, R.W. (ed.) 1972, En
- Page 121 and 122: v- W V z d 3 z m 4 ? P m W c3 W m N
c<strong>at</strong>alyzed and unc<strong>at</strong>alyzed runs were 134 and 152 W/mol, respectively. The principal<br />
products <strong>of</strong> both c<strong>at</strong>alyzed and unc<strong>at</strong>alyzed steam gasific<strong>at</strong>ion were H2 and Cog. The<br />
w<strong>at</strong>er-gas shift reaction reached equilibrium for most experiments <strong>at</strong> 900°C and some<br />
<strong>at</strong> 8OO0C, with <strong>the</strong> presence <strong>of</strong> K2CO3 having little effect on <strong>the</strong> approach to equilibrium.<br />
Acknowledgement<br />
The experimental portion <strong>of</strong> <strong>the</strong> study was carried out with <strong>the</strong> cooper<strong>at</strong>ion and<br />
financial support <strong>of</strong> <strong>the</strong> United St<strong>at</strong>es Department <strong>of</strong> Energy, using <strong>the</strong> facilities <strong>of</strong><br />
<strong>the</strong> Pittsburgh Energy Technology Center in Bruceton, Pa. Mr. John W. Courts assisted<br />
in <strong>the</strong> oper<strong>at</strong>ion <strong>of</strong> <strong>the</strong> experimental appar<strong>at</strong>us.<br />
MIXING MEIER<br />
FILTER<br />
PRECISION<br />
METERING<br />
WATER<br />
RESERVOIR<br />
U<br />
1 REACTOR<br />
IFURNACE TAR<br />
FILIER<br />
‘EXIT<br />
IGAS I 1<br />
-HEATERJ __ I<br />
I<br />
J<br />
OTTOM FLANGE HEATER<br />
I<br />
CONDENSATE<br />
- FLOW OF REACTANIS AND PRODUCTS<br />
CARBON DIOXIDE __ HEATING ZONE<br />
OR OIHER GAS PI PRESSURE INOICAIDR<br />
FLO~ CONTROLLERS<br />
SOURCE W SIIUIOFF VALVE<br />
f CONTROL (NEEOLE) VALVE<br />
Figure 1. Flow diagram for experimental appar<strong>at</strong>us<br />
72<br />
WASTE


