the coking properties of coal at elevated pressures. - Argonne ...
the coking properties of coal at elevated pressures. - Argonne ... the coking properties of coal at elevated pressures. - Argonne ...
Materidl balance on packed bed Boundary conditions 11. Solution of the Model r) Three alternative techniques for solution and subsequent parameter estimation from the model are curve fitting in the time domain, curve fitting in the Laplace or Fourier domain, and the method of moments. Moments of the response curve resulting from a pulse input can be solved analytically for the solution to the model in the Laplace domain. Parameter estimation is achieved by matching the measured moments with the analytical expression for the moments. The method of moments was used in this work because it does not require a numerical solution to the model and because parameters estimation can be performed in the time domain. The Laplace transform is applied to the time variable in the equations and boundary conditions of the model. A system of coupled ordinary differential equations is obtained after applying this transform. A theorem relating the transformed solution to the absolute and central moments of time domain solution is The nth absolute moment dn - M, = (-1)” lim - c (s, z) SO dsn is defined as: lq - - 8 - Mn M = n 0” The nth central moment is defined by: MO Applying equation 15) to the transformed solution of the model results in the following equations for the first absolute and second central moments: 34
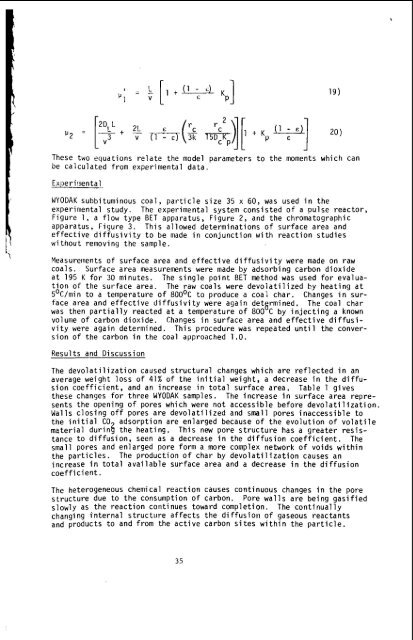
I These two equations relate the model parameters to the moments which can be calculated from experimental data. Experi!!iental WYODAK subbituminous coal, particle size 35 x 60, was used in the experimental study. The experimental system consisted of a pulse reactor, Figure 1, a flow type BET apparatus, Figure 2, and the chromatographic apparatus, Figure 3. This allowed determinations of surface area and effective diffusivity to be made in conjunction with reaction studies without removing the sample. Measurements of surface area and effective diffusivi ty were made on raw coals. Surface area measurements were made by adsorbing carbon dioxide at 195 K for 30 minutes. The single point BET method was used for evaluation of the surface area. The raw coals were devolatilized by heating at SoC/min to a temperature of 8OO0C to produce a coal char. Changes in surface area and effective diffusivity were again detprmined. The coal char was then partially reacted at a temperature of 800 C by injecting a known volume of carbon dioxide. Changes in surface area and effective diffusivity were again determined. This procedure was repeated until the conversion of the carbon in the coal approached 1.0. Results and Discussion The devolatilization caused structural changes which are reflected in an average weight loss of 41% of the initial weight, a decrease in the diffusion coefficient, and an increase in total surface area. Table 1 gives these changes for three WYOOAK samples. The increase in surface area represents the opening of pores which were not accessible before devolatilization. Walls closing off pores are devolatilized and small pores inaccessible to the initial CO adsorption are enlarged because of the evolution of volatile material durin5 the heating, This new pore structure has a greater resistance to diffusion, seen as a decrease in the diffusion coefficient. The small pores and enlarged pore form a more complex network of voids within the particles. increase in total available surface area and a decrease in the diffusion coef f i ci ent . The heterogeneous chemical reaction causes continuous changes in the pore structure due to the consumption of carbon. Pore walls are being gasified slowly as the reaction continues toward completton. The continually changing internal structure affects the diffusion of gaseous reactants and products to and from the active carbon sites within the particle. 19) The production of char by devolatilization causes an 35
- Page 1 and 2: I / The Coking Properties of Coal a
- Page 3 and 4: Procedure : Hand picked lunips of c
- Page 5 and 6: Apparatus: The equipment for this t
- Page 7 and 8: the total pressure on the swelling
- Page 9 and 10: A comparison of the results obtaine
- Page 11 and 12: was used, however, general trends a
- Page 13 and 14: 1 D 13 3 G
- Page 16 and 17: Table 8 L_ Effect os FaeO Compo.lrl
- Page 18 and 19: i-l SPARE SAblPLE Plortlc 209 Figur
- Page 20 and 21: - z c 100,000 50,000 10,000 0 n 5,0
- Page 22 and 23: Flnure 9 SWELLltlG PROPERTIES OF PI
- Page 24 and 25: Fi ure 13 EFFECT OF TOTAL PRESSQRE,
- Page 26 and 27: TABLE 1. OPERATING CONDITIONS Opera
- Page 28 and 29: 1. . 2. 3. 4. 5. 6. 7. 8. 9. REFERE
- Page 30 and 31: Figure 4. SCANNING ELECTRON MICROGR
- Page 32 and 33: Turkgodan et al. (18) studied the p
- Page 36 and 37: These phenomena iiiay be described
- Page 38 and 39: Walker, P. L., Rusinko, F., and Aus
- Page 40 and 41: -""I- *I,".. I Dlrf".,on Co.1flcl.n
- Page 42 and 43: After a variable residence time, th
- Page 44 and 45: Changes in Char Chemistry The infra
- Page 46 and 47: 20. 21. 22. 23. 24. 25. 26. 27. 28.
- Page 48 and 49: 0s-a 00-a OS'S 00-E os-2 00-2 02.1
- Page 50 and 51: COAL PYROLYSIS AT HIGH TEMPERATURES
- Page 52 and 53: actions, decreasing the secondary c
- Page 54 and 55: 01 40 60 TI MEISeC) 80 100 120 140
- Page 56 and 57: Reaction Temperature OC In-situ Ini
- Page 58 and 59: and the gas velocity is often repre
- Page 60 and 61: The mathematical model developed he
- Page 62 and 63: si sio Fraction of solid species i
- Page 64 and 65: Table 2. Differential Equations Mod
- Page 66 and 67: 1 60 I I RUN KE-5 50 T.1121K(1557'F
- Page 68 and 69: to condense excess steam, the press
- Page 70 and 71: conversion-time data.* The integrat
- Page 72 and 73: catalyzed and uncatalyzed runs were
- Page 74 and 75: CATALYTIC EFFECTS OF ALKALI METAL S
- Page 76 and 77: %me thermogravimetric measurements
- Page 78 and 79: than in steam. Figure 9 shows data
- Page 80 and 81: C - C02 REACTION C - H20 REACTION L
- Page 82 and 83: 1. 2. 3. 4. 5. 6. 7. 8. 9. 10. 11.
I<br />
These two equ<strong>at</strong>ions rel<strong>at</strong>e <strong>the</strong> model parameters to <strong>the</strong> moments which can<br />
be calcul<strong>at</strong>ed from experimental d<strong>at</strong>a.<br />
Experi!!iental<br />
WYODAK subbituminous <strong>coal</strong>, particle size 35 x 60, was used in <strong>the</strong><br />
experimental study. The experimental system consisted <strong>of</strong> a pulse reactor,<br />
Figure 1, a flow type BET appar<strong>at</strong>us, Figure 2, and <strong>the</strong> chrom<strong>at</strong>ographic<br />
appar<strong>at</strong>us, Figure 3. This allowed determin<strong>at</strong>ions <strong>of</strong> surface area and<br />
effective diffusivity to be made in conjunction with reaction studies<br />
without removing <strong>the</strong> sample.<br />
Measurements <strong>of</strong> surface area and effective diffusivi ty were made on raw<br />
<strong>coal</strong>s. Surface area measurements were made by adsorbing carbon dioxide<br />
<strong>at</strong> 195 K for 30 minutes. The single point BET method was used for evalu<strong>at</strong>ion<br />
<strong>of</strong> <strong>the</strong> surface area. The raw <strong>coal</strong>s were devol<strong>at</strong>ilized by he<strong>at</strong>ing <strong>at</strong><br />
SoC/min to a temper<strong>at</strong>ure <strong>of</strong> 8OO0C to produce a <strong>coal</strong> char. Changes in surface<br />
area and effective diffusivity were again detprmined. The <strong>coal</strong> char<br />
was <strong>the</strong>n partially reacted <strong>at</strong> a temper<strong>at</strong>ure <strong>of</strong> 800 C by injecting a known<br />
volume <strong>of</strong> carbon dioxide. Changes in surface area and effective diffusivity<br />
were again determined. This procedure was repe<strong>at</strong>ed until <strong>the</strong> conversion<br />
<strong>of</strong> <strong>the</strong> carbon in <strong>the</strong> <strong>coal</strong> approached 1.0.<br />
Results and Discussion<br />
The devol<strong>at</strong>iliz<strong>at</strong>ion caused structural changes which are reflected in an<br />
average weight loss <strong>of</strong> 41% <strong>of</strong> <strong>the</strong> initial weight, a decrease in <strong>the</strong> diffusion<br />
coefficient, and an increase in total surface area. Table 1 gives<br />
<strong>the</strong>se changes for three WYOOAK samples. The increase in surface area represents<br />
<strong>the</strong> opening <strong>of</strong> pores which were not accessible before devol<strong>at</strong>iliz<strong>at</strong>ion.<br />
Walls closing <strong>of</strong>f pores are devol<strong>at</strong>ilized and small pores inaccessible to<br />
<strong>the</strong> initial CO adsorption are enlarged because <strong>of</strong> <strong>the</strong> evolution <strong>of</strong> vol<strong>at</strong>ile<br />
m<strong>at</strong>erial durin5 <strong>the</strong> he<strong>at</strong>ing, This new pore structure has a gre<strong>at</strong>er resistance<br />
to diffusion, seen as a decrease in <strong>the</strong> diffusion coefficient. The<br />
small pores and enlarged pore form a more complex network <strong>of</strong> voids within<br />
<strong>the</strong> particles.<br />
increase in total available surface area and a decrease in <strong>the</strong> diffusion<br />
coef f i ci ent .<br />
The heterogeneous chemical reaction causes continuous changes in <strong>the</strong> pore<br />
structure due to <strong>the</strong> consumption <strong>of</strong> carbon. Pore walls are being gasified<br />
slowly as <strong>the</strong> reaction continues toward completton. The continually<br />
changing internal structure affects <strong>the</strong> diffusion <strong>of</strong> gaseous reactants<br />
and products to and from <strong>the</strong> active carbon sites within <strong>the</strong> particle.<br />
19)<br />
The production <strong>of</strong> char by devol<strong>at</strong>iliz<strong>at</strong>ion causes an<br />
35


