the coking properties of coal at elevated pressures. - Argonne ...
the coking properties of coal at elevated pressures. - Argonne ... the coking properties of coal at elevated pressures. - Argonne ...
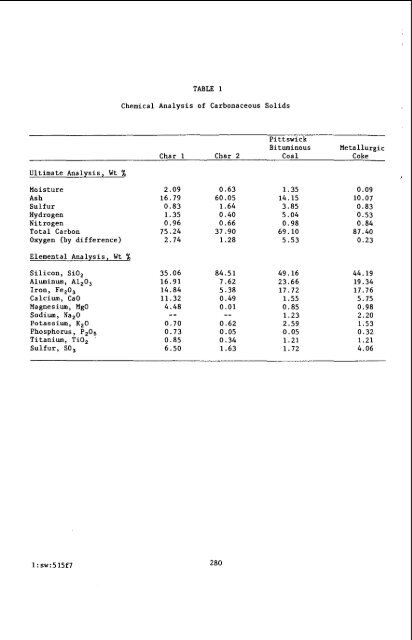
Ultimate Analysis, Wt % TABLE 1 Chemical Analysis of Carbonaceous Solids Pittswick Bituminous Metallurgic Char 1 Char 2 Coal Coke Moisture 2.09 0.63 1.35 Ash 16.79 60.05 14.15 Sulfur 0.83 1.64 3.85 Hydrogen 1.35 0.40 5.04 Nitrogen 0.96 0.66 0.98 Total Carbon 75.24 37.90 69.10 Oxygen (by difference) 2.74 1.28 5.53 Elemental Analysis, Wt % Silicon, SiO, Aluminum, A1,0, Iron, Fe20, Calcium, CaO Magnesium, MgO Sodium, NapO Potassium, K,O Phosphorus, P,OB Titanium, TiO, Sulfur, SO, 1 : sw:515f7 35.06 16.91 14.84 11.32 4.48 -- 0.70 0.73 0.85 6.50 84.51 7.62 5.38 0.49 0.01 280 -- 0.62 0.05 0.34 1.63 49.16 23.66 17.72 1.55 0.85 1.23 2.59 0.05 1.21 1.72 0.09 10.07 0.83 0.53 0.84 87.40 0.23 44.19 19.34 17.76 5.75 0.98 2.20 1.53 0.32 1.21 4.06
1' TABLE 2 Screen Analysis of Sand Size Range, m W t % -0.589.+ 0.419 2.2 -0.419 + 0.249 72.7 -0.249 + 0.179 18.9 -0.179 + 0.150 4.2 -0.150 1.0 Hean Diameter, d = 0.286 mm P TABLE 3 Experimental Results of NO Reduction by Char 1 Run Char sand T "'in Noout 'mf U Ld Lf No. 8 Ut % * -c p p DP. Vlhr m/S "IS n o em. c.1. lllec 1-28-1 12 0.01031 1164 600 965 765 0.85 5.5 10.6 IO 12.065 0.42 0.172 0.837 15.471 5-2.3-2 12 0.01031 1164 650 9h5 615 0.85 5.5 11.2 LO 12.065 0.42 0.631 0.637 28.622 5-28-3 12 0.01031 1164 700 965 360 0.85 5.5 11.8 IO 12.065 0.42 0.373 0.360 61.269 5-28-4 12 0.01031 1164 750 965 125 0.85 5.5 12.4 10 12.065 0.42 0.130 0.128 155.295 5-28-5 12 0.01031 1164 800 965 25 0.85 5.5 13.0 10 12.065 0.42 0.026 0.030 341.263 6-5-1 26 6-5-2 24 6-5-3 26 6-54 24 6-8-1 36 6-8-2 36 6-8-3 36 6-9-1 48 6-9-2 48 0.02062 0.02062 0.02062 0.02062 0,03093 0.03093 0.03093 0.04124 o.o!l124 1164 600 980 1164 650 980 1164 700 980 1164 750 980 1164 600 975 1164 650 975 1164 700 975 1164 6on 985 1164 643 9115 660 390 150 10 580 300 60 475 215 0.85 5.5 10.6 10 12.065 0.42 0.673 0.701 11.842 0.85 5.5 11.2 10 12.065 0.42 0.397 0.409 29.532 0.85 5.5 11.8 IO 12.065 0.42 0.153 0.131 65.716 0.85 5.5 12.4 IO 12.065 0.42 0.010 0.023 199.890 0.85 5.5 10.6 IO 12.065 0.02 0.595 0.588 10.389 0.85 5.5 11.2 10 12.065 0.42 0.308 0.264 25.311 0.85 5.5 11.8 IO 12.065 0.42 0.062 0.055 67.035 0.85 5.5 10.6 IO 12.065 0.42 0.482 0.496 10.969 0.85 5.5 -: -- -- -- 0.218 -- __ 281
- Page 229 and 230: I Table 1 Comparison of Sulfur Capt
- Page 231 and 232: , NITROGEN OXIDE REDUCTION Single-S
- Page 233 and 234: 0 The addition of air at the 96-inc
- Page 235 and 236: m- Y i? 4: BO n 8 c Y l0- Bo- I I I
- Page 237 and 238: E! w 2 z e Y 100 - 3 t 5 80- 0, 40
- Page 239 and 240: 0 f 0.so o'm: 0.300 0.zo - - A 5m 4
- Page 241 and 242: &e- -A \ \ \ : ERCENT OVERBED AIR I
- Page 243 and 244: PARTICLE ENTRAINMENT AND NITRIC OXI
- Page 245 and 246: i 1' 1 ! I. i Chaung (15) showed th
- Page 247 and 248: The maximum height that a large par
- Page 249 and 250: 3.0 Nitric Oxide Reduction in the F
- Page 251 and 252: assumed to be identical to that of
- Page 253 and 254: Nomenclature A *t cD ‘NO $3 _ _ _
- Page 255 and 256: TABLE 2. OPERATING CONDITIONS AND E
- Page 257 and 258: i 1 \ ', References 1. 2. ( 3. 1 4.
- Page 259 and 260: \ ” Y) I 259
- Page 261 and 262: t I 100 - - I I ] , I , I , I 'ii 9
- Page 263 and 264: Feeding of the carbonaceous materia
- Page 265 and 266: ! Table 2 Proximate and ultimate an
- Page 267 and 268: lb, , --pp---p-- 4 p? CHAR 1 Tu-IWO
- Page 269 and 270: I CHAR Y Y /I TIME O i ' ' ' ' 1 '
- Page 271 and 272: could not be assumed constant. Thus
- Page 273 and 274: \ greatly acknowledged. Literature
- Page 275 and 276: constructed and operated to demonst
- Page 277 and 278: The experimental procedure for the
- Page 279: atmospheric pressure fluidized bed
- Page 283 and 284: n RECORDER I Ill I ’ NO. NOX THER
- Page 285 and 286: \ 285 Y 0 I- 5 B 5 3 m "9 E5 3 uz 0
- Page 287 and 288: CHAR1 TOC 0.85 M3/k 600 0 700 V 750
- Page 289 and 290: f Durin all the experimental runs t
- Page 291 and 292: Assuming that large coal particles
- Page 293 and 294: i 7 -_ 0 m\o --n 0 W i 293 a\o 0
- Page 295 and 296: The influence of particle size dist
- Page 297 and 298: all the initial values of x for whi
- Page 299 and 300: \ - + 1) x. = 1 bL/n YO Defining di
- Page 301 and 302: $ m. 1 Results and Discussion Evalu
- Page 303 and 304: kl k2 k' KC KD m m. m P N P R R g t
- Page 305 and 306: UNBURNT FRACTION UNBURNT FRACTION m
Ultim<strong>at</strong>e Analysis, Wt %<br />
TABLE 1<br />
Chemical Analysis <strong>of</strong> Carbonaceous Solids<br />
Pittswick<br />
Bituminous Metallurgic<br />
Char 1 Char 2 Coal Coke<br />
Moisture 2.09 0.63 1.35<br />
Ash 16.79 60.05 14.15<br />
Sulfur 0.83 1.64 3.85<br />
Hydrogen 1.35 0.40 5.04<br />
Nitrogen 0.96 0.66 0.98<br />
Total Carbon 75.24 37.90 69.10<br />
Oxygen (by difference) 2.74 1.28 5.53<br />
Elemental Analysis, Wt %<br />
Silicon, SiO,<br />
Aluminum, A1,0,<br />
Iron, Fe20,<br />
Calcium, CaO<br />
Magnesium, MgO<br />
Sodium, NapO<br />
Potassium, K,O<br />
Phosphorus, P,OB<br />
Titanium, TiO,<br />
Sulfur, SO,<br />
1 : sw:515f7<br />
35.06<br />
16.91<br />
14.84<br />
11.32<br />
4.48<br />
--<br />
0.70<br />
0.73<br />
0.85<br />
6.50<br />
84.51<br />
7.62<br />
5.38<br />
0.49<br />
0.01<br />
280<br />
--<br />
0.62<br />
0.05<br />
0.34<br />
1.63<br />
49.16<br />
23.66<br />
17.72<br />
1.55<br />
0.85<br />
1.23<br />
2.59<br />
0.05<br />
1.21<br />
1.72<br />
0.09<br />
10.07<br />
0.83<br />
0.53<br />
0.84<br />
87.40<br />
0.23<br />
44.19<br />
19.34<br />
17.76<br />
5.75<br />
0.98<br />
2.20<br />
1.53<br />
0.32<br />
1.21<br />
4.06


