liquefaction pathways of bituminous subbituminous coals andtheir
liquefaction pathways of bituminous subbituminous coals andtheir liquefaction pathways of bituminous subbituminous coals andtheir
YI I - 0 0 IO 10 a0 TIME (Hours) 40 80 80 ml. Adsorption of Molybdate from Solution by Wyodak Coal at a pH of 2. 0 Initial solution concentration = 3000 ppm. v Initial solution concentration = 1500 ppm. 0 Initial solution concentration = 600 ppm. A Initial solution concentration = 60 ppm. 0 lo 20 30 40 60 60 TIME (Hours) PIGURg. Adsorption of Molybdate from Solution by Wyodak Coal at a pH of 4. Symbols the same as on Figure 1. 518
- iF m 1.6 1.4 1.2 - - - 1- 0 0.8 - 0 0 - 0 10 20 30 40 so Bo TIME (Hours) m. Adsorption of Molybdate from Solution by Illinois No.6 coal at a p~ of 2. symbols the same as on Figure 1. 0 10 20 so TIME (Hours) 40 60 eo FIGURB.. Adsorption of Molybdate from Solution by IllinOiFJ N0.6 Coal at a pH of 4. Symbols the same as on Figure 1. 519 0
- Page 1 and 2: LIQUEFACTION PATHWAYS OF BITUMINOUS
- Page 3 and 4: the conversion of A+P and O+G with
- Page 5 and 6: Asphaltcncs PrCasphaltenCS Cwr%, da
- Page 7 and 8: NEW DIRECTIONS TO PRECONVERSION PRO
- Page 9 and 10: ecause of incorporation of the coal
- Page 11 and 12: should be considered more. The step
- Page 13 and 14: 17 18 Run no. 0 cys I ToS-CyS TS-To
- Page 15 and 16: INTRODUCTION Effects of Thermal and
- Page 17 and 18: apid decline in modulus. The loss m
- Page 19 and 20: -0.01- . 04 5 -0.03- E 6 -0.0s- c)
- Page 21 and 22: Assessment of Small Particle Iron O
- Page 23 and 24: yields are calculated by subtractin
- Page 25 and 26: conversion is greater than the corr
- Page 27 and 28: Table 3. Effect of Superfine Iron O
- Page 29 and 30: EFFECT OF A CATALYST ON THE DISSOLU
- Page 31 and 32: inherent volatility of Mo(CO), perm
- Page 33 and 34: Analysis of the quantity and compos
- Page 35 and 36: $ EO .- 0 m L 0 c 0 0 > 40 300 350
- Page 37 and 38: 0 0 0 0 0.000 0.005 0.010 0.015 0.0
- Page 39 and 40: of these studies indicate that cont
- Page 41 and 42: Different levels of adsorption occu
- Page 43: Nominal 2 Table 1. Concentration of
- Page 47 and 48: RESULTS AND DISCUSSION Swelling of
- Page 49 and 50: . . % . . 9 'HF 0 0 0 *. . 0 . . 0
- Page 51 and 52: 1.50 KQ 1.00 0.50 I / ' 02 525 I 1
- Page 53 and 54: hydrogen atoms. The hydrogen atoms
- Page 55 and 56: D to generate more D atoms. It is r
- Page 57 and 58: 12. a. Poutsma, M. L.; Dyer, C. W.
- Page 59 and 60: Figure 3. Minimum Steps to Explin D
- Page 61 and 62: Apoaratus and Procedure Microflow R
- Page 63 and 64: Model ComDound Test Figure 5 shows
- Page 65 and 66: Figure 1. High resolution gas chrom
- Page 67 and 68: Figure 5. Product distribution for
- Page 69 and 70: THQ at somewhat higher temperatures
- Page 71 and 72: areas of the particles and the SEM
- Page 73 and 74: Experimental Catalyst Precursors an
- Page 75 and 76: impregnating solvent. Table 3 shows
- Page 77 and 78: of MoCo-TC2 at the level of 0.5 wt%
- Page 79 and 80: Table 4. Effect of Temperature Prog
- Page 81 and 82: In the past, chemical treatments in
- Page 83 and 84: The effect of Corn20 preaatment on
- Page 85 and 86: Reaction Time Figure 1 - Schematic
- Page 87 and 88: DISSOLUTION OF THE ARGONNE PREMIUM
- Page 89 and 90: A much more def~tive trend is seen
- Page 91 and 92: EFFECT OF CHLOROBENZENE TREATMENT O
- Page 93 and 94: same conditions and an extraction t
YI I -<br />
0<br />
0 IO 10 a0<br />
TIME (Hours)<br />
40 80 80<br />
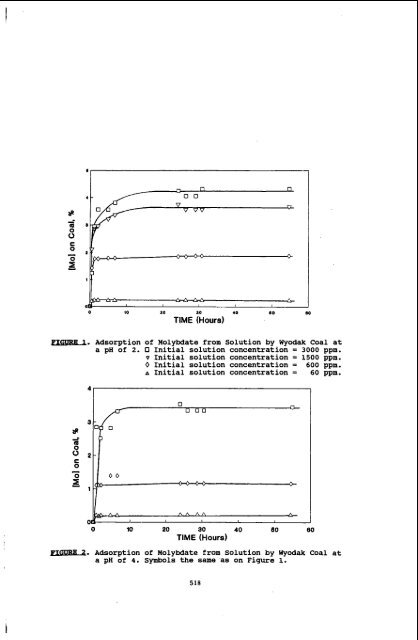
ml. Adsorption <strong>of</strong> Molybdate from Solution by Wyodak Coal at<br />
a pH <strong>of</strong> 2. 0 Initial solution concentration = 3000 ppm.<br />
v Initial solution concentration = 1500 ppm.<br />
0 Initial solution concentration = 600 ppm.<br />
A Initial solution concentration = 60 ppm.<br />
0 lo 20 30 40 60 60<br />
TIME (Hours)<br />
PIGURg. Adsorption <strong>of</strong> Molybdate from Solution by Wyodak Coal at<br />
a pH <strong>of</strong> 4. Symbols the same as on Figure 1.<br />
518


