THE GASIFICATION OF VARIOUS COALS IN MOLTEN SALTS
THE GASIFICATION OF VARIOUS COALS IN MOLTEN SALTS THE GASIFICATION OF VARIOUS COALS IN MOLTEN SALTS
THE GASIFICATION OF VARIOUS COALS IN MOLTEN SALTS S. J. Yosim and K. M. Barclay Energy Systems Group Rockwell International 8900 De Soto Avenue Canoga Park, California 91304 I. INTRODUCTION The utilization of the U.S. coal reserves in a manner which does not add to the existing pollution problem is of utmost importance in the interest of conservation of more valuable natural resources in the national economy. Gasification of coal and generation of clean fuel gas offers one of the most promising approaches to the utilization of coal. It has been assigned a high priority in the U.S. Energy Development Program. Several of the coal gasification processes presently under development are now at the initial pilot plant operation stage. One of these processes is Rockwell International Molten Salt Coal Gasification Process (Rockgaa Process).f9t2) In this process, the coal is gasified at a temperature of about 1800 F and at pres- sures up to 30 atm by reaction with air in a highly turbulent mixture of molten sodium carbonate containing sodium sulfide, ash, and unreacted carbonaceous material. The sulfur and ash of the coal are retained in the melt, a small stream of which is continuously circulated through a process system for regeneration of the sodium car- bonate, removal of the ash, and recovery of elemental sulfur. A molten salt coal gasification‘process development unit (PDU)(1’2) capable of converting 1 ton of coal per hour into low-Btu fuel gas at pressures up to 20 atm is currently undergoing testing under contract to the Department of Energy. Preliminary to the PDU, a considerable amount of laboratory testing took place. These tests were conducted in a bench-scale, 6-in.-diameter gasifier in which coals of different rank were continuously gasified in the melt. The tests resulted in a better understanding of the gasification process. The purpose of this paper is to describe these laboratory tests and to discuss some of the chemistry taking place in the gasifier. Emphasis is placed on the effect of coal rank on the chemistry. A. COALS GASIFIED 11. EXPERIMENTAL SECTION The coals gasified were an anthracite, a medium-volatile bituminous coal, a high-volatile bituminous coal, and lignite. The coals are listed in order of decreasing rank. The first three coals were supplied by the Electric Power Development Corporation of Japan, and the lignite was supplied by Phillips Petroleum Company. The proximate and ultimate analyses of the coals are listed in Table 1. e. APPARATUS A schematic of the bench-scale molten salt gasifier is shown in Figure 1. Approximately 12 lb of molten salt were contained in a 6-in.-ID and 36-in. high alumina tube placed in a Type 321 stainless steel retainer vessel. This stainless steel vessel, in turn, was contained in an 8-in.-ID four-heating-zone furnace. The four heating zones were each 8 in. in height, and the temperature of each zone was controlled by a silicon-controlled rectifier. Furnace and reactor temperatures were recorded by a 12-point Barber-Colman chart recorder. 1
- Page 2 and 3: Proximate Analysis Moi s ture Volat
- Page 4 and 5: As expected, the heating value of t
- Page 6 and 7: 1/2 in. STAINLESS STEEL INJECTOR TU
- Page 8 and 9: 2. Catalysis by generating a dipole
- Page 10 and 11: When char reacts with C02 c + co2 +
- Page 12 and 13: c + co2 -f 2CO GI =" 40 kcal/mole a
- Page 14 and 15: eactor were used to infer on the me
- Page 16 and 17: m U C w 0 16
- Page 18 and 19: 0.2 gm. DEMINERALIZED CHAR 8 20% K2
- Page 20 and 21: level of transitional porosity (est
- Page 22 and 23: Table 1 RELATIVE REACTIVITIES OF CH
- Page 24 and 25: NOMENCLATURE D - D k 2 K2 sco* T V
- Page 26 and 27: 0. Curve €9401 1 4 0.7 0 0.6 - 0.
- Page 28 and 29: Curve 717536-A I I 0. 1 0.2 Mean Po
- Page 30 and 31: TABLE 1. PROXIMATE AND ULTIMATE ANA
- Page 32: 32 4 4
- Page 36 and 37: 2. For a given aromatic compound an
- Page 38 and 39: MODEL STRUCTURE FOR A BITUMINOUS CO
- Page 40 and 41: The value of the carbon aromaticity
- Page 42 and 43: The expected reactivity of the mode
- Page 44 and 45: HO CHZ \ CH -CHZ / CHZ CH-CH \ / \
- Page 46 and 47: INTRODUCTION THE APPLICATION OF FOU
- Page 48 and 49: tinely and quickly by the FTIR mini
- Page 50 and 51: the spectrum of the unoxidized samp
<strong>THE</strong> <strong>GASIFICATION</strong> <strong>OF</strong> <strong>VARIOUS</strong> <strong>COALS</strong> <strong>IN</strong> <strong>MOLTEN</strong> <strong>SALTS</strong><br />
S. J. Yosim and K. M. Barclay<br />
Energy Systems Group<br />
Rockwell International<br />
8900 De Soto Avenue<br />
Canoga Park, California 91304<br />
I. <strong>IN</strong>TRODUCTION<br />
The utilization of the U.S. coal reserves in a manner which does not add to the<br />
existing pollution problem is of utmost importance in the interest of conservation<br />
of more valuable natural resources in the national economy. Gasification of coal and<br />
generation of clean fuel gas offers one of the most promising approaches to the utilization<br />
of coal. It has been assigned a high priority in the U.S. Energy Development<br />
Program. Several of the coal gasification processes presently under development<br />
are now at the initial pilot plant operation stage.<br />
One of these processes is<br />
Rockwell International Molten Salt Coal Gasification Process (Rockgaa Process).f9t2)<br />
In this process, the coal is gasified at a temperature of about 1800 F and at pres-<br />
sures up to 30 atm by reaction with air in a highly turbulent mixture of molten<br />
sodium carbonate containing sodium sulfide, ash, and unreacted carbonaceous material.<br />
The sulfur and ash of the coal are retained in the melt, a small stream of which is<br />
continuously circulated through a process system for regeneration of the sodium car-<br />
bonate, removal of the ash, and recovery of elemental sulfur.<br />
A molten salt coal gasification‘process development unit (PDU)(1’2) capable of<br />
converting 1 ton of coal per hour into low-Btu fuel gas at pressures up to 20 atm is<br />
currently undergoing testing under contract to the Department of Energy. Preliminary<br />
to the PDU, a considerable amount of laboratory testing took place. These tests were<br />
conducted in a bench-scale, 6-in.-diameter gasifier in which coals of different rank<br />
were continuously gasified in the melt. The tests resulted in a better understanding<br />
of the gasification process. The purpose of this paper is to describe these laboratory<br />
tests and to discuss some of the chemistry taking place in the gasifier. Emphasis<br />
is placed on the effect of coal rank on the chemistry.<br />
A. <strong>COALS</strong> GASIFIED<br />
11. EXPERIMENTAL SECTION<br />
The coals gasified were an anthracite, a medium-volatile bituminous coal, a<br />
high-volatile bituminous coal, and lignite. The coals are listed in order of decreasing<br />
rank. The first three coals were supplied by the Electric Power Development<br />
Corporation of Japan, and the lignite was supplied by Phillips Petroleum Company.<br />
The proximate and ultimate analyses of the coals are listed in Table 1.<br />
e. APPARATUS<br />
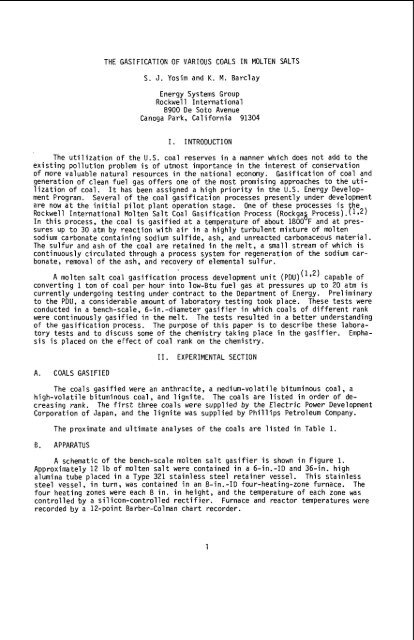
A schematic of the bench-scale molten salt gasifier is shown in Figure 1.<br />
Approximately 12 lb of molten salt were contained in a 6-in.-ID and 36-in. high<br />
alumina tube placed in a Type 321 stainless steel retainer vessel. This stainless<br />
steel vessel, in turn, was contained in an 8-in.-ID four-heating-zone furnace. The<br />
four heating zones were each 8 in. in height, and the temperature of each zone was<br />
controlled by a silicon-controlled rectifier. Furnace and reactor temperatures were<br />
recorded by a 12-point Barber-Colman chart recorder.<br />
1
Proximate Analysis<br />
Moi s ture<br />
Volatile Matter<br />
Fixed Carbon<br />
Ash<br />
U1 timate Analysis<br />
Moisture<br />
Carbon<br />
HyJ rogen<br />
Nitrogen<br />
Oxygen*<br />
Sulfur<br />
Ash<br />
TABLE 1<br />
COMPOSITION <strong>OF</strong> <strong>COALS</strong> (WT %)<br />
Anthracite -<br />
2.78<br />
4.92<br />
87.51<br />
4.79<br />
2.78<br />
85.27<br />
3.21<br />
0.81<br />
1.97<br />
0.67<br />
4.79<br />
Medium-<br />
Vol ati 1 e<br />
Bituminous<br />
2.26<br />
30.36<br />
56.53<br />
10.85<br />
2.26<br />
71.85<br />
4.60<br />
0.78<br />
8.59<br />
1.07<br />
10.85<br />
High-<br />
Volatile<br />
Bi tuminous<br />
0.85<br />
38.71<br />
37.69<br />
22.75<br />
0.65<br />
52.26<br />
4.95<br />
0.82<br />
5.60<br />
2.77<br />
22.75<br />
Lignite<br />
32.46<br />
28.70<br />
25.50<br />
13.34<br />
32.46<br />
35.34<br />
2.52<br />
0.96<br />
14.85<br />
0.53<br />
13.34<br />
The coal ground in a hand-turned burr mill was metered into the l/Z-in.-ID<br />
central tube of the injector by a screw feeder. Rotation of the screw feeder was<br />
provided by a 0- to 400-rpm Eberback Corporation Con-Torque stirrer motor. The coal<br />
was mixed in the injector with the air being used for gasification, and this coalair<br />
mixture passed downward through the center tube of the injector and emerged into<br />
the l-l/E-in.-ID alumina feed tube. This alumina feed tube was adjusted so that its<br />
tip was -1/2 in. above the bottom of the 6-in.-diameter alumina reactor tube. Thus,<br />
the coal-air mixture was forced to pass downward through the feed tube, outward at<br />
its bottom end, and then upward through 6 in. of salt in the annulus between the<br />
1-1/2-in. and the 6-in. alumina tubes.<br />
111. RESULTS<br />
A. PRODUCT GAS COMPOSITION FROM <strong>GASIFICATION</strong> WITH AIR<br />
The test conditions for the gasification tests are listed in Table 2 which gives<br />
the melt temperature, the air and coal feed rates, the air/coal ratio, and the percent<br />
theoretical air. The last column shows the air feed as a percentage of the<br />
amount of air which is required to oxidize the coal completely to C02 and H20. The<br />
air/coal ratios and thus the percent theoretical air were chosen to give a good<br />
quality product gas from a heating value point of view. The steady-state composition<br />
and the higher heating value (HHV)* of the product gas obtained from the four<br />
coals are shown in Table 3.<br />
In each case, a good quality (2120 Btu/scf) low-Btu pro-<br />
duct gas was obtained. The product gas compositions were calculated on the basis of<br />
the carbon, hydrogen, and oxygen mass balance and assuming thermodynamic equilibrium<br />
for the water-gas shift reaction<br />
CO + H20 = C02 + HE 1)<br />
To perform the mass balance, the coal analytical data shown in Table 1 were expressed<br />
in terms Of an empirical formula, CcHhOo. The results are shown in Table 3. The<br />
agreement between the observed and calculated values is, in general, quite good.<br />
*The higher heating values include the heat of condensation of steam to liquid water.<br />
2
-0 w -<br />
W W E<br />
LLu+<br />
m u<br />
LCT v)<br />
.r - <<br />
-<br />
- LLL<br />
aJ<br />
c, a<br />
c, m-<br />
Wak3<br />
E n-<br />
5 I-<br />
. . . .<br />
. h L O L n<br />
~ m m o<br />
4 d N L O<br />
NNLOA<br />
1 1 1 1<br />
d N N b<br />
z<br />
t;<br />
v)<br />
0 II<br />
E<br />
0 V<br />
0 w<br />
I-<br />
m-I a<br />
L d 3<br />
Jm-l V<br />
< I-v a<br />
3<br />
n z<br />
4:<br />
0 W<br />
5<br />
CT LI1<br />
v, M<br />
0<br />
U<br />
0<br />
* *<br />
. . . . . . .<br />
d O d O d L O N<br />
m r . o o o m<br />
m d<br />
u<br />
* I r :<br />
* *<br />
m o d o w b m<br />
m m m o m r r ) o<br />
o;o;dd'c;ad 0;<br />
N<br />
L O d N
As expected, the heating value of the product gas increases as the percent theoretical<br />
air decreases. This can be seen in Table 3, where in the case of anthracite<br />
and medium volatile bituminous coals, a product gas resulted with an HHV of about<br />
130 Btu/scf at about 45% theoretical air, and the high-volatile bituminous and lignite<br />
coals resulted in a product gas with an HHV of about 150 Btu/scf at about 32%<br />
theoretical air. However, these are practical lower limits as to the percent theoretical<br />
air which should be used. If the percent theoretical air is too low, there<br />
will not be sufficient oxygen to gasify all the carbon and the carbon content of the<br />
melt will continue to increase. This is most pronounced with high rank coals such as<br />
anthracite. In addition, if the percent theoretical air is too low, there will be<br />
insufficient heat released to the melt to sustain the operating temperature. This is<br />
most pronounced in the low rank coals such as lignite which contain a considerable<br />
amount of combined oxygen and moisture. Thus, there is a practical limit to the<br />
heating value that can be obtained for the product gas.<br />
B. A MECHANISM <strong>OF</strong> COAL <strong>GASIFICATION</strong><br />
A certain amount of time was required for the heating value of the gas to exceed<br />
100 Btu/scf; this time was different for coals of different rank. A plot of product<br />
gas heating value vs cumulative run time is shown for the four coals in Figure 2. It<br />
can be seen that the time for the product gas to reach a heating value >lo0 Btu/scf<br />
decreased with decreasing coal rank. In the case of the anthracite and the mediumvolatile<br />
bituminous coal, the times were about 2 h and 1/2 h, respectively. The<br />
product gases from the lignite and the high-volatile bituminous coals both had initial<br />
heating values in excess of 100 Btu/scf with the lignite initially producing<br />
somewhat richer gas than the high-volatile bituminous coal. During the early stages<br />
of an experiment when the product gas heating value was increasing, it was found that<br />
the C02 concentration was initially very high and continued to decrease while the CO<br />
concentration was very low and continued to increase. It was also found that the<br />
carbon content of the melt increased with time. This effect is shown for the case of<br />
anthracite in Figure 3. This suggests that conversion of carbon to CO2 is the primary<br />
step; reduction of C02 to CO by carbon in the melt is a secondary step.<br />
Primary Step c + 02--co2 2)<br />
Secondary Step C02 + C-2CO 3)<br />
The steady-state carbon contents of the melt are shown for the four coals in<br />
Table 4. The steady-state carbon content for lignite is only 0.3 wt% in contrast to<br />
12% for anthracite. Thus, the lower the rank of the coal being gasified, the more<br />
reactive the carbon and the less free carbon in the bed necessary to promote CO pro-<br />
duction; hence, the time required to achieve steady state is shorter with lower rank<br />
coal.<br />
TABLE 4<br />
STEADY-STATE CARBON CONTENT <strong>OF</strong> MELT<br />
Steady-State Carbon<br />
Rank Content of Melt<br />
Coal Number* (wt %)<br />
Lignite 4-1 0.3<br />
High-Volatile Bituminous Coal 2-5 2.4<br />
Medium-Volatile Bituminous Coal 2- 2 3.6<br />
Anthracite 1-2 12.0<br />
*The rank number shows the ASTM class number followed by the group number.<br />
In Class I, 1-1 is higher rank than 1-2, etc.<br />
4
REFERENCES<br />
1. A. L. Kohl, 1.1. H. Slater, arid K. J. Xiller, "Siatus of the Moiten Salt Coal<br />
Gasification Process," Proceedings of the Tenth Synthetic Pipeline Gas Sym-<br />
posium, Chicago, Illinois, October 30, 1978<br />
2. A. L. Kohl, R. B. Harty, J. G. Johanson, and L. M. Naphthali, "Molten Salt Coal<br />
Gasification Process," Chem Eng Prog. 7.1 73 1578<br />
737-H. 66Isjd 5
1/2 in. STA<strong>IN</strong>LESS STEEL<br />
<strong>IN</strong>JECTOR TUBE<br />
of I t I ,<br />
- ,COAL<br />
AIR <strong>IN</strong> m- VIBRAT9R<br />
SEALED<br />
n<br />
' HOPPER<br />
I I I I I I I I<br />
0 20 40 60 BO 100 :20<br />
TIME AFTER START <strong>OF</strong> TEST (minl<br />
78JUE82-5C<br />
Figure 2. Change of Heating<br />
Value of Product Gas With<br />
Time for Different Coals<br />
SCREW FEEDER<br />
STA<strong>IN</strong>LESS STEEL<br />
RETA<strong>IN</strong>ER VESSEL<br />
l/Z-in. ID ALUM<strong>IN</strong>A<br />
6-in. ID ALUM<strong>IN</strong>A TUBE<br />
6-113. DEPTH <strong>OF</strong><br />
<strong>MOLTEN</strong> SALT<br />
6<br />
424001 01 6 F<br />
Figure 1. Bench-Scale<br />
Molten Salt<br />
Gasi f ier<br />
321 I I I I I , I , , , , , 16<br />
0 2 4 6 8 1 0 1 2<br />
TIME (hi<br />
7@-JU6-82.128<br />
Figure 3. Effect of Carbon<br />
Content of Melt on CO<br />
and C02 Concentration<br />
in Gas
CATALYTIC COAL <strong>GASIFICATION</strong>-PART I: MECHANISM <strong>OF</strong><br />
<strong>THE</strong> REACTION <strong>OF</strong> C02 WITH CHAR<br />
BY<br />
AMIR ATTAR AND DANIEL C. BAKER<br />
Department of Chemical Engineering<br />
University of Houston<br />
Houston, Texas 77004<br />
December 1979<br />
Catalytic coal gasification (CCG) can provide a competitive source of gas<br />
for domestic and industrial uses, consequently, CCG has been the subject of<br />
numerous studies. However, the mechanism of CCG, with catalysts like<br />
potassium carbonate is not clear, since no simple mechanism is known by<br />
which a solid can catalyze the rate of reaction of another solid.<br />
'Taylor and Neville (1921) reviewed the older literature on CCG and<br />
presented some rate data. More recently, Johnson (1976) and Cusumano g<br />
al. (1978) reviewed some of the modern literature on CCG. The thermodynamics<br />
and kinetics of gasification reactions were reviewed by von<br />
Fredersdorff and Elliot (1963).<br />
Haynes g 4. (1974) screened various materials as catalysts for coal<br />
gasification. They confirmed that alkali carbonates, like K CO are very<br />
effective catalysts for coal gasification. Wilson g 4. (1974j e2amined the<br />
effect of mixing nickel with alkali carbonates on the rate of gasification.<br />
They too found that alkali carbonates enhance the rate of gasification. Wilson<br />
et d. (1974) found that nickel that was added to the char, enhanced prehominantly<br />
the methanation reaction of the gasification products, CO and H<br />
Chauhan et al. (1977) examined the effect of incorporation of calcium aid<br />
sodium on-therate of coal gasification. They also examined the effect of the<br />
particle size and the impregnation period of the coal on its rate of<br />
gasification. They found that small particles are consumed at faster rates<br />
than large particles and that the rate of gasification levels off after a given<br />
fraction of the coal has been gasified. Wilks g 4. (1975) compared the time<br />
needed to gasify 90% of one char and two coals using various catalysts. They<br />
observed that impregnation of the coal with the catalyst is much more<br />
effective than adding the catalyst to the coal. The methane yield was the<br />
same whether a catalyst was added t.o the coal or not. Addition of 30% CO to<br />
steam suppressed the rate of gasificat.ion. A major study of various<br />
gasification catalysts and the rate of gasification has been conducted by<br />
Exxon Research and Engineering. Recently Nahas and Gallagher (1978)<br />
published data on the rate of CCG using K CO and Vadovic and Eakman<br />
(1978) published a model for the rate of CC6. %omits _c_t. 4. (1977) added<br />
Jive minerals 1.0 coal and examined t.hcir effect on the rate of ynsificnl.ion.<br />
'I'hc: resiilt.s of '1'omit.a $1: +I. (1.977) confirmed that. all common minerals<br />
enhiince 1.0 ii limil.cd cxtent I.he rate of c m I gasiliciit.ion.<br />
Since no simple mchanism is known by which one can explain the<br />
catalytic effect of one solid on the rate of reaction of another solid with a<br />
gas, we attempted to examine the mechanisms and rates of catalytic char<br />
gasification with different gases. Five possible rate enhancement modes were<br />
considered for the catalytic' system char-K C03: ,<br />
1. Catalysis by the chemical in?eraction of K+COd with oxygen<br />
functional groups in the char, and generation o m re active sites.<br />
7<br />
.
2. Catalysis by generating a dipole due to electrical charges on the<br />
surface of the K C03.<br />
3. Catalysis by thc? chemical interaction of K2C03 with the gases, to<br />
yield more reactive gaseous species.<br />
4. Catalysis by interference of the K CO with the temperature field<br />
5.<br />
associated with the reacting char pagtica.<br />
Catalysis by interference of the K2C03 with the rate of adsorption<br />
of gases onto the char.<br />
Mechanisms (1) and (3) attribute the catalytic effect to changes in the<br />
chemistry of the reaction, while mechanisms (2), (4). and (5) suggest<br />
physical effects as an explanation to the catalytic activity of K CO . Since<br />
K CO enhances the rate of reactions of char with chemically differeat gases,<br />
e2g. $0 H 0 and H one may expect the mechanisms of the catalysis to be<br />
insensiti6; tg the nagre of the gas. This observation tends to support<br />
catalytic mechanisms which rely more on changes in the physics of the<br />
reaction system. However, as will be demonstrated, the most likely catalytic<br />
effect relies on a synergist interaction between the chemistry and the physics<br />
of the catalytic system K CO -char.<br />
The main reactions &hic% are associated with char gasification are:<br />
+<br />
C + 2112 CHq slow below about 650°C<br />
(1)<br />
C + H20 2 CO + If2 fast above about 5OOOC<br />
C +C02 2 2CO fast above about 5OOOC<br />
Two additional reactions which take place in a gasifier are the shift reaction:<br />
CO + H20 2 C02 + H2<br />
and the methanation of carbon monoxide:<br />
CO + 3112 -f CM4 + H20<br />
Figure 1 shows the Gibbs free energy (GFE), of the reactions vs. the<br />
temperature. The carbon used was graphite. Since the equilibrium constant,<br />
K, is related to the GFE by:<br />
AGO = -RTflnk (6)<br />
it is obvious that gasification can proceed to CH4 according to reaction 1 only<br />
at temperat.ures below about 838°K or 565OC. Reactions (2) and (3) can<br />
gasily graphite only at temperatures above 926'K (653OC) and 947OK (674OC)<br />
respectively. None of these three chemical reactions can be used to gasify<br />
graphik t.o any iIpprcciiihlc cxtent in t.hc t.crnpct~~t.urc rangc 565-653'(:! Wile<br />
lIi(. i'iiI(\ oI' c.hai. qrisil.iciil,ion is cxl)(~:l(~l Io tw (lirI'(~rcnl. I h;in t.litil, of
1. R react.or<br />
2. A gas chromatograph for gas analysis<br />
3. A microprocessor-controlled pulse injector<br />
4. A temperature monitor and programmer<br />
5. A recorder and an interator.<br />
TWO types of reactors were used:<br />
A. A microreactor with an optic fiber in it, which allowed examination<br />
of light emission from the surface of the sample (Figure 3).<br />
B. A fixed-bed reactor, packed with char or treated char.<br />
The system allows us to conduct isot.hermal and temperature-programmed<br />
tests, in addition to runs at different pressures. The operational range of<br />
temperature was 25-900°C and of pressures 0.1-0.5 Mp . The Tystem alloys<br />
the injection of pulses of gas of variable sizes between 8.517 cm and 10 cm .<br />
?'he range of temperature programming is O-2O0C/min. More detailed<br />
description of the system was published by Attar and Dupuis (1979).<br />
During each run, a continuous stream of an inert gas was flowing<br />
t.hrough the reactor; as appropriate, a pulse of the reactive gas was injected<br />
in t.o the reactor and gaseous products were obtained. 'The concentrations of<br />
CO, C02, H2, H 0, and CH were det.ermined using a thermal conductivity<br />
detector and a r$'icroprocesso%-controlled integrator. Carbon monoxide and<br />
carbon dioxide wehe separated on a 200 cm x 0.3 cm column packed with 60-80<br />
mesh Chromosorb 105 at 65OC and with a nominal flowrate of 25 ml/min<br />
helium as a carrier gas. Methane and hydrogen were separated on a 200 cm<br />
x 0.3 cm column packed with 60-80 mesh molecular sieves 5 A at 8OoC and<br />
with a nominal flowrate of 25 ml/min nitrogen as carrier.<br />
R fixed sample of solid was placed in the reactor into which two thermo-<br />
couples and an optic fiber were inserted. The radiation intensity coming from<br />
the reactor through the optic fiber was determined using a photomult.iplier<br />
and an amplifier; The reactor internal temperature and a signal<br />
corresponding to the radiation int.ensity in the wavelength range. of 200-750<br />
nm were recorded vs. time. The photomultiplier produced a monotonically<br />
increasing signal relative to the radiation intensity which impinged on the<br />
opt.ic fiber.<br />
The fixed bed reactor consisted of 8 mm OD SS 316 tube packed with a<br />
known quantity of sample with a known particle size. Typically 30 cm length<br />
of tube were adequate.<br />
Two types of analysis were done on the product.s of each pulse of<br />
reactive gas: analysis of the distribution of products by first separating<br />
them on a GC column, and analysis of the shape of the pulse of products as<br />
determined using a TC detector at the end of the Jixed bed reactor.<br />
The char was prepared from the 1.4 gm/cm float fraction of Kentucky<br />
#9 coal. The coal was pyrolized at 806OC for 10 sec. 'I'hc char was<br />
imprcgnatrd wit.h solutions of Lhc various catalysts and dried in vacuum a1<br />
70°C: for 12 hours. IJnless stated otherwise, the char particles used were<br />
smallcr than 44 microns.<br />
"Demineralization" of the char was done in a mixture of 2 vol. of con-<br />
centrated HCI and 3 vol. water for 30 min at 4OOC.<br />
Silylation of the char was done by a 3:3:6 mixture of hexamethyl-<br />
disilazane: trimethyl-chloro-silane in dry pyridine at 4OoC for 30 min 10 ml<br />
of solution were used lor each 5 gm char. The excess reagent was washed<br />
successively with pyridine and dry methanol and dried in vacuum oven for 12<br />
hrs at 70OC.<br />
9
When char reacts with C02<br />
c + co2 + 2co (3)<br />
two molecules of CO are obtained for each molecule of CO which reacts.<br />
Therefore, the reliability of the experimental measurement car? be checked by<br />
the closure of the material balance on the oxygen. Figure 4 shows the<br />
combined measured amounts of CO and CO for pulses of fixed size which<br />
were injected at different reactor temperakres. The data show that the<br />
precision is excellent both in the case of graphite and char. Theldimension-<br />
less standard deviations on the closure of the material balance on the oxygen<br />
are 1.1 and 2.6% respectively for the temperature range of 200-700OC. In<br />
this range of temperatures the rates of CO to CO varied over several orders<br />
of magnitude. Larger error was obtained &en slow desorption occurred, due<br />
to inconsistencies in the integration procedure of the GC peaks. However, in<br />
general, it was possible to close material balance on each pulse with 5% or<br />
better.<br />
Preliminary Results and Discussion<br />
An attempt was made to screen the various possible mechanisms relative<br />
to their influence on the rate of the gasification. The results of experiments<br />
that were conducted in order to prove or disprove each mechanism are<br />
presented and discussed individually.<br />
Mechanism 1. Catalysis by increased site activity.<br />
Although char is predominantly carbon, it has some oxygen and<br />
hydrogen. Part of the oxygen is present as adsorbed 0 , CO and CO,<br />
however it is believed that some is bound as surface -OH ani -COJH groups.<br />
Impregnation of char with K CO using an aqueous solution produces much<br />
more ac+tive char than just adtin2 K C03 (Wilks et &. 1975). This suggested<br />
that K may replace the H on ?he surface oxygen functions and thus<br />
produces more active surface dipole charges which adsorb gases like C02<br />
more actively.<br />
Test of Mechanism 1.<br />
Many compounds are known which react selectively with oxygen<br />
functional groups. For example, a mixture of trimethyl-chloro-silane (TMCS)<br />
and hcxamethyldisilazane (HMDS) reactions with 011 groups as follows<br />
(I'r.icvlman rl ai. (l!lfil)):<br />
such a jeaction blocks the oxygen site and makes it unavailable for exchange<br />
with K . Alkaline hydrolysis of the silicone compound yields inorganic<br />
silicates with OH groups NOT attached to the carbon.<br />
10
ROSi<br />
(CH3)3 + 2H20 'oa-l + ROSi * O(0H) + 3CH4 (schematic) (8)<br />
Samples of char were silylated according to reaction (7) and then<br />
impregnated with K CO . The rate of gasification with C02 of the silylated<br />
samples was slight$ smhler than the rate of gasification of the no?-silylated<br />
samples. Therefore, it was concluded that chemical interaction of K with the<br />
oxygen functions is not the dominant catalytic mechanism.<br />
Mechanism 2. Catalysis by solid-solid polarization.<br />
Potassium carbonate, like many other salts, has negative surface<br />
charges. Since char is a good conductor, an electric dipole is created when<br />
K CO touches char. It has been presumed that more active sites of high<br />
ac%ivi?y may be genreated by such a contact.<br />
Test of Mechanism 2.<br />
If the catalytic activity of K CO was due to the dipolarization, one<br />
would expect every material with nggadve surface charges to have a similar<br />
catalytic effect to K CO . Since this is not observed experimentally it must<br />
be concluded that $olia-solid dipolarization is not the dominant catalytic<br />
mechanism.<br />
Mechanism 3. Catalysis by interaction between the K2Cg3<br />
and the gas which forms more reactive species.<br />
It has been postulated that K CO may interact with the gaseous<br />
molecules to form more reactive ones, Aicd subsequently react with the char.<br />
Test of Mechanism 3.<br />
Potassium carbonate was found to catalyze the rate of reaction of char<br />
with many chemically and physically different gases. No products of binary<br />
interactions of activated species were found and it seems highly unplausible<br />
that the same solid will catalyze the formation of activated species from many<br />
different gases. Therefore, mechanism three has to be ruled out also.<br />
Additional data on this aspect were discussed by Thomas (1965).<br />
MeChaPkm-!. r,atalY~~gb~.thrr.in_tera cAiE!ofK.p3<br />
wj!h- I.hc temper-lure ficld.<br />
In ordinary gasification reactors the "reactor temperature" is measured<br />
and it is supposed that this temperature represents the reaction temperature.<br />
A catalytic effect is noted when higher rates of gasification of the solid are<br />
observed at the same MEASURED temperature. For the endothermic<br />
gasification reactions<br />
11
c + co2 -f 2CO GI =" 40 kcal/mole<br />
and C + H20 + CO + H2 AH z 32 kcal/mole<br />
heat has to be supplied to the char particle in order to maintain its<br />
gasification. If the rate of gasification is limited by the rate of heat<br />
transport, the temperature of the char, T , will be lower than the gas<br />
temperature, 'r or possibly the measure8 temperature, T If K2C0<br />
impregnation edhances the rate of heat transport to the &'ar, e.g. b$<br />
absorbing more heat as radiation, one may conceive that conditions can exist,<br />
for which:<br />
'r < T~ < T~ (9)<br />
P<br />
The temperature of the char particles with catalyst, T , may effectively be<br />
larger than the temperature of the char with no catgyst, AT <strong>THE</strong> SAME<br />
MEASURED TEMPERATURE. This phenomenon will be recognized as<br />
"cat.alysis" since the rate of gasification is an increasing function of the<br />
temperature. The ratio of the rate of reaction of a particle with catalyst to<br />
that without one, r, will be approximately<br />
E l l<br />
r 2 exp - -- (- - -) > 1 (11)<br />
R Tc T<br />
P<br />
Text of Mechanism 4.<br />
Three tests were done to examine this mechanism:<br />
A. The total radiation intensity in the reactor was measured using an<br />
optic fiber which was inserted into the char.<br />
B. Pulses of CO were injected into the reactor and the concentrations<br />
of CO and 60 were determined in the products. The approach<br />
functiah, Q , which measures how close the concentration of the<br />
gases appaoach equilibrium was plotted vs. the measured<br />
temperature,<br />
n<br />
$l = YL<br />
a co '"c02<br />
C. Calculations were made to estimate the possible effect of the rate of<br />
heat transport by radiation on the particle tempeature.<br />
I'iqurc 5 shows I.he radiation cniit.t.er1 rrom chars I.reaI.ed by various<br />
rciiqvnls VS. Lht: rnc:iisuretl I.cmper;iI.ure. 'I'he data shows that. ijl. the S;~IIIC<br />
meilsurcd lempcraturc samples of char iiiiprcgriated wiLh more active calalysts<br />
emit less radiation than samples of char treated with less reactive catalysts.<br />
Based on this observation, it is tempting to assume that the effect of the<br />
K C03 is to enhance the rate of absorption of energy as radiarion.<br />
C&~sequently, one would assume that the temperature of the K CO -treated<br />
char is larger than the temperature of the untreated char, gt &he same<br />
measured Wmperature. Since the reaction with C02 is endothermic, one must<br />
maintain that T < TC < Tm.<br />
12
3<br />
Figure 6 shows the logarithm of the approach plotted vs. 10 /T for<br />
graphite, untreated char and treated chars. The data show that larger<br />
approach is observed in the case of K2C03-treated char than that which<br />
corresponds t.o graphite char, and to chars treated with Ca(OHI2 and<br />
Na CO , all at the same reactor temperature.<br />
dlermodynamics limits the value of the approach which can be obtained<br />
to the equilibrium value AT <strong>THE</strong> SAME TEMPERATURE. To explain the data,<br />
one must assume that either the char temperature is larger than the measured<br />
temperature, or that char has much larger activity than graphite and that<br />
equilibrium values derived based on graphite can not be applied to char.<br />
The char temperature can not be larger than the gas temperature because the<br />
gasification reaction is endothermic.<br />
TWO questions are addressed:<br />
A. Under which circumstances the rate of heat transport may limit the<br />
rate of gasification by the endothermic reactions (2) and (3), and<br />
B. Can the effect of heat transport by radiation be of sufficient<br />
magnit.ude to influence the t.emperature of the particle?<br />
The answer to both problems is obtained using a simple steady-state energy<br />
balance on a coal particle.<br />
Rate of heat transport<br />
by conduction +<br />
convection<br />
+<br />
Rate of heat transport<br />
by radiation<br />
= Rate of absorption of heat<br />
by the reaction<br />
The complete mathemat.ica1 analysis has been submitted for publication, the<br />
antilysis shows that lor particles of about 100 p an increase in the rate of<br />
gasification by a factor of 1000-3000 will result in the rate of heat transfer<br />
limiting the rate of gasification. Heat transfer by radiation contributes 1-1.0%<br />
of the convection term near 700OC.<br />
_-_ 'l'esl of MechaniCmL.<br />
Packed beds of char with K CO and without K CO were prepared as<br />
described in the experimental segtior? and used in &e $-eactor. Pulses of<br />
gases were injected into the reactor and the pulses of products were<br />
analyzed. The conversion of each pulse, its shape and its retention in the<br />
13
eactor were used to infer on the mechanism of the catalysis. The main<br />
conclusions from these tests are:<br />
A. The pulses of gas are retained for a longer time in a reactor with<br />
treated-char relative to reactor with untreated char.<br />
B. The shape of the pulses which came out of a reactor with treated<br />
char suggests that the gas disorbes from the K OC -treated char<br />
much slower than from the surface of untreate2 chb. Figure 7<br />
shows the forms of pulses of CO injected to packed-bed reactors<br />
with char and with K CO -trea&d char at 65OOC. The pulses<br />
coming out of the react& dth the K C03-treated char are flat and<br />
tailing. It takes as long as 10-20 mi%utes to completely desorb the<br />
pulse out. Figure 8 shows the shape of hydrogen pulses injected<br />
to the differential reactor at 7OOOC. Again, it is obvious that the<br />
residence time of H on K C03-treated char is substantially longer<br />
than that on untreited c$ar. Figure 9 shows the output signals<br />
from the gas chromatograph, when equal pulses of CO were<br />
injected to columns packed with char and with K CO -treate8 char.<br />
Acknowledyemen __ t:<br />
The figure demonstrates three points: 1. mo+e if the C02 is<br />
converted to CO when columns packed with K CO -treated char are<br />
used. 2. the CO and the CO are retained’on ?he KZCO -treated<br />
char longer time $ban on the untreated char. 3. thz pulses<br />
coming out of the K CO -treated char are tailing. These<br />
observations are consist&t %ith mechanism five. The data show<br />
clearly that pulse of CO stay in the reactor longer time when the<br />
reactor contains K CO -?rested char, relative to when it contains<br />
untreated char. dlyldtion of char slightly reduces the residence<br />
time of pulses of C02 and the activity of the char. Treatment of<br />
silylated char with K CO increases the activity of the char beyond<br />
that of untreated chir, %ut not quite to the level of unsilylated<br />
char treated with K CO Taylor and Neville (1921) observed that<br />
better catalysts abs&-b %ore CO than poorer catalysts. However,<br />
they attributed the catalytic eqfect to the formation of surface<br />
carbon-oxygen complexes. Had surface complexes been formed, one<br />
would expect exchange of carbon from the gaseous carbon dioxide<br />
and the solid char. Howeygr, Yergey and Lampe (1974), whol$id<br />
tracer experipnts usins2C on the gasification of char with C 0<br />
found that C 0 and C 0 evolve from the char simultaneously an8<br />
at equal rates. These observations tend to support gasification<br />
mechanisms which do not permit exchange of carbon between the<br />
gas and the solid, or the formation of chemical bonds due to<br />
carbon-oxygen complexes.<br />
‘I’hc ~ I U I ~ O ~ wish S to I.hilnk DOW Clic!mical Co. and ‘I’cxas Energy Advisory<br />
Council for their generous support of this work.<br />
References<br />
1. Attar, A. and Dupuis, F., Ind. Eng. Chem., Proc. Des. and Dev., 18,<br />
607-618 (1979).<br />
2. Attar, A. and Robinson, R., submitted for publication.<br />
14
3.<br />
4.<br />
5.<br />
6.<br />
7.<br />
8.<br />
9.<br />
10.<br />
11.<br />
12.<br />
13.<br />
14.<br />
15.<br />
16.<br />
17.<br />
18.<br />
19.<br />
Ayling, A. B., and Smith, I. W., Combust. and Flame., 18, 173-184<br />
(1972).<br />
Chauhan, S. P., Feldman, H. F., Stambaugh, E. P., and Oxley, J. H.,<br />
Prep. Div. Fuel Chem., ACS, 22 (1) 38-52 (1977).<br />
Cusumano, 1. A., Dalla Betta, R. A., and Levy, R. B., Acad. Press.,<br />
N.Y. 1978, Chapt. 10, p. 233.<br />
Friedman, S., Kaufman, M. L., Steiner, W. A., and Wender, I., Fuel<br />
- 40, 33-46 (1961).<br />
Gardner, N., Samuels, E., and Wilks, K., P. 217-237 ("Coal<br />
Gasification", Adv. in Chem., Ser. 131, ACS, Washington (1974).<br />
Haynes, W. P., Gasior, S. J., and Forney, A. J., p. 179-203, "Coal<br />
Gasification", Adv. in Chem., Ser. 131, ACS, Washington (1974).<br />
Hill, F. B., and Wilhelm, R. H., AIChE J., 5 (41), 486-496 (1959).<br />
Johnson, J. L., Catal. Rev. Sci. Eng., 14 (1). i31-152 (1976).<br />
Nahas, N. C. and Gallagher, J. E., Jr., paper presented in the 19th<br />
Intersociety Energy Conversion Engineering Conference, Aug . 1978, San<br />
Diego, California.<br />
Taylor, H. S. and Neville, H. A., J. Am. Chem. SOC. SOC., 43, 2055<br />
(1921).<br />
Thomas, J. M., p. 122-203 in "Chemistry and Physics of Carbon", Vol.<br />
1, Walker, P. L., Jr., (ed)., Marcel Dekker, N. Y. (1965).<br />
Tomita, A., Mahajan, 0. P., and Walker, P. L. Jr., Prep. Div. Fuel<br />
Chem. ACS, 22 (1). 4-6 (1977).<br />
Vadovic, C. J., and Eakman, J. M., Prep. Div. Fuel Chem., ACS, 2<br />
(1978).<br />
Von Fredersdorff and Elliot, M. A., Chap. 20 p. 892-1022, in<br />
"Chemistry of Coal Utilization", Lowry H. H. (ed) Suppl. vol., Wiley,<br />
1-1. Y. (1963).<br />
Wilks, K. A., Gardner, N. C., and Angus, J. C., Prep. Div. Fuel<br />
Chem., ACS, 20 (3), 52-60 (1975).<br />
Wilson, W. G., Sealock, L. J., Jr., Hoodmaker, F. C., Hoffman, R. W.,<br />
Stinson, D. L., and Cox, J. L., p. 203-217 in "Coal Gasification", Adv.<br />
in Chem., Ser. 131, ACS, Washington (1974)<br />
Yergey, A. L., and Lampe, F. W., Fuel 93, 280-281 (1974).<br />
15
m<br />
U C<br />
w<br />
0<br />
16
Flg. 5. The variation of the emission<br />
of light from the surface of<br />
char treated by various catalysis.<br />
-<br />
A,., -<br />
17<br />
Fig. 6. The approach functions<br />
PY2co/Yco2 plotted VS.<br />
103/T for chars treated<br />
by various catalysts.<br />
.:..\., *<br />
Fig. 8. The shape of pulses of C02 at<br />
the outlet of the packed bed.
0.2 gm. DEM<strong>IN</strong>ERALIZED<br />
CHAR 8 20% K2CO3<br />
700°C. 2.5 oim.<br />
H2 STUDY <strong>IN</strong> MICROREACTOR<br />
0.2gm. DEM<strong>IN</strong>ERALIZED<br />
CHAR ?OO"C, 2.5oim.<br />
n<br />
SENSITIVITY <strong>IN</strong>CREASED n<br />
BY A FACTOR <strong>OF</strong> 6<br />
A = 39,000<br />
A = 40,000<br />
Fig. 9. The shape of pulses of H at the outlet of the microreactor.<br />
-
<strong>IN</strong>TRODUCTION<br />
Char Reactivities and Their Relationship<br />
to Pore Characteristics<br />
S. Katta and D. L. Keairns<br />
Westinghouse R&D Center<br />
Pittsburgh, PA 15235<br />
The study of char reac ivi ies is fundamental to the design<br />
and performance evaluation of gasifiers for coal gasification. This<br />
investigation was undertaken in connection with the development of the<br />
Westinghouse coal gasification process. The objective of the study<br />
was to determine the reactivities of several chars and to examine the<br />
relationship between the reactivities and the pore surface areas or<br />
mean pore diameters. If char reactivities can be predicted from pore<br />
surface area or pore mean diameter, char characterization becomes<br />
simpler. This method can then be used as a screening technique to<br />
assess the performance of gasifiers.<br />
A detailed experimental investigation on the rate of carbonsteam<br />
(C-HzO) and carbon-carbon dioxide (C-CO2) reactions with coke<br />
breeze was reported by Katta and Keairns (1). The reactivities of chars<br />
were used to predict gasification rates in several pilot plant tests by<br />
means of a gasification model.<br />
The reactivity of carbonaceous material in a H20 or C02<br />
atmosphere depends on the rank of coal, the rate of heating, and the<br />
heat treatment temperature, all of which influence the pore characteristics.<br />
The pore structure and the chemical nature of the char control<br />
the reactivity in a H20, C02, or oxygen atmosphere. The reactivity of<br />
a material may not be the same in all these atmospheres since the mineral<br />
content influences each of these reactions to a different extent and the<br />
same pores are not involved in these reactions.<br />
Information from the<br />
literature indicates that a limited understanding has been gained on the<br />
influence of different parameters on the reactivities of chars.<br />
In any coal gasification process much of the carbon conversion<br />
takes place through a C-H20 reaction. Hence, it is important to establish<br />
char reactivities in a steam atmosphere rather than in other atmospheres.<br />
A study of char reactivities in the atmospheres of H20, C02, oxygen, and<br />
hydrogen is important for a fundamental understanding of char behavior.<br />
Jenkins et al.(2) studied the reactivities of various chars in<br />
air at 500°C as a function of heat treatment temperature, mineral content,<br />
and pore structure. They found that the chars became less reactive as<br />
the heat treatment temperature was increased, and that the magnitude of<br />
the effect depended on the type of char. They observed, also, that the<br />
19
level of transitional porosity (estimated from nitrogen adsorption)<br />
increases the reactivity markedly since the ability of a gaseous<br />
reactant to reach the surface area in the micropores is enhanced. They<br />
concluded that the reactivity of chars prepared at the same temperature<br />
and heating rate is predominantly influenced by mineral matter and the<br />
rank of the parent coal.<br />
The reactivities of several chars in a C02 atmosphere and the<br />
changes in pore structure with carbon conversion were investigated by<br />
Dutta et aL (3). They found that almost the entire surface area of<br />
chars seemed to be due to micropores smaller than 0.01 to 0.02 um in<br />
diameter. They concluded that the reactivities were almost proportional<br />
to the surface areas occupied by pores above about 0.003 um in diameter,<br />
suggesting that smaller pores are inaccessible to gaseous reactant.<br />
They derived a rate equation with a parameter that represents the change<br />
in available pore surface area with carbon conversion.<br />
Johnson (4) conducted a comprehensive study on the effects of<br />
physical and chemical properties of chars on their reactivities. He<br />
concluded that the gasification of chars with hydrogen and steam-<br />
hydrogen (H~O-HZ) mixtures occurs primarily on the surface within micro-<br />
pores which were defined as less than 5.5 nm in diameter.<br />
EXPERIMENTAL WORK<br />
The reactivities of various chars were determined at a<br />
temperature of 927°C and a pressure of 10 atmospheres in a steamhydrogen-nitrogen<br />
(H20-Hz-N-J atmosphere. Experiments were conducted<br />
in a reactor of 3.5 cm id and 30.5 cm height which was heated externally<br />
by an electric furnace.<br />
size was placed on the distributor and fluidized by the gaseous mixture.<br />
Gas samples were taken for different inlet gas compositions, and the<br />
reaction rate was determined from the product gas composition and the<br />
estimated amount of carbon present in the bed at the time the sample<br />
was taken. At the end of the test, the bed material was weighed and<br />
the product gas line flushed to collect fines. The amount of fines<br />
collected in any run was very small. A detailed description of the<br />
apparatus and the experimental procedure are given in reference (1).<br />
The reaction data were analyzed on the basis of the rate equation de-<br />
rived from Ergun's model (5).<br />
CHAR PREPARATION<br />
A sample of about 35 g of char of -1.0 + 0.25 mm<br />
Renton, Minnehaha, and Montour chars were prepared in the<br />
Westinghouse process development unit. Western Kentucky and Utah chars<br />
were obtained from FMC Corporation and Synthane char from the Synthane<br />
pilot plant.<br />
20
SURFACE AREA MEASUREMENT<br />
We degassed the char samples at 110°C for about four hours<br />
prior to measuring their surface areas, using carbon dioxide as the<br />
adsorbate at 298 K on a micromeritics Model 2100 surface area analyzer.<br />
An equilibration time of about 30 minutes was allowed for eacb adsorption<br />
point. The molecular area of C02 at 298 K was taken as 25.3 A2.<br />
The Dubinin-Polanyi equation (D-P equation) was used for the<br />
evaluation of surface areas of chars and is given below:<br />
2<br />
log V = log Vo - D log (Po/P2)<br />
A plot of log Va versus log2 (Po/P2) yields the value of log VO from<br />
which the specific surface area of the sample can be calculated A<br />
value of 63.5 atm was used for the saturation vapor pressure of C02 at<br />
298 K.<br />
PORE VOLUME MEASUREMENT<br />
Measurements on pore volume were made with a Micromeritics<br />
mercury penetration porosimeter Model 910 series. Pressures up to<br />
17,000 psi were used in these measurements to cover a pore diameter<br />
range of 100 to 0.0104 um.<br />
RESULTS AND DISCUSSION<br />
The following rate equation for the coke breeze-Hz0 reaction<br />
had been obtained in a previous study (1):<br />
where 1-2, k2, and K2 are the reaction rate per unit mass, rnin-l, the<br />
reaction constant, and the equilibrium constant, respectively. k2 and<br />
K2 are given by<br />
k2 = 4.85 x lo6 - exp (-48,2OO/RT) (3)<br />
K2 = 2.25 x lo6 - exp (-42,6OO/RT) (4)<br />
where T is the absolute temperature in K. The rate data were plotted<br />
with PH~/PH~o versus the inverse reaction rate to obtain the reaction<br />
rate parameters. The intercepts on the ordinate and the abscissa give<br />
the values of K2 and l/k2, respectively. Results for Renton, Minnehaha,<br />
FMC Western Kentucky, Synthane, Montour, and Utah chars are shown in<br />
Figures 1 to 6. The initial relative reactivities of various chars with<br />
reference to coke breeze are given in Table 1.<br />
21
Table 1<br />
RELATIVE REACTIVITIES <strong>OF</strong> CHARS<br />
Rate Constant, Initial Relative Surface Area Mean Pore<br />
Char k7, min-1 Reactivity by c07 Adsorption Diameter,pm<br />
-<br />
Coke Breeze 0.008 1.00 13.9 0.196<br />
Minnehaha 0.08 9.88 85.2 0.066<br />
Renton 0.02 2.47 199.8 0.033<br />
Utah 0.081 10.13 126.8 0.036<br />
FMC<br />
Western 0.095 11.73 117.9 0.041<br />
Kentucky<br />
Synthane* 0.08 10.67 63.2 0.068<br />
Montour 0.0195 2.44 23.3 0.161<br />
*Reactivity evaluated at 32 percent carbon conversion.<br />
The initial relative reactivities of the chars were plotted<br />
versus the pore surface areas determined by C02 adsorption and inter-<br />
preted by Dubinin-Polanyi equation in Figure 7. If the data on Renton<br />
char is excluded, a correlation of these two variables can be obtained.<br />
In the absence of reactivity data, the relative reactivity can be<br />
estimated from C02 surface areas. This method, however, will probably<br />
be uncertain for some materials whose surface area develops primarily<br />
after significant conversion. Work on additional chars is recommended<br />
in order to improve the reliability of the method and to establish<br />
limitations.<br />
- The mean pore diameter of chars is calculated from the relation<br />
D = 4V/Sco2, where V is the pore volume as measured by means of mercury<br />
porosimeter and Sco2 is the surface area as measured from C02 adsorption.<br />
The relative char reactivities were plotted versus the mean pore diameter<br />
in Figure 8.<br />
A linear correlation was obtained by a regression analysis<br />
after excluding the data on Renton char. Use of this correlation<br />
requires the measurement of surface area and pore volume. Figures 7<br />
and 8 indicate that more reactive chars have greater surface areas and<br />
smaller mean pore diameters than others, as would be expected.<br />
22
SUMMARY<br />
Relative reactivities of chars in a H20-N2-H2 atmosphere were<br />
measured in a laboratory fluidized bed. Results were analyzed on the<br />
basis of Ergun's rate equation, and the relative reactivities were<br />
calculated with reference to coke breeze. Surface areas of chars were<br />
obtained by means of C02 adsorption, and pore volumes were measured by<br />
means of mercury penetration porosimetry. A correlation can be identified<br />
between the relative reactivity versus the surface areas and the<br />
mean pore diameter for the limited number of chars investigated in the<br />
present study. Additional studies should be conducted to establish the<br />
range of validity with additional chars and drawbacks of this approach.<br />
ACKNOWLEDGEMENTS<br />
This work was performed as part of the Westinghouse coal gasi-<br />
fication program under DOE contract EF-77-C-01-1514.<br />
REFERENCES<br />
1. Katta, S. and Keairns, D. L., Study of Kinetics of Carbon Gasification<br />
Reactions, submitted to I&EC Fundamentals for Publication (1980).<br />
2. Jenkins, R. G., Nandi, S. P. and Walker, P. L., Jr., Fuel, 52,<br />
288 (1973).<br />
3. Dutta, S., Wen, C. Y. and Belt, R. J., Ind. Eng. Chem. Process<br />
Des. Dev., s(1),<br />
20-30 (1977).<br />
4. Johnson, J. L., Presented at Symposium on Structure and Reactivity<br />
of Coal and Char, National ACS Meeting, Chicago (August, 1975).<br />
5. Ergun, S., Bureau of Mines Bulletin 598, Washington, D.C. (1962)<br />
23
NOMENCLATURE<br />
D<br />
-<br />
D<br />
k<br />
2<br />
K2<br />
sco*<br />
T<br />
V<br />
"a<br />
V<br />
x<br />
a constant<br />
mean pore diameter of chars<br />
-1<br />
rate constant of carbon-steam reaction, min as defined<br />
by Ergun's rate equation<br />
equilibrium constant of carbon-steam reaction as defined<br />
by Ergun's theory<br />
partial pressures of hydrogen and steam, respectively<br />
saturation vapor pressure of adsorbate at adsorption<br />
temperature<br />
initial rate per unit mass of carbon-steam reaction,<br />
(corresponds to a carbon conversion of zero) min-1<br />
surface area of chars measured by C02 adsorption<br />
absolute temperature of char bed, K<br />
pore volume, cm31g<br />
amount of C02 adsorbed at equilibrium pressure p<br />
2<br />
micropore capacity<br />
fractional carbon conversion<br />
24
-0.<br />
4. i<br />
0. t<br />
0.5<br />
0.4<br />
0.2<br />
0.1<br />
-0.1<br />
0<br />
Inverse Reaction Rate x lo-'. min<br />
Figure 1 - Renton char -steam reaction<br />
Curve 694020-b<br />
0<br />
Lvrrc 69202k-A<br />
0<br />
Minnehaha Char<br />
Temp = 9 270~<br />
1 2 3<br />
Inverse Reaction Rate x lo-'. min<br />
Figure 2 - Minnehaha char -steam reaction<br />
25
0.<br />
Curve €9401 1 4<br />
0.7 0<br />
0.6 -<br />
0.5 -<br />
zw 0.4 -<br />
.e FMC Western<br />
Kentucky Char<br />
Temp. = Ql0C<br />
I I I I I b I<br />
0.2 0.4 0.6 0.8 1.0 1.2 1.4 1.5<br />
Inverse Reaction Rate x IO-', min<br />
Figure 3- FMC western Kentucky char - steam reaction<br />
cvrrc 717511-.<br />
I 1 I I \ I I<br />
Synthane Char<br />
x =o. 32<br />
-a I I I I I I I<br />
o.1 0.2 0.3 0.4 0. 5 0.6 0.7<br />
inverse Reaction Rate x IO-'. min<br />
Figure 4- Synthane char - steam reaction<br />
8<br />
26
0. 8<br />
0. 6<br />
ON<br />
0.4<br />
--.<br />
X N<br />
m<br />
0. 2<br />
curve 717531-A<br />
I I I<br />
Monlour Char<br />
Temp. =927OC<br />
I I I I I<br />
1 2 3 4 5<br />
Inverse Reaction Rate x 10 ‘. min.<br />
Figure 5 - Monlour char - steam reaction<br />
I I I I I I<br />
0 0. 2 0.4 0.6 0. 8 1.0 1. 2<br />
Inverse Reaction Rate x IO-’. min.<br />
Figure 6- Wah char - steam reaction<br />
27
Curve 717536-A<br />
I I<br />
0. 1 0.2<br />
Mean Pore Diameter,<br />
Figure 8 - Relationship between reactivity and mean pore diameter<br />
0<br />
Curve 111515-1<br />
I I I I I I<br />
I I I I I I<br />
M E O W 120 150 180<br />
Surface Area From C02Adarptbn. m2/g<br />
Figure 7 - Relationship bdween reactivttyand surfacearea of chars<br />
0<br />
0
HYDROGENOLYSIS <strong>OF</strong> BENZENE AND ALKYLATED<br />
BENZENES OVER COAL CHARS<br />
S. K. Gangwal and W. J. McMichael<br />
Research Triangle Institute<br />
P. 0. Box 12194<br />
Research Triangle Park, N. C. 27709<br />
<strong>IN</strong>TRODUCTION<br />
The Research Triangle Institute (RTI) is conducting an experimental study to<br />
assess the environmental impacts of coal gasification and evaluate control technologies<br />
for the many potential pollutants that are formed during gasification.<br />
Pollutant generation behavior of 10 U.S. coals has been studied in a bench-scale<br />
gasifier under a variety of conditions (1-3). Process operating conditions such<br />
as continuous versus batch operation, fixed versus fluidized bed operation,<br />
temperature, coal type, pressure and particle size have been found to determine<br />
production behavior. Of major interest are the polycyclic aromatic hydrocarbons<br />
(PAHI and phenolic compounds.<br />
Significant quantities of char or high ash solids are produced during coal<br />
gasification. One objective of this study was to determine the feasibility of<br />
using coal char as a catalyst to facilitate cracking of potential environmental<br />
pollutants. The authors are aware of only one previous study, which reported on<br />
decomposition of phenolics over lignite char (4). It was found that the presence<br />
of coal char greatly enhanced the decomposition of phenol. Virk, et al. (5)<br />
reviewed the literature on thermal hydrogenolysis of aromatic compounds. Benzene<br />
decomposition was slowest and anthracene decomposition was fastest among the<br />
various compounds studied (1 to 4 rings). No alkylated aromatics were reported<br />
upon, although various other studies (6-9) have been carried out on thermal<br />
hydrodeallrylation of aromatics and phenols. In general, these studies agree with<br />
the mechanism originally proposed by Silsby and Sawyer (6) which results in a<br />
first order dependence of the rate on the concentration of the decomposing compound<br />
and half order dependence on hydrogen concentration with hydrogen dissociation at<br />
equilibrium. According to this mechanism, the cracking of alkylated aromatics<br />
and phenols seems to involve the benzene ring as an intermediate.<br />
From the above discussion, it follows that benzene could serve as a model<br />
compound for comparing the catalytic hydrogenolysis potential of various coal<br />
chars. In addition to benzene, alkylated benzenes (toluene, ethylbenzene and o-<br />
xylene) were also chosen as model compounds for this study.<br />
EXPERIMENTAL<br />
The proximate and ultimate analysis of the char solids chosen for this study<br />
are shown in Table 1. The Wyoming subbituminous and the Illinois No.6 chars were<br />
produced by the steam-air gasification of the coals at 900°C and 200 psig in the<br />
RTI bench-scale gasifier.<br />
The Peabody char was obtained from Peabody Coal Company<br />
(Columbia, Tennessee) who prepared it by coking a Western Kentucky No.11 coal at<br />
870 to 1090OC. For comparison, quartz and molecular sieve 4A were also used in<br />
the microreactor experiments. Representative samples of all materials were<br />
crushed and screened to 28 x 48 mesh. Microreactors were prepared as shown in<br />
Figure 1 with the volume of packing material being approximately 1 cm3 and ranging<br />
in weight from 0.5 to 1.0 gram. A reactant gas containing 290 ppm benzene, 52.2<br />
ppm toluene, 9.87 ppm ethylbenzene and 11.4 ppm o-xylene in nitrogen was used in<br />
all experiments. Hydrogen of high purity was blended with the reactant gas to<br />
obtain a hydrogen level of 50 percent. Details of the reactor flow system are<br />
shown in Figure 2. Gas residence time in the reactors ranged from approximately<br />
0.25 to 0.5 seconds; and all experiments were carried out at slightly above<br />
atmospheric pressure. In the experiments utilizing coal chars the packed<br />
29
TABLE 1. PROXIMATE AND ULTIMATE ANALYSIS <strong>OF</strong> CHARS<br />
Weight % As Received<br />
Peabody Illinois No.6 Wyoming Subbituminous<br />
Char Char Char<br />
Proximate<br />
Mo i s ture 1.46 0.77 1.27<br />
Volatile Matter 1.73 2.56 5.89<br />
Fixed Carbon 84.61 39.94 36.03<br />
Ash 12.20 56.73 56.81<br />
U1 timate<br />
Carbon 82.34 39.61 40.53<br />
Hydrogen 0.82 0.59 0.46<br />
Nitrogen 1.17 0.72 0.44<br />
Sulfur 2.06 1.56 0.48<br />
Oxygen (by difference) 1.41 0.79 1.28<br />
microreactor was conditioned overnight with the reactant gas-hydrogen mixture at<br />
800°C. In the experiments utilizing quartz and molecular sieve packings and in<br />
the tests using an empty reactor conditioning was not carried out. This led to<br />
some interesting observations on the transient cracking activity. Reactor tem-<br />
peratures were varied from 500 to 8OO0C. Analysis of reactants and products were<br />
carried out by gas-liquid chromatography with an 8' x 1/8" stainless steel column<br />
containing Tris-1,2,3-cyanoethoxy propane on SO/lOO mesh Chromosorb P operated<br />
with a helium carrier gas flow of 20 ml/min at 85'C oven temperature in a Perkin-<br />
Elmer 3920B gas chromatograph with a flame ioniziation detector; 1.0 ml samples<br />
were injected using a zero volume six-port stainless steel Carle valve, operated<br />
automatically with a valve actuator and a valve timer with a 16 minute cycle.<br />
RESULTS AND DISCUSSION<br />
In the present experimental study with benzene and three alkylated benzenes<br />
present in the feed gas, a full description of the kinetics would be extremely<br />
complex since so many possible parallel and series reactions can occur. To limit<br />
the complexity of the data analysis a simple first order decomposition of each<br />
component is assumed. This is probably reasonable for ethylbenzene and o-xylene,<br />
however, the assumption could lead to under-estimation of the benzene and toluene<br />
cracking rates since benzene and toluene production from ethylbenzene and o-<br />
xylene and benzene productionfrom toluene are ignored. Justification for the<br />
simplified analysis is that (1) the amount of ethylbenzene and o-xylene in comparison<br />
to benzene is small and should not contribute significantly to the<br />
apparent rate of benzene decomposition, (2) at high decomposition rates of benzene,<br />
ignoring benzene production from the other aromatics will result in small errors<br />
in theapparent rate of decomposition since the benzene concentration is almost<br />
six times that of any other component, and (3) an upper bound on the benzene<br />
decomposition rate can be estimated as discussed towards the end of this section.<br />
In previous studies C4-9) of hydrocracking, hydrogenolysis or hydrodealkylation<br />
of aromatic compounds the data obtained are correlated using a first order<br />
rate with respect to the compound being decomposed and one-half order with respect<br />
to thehydrogen concentration. Since in all experiments of this study a constant<br />
hydrogen mole fraction was maintained and in large excesses, the rate can be<br />
30
expressed in terms of a pseudo first order rate constant containing the hydrogen<br />
term. Assuming a plug flow reactor with negligible change in gas volume with<br />
extent of decomposition, the integrated material balance under isothermal conditions<br />
for the ith component can be written as<br />
1 Lii<br />
k=-ln-<br />
'io<br />
where T = space time, sec.<br />
3<br />
Cii, Cio = inlet and outlet concentrations of the ith species, g mole/cm .<br />
-1<br />
k = first order rate constant,<br />
2<br />
sec .<br />
This equation was used to calculate the first order rate constants for all experiments<br />
in order that the relative activity of the packing material toward cracking<br />
of aromatics could be compared with the empty reactor activity and published<br />
homogeneous decomposition rates. For each packing material, rate constants were<br />
determined at a series of temperatures. Arrhenius plots of the first order rate<br />
constants for the individual compounds are shown in Figures 3 through 6 and are<br />
compared with existing literature data. Table 2 gives the least squares estimates<br />
of the pre-exponential factors and activation energies.<br />
Examination of Figures 3 through 6 shows that the steady-state cracking<br />
activity obtained in the empty bed experiments is unusually high being on the<br />
order of 1 to 2 magnitudes greater than homogeneous first order constants reported<br />
in the literature. The empty bed experiments reported in this paper were carried<br />
out in reactors that had high surface to volume ratios (about 3-6 times those<br />
used in previous studies (4-11)). Also the activity appeared to increase rapidly<br />
with run time as seen in Figure 7. Apparently the surface of the stainless steel<br />
reactor is increasing in activity under the the reducing action of hydrogen and<br />
possibly carbon laydown (in some unknown form); and the activity reaches a steadystate<br />
value after extended time periods (on the order of 12-24 hours).<br />
Comparing the steady-state empty bed constants to the first order rate<br />
constants associated with each char (which show no time dependent activity after<br />
overnight conditioning) it can be seen that the Wyoming and Illinois No.6 chars<br />
show enhanced cracking activity over the empty reactor. The Peabody char showed<br />
significantly lower activity and quartz had a lower initial activity than the<br />
empty bed demonstrating that the packing material blinded in part, the activity<br />
of the stainless steel reactor wall. Consequently the rate constants associated<br />
with the Wyoming and Illinois No.6 chars are significantly higher than the<br />
homogeneous rate constants and more than two orders of magnitude higher than the<br />
homogeneous rates reported previously in the literature. The higher activity of<br />
the Wyoming and Illinois chars over the Peabody char is likely to be due to their<br />
significantly higher ash contents, which are known to contain substantial quan-<br />
'tities of silica and alumina.<br />
Quartz was used in the microreactor for the purpose of comparison because it<br />
was initially thought that it would be relatively inert and would have a packed<br />
bed voidage similar to the chars. However, the initial activity of quartz showed<br />
rate constants at least an order of magnitude higher than homogeneous rate con-<br />
stants reported in the literature. Furthermore, the rate constants were observed<br />
to increase with run time at 748OC and over a 24 hour period the rate constants<br />
for benzene and toluene increased by an order of magnitude. The time dependent<br />
behavior of these constants are shown in Figure 7. The steady-state rate con-<br />
stants for benzene and toluene over quartz were 1.95 and 5.59 sec-1, respectively.<br />
The initial rate constants for the decomposition of benzene and toluene over<br />
quartz were obtained by extrapolating the data by the method of Gangwal, et al.(l2).<br />
31
32<br />
4<br />
4
TABLE 2. ARRHENIUS EQUATIONS FOR HYDROCRACK<strong>IN</strong>G<br />
Compound Material<br />
Arrhenius Equations<br />
k = (sec1-l<br />
Wyoming Char<br />
Illinois No.6 Char'<br />
18<br />
1.71 x lolo exp (-81290/RT)<br />
1.05 x lol1 exp (-46730/RT)<br />
Benzene Peabody Char<br />
Quartz*<br />
Empty Reactor**<br />
3.29 x 10 exp (-57840/RT)<br />
4.61 x lo6 exp (-33920/RT)<br />
3.38 x lo7 exp (-36510/RT)<br />
Wyoming Char 5.29 x 10i5 exp (-68410/RT)<br />
Illinois No.6 Char 2.32 x lo9 exp (-41740/RT)<br />
To1 uene Peabody Char 5.35 x lo2 exp (-47000/RT)<br />
Quartz* 2.98 x lo6 exp (-12360/RT)<br />
Empty Reactor** 7.21 x 10 exp (-31250/RT)<br />
Wyoming Char 1.97 x 10" exp (-42960/RT)<br />
Illinois N0.6 Char 2.17 x 10; exp (-35710/RT)<br />
o - Xy 1 ene Peabody Char 8.01 x 10 exp (-3189D/RT)<br />
Quartz* ,scatter<br />
Enipty Reactor** 1.75 x 10 exp (-31830/RT)<br />
Wyoming Char 1.51 x lo9 exp (-34640/RT)<br />
Illinois No.6 Char 2.39 x 10; exp (-29000/RT)<br />
Ethyl benzene Peabody Char 5.59 x lo4 exp (-34030/RT)<br />
Quartz* 8.05 x 10IOexp (-19610/RT)<br />
Empty Reactor** 2.06 x 10 exp (-44830/RT)<br />
"Initial rate.<br />
;*Steady-state rate.<br />
7<br />
Expression for maximum k = 3.38 x 10 exp (-36510/RT).<br />
Material balances for carbon showed that carbon (in some form) was being deposited<br />
on the quartz over the 24 hour run period. It is possible that the deposited<br />
material was catalyzing the cracking of the benzene and toluene. After the 24<br />
hour period at 748'C the temperature of the reactor was lowered to 650°C but<br />
no enhancement in activity over previous experiments at 65OoC was observed, i.e.,<br />
whatever was being formed at 748°C was not active at 650°C.<br />
Molecular sieve 4A was also used as a packing material and showed very high<br />
initial cracking activity in comparison to the other packing materials investi-<br />
gated as can be seen in Figures 3 through 6. However, this activity quickly<br />
faded as can be seen in Figure 7, with coke deposits blocking the porous structure<br />
of the sieve being a probable deactivation mechanism.<br />
Based on the data presented in Figures 3 through 6 the following additional<br />
observations can be made:<br />
1.<br />
For a given volume of packing material and the same operating condi-<br />
tions the rate of cracking of the aromatic compounds is in the order<br />
ethylbenzene > o-xylene > toluene > benzene.<br />
35
2.<br />
For a given aromatic compound and the same operating conditions with<br />
temperatures greater than 6OO0C, the activity of the char toward<br />
enhancing decomposition of compounds is in the order<br />
Wyoming char > Illinois No.6 char > Peabody char.<br />
The theoretical activation energy for homogeneous hydrodealkylation of<br />
alkylated aromatics is 50 +- 5 kcallmole, based on the hydrogen dissociation<br />
mechanism originally proposed by Silsby and Sawyer (6). The experimental values<br />
reported are generally 45-50 kcal/mole for toluene hydrodealkylation (6-9).<br />
However, the empty bed activation energy for toluene (Table 2) is significantly<br />
lower, i.e., 31 kcal/mole, substantiating in part that the catalytic nature of<br />
the stainless steel reactor may be responsible. Virk, et al. (5) report an<br />
activation energy of 52.6 kcal/mole for homogeneous hydrogenolysis of benzene.<br />
Again the empty bed activation energy for benzene is much lower. The heterogeneous<br />
hydrocracking reactions of benzene and toluene over the Wyoming char<br />
show significantly higher activation energies of 81 and 68 kcal/mole, respectively.<br />
The values are close to those reported by Szwarz (10) whose experiments were<br />
carried out in the absence of hydrogen. Thus the heterogeneous reaction may be<br />
proceeding by a mechanism which is entirely different from the homogeneous<br />
reaction.<br />
The Illinois and Peabody chars have activation energies associated<br />
with the decomposition of benzene and toluene which are considerably lower than<br />
those observed for the Wyoming char. One explanation for this is that the<br />
Wyoming char reaction rate is not limited by internal diffusion whereas the<br />
reaction rate for other chars might be. For an internal diffusion limited first<br />
order reaction the apparent activation energy is one-half of the true activation<br />
energy; this could explain in part the lower values observed for the Illinois<br />
and Peabody chars. This reasoning is supported by the experiments of Walker and<br />
coworkers (13-15) who have shown that low rank chars generally have an ample<br />
supply of feeder and transitional pores whereas bituminous and higher rank chars<br />
do not. The char samples used in this study have been sent to an outside testing<br />
laboratory for characterization of the pore structure and surface area. At the<br />
present time these results are not available; however, they will be reported at<br />
the presentation of this paper.<br />
An upper bound on the benzene decomposition rate on Illinois No.6 char is<br />
shown in Figure 3 by the dark triangles. This is calculated assuming that<br />
benzene is an intermediate product from the cracking of the other aromatics<br />
present in the feed. When compared to the apparent rate (i.e., empty triangles)<br />
it can be seen that even higher rates of benzene decomposition exist if the<br />
assumption is true. The activation energy however is lower, i.e., 36.5 compared<br />
to 46.7 (see Table 2, footnote) and thus as the temperature increases the<br />
observed rate and the maximum possible rate approach each other.<br />
The major gaseous product of decomposition of the aromatic compounds appeared<br />
to be light gases (probably mostly methane) although the GC column used in the<br />
experiment could not separate CH4, C H and C2H4. Much more methane was formed<br />
2 6<br />
than could be accounted for by the removal of methyl groups from the alkylated<br />
benzene compounds. Also carbon balances showed that substantial quantities of<br />
the input carbon remained in the reactor. The only exception to this was in the<br />
case of the Wyoming char experiments run at 748OC and 800'12. In these cases<br />
carbon in the char also was converted to light gases (probably methane). The<br />
activation energy of this conversion was on the order of 104 kcal/g mole which<br />
corresponds to the temperature dependency of the equilibrium constant for hydrogen<br />
dissociation.<br />
CONCLUSIONS<br />
Based on the results obtained, it appears that coal-derived materials<br />
having high ash content show significant catalytic enhancement of the vapor<br />
36
phase cracking of benzene and alkylated benzene compounds. It was found that the<br />
Wyoming subbituminous char showed significantly greater activity (as indicated by<br />
the first order reaction rate constants) than the Illinois and Peabody chars.<br />
The activity of the Peabody char was lower than the steady-state activity of the<br />
empty stainless steel reactor. The activity of stainless steel increased with<br />
time on stream to a steady-state activity that was an order of magnitude higher<br />
than the activity reported in the literature for the homogeneous decomposition of<br />
benzene and toluene.<br />
ACKNOWLEDGEMENT<br />
Support for this work from the U.S. Environmental Protection Agency, Fuel<br />
Process Branch, Research Triangle Park, N. C., under Grant No. R804979 is grate-<br />
fully acknowledged.<br />
1.<br />
2.<br />
3.<br />
4.<br />
5.<br />
6.<br />
7.<br />
8.<br />
9.<br />
10.<br />
11.<br />
12.<br />
13.<br />
14.<br />
15.<br />
REFERENCES<br />
J. G. Cleland, et al., Pollutants from Synthetic Fuels Production: Facility<br />
Construction and Preliminary Tests. EPA-600/7-78-171, U.S. EPA, Research<br />
Triangle Park, N. C. (1978).<br />
S. K. Gangwal, et al., Pollutants from Synthetic Fuels Production: Sampling<br />
and Analysis Methods for Coal Gasification. EPA-600/7-79-201, U.S. EPA,<br />
Research Triangle Park, N. C. (1979).<br />
J. G. Cleland, et al., Pollutants from Synthetic Fuels Production: Coal<br />
Gasification Screening Tests. EPA-600/7-79-200, U.S. EPA, Research Triangle<br />
Park, N. C. (1979).<br />
J. P. Fillo, and M. 3. Massey, "Study of Phenolic Compound Decomposition<br />
under Synthane Gasifier Conditions," Final Report, EW-78-C-22-0208, Pittsburgh<br />
Energy Technology Center, October (1979).<br />
P. S. Virk, L. E. Chambers, and H. N. Woebcke, "Thermal Hydrogasification of<br />
Aromatic Compounds," in Coal Gasification," L. G. Massey, ed., Adv. in Chem.<br />
Series 131, ACS, Washington, D. C. (1974).<br />
R. J. Silsby, and E. W. Sawyer, "The Dealkylation of Alkyl Aromatic Hydro-<br />
carbons-I.<br />
The Kinetics and Mechanism of Toluene Decomposition in the<br />
Presence of Hydrogen," J. Appl. Chem., 6, 347 (1956).<br />
G. A. Davies, and R. Long, "The Kinetics of the Thermal Hydrocracking of<br />
Cresols," J. Appl. Chem., 15, 117 (1965).<br />
S. E. Shull, and A. N. Hixson, "Kinetics of Thermal Hydrodealkylation of<br />
Mesitylene, m-Xylene and Toluene," Ind. Eng. Chem., Proc. Des. Dev., 5 (Z),<br />
146 (1966).<br />
W. K. Betts, F. Popper, and R. I. Silsky, "The Dealkylation of Alkyl Aro-<br />
matic Hydrocarbons-11. The Dealkylation of Coal tar Naphthas," J. Appl.<br />
Chem., 7, 497, (1957).<br />
M. Szwarc, "The C-H Bond Energy in Toluene and Xylenes," J. Chem. Phys., 16<br />
(2), 128 (1948).<br />
B. W. Jones, and M. B. Neuworth, "Thermal Cracking of Alkyl Phenols," Ind.<br />
Eng. Chem., 44 (12), 2872 (1952).<br />
S. K. Gangwal, J. Fathikalaji and G. B. Wills, "Breaks in Behavior of a<br />
Tungsten-Oxide on Silica Catalyst in Propylene Disproportionation," Ind.<br />
Eng. Chem. Product Res. Dev., 16 (3), 23 (1977).<br />
Linares-Salano, A., 0. P. Mahajan, and P. L. Walker, Jr., "Reactivity of<br />
Heat Treated Coals in Steam," Fuel, 58, 327 (1979).<br />
Hippo, E., and P. L. Walker, Jr., "Reactivities of Heat-Treated Coals in<br />
Carbon Dioxide at 9OO"C," Fuel, 54, 245 (1975).<br />
Jenkins, R. G., S. P. Nandi, and P. L. Walker, Jr., "Reactivities of Heat-<br />
Treated Coals in Air at 500"C," Fuel, 52, 288 (1973).<br />
37
MODEL STRUCTURE FOR A BITUM<strong>IN</strong>OUS COAL<br />
L. A. Heredy I. Wender<br />
Energy Systems Group Office of Advanced Research and Technology<br />
Rockwell International Corporation<br />
8900 De Soto Avenue<br />
Canoga Park, California 91304<br />
Office of Fossil Energy<br />
Department of Energy<br />
Washington, DC 20545<br />
Studies on coal genesis and investigations of the chemical constitution of<br />
coal indicate that bituminous coal has a macromolecular structure in which a large<br />
number of basic units of condensed ring structures are connected by aliphatic and<br />
heteroatom bridges.<br />
Various aromatic and heterocyclic structures have been identi-<br />
fied as constituents of the coal, and several research data suggest the presence<br />
of hydroaromatic rings.<br />
Because of the complexity of the coal structure, it is very difficult to<br />
present a concise summary of the available structural information. One of the<br />
approaches, which has been used to summarize and to illustrate the main chemical<br />
structural features of coal, is the construction of "model coal molecules."<br />
Although many details of model coal structures are necessarily qualitative in<br />
nature and need to be updated as new research data become available, the derivation<br />
and construction of model molecular structures for coal serve an important purpose<br />
because they help the coal researcher to summarize and evaluate the consistency of<br />
experimental data from a structural viewpoint and to identify key areas where more<br />
research is needed.<br />
An important application of model structures was reported by van Krevelen (l),<br />
who proposed formulae for the aromatic constituents of coals at different stagesof<br />
coalification. More recently, Given (2), Wiser (?), and Gibson (4) have proposed<br />
model molecular structures for high-volatile bituminous coals of approximately<br />
82 to 83% C content. While there are significant differences among these proposed<br />
structures, several of their basic features are similar:<br />
they all contain rela-<br />
tively small condensed aromatic ring systems, consisting on the average of two to<br />
four condensed rings; flourene- and phenanthrene-type condensed aromatic rings<br />
predominate; the nonaromatic part of the molecule consists mostly of hydroaromatic<br />
rings; and there are few alkyl (mainly methyl) groups.<br />
The large amount of new structural information that has been obtained in<br />
recent years on bituminous coals warrants an updating of model coal structures.<br />
One of the most important coal structural properties, the carbon aromaticity has<br />
been determined directly by sol id-state carbon-13 NMR spectroscopy using 1H-1% crosspolarization<br />
(5,6) and magic-angle spinning (7,8). The average size of condensed<br />
aromatic strucTuFes in high-vol ati le bi tuminouscoal s has been estimated on the<br />
basis of investigations of coal extracts (9,s). A new oxidative degradation<br />
technique has been developed to investigate the aliphatic structures in coal (11).<br />
Many additional new data have been forthcoming about a variety of subjects deaTTng<br />
with coal structural research, such as the distribution of oxygen in bituminous<br />
coal among different functional groups, the characterization of heterocyclic<br />
compounds in coal extracts, and the detailed structural characterization of coal<br />
extracts and coal liquefaction products.<br />
The research that has been carried out on the structural characterization of<br />
coal extracts and coal hydrogenation products is of particular interest. A1 though<br />
the structural features of these products differ in various degrees from those of<br />
the parent coal, structural investigations with such materials can be conducted<br />
with greater accuracy because their solubility allows the application of a number<br />
of separation and analytical techniques that cannot be used with coal. The struc-<br />
tural characterization of these materials generally consists of solvent and<br />
38
chromatographic fractionation, followed by ultimate analysis, high-resolution<br />
proton and carbon-13 NMR spectrosocpy, molecular weight, and phenol ic-OH measurements<br />
of the fractions. Two recent structural studies of this type have been used<br />
for the derivation of model molecular structures. Bartle et al. (lo) carried out<br />
the structural analysis of extracts obtained from high-volatile bituminous coal by<br />
supercritical-toluene extraction at 400 C. It was concluded that one of the<br />
extracts, which represents 27% of the coal, contains small aromatic units held<br />
together by methylene, heteroatom, and biphenyl linkages. Approximatley 30% of the<br />
available sites of the aromatic skeleton are occupied by alkyl and naphthenic<br />
groups. Farcasiu (12) investigated the structure of coal liquids produced by the<br />
Solvent Refined CoalProcess. The proposed average structure of one of the major<br />
fractions ("polar aromatics") consists of a benzofuran ring which has a phenyl and<br />
a naphthyl group as substituents. In other fractions the presence of benzene,<br />
benzofuran, and condensed hydroaromatic rings is indicated.<br />
The model coal molecule described in this paper is presented with the follow-<br />
ing objectives: (I) to incorporate into the model new structural information that<br />
has become available in recent years, (2) to derive additional input data for the<br />
model molecule by means of a mathematical analysis, and (3) to test the model by<br />
comparing the experimentally observed behavior of a high-volatile bituminous coal<br />
in a number of chemical reactions with the expected behavior of the model molecule<br />
in the same reactions.<br />
Experimental Input Data<br />
The composition of a vitrain concentrate from a typical high-volatile bituminous<br />
coal was selected for this study because many basic research data are available<br />
in the literature for coals of this rank.<br />
Input data included the elemental composition; the aromaticity of the coal, the<br />
structural formulaeofthe aromatic constituents, and the distribution of the heteroatoms<br />
among the different functional groups. The elemental composition and the general<br />
formula of the coal are shown in Table 1. The general formula was calculated<br />
for a unit containing 100 carbon atoms, corresponding to a "molecular weight" of<br />
about 1450. This molecular weight is, of course, arbitrary; as indicated in Figure 1,<br />
this "molecule" is connected to other parts of a larger structure (linkages-P).<br />
TABLE 1<br />
CHARACTERIZATION <strong>OF</strong> HIGH-VOLATILE BITUM<strong>IN</strong>OUS COAL<br />
USED <strong>IN</strong> MODEL STRUCTURE STUDIES<br />
Elemental Composition<br />
(dmnf basis) (wt %) (atom %)<br />
83.2 53.1<br />
5.5 42.0<br />
7.7 3.7<br />
N 1.1 0.6<br />
S (w.1 2.5 0.6<br />
General Formula (100 C basis):<br />
Carbon Aromaticity: fa = 0.70<br />
Total 100.0 100.0<br />
39<br />
C100H790,NS
The value of the carbon aromaticity (fa) of coals of 82 to 83% C content has<br />
been measured by a number of different methods. Oryden (13) found a value of<br />
fa = 0.66 using infrared and high-resolution proton-NMR spectroscopic measurements<br />
made with a coal of 82.5% C content and with extracts of the same coal. Work by<br />
Heredy et al. (14,15), based on acid-catalyzed depolymerization of a high-volatile<br />
bituminous coalnrthe high-resolution proton-NMR spectra of the depolymerization<br />
products, gave f, = 0.65. Retcofsky (9) found fa = 0.73 by investigating coal<br />
extracts using hlgh-resolution proton-mMR spectroscopy. The investigation of a<br />
sol id coal by Vanderhard and Retcofsky (2) using cross-polarization carbon-13 NMR<br />
spectroscopy gave fa = 0.76. The average of these values (fa = 0.70) was used in<br />
this work.<br />
The aromatic structures used in the construction of the model molecule are<br />
shown in Figure 2. They were selected on the basis of the following experimental<br />
information. Oryden (13) estimated that the average number of condensed rings in<br />
the aromatic part of tG structure of high-volatile bituminous coal with C = 82.5%<br />
was less than three. Retcofsky (z), as well as Heredy et al. (E,S), estimated<br />
that in the same type of coal the average number of condensed rings in the aromatic<br />
part of the structure was about three. Naphthalene and phenanthrene were selected<br />
as specific condensed aromatic structures for use in the construction of the model<br />
molecule because these compounds were found frequently in coal extracts (16).<br />
With regard to the selection of specific heterocyclic constituents, the findings<br />
of Kessler et al. (16) and Sternberg et al. (17) were used. It has been shown (16)<br />
that a sizeable frazion of the organic sulfuFin the coal is in benzothiophenetype<br />
structures, and much of the oxygen is in benzofuran- or dibenzofuran-type<br />
structures. Carbazole has been identified (c) as one of the nitrogen-containing<br />
aromatic structures in coal hydrogenation products.<br />
The following distribution was used for the oxygen among the different<br />
structural positions. Of the seven oxygen atoms in the model molecule, four were<br />
located in phenolic-OH groups on the basis of the work of Friedman et al. (18).<br />
One oxygen atom was located in an aromatic ether linkage on the basis of daK<br />
published by Ignasiak and Gawlak (B), and one was located in a dibenzofuran<br />
structure as discussed before (16). It was assumed that one oxygen atom was in a<br />
cyclic aliphatic ether structure,<br />
The five constituent aromatic structures of the model molecule are interconnected<br />
by five bridges. One of the bridges is the aromatic ether linkage<br />
mentioned in the previous paragraphs; the other four are aliphatic hydrocarbon<br />
structures.<br />
Mat hema ti ca 1 Analysis<br />
No independent experimental data were used to obtain the structural characteristics<br />
of the nonaromatic part of the model molecule. This information was<br />
derived from the general formula of the model molecule and the structural formulae<br />
of the aromatic constituents of the model molecule (Figure 2) using a mathematical<br />
analysis. A method applied by Whitehurst et al. (20) was used as the basis for<br />
developing this analysis. The complete analysis wTl be presented in a more<br />
detailed report.<br />
In essence, the analysis involves the construction of a matrix. The vertical<br />
columns list a series of aromatic H contents for the aromatic part of the molecule<br />
(corresponding to different degrees of aromatic substitution). The horizontal<br />
lines list different types of aliphatic and hydroaromatic substituents that can be<br />
attached to the aromatic part of the model molecule (aliphatic chains, single cr<br />
condensed hydroaromatic rings - Figure 3). Both the percentage of aromatic hydrogen<br />
content of the aromatic Part of the model molecule and the structural configuration<br />
of the nonaromatic part of the model molecule can be expressed in terms of the<br />
40
number of positions that can be substituted in the aromatic and in the nonaromatic<br />
Parts of the model molecule, respectively. Matching those aromatic hydrogen<br />
contents and aliphatic structural types in the matrix, which can accept the same<br />
number of substituents, identifies the percentage of aromatic hydrogen content of<br />
the model molecule as well as the a1 iphatic/hydroaromatic structural configuration.<br />
When the procedure described in the previous paragraph is carried out using<br />
the input data given in Table 1 and Figures 2 and 3, it is found that the best<br />
match of aromatic and aliphatic substitutions is obtained at an aromatic H content<br />
Of about 30%. Furthermore, the analysis indicates that most of the nonaromatic<br />
structures are composed of hydroaromatic rings of the types of Structures 4, 7,<br />
and 8 (Figure 3).<br />
On the basis of this analysis, hydroaromatic structures of<br />
these types were used to construct the nonaromatic part of the model molecule.<br />
The proposed structure of the model molecule is shown in Figure 1. The distribu-<br />
tion of carbon, hydrogen, and heteroatoms among different structural positions in<br />
the model molecule is shown in Table 2.<br />
TABLE 2<br />
CHARACTERISTICS <strong>OF</strong> <strong>THE</strong> MODEL COAL MOLECULE<br />
Hydroaromatic Ring<br />
Other Alpha Phenolic<br />
Element<br />
Total<br />
No. of<br />
Atoms<br />
Aromatic<br />
No. %<br />
Alpha<br />
No. %<br />
Beta<br />
No. %<br />
A1 iphatic<br />
No. %<br />
OH<br />
No. %<br />
Hydrogen 79 23 29.1 21 26.6 20 25.3 11 13.9 4 5.1<br />
Carbon 100 70 70.0 13 13.0 12 12.0 5 5.0 - -<br />
Aromatic<br />
Ether Heterocyclic<br />
Phenolic<br />
OH<br />
No. % No. % No. %<br />
Oxygen 7 1 14.3 2 28.6<br />
Nitrogen 1 - -<br />
Sulfur 1 - -<br />
Evaluation of Chemical Reactions<br />
1 100.0<br />
1 100.0<br />
4 57.1<br />
- -<br />
It is of interest to compare the expected behavior of the model molecule in<br />
some of the chemical reactions which have been used to investigate bituminous coals<br />
with the experimentally observed behavior of high-volatile bituminous coals.<br />
A large fraction of the hydrogen atoms, 41 of the 79 in the model molecule,<br />
are in hydroaromatic structures. Of these, 24 hydrogen atoms would be expected to<br />
evolve as hydrogen gas under the catalytic dehydrogenation conditions used by<br />
Reggel et al. (3). The experimentally obtained number for vitrain concentrates<br />
of 82.5 to 84.0% C content was 23 to 30 H atoms evolved per 100 carbon atoms.<br />
The expected effect of reduction of the model molecule with lithium-ethylenediamine<br />
was estimated by using experimental data obtained on the reduction of a<br />
variety of organic compounds by Reggel et al. (22). It was estimated that the<br />
model molecule would take up 24 H atoms. The experimentally obtained number for<br />
vitrain concentrates of 82.5 to 84.0% C contents was the addition of 21 to 22 H<br />
atoms per 100 C atoms (g).<br />
41
The expected reactivity of the model molecule in phenol-BFj-catalyzed depolymerization<br />
can be evaluated (a). The bonds on both sides of the CH2-bridge would<br />
break because they are bonded to reactive aromatic sites on a phenanthrene and on<br />
a OH-activated phenanthrene ring, respectively. Furthermore, the bond between the<br />
OH-activated phenanthrene ring and the -CH2-CH-group of the hydroaromatic ring<br />
would break. These interactions would release and solubilize the phenanthrothiophene-based<br />
fragment from the rest G f the molecule. The yield of this depoly-<br />
merization product nould be 27%. Heredy et al. obtained a net phenol-soluble<br />
depolymerized product yield of 29% i n a phenol-BF catalyzed depolymerization<br />
experiment using a coal of 82.4% C content (g,gjI<br />
The treatment of the model molecule with a reagent mixture consisting of<br />
trifluoroacetic acid, hydrogen peroxide, and sulfuric acid would give a mixture of<br />
carboxylic acids (11). The principal low molecular weight products would be<br />
acetic acid and sucinic acid, formed in a ratio of 3 to 8 on a hydrogen basis<br />
from the cxidation of the methyl group and the two -CH CH2 groups. The actual<br />
testing of high-volatile bituminous coals by Deno et a?: (i) showed that these<br />
two acids are the predominant products with an acetic acid to succinic acid ratio<br />
of about 1 to 3.<br />
In summary, a model chemical structure was derived for a high-volatile bituminous<br />
coal of 83% C content, using the elemental composition, the distribution of<br />
heteroatoms among different functional groups, the carbon aromaticity, and the<br />
formulae of the constituent aromatic structures as input data. A mathematical<br />
method was used to calculate the value of the hydrogen aromaticity and to derive<br />
the formulae of the nonaromatic constituents of the model structure.<br />
The experimentally observed behavior of bituminous coal vitrains in a number<br />
of chemical reactions was compared with the expected behavior of the model structure<br />
in the same reactions. The following chemical reactions of coal were examined:<br />
catalytic dehydrogenation in boiling phenanthridine using palladium catalyst;<br />
reduction with lithium-ethylenediamine; acid-catalyzed depolymerization using<br />
phenol-boron trifluoride catalyst; and oxidation with a mixture of trifluoroacetic<br />
acid, hydrogen peroxide, and sulfuric acid. Good agreement was found for all of<br />
these reactions between the experimentally obtained product distributions from<br />
vitrain and the product distributions that would be expected under similar conditions<br />
from the Kodel structure.<br />
42
1.<br />
2.<br />
3.<br />
4.<br />
5.<br />
REFERENCES<br />
D. w. van Krevelen, Coal, Elsevies Publishing Company (1961) pp 433-480<br />
P. H. Given, Fuel, 39, 147 (1960)<br />
W. H. Wiser, Proc. EPRI Conference on Coal Catalysis, Santa Monica, California<br />
(1973)<br />
J. Gibson, The Constitution of Coal and Its Relevance to Coal Conversion Proc-<br />
esses, The Robens Coal Science Lecture, BCURA, London (1977)<br />
D. L. Vanderhart and H. L. Retcofsky, Fuel, 55, 202 (1976)<br />
6. A. Pines and D. E. Werner, Symposium on New Analytical Methods, 175th ACS<br />
Meeting, Fuel Chem. Div. Paper No. 39 (1978)<br />
7. K. W. Zilm, R. J. Pugmire, D. M. Grant, R. E. Wood, and W. H. Wiser, Fuel, 58,<br />
11 (1979)<br />
8.<br />
9.<br />
V. J. Bartuska, G. E. Mociel, and F. P. Miknis, Symposium on New Analytical<br />
Methods, 175th ACS Meeting, Fuel Chem. Div. Paper No. 40 (1978)<br />
H. L. Retcofsky, Applied Spectroscopy, 31, 116 (1977)<br />
10. K. D. Bartel, W. R. Ladner, T. G. Martin, C. E. Snape, and D. F. Williams,<br />
Fuel, 58, 413 (1979)<br />
11. N. C. Deno, B. A. Greigger, and S. G. Stroud, Fuel, 57, 455 (1978)<br />
12. M. Farcasiu, Fuel, 56, 9 (1977)<br />
13. I. G. C. Dryden, Coal, in Kirk-Othmer's Encyclopedia of Chemical Technology,<br />
Volume 5, John Wiley and Sons, Inc. (1964) pp 640-641<br />
14. L. A. Heredy, A. E. Kostyo, and M. B. Fleuworth, Fuel, 44, 125 (1965)<br />
15. L. A. Heredy, A. E. Kostyo, and M. 8. Neuworth, Coal Science, Advances in<br />
Chemistry Series, 55, 493 (1966)<br />
16.<br />
T. Kessler, R. Raymond, and A. G. Sharkey, Jr., Fuel, 48, 197 (1969)<br />
17. H. W. Sternberg, R. Raymond, and F. K. Schweighardt, Science, 188, 49<br />
18. S. Friedman, M. L. Kaufman, W. A. Steiner, and I. Hender, Fuel, 40, 33<br />
19. B. S. Ignasiak and M. Gawlak, Fuel, 56, 216 (1977)<br />
975)<br />
1961)<br />
20. D. D. Whitehurst, M. Farcasiu, T. 0. Mitchell, and J. J. Dickert, Jr., Nature<br />
and Origin of Asphaltenes in Processed Coals, Section 7, 1977 Annual Report,<br />
EPRI AF-480<br />
21. L. Reggel, I. Wender, and R. Raymond, "Catalytic Dehydrogenation of Coal.<br />
111. Hydrogen Evolution as a Function of Rank," Fuel, 47, 373-89 (1968)<br />
22.<br />
L. Reggel, C. Zahn, I. Wender, and R. Raymond, "Reduction of Coal by Lith!um-<br />
Ethylenediamine and Reaction of Model Compounds with Metal-Amine Systems,<br />
Bureau of Mines Bulletin 615 (1965)<br />
23. L. A. Heredy, Preprints, ACS Div. Fuel Chem., 4, No. 1, 142 (1979)<br />
43
HO CHZ<br />
\<br />
CH -CHZ<br />
/<br />
CHZ CH-CH<br />
\ / \<br />
CHZ-CH<br />
CH -CH2<br />
I<br />
P<br />
0 0 .CH<br />
ti<br />
CH2 OH<br />
P<br />
0<br />
Figure 1. Proposed Structure of the Model Coal Molecule<br />
CH<br />
/<br />
GENERAL FORMULA <strong>OF</strong> AROMATIC PART: C,0H490NS<br />
Figure 2. Aromatic Constituents of the Model Molecule<br />
44
mcH2-cH<br />
7H3 7H3<br />
CHZ CH2<br />
6.<br />
Figure 3. Basic Configurations of<br />
C6 A1 iphatic Structures<br />
45
<strong>IN</strong>TRODUCTION<br />
<strong>THE</strong> APPLICATION <strong>OF</strong> FOURIER TRANSFORM <strong>IN</strong>FRARED SPECTROSCOPY<br />
TO <strong>THE</strong> CHARACTERIZATION <strong>OF</strong> COAL STRUCTURE<br />
Paul C. Painter and R. W. Snyder<br />
Materials Science and Engineering Department<br />
Steidle Building<br />
The Pennsylvania State University<br />
University Park, PA 16802<br />
Infrared spectroscopy is an important and widely used analytical tool for determining<br />
the structure of organic materials. Most of the fundamental work on applying<br />
this technique to coal characterization was performed in the 1950's 2nd 1960's and<br />
has been reviewed in a number of articles (1-4). These studies were limited by two<br />
major problems. First, coal absorbs strongly in the infrared so that in conventional<br />
dispersive instruments only a weak signal reaches the detector, producing relatively<br />
poor spectra. Second, the overlap and superposition of the absorption bands of such<br />
complex multicomponent systems result in spectra consisting of broad features with<br />
little fine structure, so that only a general, mainly qualitative, identification of<br />
a few functional groups has so far been possible.<br />
The introduction of computerized Fourier transform infrared spectrometers opens<br />
up new possibilities for the spectroscopic characterization of coal and coal derived<br />
liquids. There are several advantages of FTIR compared to dispersive instruments,<br />
discussed in detail in a number of reviews (5-7). Essentially, the use of an interferometer<br />
rather than a system of gratings and slits results in a higher energy<br />
throughput to the detector. This, coupled with the ability of such internally<br />
calibrated computerized systems to co-add a large number of interferograms, results<br />
in markedly superior spectra, particularly in the energy limiting situations encountered<br />
in coal studies. The resulting multiplexed spectrum can then be scale-expanded<br />
by the computer to display subtle features without undue interference from background<br />
noise. However, in coal studies it has been our experience that the most<br />
significant results can be obtained by applying the types of computer routines that<br />
have recently become associated with FTIR, particularly spectral subtraction and<br />
least squares curve fitting. In fact, the first application of FTIR to the characterizatioc<br />
of coal in this laboratory depended more on such computer manipulations<br />
than on the enhanced sensitivity of these instruments. Methods for the complete<br />
analysis of the major mineral components present in coal have been developed (8-11).<br />
We have also applied FTIR to a number of problems concerning the organic structure<br />
of coal, including studies of solvent refined coal (12) and the changes that occur<br />
upon carbonization (13) and oxidation (14,lS). In this communication we will initially<br />
discuss the application of recently introduced FTIR computer routines to the quanti-<br />
tative determination of species present in coal, both inorganic and organic.<br />
We will<br />
then conclude by considering the utility of these methods in determining variations<br />
in structure as a function of position in a seam.<br />
RECENT DEVELOPMENTS <strong>IN</strong> <strong>THE</strong> ANALYSIS <strong>OF</strong> M<strong>IN</strong>ERAL MATTER <strong>IN</strong> COAL BY FTIR<br />
Recent work in this laboratory has demonstrated that FTIR offers considerable<br />
potential for quantitatively determining the major mineral components present in coal<br />
or, more precisely, present in the low temperature ash (LTA)(8-11).<br />
Essentially, the procedure consists of the successive subtraction of :he spectra<br />
of mineral "standards" from the spectrum of the LTA. As the bands of the most pre-<br />
valent or most highly absorbing minerals are removed, those of the weakly absorbing<br />
or less prevalent components are revealed, allowing a more complete and accurate<br />
analysis. It was found that all major coxponents (those constituting at least<br />
3-4% by weight) could be determined, providing that appropriate mineral "standards"<br />
are available.<br />
46
Despite the obvious potential and advantages of the FTIR method, there are still<br />
major problems. Perhaps the most critical of these is the availability of suitable<br />
standards. This problem is particularly acute in the analysis of clays, but not one<br />
unique to FTIR since other methods also rely on standards for calibration of band and<br />
line intensities. One solution to this problem that is particularly suited to FTIR<br />
is the compilation of an extensive mineral library, because spectra of these materials<br />
can be routinely and conveniently stored on disk or magnetic tape and recalled at any<br />
future time. We are in the process of building such a library, but it is already<br />
apparent that we have in some respects substituted one problem for another. How do<br />
we choose the "correct" OK most appropriate standard for a particular analysis? For<br />
example, we have kaolinite samples from different geographic localities that differ<br />
subtly in their spectra according to parameters such as degree of crystallinity.<br />
Finally, even if by luck or judgement we choose an appropriate mineral spectrum for<br />
a Particular analysis, the accuracy of the FTIR method is limited by the essentially<br />
subjective judgement of when bands have been exactly subtracted from a spectrum.<br />
Such errors are not large for major components having strong well resolved bands,<br />
but can become critical in determining low concentrations of certain species. We<br />
believe that the application of least squares curve fitting programs, first described<br />
by Koenig and co-workers (16), offer at least a partial solution.<br />
The utility of the method is best illustrated by a simple example. Figure 1<br />
compares the FTZR spectra of three individual clays. Also included is the spectrum<br />
of a mixture of these three clays, which (as noted above) is extremely difficult to<br />
quantitatively analyze by other methods. The least squares program was then asked<br />
to fit the spectra of seven standards to the spectrum of the mixture. We deliberately<br />
included spectra of mineral standards that we knew were not contained in the<br />
snythetic mixture in order to test the utility and accuracy of the procedure. The<br />
results are shown in Table 1 and the resulting "composite" spectrum is compared to<br />
that of the original mixture in Figure 2. The composite spectrum was constructed by<br />
adding the spectra of the components weighted according to the parameters determined<br />
in the least squares analysis. Not only did the program pick the correct clays in<br />
spite of the similarity in their spectra, but also was able to distinguish between<br />
two kaolinites from different origins. This latter result was somewhat of a surprise<br />
because the spectra of the two kaolinites are extremely similar, as can be seen<br />
from Figure 3, differing only slightly in the relative intensities of one or two<br />
bands.<br />
In addition to quickly and conveniently "picking" the right components,<br />
the program also gave directly a quantitative measure of the clays present that is<br />
in very good agreement with the weighed quantities. (This direct measure was pos-<br />
sible because we normalized all spectra by dividing them by a number equal to the<br />
weight of material in the KBr pellet.) The analysis can be improved by then reject-<br />
ing all components with minor and negative contributions to the fit. Clearly, if we<br />
are examining a low temperature ash we would then have to check that we were not<br />
eliminating a true minor component by subtracting the spectrum of the major components<br />
from that of the ash (using the subtraction parameters also determined by the least<br />
squares fit program).<br />
In applying this technique to the analysis of an LTA we use the least squares<br />
curve-fitting procedure to first pick the "best" standards from a given set. As in<br />
the analysis of the simple mixtures we can then reject those mineral spectra that<br />
have negative subtraction coefficients (but not necessarily those with the small<br />
positive contributions) and repeat the fit. The least squares coefficients,<br />
(corresponding to the subtraction parameters) determined by this final analysis are<br />
then a quantitative measure of the contribution of each mineral. Finally, a check<br />
on the accuracy of the results can be obtained by sequentially subtracting the spec-<br />
trum of each component. This ensures that minor components have not been inadver-<br />
tently ignored.<br />
Although this procedure sounds tedious, these tasks are in fact performed rou-<br />
47
tinely and quickly by the FTIR mini-computer. As an example we will consider the<br />
results of the analysis of the LTA of an Illinois C6 coal, as presented in Table 2.<br />
The percentage weight fraction figures were taken directly from the solution vector.<br />
Two clays were determined to have a negative contribution, one of them to our ini-<br />
tial surprise was the Illinois kaolinite. Our preconceptions were that an Illinois<br />
kaolinite would be the best standards for an analysis of an Illinois coal. However,<br />
the fundamental difference in these two standards is probably the degree of crystal-<br />
linity (11). Consequently, the kaolinite in this sample appears to have a degree of<br />
cyrstallinity that is better approximated by the Georgia kaolinite. The least squares<br />
fit was repeated after the removal of the Illinois kaolinite and illite spectra from<br />
the refinement. These results are also presented in Table 2 where they are compared<br />
to the results taken from traditional infrared and x-ray methods. It can be seen<br />
that there is good agreement for those minerals determined by both techniques. How-<br />
ever, traditional procedures were not capable of accurately determining clays, whereas<br />
the FTIR method does provide what appears to be a reasonable analysis of these mate-<br />
rials.<br />
We did not determine pyrite by FTIR because this mineral does not have absorption<br />
bands in the spectral range (1500-500 cm-l) used in this study. This mineral can be<br />
routinely determined by FTIR techniques in the far infrared region (8). Nevertheless,<br />
the amount of material unaccounted for by the FTIR analysis is of the same order of<br />
magnitude as the concentration of pyrite determined by x-ray diffraction, strongly<br />
suggesting that by extending the spectral range of the analysis a complete determination<br />
of the major mineral components of this coal is possible. We believe the potential<br />
of this and other programs (factor analysis, etc.) for solving the problems<br />
presented by the determination of mineral matter in coal are only now being realized,<br />
but it is apparent that a good analysis of all major components can already be performed<br />
using FTIR.<br />
<strong>THE</strong> QUANTITATIVE DETERM<strong>IN</strong>ATION <strong>OF</strong> HYDROXYL FUNCTIONAL GROUPS <strong>IN</strong> COAL<br />
We are in the process of developing techniques to quantitatively determine functional<br />
groups present in coal. As an example we will consider the determination of<br />
-OH groups. The 0-H stretching mode appears near 3400 cm-' in the spectra of coal.<br />
However, direct measurements ofthe intensity of this band cannot be used to determine<br />
such groups. A major problem is that the alkali halides used in sample preparation<br />
absorb water, which absorbs strongly in this spectral range. Some of the absorbed<br />
water appear to be in a bound state since it has been reported that heating to about<br />
300'C is required for complete removal. Furthermore, coals also contain absorbed<br />
water in amounts that appear to vary according to rank and other parameters. Finally,<br />
the success of applying spectral subtraction and other procedures associated<br />
with FTIR leads us to believe that the best method for determining functional groups,<br />
particularly those containing oxygen, will prove to be a combination of chemical<br />
and FTIR procedures. For example, the infrared spectrum of a coal from Arizona is<br />
compared to the spectrum of the same sample subsequent to acetylation in Figure 4.<br />
Bands due to acetyl groups are clearly visible but it would be a difficult task to<br />
use these bands to determine the number of acetyl groups introduced and hence the<br />
number of 0-H groups that have been reacted. Although suitable model compounds are<br />
available to obtain the extinction coefficients of the characteristic C=O, CH and<br />
C-0 bands near 1765, 1370 and 1200 cm-1 respectively, there is a major problem<br />
3<br />
in<br />
measuring the intensity of these bands using traditional infrared methods because of<br />
overlap with the absorption bands of the coal. However, with FTIR we can subtract<br />
the spectrum of the unreacted material from that of the reacted to give the difference<br />
spectrum also shown in Figure 4. It can be seen that the characteristic acetyl bands<br />
are now relatively well resolved and it is a straightforward task to draw an appropriate<br />
baseline and measure peak heights or even make integrated absorption measurements.<br />
A plot of peak heights vs. concentration of coal in the KEir pellet is shown<br />
in Figure 5. The slope of these lines isequal to the extinction coefficient of the
acetyl absorption under consideration multiplied by the concentration of such groups<br />
in the coal. This latter parameter has been determined by measurements using other<br />
techniques. Consequently, this calibration allows us to use the results of this<br />
study in determining the concentration OH groups in other coals.<br />
Acetylation usually only'allows a determination of total OH content and does not<br />
allow a discrimination between phenolic and alkyl OH groups. However, using FTIR<br />
these two types of functional groups can be distinguished.<br />
groups leads to ester formation;<br />
Acetylation of coal OH<br />
e<br />
COAL - OH + CH3COOH + COAL - 0 - C - CH3<br />
Alkyl esters normally absorb between 1720 and 1740 cm-'. However, when an<br />
electron withdrawing group such as an aromatic entity is attached to'the single bonded<br />
oxygen this band is shifted to about 1770 cm-l. The strong absorption near 1765 cm-l<br />
in the difference spectrum shown in Figure 4 can therefore be assigned to acetyl<br />
groups that have reacted with phenolic OH, while the weaker shoulder near 1725 cm-l<br />
can be assigned to acetyl groups that have reacted with alkyl OH groups. We are presently<br />
investigating the use of least squares curve resolving techniques in order to<br />
obtain a measure of the relative proportions of these groups, but the potential for<br />
making such measurements is clearly outstanding.<br />
VARIATIONS ON A SEAM<br />
The variation in coal composition according to position in a seam is a problem<br />
not only in the use of this fuel in conversion processes but also in fundamental<br />
research aimed at the elucidation of structure. FTIR is particularly sensitive to<br />
small differences in materials through the use of spectral subtraction and other<br />
computer routines. We have recently examined channel samples along an exploration<br />
adit through a Canadian coking coal (14). It was determined that samples from the<br />
mouth and end of the adit showed extensive oxidation, as measured by free swelling<br />
index, while samples from near the center showed lower degrees of oxidation and still<br />
had good coking properties. The infrared spectra of several stations along the adit<br />
1 .<br />
are shown in Figure 6. The spectra are similar an the only discernable difference<br />
involves the intensity of a shoulder near 1690 cm- , which has a minimum near the<br />
center of the seam. We subtracted the spectrum of a sample from the center of the<br />
adit (70 ft) from the spectra of samples near the extremities in order to detect in<br />
more detail the chemical differences. Scale expanded difference spectra obtained by<br />
subtracting the spectrum of the 70 ft station from that of the 30 ft and 40 ft stations<br />
and the 110 ft and 125 ft stations are shown in Figure 7. These stations represent<br />
the center, mouth and end of the adit respectively. It is apparent that there are<br />
four prominent bands in the 1500 and 1800 cm-l region of the spectrum.<br />
Band assign-<br />
ments are listed in Table 3. Perhaps the most surprising is the presence of a strong<br />
band near 1585 cm-l characteristic of a COO- group.<br />
These results suggested that carbonyl and carboxyl groups were the major products<br />
of oxidation and the principal difference in these samples, according to position in<br />
the seam. This interpretation is in disagreement with other oxidation studies which<br />
have relied on chemical methods to determine groups formed upon oxidation. However,<br />
these latter studies have usually involved oxidation of a sample under laboratory<br />
conditions. There is the possibility that the C=O groups detected in this FTIR study<br />
were due to some sort of natural variability. Consequently, we applied FTIR to the<br />
characterization of coal oxidized in the laboratory. The infrared spectrum of an unoxi-<br />
dized coal is compared to the spectrum of the same sample oxidized for a short time at<br />
elevated temperature (about 150°C) in Figure 8. It can be seen that the major differ-<br />
ence in the two spectra is the appearance of a shoulder near 1695 cm-l in the spectrum of<br />
the oxidized sample. Figure 8 also shows the difference spectrum obtained by subtracting<br />
49
the spectrum of the unoxidized sample from that of the oxidized. The criteria used<br />
to determine the "correct" degree of subtraction was the elimination of the kaolinite<br />
bands at 1035 and 1010 cm-l, since this clay should be relatively unaffected by lowtemperature<br />
oxidation. It can be seen that this subtraction results in the elimination<br />
of the aromatic C-H stretching mode near 3050 cm-l and the aromatic C-H out-of-<br />
plane bending mode between 700 and 900 cm-'.<br />
This is to be expected in that direct<br />
oxidative attack of the aromatic nuclei is unlikely under the oxidation conditions<br />
used in this study and confirms the choice of kaolinite bands as a subtraction<br />
standard.<br />
In contrast to the aromatic C-H bands, the aliphatic C-H stretching modes near<br />
2900 cm-l appear negative, or below the baseline, demonstrating a loss in CH2 groups<br />
upon oxidation. This observation is not particularly novel, as methylene groups in<br />
the benzylic position are well known to be sensitive to oxidation and are probably<br />
the initial site of oxidative attack. However, the difference spectrum reveals new<br />
detail in the 1700 to 1500 cm-I region of the spectrum. The 1695 cm-l band, which<br />
appeared as a weak shoulder in the original spectrum of the oxidized coal, f" now resolved<br />
as a separate band. Furthermore, a prominent new band near 1575 cm- is now<br />
revealed in the difference spectrum. This band is not detectable in the original<br />
spectrum. The 1695 cm-l absorption is probably due to an aryl alkyl ketone while<br />
the 1575 cm-l mode can be assigned to an ionized carboxyl group COO-. Clearly, at<br />
this initial stage of the oxidation these bands represent the major products of<br />
oxidation.<br />
Weak, broad residual absorption between 1200 and 1300 cm-l in the differ-<br />
ence spectrum could possible be due to C-0 bonds, as in phenols or ethers, but we<br />
wculd be hard pressed to identify any separately resolved bands assignable to functional<br />
groups of this type. Nevertheless, bands that can be assigned to such groups<br />
do appear at higher levels of oxidation.<br />
For example, Figure 9 compares .the infrared<br />
spectrum of a coal sample,' oxidized to give 6. 7% oxygen uptake, to the spectrum of<br />
the unoxidized sample. The difference spectrum, obtained using the same subtraction<br />
criteria described above, is also shown in this figure. A prominent difference band<br />
can now be observed near 1200 CUI-1 bands. In addition, a weak shoulder near 1765 cm-1<br />
can now be resolved. This band can be assigned to an ester (see Table 3).<br />
These spectral changes closely parallel those observed in a previous study of the<br />
variation in oxidation of coal according to position in a seam, discussed above.<br />
Consequently, the formation of carbonyl and carboxyl groups is apparently a general<br />
phenomenon during oxidation. This conclusion contradicts the results of some chemical<br />
methods Of characterizing oxidation products, where no change in carboxyl or carbonyl<br />
content was detected and it was proposed that ether cross links are central to loss<br />
of swelling behavior.<br />
CONCLUSIONS<br />
The results reviewed above clearly demonstrate the potential of FTIR for investigating<br />
coal structure. By applying a least squares curve fitting program and spectral<br />
subtraction methods it is possible to quantitatively determine the major mineral<br />
species present in a coal. These methods are also a sensitive probe of changes in<br />
organic structure. We have illustrated their application to the determination of<br />
hydroxyl functional groups and the formation of carbonyl and carboxyl groups during<br />
oxidat ion.<br />
REFERENCES<br />
1. Dryden, I. G. C. in 'The chemistry of coal utilization' (H.H. Lowry, Ed.) Suppl.<br />
2.<br />
Vol. John Wiley and Sons, New York, p. 232 (1963).<br />
Speight, J. B. Applied Spectroscopy Reviews (ed. E. G. Brame, Jr.) 5, 211 (1971).<br />
3. Speight, J. G. in 'Analytical Methods for Coal and Coal Products', (C. Karr, Jr.<br />
ed.), volume 11, 75 (1978), Academic Press.<br />
50
4.<br />
5.<br />
6.<br />
7.<br />
8.<br />
9.<br />
10.<br />
11.<br />
12.<br />
13.<br />
14.<br />
15.<br />
16.<br />
Brown, J. K. J. Chem. SOC. 744 (1955).<br />
Griffiths, P. R. Chemical Infrared Fourier Transform Spectroscopy, 1975,<br />
John Wiley and Sons, New York.<br />
benig, J. L., Applied Spectroscopy, 1975, 29, 293.<br />
Coleman, M. M. and Painter, P. C., J. Macromol. Sci. Revs. Macromol.<br />
Chem. C16(2), 197 (1978).<br />
Painter, P. C., Coleman, M. M., Jenkins, R. G., bhang, P. W. and Walker, P. L., Jr.,<br />
Fuel, 57, 337 (1978).<br />
Painter, P. C., Coleman, M. M., Jenkins, R. G. and Walker, P. L., Jr., Fuel,<br />
57, 125 (1978).<br />
Painter, P. C., Snyder, R. W., Youtcheff, J., Given, P. H., Gong, H. and Suhr, N.,<br />
Fuel (in press).<br />
Painter, P. C., Snyder, R. W., Stepusin, S. and Davis, A. Applied Spectroscopy<br />
(submitted).<br />
Painter, P. C. and Coleman, M. M., Fuel, Vol. 58, 301 (1979).<br />
Painter, P. C., Yamada, Y., Jenkins, R. G., Coleman, M. M., and Walker, P.L., Jr.,<br />
Fuel, Vol. 58, 293 (1979).<br />
Painter, P. C., Snyder, R. W., Pearson, D. E. and Kwong, J., Fuel (in press).<br />
Painter, P. C., Coleman, M; M., Snyder, R. W., Mahajan, O., Kamatsu, M., and<br />
Walker, P. L., Jr., Fuel (accepted for publication).<br />
Antoon, M. H., Koenig, J. H and Koenig, J. L. Applied Spectroscopy 31, 518<br />
(1977).<br />
Mineral<br />
TABLE 1<br />
ANALYSIS <strong>OF</strong> XIYERAL MIXTURE BY LEAST SQUARES FTIR.<br />
Kaolinite (Illinois)<br />
Kaolinite (Georgia)<br />
Illite<br />
Montmorillonite<br />
Mica/Montnorillonite<br />
Quartz<br />
Calcite<br />
Wt.<br />
Fraction As<br />
Prepared (%)<br />
51<br />
50<br />
0<br />
0<br />
25<br />
25<br />
0<br />
0<br />
Initial<br />
Least Squares<br />
FTIR halvsis<br />
47<br />
-0.3<br />
3<br />
31<br />
29<br />
-9<br />
-0.2<br />
Final<br />
Least Squares<br />
FTIR Analysis<br />
46<br />
0<br />
0<br />
24<br />
30<br />
0<br />
0
Mineral<br />
Kaolinit e (Illinois)<br />
Kaolinite (Georgia)<br />
Quartz<br />
Calcite<br />
TABLE 2<br />
ANALYSIS <strong>OF</strong> LON TEX'EIWTUFE AS3<br />
(ILLI?IOIS e6 COAL, 'ROLTD ROB<strong>IN</strong>' SAHPLE)<br />
Wt. Fraction Wt. Fraction Bt. Fraction<br />
By FTIR By FTIR By X-ray<br />
Least Squares Least Squares<br />
Analysis I -- P.nalysis 2<br />
-12<br />
0<br />
20<br />
13<br />
And Conventional<br />
IR Nethods Z<br />
1<br />
~<br />
13.5<br />
24 25 20<br />
6 7 6<br />
Pyrite NfD NID 20<br />
Montmorillonite<br />
21 18<br />
b1ical!.!ontmorilloni te<br />
16 9<br />
jN/D I<br />
Illite -6 1 1<br />
TOTAL<br />
- 697:<br />
-<br />
72% 59.5%<br />
L7IACCOm!TED FOR 31% - 287: - LO. 5::<br />
N/D - not dererminea.<br />
I " ~ l " ' l " ' l " ' l J ~<br />
1 q00 12@@ 1000 800 600 c--'<br />
Figure 1: Scale expanded FTIR spectra in the range 500-1500 cm-' of three<br />
clays, mica-montmorillonite, montmorillonite and kaolinite. The<br />
spectrum shown at the top is that of 1:1:2 mixture by weight of<br />
the three clays respectively. 52<br />
1
- TABLE 3<br />
BAND ASSIGNMENTS FOR <strong>THE</strong> <strong>IN</strong>FRARED SPECTRA <strong>OF</strong>-<strong>COALS</strong><br />
ALIPHATIC AND AROMATIC OXYGEN CONTA<strong>IN</strong><strong>IN</strong>G<br />
GROUPS FUNCTIONAL GROUPS<br />
Wave Number ASSIGNKENT Wave Numher Assignment<br />
-1<br />
cm-' cm<br />
1030 Aromatic C-il<br />
2950 sh<br />
CH3<br />
2920 1 ( Aliphatic -CH<br />
2850 1 CHZ and CH3<br />
1600<br />
1490 sh<br />
1450<br />
1375<br />
Aromatic Ring<br />
Stretch<br />
Aromatic Ring<br />
Stretch<br />
CH and CH Bend<br />
Po&ibilit: of Some<br />
Aromatic Ring Hodrs<br />
CH Groups<br />
900-700 Aromatic C-H out-of-plane<br />
bending modes<br />
860 Isolated Aromatic H<br />
833 (Weak) l,i Substitueed<br />
AroLaric Groups<br />
815 Isolated H and/<br />
or 2 Neighboring H<br />
750 1.2 Substituted<br />
ie 4 Neighboring H<br />
3300 Hydrogen Bonded<br />
1835<br />
1775-1765<br />
C - 0, Anhydride<br />
C - 0, Ester with Eleceron<br />
withdrawing group attached<br />
1735<br />
to single bonded oxygen<br />
Ar - 0 - 8 C - R<br />
C - 0, Ester<br />
1690-1720 C * 0, Ketone, Aldehyde<br />
and, -COOH<br />
1650-1630<br />
C - 0 Highly Conjugated<br />
0<br />
eg Ar - C - As<br />
Approx. 1600 Hlghly Conjugaced<br />
Hydrogen Bonded C - 0<br />
1560-1590 Carboxyl group in Salt<br />
Form -COO<br />
1330 co 1110 C-0 Screech and<br />
0-H Bend in Phenoxy<br />
Structures, Ethers.<br />
1100-1000 Aliphatic Ethers.<br />
Alcohols.<br />
53<br />
II
Figure 2: Scale expanded FTIR spectra in the range 500-1500 cm-'.<br />
Top: Mineral mixture of micalmootmorillonite, montmorillonite<br />
and kaolinite (1:l:Z by veight).<br />
Bottom: Composite spectrum synthesized from the least squares<br />
fitting program.<br />
1 ' " 1 " ' 1 " ' 1 ' " ' "<br />
1'400 1200 1000 80D 600<br />
Figure 3: FTIR spectra in the range 500-1500 cm-' of kaolinite standards<br />
Top: Illinois.<br />
Bottom: Georgia.<br />
54
Figure 4: Top: FTIR Spectrum of acetylated coal<br />
Middle: FTIR spectrum of original coal (PSOC<br />
Bottom: Difference spectrum<br />
40<br />
30<br />
; 2c<br />
e<br />
2<br />
a<br />
0<br />
1c<br />
wt. of coal in pellet mg.<br />
Figure 5: Plot of peak height of 1765; 1370 or 1195 cm-I bands vs. concentration<br />
of coal in KBr pellet. (Measurements made on difference spectra)<br />
55<br />
312)
Figure 6: Infrared spectra of selected coal samples from stations along the seam.<br />
1900<br />
1610<br />
16 ,I 1585<br />
1690<br />
700 cdl<br />
Figure 7: Difference spectra obtained by subtracting spectrum of coal from 70 ft.<br />
station from spectra of coals from A 30 ft., B. 40 ft., C. 110 ft.,<br />
and D. 125 ft.<br />
56
3800<br />
Figure 8: FTIR spectra in the range 700-3800 cm-l.<br />
A. Coal sample slightly oxidized at 15O'C.<br />
B. Unoxidized coal.<br />
A-B. Difference spectrum.<br />
, . 700 rm-1<br />
1800 700 ern-1<br />
Figure 9: FTIR spectra in the range 700-3800 cm-l.<br />
A. Oxidized coal (6.7% O2 uptake).<br />
B. Unoxidized coal.<br />
A-B. Difference spectrum.<br />
57
<strong>THE</strong> NATURE AND COMPOSITION <strong>OF</strong> COAL HUMIC ACIDS<br />
Swadesh Raj<br />
Ebasco Services Incorporated, Two World Trade Center, New York, NY 10046<br />
During the early stages of coalification the chemical substances in the decayed<br />
organs of higher plants are condensed into the humic acid-like substances. Classical<br />
theories of coal formation do not show characteristics of condensation<br />
product formed from the complex mixture of parent substances. These humic acid-like<br />
substances are ill defined substances of diverse origin and their composition is<br />
unknown. Although it has been known for man years that mild oxidation of bituminous<br />
coals yields humic acid-like material(l1. Reagents such as potassium permanganate,<br />
hydrogen peroxide and aqueous nitric acid have been used in the previous<br />
work(2). The reagent selected here was aqueous performic acid which was generated<br />
by a reversible reaction between anhydrous formic acid and hydrogen peroxide. The<br />
mildness of the conditions, the speed of reaction and its simplicity were the factors<br />
for the reagent selection.<br />
In this paper results are presented on humic acids which are extracted from<br />
thirty-eight different oxidized coals. Correlation equations are developed to pre-<br />
dict the humic acid yields for coals of various origin. Elemental analyses of<br />
oxidized and parent coal are compared. Efforts are made to analyze changes in the<br />
amount and composition of mineral matter resulting from the chemical reaction.<br />
Petrographic changes as a result of oxidation is also studied. NaOH - soluble and<br />
insoluble materials are analyzed using FTIR. Infrared spectra of coals, humic acids<br />
and residues are interpreted and discussed.<br />
EXPERIMENTAL PROCEDURE<br />
The dried samples of coals (-80 mesh size) were dispersed in anhydrous formic<br />
acid (99 percent) (50 ml for 5 gms of each). The 30 percent hydrogen peroxide was<br />
then added, 2 ml at a time, at such a rate that the temperature rose to about 50%.<br />
The mixture was then allowed to cool to room temperature for the next 24 hours with<br />
constant stirring. It was then filtered and the solid washed with water.<br />
The dry residue, oxidized coal was then extracted with 1N NaOH in a stream of<br />
nitrogen gas at room temperature for another period of 24 hours with constant<br />
stirring. The insoluble residue was removed by centrifugation, washed and dried.<br />
The washings and NaOH soluble portion were collected and acidified to pH 1 and<br />
left overnight, The acid insoluble portion settled and most of the supernatent<br />
was siphoned from the precipitate. The precipitate was centrifuged and washed to<br />
about pH 5. Both the solids (NaOH soluble and insoluble) were dried in a vacuum<br />
oven at approximately 80% for about 24 hours and analyzed on a Nicolet FTIR.<br />
pellets of coals were prepared by mixing 1 mg of dry, finely ground sample with 300<br />
mg of KBr.<br />
Approximations were made of the mineral contents by determining (a) the high-<br />
temperature ash yields of humic acids and NaOH insolubles, (b) the yields of ash<br />
from the same materials in an oxygen-plasma low-temperature asher (LTA). Ultimate<br />
analysis of the oxidized products were obtained from the Commercial Testing and<br />
Engineering Co, Inc. Maceral analysis of oxidized product was done by coal<br />
petrography technique.<br />
58<br />
KBr
EXPERIMENTAL RESULTS<br />
There is some difficulty in expressing the data on a completely sound basis,<br />
because of the complications introduced by the presence of mineral matter. There<br />
is a loss in weight of the mineral matter during oxidation. The mineral matter<br />
contents of coal and oxidized product are different. Neither the dmmf nor the<br />
mineral containing analyses can usefully be compared when expressed as percentages.<br />
In Table 1 the weights of constituents in the sample taken for reaction are<br />
compared with their weights in the oxidized product. The losses shown for C, H, N<br />
in Table 1 contain no assumptions and are as good as the raw analytical data.<br />
Obviously there are uncertainties in the weights of organic sulfur and mineral<br />
matter, and hence in oxygen by difference. The results indicate that about 8-20<br />
percent of the carbon and 0-15 percent of the hydrogen in the original coal is<br />
lost during the oxidation. The weight of oxygen is increased by 120-170 percent,<br />
and it appears to have doubled. It is clear that the data are not very satisfac-<br />
tory in this case. They should be considered qualitative in nature, nevertheless<br />
the data generated is first of its kind where efforts are made to interpret the<br />
data analytically for products of a chemical reaction of coals that considers the<br />
changes in the amount and composition of mineral matter resulting from the reaction.<br />
The extraction of humic acids with sodium hydroxide is likely to disrupt<br />
partially the structure of the clay minerals and solubilize some material, which<br />
will not necessarily be completely reprecipitated by HC1 with the humic acid. The<br />
sum of the LTA values for the humic acid and NaOH insolubles usually exceeded the<br />
mineral matter content of the coal by a considerable margin, suggesting that clay<br />
structures had been drastically altered. The sum of the high-temperature ashes<br />
bore a variable relation to the mineral matter content of the coal. In Figure 1<br />
the yields of humic acids are expressed on the dry ash-free basis as a fraction<br />
of dmmf coal taken and are plotted against dmf carbon contents. A tendency for<br />
the humic acid to increase with rank exists. The coals from Eastern Province<br />
tended to give the higher yields because this Province contains coals that in<br />
general are of higher rank than those of other Provinces. Regression analyses<br />
developed from the data showed that results for coals could be expressed by the<br />
equation.<br />
humic acid yield = 3.15 x %C - 183<br />
where the correlation coefficient is 0.95 for Rocky Mountain Province, 0.56 for<br />
Eastern Province and 0.22 for Interior Province coals. A correlation coefficient<br />
of 0.75 was found when all the data were used with respect to the Province of<br />
origin and can be expressed as<br />
humic acid yield = 2.91 x %C - 163<br />
As stated above, the hydrogen peroxide was added at such a rate as to limit<br />
the temperature rise due to the exothermic reaction. With Eastern coals the<br />
peroxide had to be added more slowly than with coals from the other Provinces, in<br />
order to avoid exceeding the temperature limit. It follows that the reaction with<br />
Eastern coals is more exothermic than with other coals.<br />
Petrographic examination of the oxidized product do indicate that vitrinite<br />
had been greatly altered in appearance while sporinite and the inert macerals<br />
changed little or not at all. The apparently unaltered macerals could still be<br />
59
ecognized as such in the NaOil. - insoluble materials which contain most of the in-<br />
organic material of the oxidized coal. The humic acid production arises from the<br />
vitriiite maceral which contain very minute quantities of mineral matter. Both of<br />
these materials (NaOH - insoluble and soluble) are analyzed by Nicolet FTIR and<br />
compared with that of coals.<br />
The FTIR obtains spectra jn digital form. The correction for the mineral<br />
matter and moisture is ~nade(~'~).The infrared spectra for the humic acids, NaOH -<br />
inso?.uble residue and coals are shown in Figures 2 to 4. Spectra obtained from<br />
coals and humic acids show a close similarity in the absorptions associated with<br />
the various C-H bonds and skeletal vibrations. Generally, the conclusions drawn<br />
from the absence of bands from the absorption spectrum are by no means less valuable<br />
than the information furnished by the existing bands. It is generally believed<br />
that coal contains no, or very few, C=O groups, isolated C=C and CEC bands<br />
are absent. Aliphatic CH, CH2 and CH3 on the other hand do occur, as well as<br />
arom.sti.c ring systems.<br />
probably also present.<br />
-C-0- or C-0-C bands and associated OH and NH bands are<br />
DISCUSSION AND CONCLUSION<br />
Infrared spectra of coals and humic acids demonstrate a very close similarity.<br />
The spectra from humic acids also resemble the spectra from coal tar(3), suggesting<br />
that the humic acids are the monomers derived due to the coal oxidation. Ash<br />
analysis and infrared analysis show that most of the organic matter ends up in the<br />
NaOH soluble part while most of the inorganic matter goes into the NaOH insoluble<br />
material.<br />
Humic acid formation have been referred(5) earlier to "Regenerated Ulmins."<br />
This assumption needs further evidence. During the oxidation of coal, consider-<br />
able oxygen enters the bonds of the coal molecule. Most of the vitrinites were<br />
greatly altered in appearance while sporinite and the inert macerals were changed<br />
little or not at all. The apparently unaltered macerals could still be recognized<br />
as such in the NaOH - insoluble material. The infrared spectra of NaOH - insoluble<br />
material looks like char, but the corrected spectra for the NaOH insoluble material<br />
show the absorption pattern similar to parent coal suggesting that the organic<br />
matter in that part is still highly polymerized similar to coal.<br />
In all cases, the aliphatic C-H vibrations at 2850-2950 cm-' are sharp, and<br />
the other C-H vibrations at 1450-1480 cm-I and ai: 1375-1380 are there. Absorption<br />
near 1375 cm-I is due to vibrations of the methyl group. When gem-dimethyl<br />
groups (ie, two methyl groups on the same carbon atom) are present, this band<br />
splits into a closely spaced doublet. Such splitting was observed in few spectra<br />
but not of an equal intensity. The aromatic absorption near 1600 cm-' are very<br />
intense. Correlation of the magnitudes of the 1600 cm-I peak with the hydroxyl<br />
content of a variety of coal, humic acid and even of the NaOH - insoluble material<br />
indicate that hydroxyl, in the form of phenolic hydroxyl contributes strongly to<br />
the peak.<br />
Absorption due to C=O is very strong in all cases. These were at variable<br />
frequencies in the range 1660-1740 cm-l, most often 1700-1730 cm-l* The spectra<br />
of coals of bituminous rank do not show carbonyl absorption in the usual region<br />
(1660-1760<br />
This absorption is quite clear in humic acids and entirely due<br />
to the presence of carboxyl groups which has been the result of oxidation.<br />
60
-1<br />
A peculiar feature of the spectra is the ubiquity of absorption close to 1260 cm .<br />
It is not quite intense but usually showed a multiplicity of peaks in the range<br />
1250-1300 cm-1. Primary and secondary alcohols, and phenols, may absorb in this<br />
region. Aromatic ethers also absorb here. The absorption appears to be due to<br />
Some kind of C-0 vibration, and such vibrations are often accompanied by other<br />
vibrations in the range 1000-1200 cm-l. Indeed, bands were found at 1020-1030,<br />
1070-1080 and 1170-1 90 cm-l. The striking point is that if any absorption in the<br />
region 1000-1300 cm-' that was observed, was in the narrow ranges specified. This<br />
Seems to suggest that a number of structural elements containing oxygen were widespread<br />
in coals and coal humic acids and differ surprisingly little from coal to<br />
coal.<br />
A parallel situation is found with regard to another ubiquitous band in the<br />
range 795-820 cm-l. This band is sharp in the spectra and sometimes intense.<br />
Weaker bands at higher frequencies (near 400-1000 cm-') were also seen.<br />
-1<br />
The bending vibrations of aromatic C-H bonds are found near 870 cm region,<br />
and their frequencies are used to identify substitution patterns in the benzene<br />
ring. Thus compounds with substituents in the 1, 4- or 1, 2, 3, 4-positions have<br />
an absorption near 830 cm-I q30 cm-l), while 1, 2, 3-trisubstituted compounds<br />
absorb near 780 cm-I (520 cm- ).<br />
Absorption near 750 cm-' is (520 cm-l) charac-<br />
teristic of 1, 2-disubstituted compounds. No single pattern of substitution shows<br />
bands near both 750 and 830 cm-l. The intensities of these bands is variable with<br />
pure compounds, but is often high. Weak shoulder is seen at 3030 cm-l (aromatic<br />
C-H stretching) and the weak band near 1600 cm-l (aromatic ring skeletal vibration?).<br />
No firm answer can be given, but probably the intensities are sufficiently consis-<br />
tent, since in pure aromatic compounds the 1600 cm-I bond is sometimes quite weak.<br />
Sharp absorption at 1600 cm-l in the spectra is due to -OH substitution on the<br />
aromatic ring(3.6).<br />
The striking observation is that if these bands are present in a spectrum,<br />
they are always close to the same frequencies, and absorptions corresponding to<br />
other benzene substitution patterns than those mentioned are not seen at all.<br />
The implication is, once more, that certain structural elements or skeletons are<br />
of very frequent occurrence and differ surprisingly little from coal to coal<br />
which is in agreement with the other related published works(7>8).<br />
ACKNOWLEDGMENT<br />
The help extended by Dr P Solomon for obtaining the IR spectra is greatly<br />
appreciated.<br />
REFERENCES<br />
1. Given, P H, Fuel (39), 463 (1960)<br />
2. Lowry, H H, Chemistry of Coal Utilization Supplement Volume, John Wiley and<br />
Sons Inc, New York (1963)<br />
3. Solomon, P R, Conference on "Coal Combustion Technology and Emission Control"<br />
California Institute of Technology, Pasadena, CA, February 5-7 (1979)<br />
4. Painter, et al, Fuel (57) 124 (1978)<br />
61
5. Francis, W, in "Coal" pp 523, 533, Second Edition, (1961)<br />
6.<br />
7.<br />
8.<br />
Fujii, S, O'Sawa, Y, and Sugimura, H, Fuel (49) 68 (1970)<br />
Raj, S, ACS Division of Fuel Chemistry Preprints, 178th Meeting, (24) (1979)<br />
Raj, S, IInd International Coal Utilization Conference on Coal Technology,<br />
Houston, Texas November 1979<br />
.A<br />
4<br />
100.-<br />
95 -<br />
8 90-<br />
Y<br />
E -<br />
;<br />
85<br />
8<br />
li<br />
a 80-<br />
4<br />
; 75-<br />
P<br />
a<br />
0 70-<br />
4<br />
65 -<br />
Figure 1<br />
YIELDS <strong>OF</strong> HUMIC ACIDS AS FUNCTION <strong>OF</strong><br />
CARBON CONTENTS <strong>OF</strong> <strong>COALS</strong><br />
A = EASTERN PROV<strong>IN</strong>CE<br />
B = <strong>IN</strong>TERIOR PROV<strong>IN</strong>CE<br />
C = ROChY MOUNTA<strong>IN</strong> PROV<strong>IN</strong>CE<br />
6Or<br />
I I I I I I I I I I I<br />
75.0 76.5 78.0 79.5 81.0 82.5 84.0 85.6 87.0 88.5 90.0<br />
B<br />
8<br />
CARBON CONTENT <strong>OF</strong> COAL. %. DMMF<br />
62
c<br />
C<br />
2<br />
1<br />
e<br />
a<br />
c.<br />
L<br />
5<br />
P<br />
a<br />
a<br />
N<br />
.d<br />
a<br />
.A<br />
X<br />
0<br />
rl<br />
a<br />
G<br />
.rl<br />
M<br />
.d<br />
Y<br />
0<br />
,+*corn mm<br />
rlrlww o m<br />
-!??? '92<br />
0000000<br />
I I I I + I<br />
63<br />
mrlmwmcom<br />
wl-lwrlomr-<br />
"i".?????<br />
oooo:,<br />
I I I I ??<br />
lnmooooo<br />
44 w mrl<br />
mcn rl mm<br />
rl. "i 0. m w<br />
00000<br />
I I I ?i<br />
m h<br />
P<br />
rl<br />
0<br />
v<br />
SiUPZVlOS
65<br />
8<br />
e<br />
0 N<br />
r<br />
0<br />
L<br />
8 a<br />
% E<br />
m<br />
5<br />
3<br />
2<br />
Y<br />
8 8<br />
s r<br />
8<br />
mN<br />
0<br />
N<br />
m<br />
0<br />
In m<br />
0<br />
3
Figure 4<br />
<strong>IN</strong>FRARED SPECTRA <strong>OF</strong> (A) PSOC 282 HUMIC ACID, (E) PSOC 221 HUMIC ACID,<br />
(C) PSOC 295 HUMIC ACID, AND (D) PSOC 295 NaOH-<strong>IN</strong>SOLUGLE<br />
A A<br />
Q 7% KAOL<strong>IN</strong><br />
15% ILLITE<br />
I ,<br />
I<br />
1 Y l<br />
11<br />
p i<br />
!<br />
WAVE NUMBERS<br />
66<br />
B<br />
Q.m KAOL<strong>IN</strong><br />
1 Ox lLLlTE<br />
C<br />
07% KAOL<strong>IN</strong><br />
1.5% lLLlTE<br />
0<br />
70% KAOL<strong>IN</strong><br />
11.0% OUARTZ<br />
3QOx ILLITE
, I<br />
<strong>IN</strong>SIGHTS <strong>IN</strong>TO <strong>THE</strong> CHEMICAL STRUCTURE <strong>OF</strong> COAL<br />
FROM <strong>THE</strong> NATURE <strong>OF</strong> EXTRACTS<br />
W.R. Ladner, T.G. Martin and C.E. Snape<br />
National Coal Board, Coal Research Establishment,<br />
Stoke Orchard, Cheltenham, Glos., GL52 4RZ, England.<br />
K.D. Bartle<br />
Department of Physical Chemistry, University of Leeds,<br />
Leeds, LS2 9JT, England.<br />
ABSTRACT<br />
As part of a National Coal Board programme aimed at deriving transport<br />
fuels and chemical feedstocks, the chemical structure of extracts from coals of<br />
varying rank are being studied. This information helps to give an insight into<br />
the structures of the original coals. Supercritical gas extraction yields,<br />
with little degradation, large quantities of material (20-50% d.a.f. coal),<br />
which may be compared with products obtained by: (a) a less mild process<br />
employing hydrogen-donor solvents such as hydrogenated anthracene oil, and<br />
(b) simple solvent extraction. The molecular weight range of the extracts<br />
( 300-2000) makes separation by solvent fractionation and adsorption chromatography,<br />
followed by examination by NMR spectroscopy, the most appropriate<br />
analytical methods for their structural characterisation. The SCG and solvent<br />
extracts consist of small aromatic clusters joined by methylene and heteroatom<br />
bridges. The aliphatic constituents are principally alkyl groups for which<br />
chain length decreases with increasing rank, so that aromaticity correspondingly<br />
increases from 40-80%. The main chemical structures present in the various<br />
extracts are independent of extraction conditions. This, taken with the<br />
significantly different MW distributions, allows important conclusions to be<br />
drawn as to the nature of the fragments present in the original coals.<br />
1. <strong>IN</strong>TRODUCTION<br />
Investigations into the organic chemical structure of coals can broadly be<br />
divided into three groups:<br />
physical methods, for example infra-red spectroscopy (1) and<br />
solid state 13C NMR (Z), which can be used to obtain information<br />
about the chemical groupings;<br />
chemical methods, for example oxidation (3) and depolymerisation<br />
using boron trifluoride and phenol (4), which give information<br />
about the size of aromatic clusters and about substituents and<br />
linking groups in the coal molecule;<br />
characterisation of extracts, for example the structural analysis<br />
of extracts obtained in high yields can be used to deduce<br />
information about the parent coals.<br />
The Coal Research Establishment of the National Coal Board is currently<br />
developing two coal liquet'action processes. These involve the extraction of<br />
coal with (a) supercritical gas (SCG) at temperatures up to 720 K and pressures<br />
of about 200 bar (5-7) and (b) coal-derived hydrogen-donor solvents (HDS) at<br />
temperatures around 670 K, but at pressures close to ambient (7). The extracts<br />
obtained from both processes are then hydrocracked and further reformed to the
desired liquid products. SCG extraction with aromatic solvent yields up to 50%<br />
d.a.f. coal as tractable homogeneous extract together with reactive char. The<br />
extract is produced by mild thermolysis of the coal and is volatilised by the<br />
presence of an SCG (8). HDS extraction removes up to 90% of the organic part of<br />
the coal by a mechanism thought to involve stabilisation of the free radicals<br />
formed by hydrogen donation from the solvent (9).<br />
Moderate conditions are experienced by coals in both processes so<br />
that extensive breakdown and reformation of coal molecular structures during<br />
extraction is unlikely to occur, although limited thermolysis and chemical bond<br />
cleavage must be taking place for the bulk of the coal to become soluble in the<br />
solvent media. However, rapid removal of molecular fragments from the extraction<br />
zone in the gas extraction process and stabilisation of radical species by<br />
hydrogen donation in the HDS process (9) probably prevent the occurrence of<br />
reformation, recombination and further degradation reactions. Therefore, the<br />
structures of molecules released and recovered as extract may well be<br />
representative of the molecular building blocks of the original coals.<br />
Conversion of extracts to more valuable low boiling oils has necessitated<br />
a study of their molecular structures and advantage has been taken of these<br />
investigations together with some structural studies conducted on coal extracts<br />
prepared by simple solvent extraction to make some predictions about the<br />
molecular structures of parent coals.<br />
2. EXPERIMENTAL AND RESULTS<br />
2.1 Coals and Their Extraction<br />
In this investigation seven coals were used (three bituminous, one perhydrous<br />
and three lignitic) and the yields of the extracts prepared from these are shown<br />
in Figure 1. For convenience of presentation, the bituminous coals and lignites<br />
have been labelled 1, 2 and 3. Soxhlet extractions were performed with toluene<br />
and pyridine for periods between 25 and 250 hours. SCG extractions were carried<br />
out semi-continuously with toluene and other aromatic solvents at temperatures<br />
between 620 and 690 K (10). Bituminous coal 1 was also extracted with hydrogenated<br />
anthracene oil (f3DS) at 670 K.<br />
2.2 Fractionation of Extracts and Analyses<br />
The extracts were separated into benzene insolubles (BI), asphaltenes and<br />
n-pentane solubles (n-PS) fractions (10). In some cases the n-PS fraction was<br />
further fractionated by silica-gel adsorption chromatography into paraffins,<br />
aromatics (low phenolic -OH content) and polars (high phenolic -OH content).<br />
Some BI fractions were silylated (11) to render them soluble in tetrahydrofuran<br />
and chloroform for molecular weight determinations and NMR spectroscopy<br />
respectively. Silylation was especially valuable in view of the large BI<br />
fractions in many of the extracts (see Figure 1).<br />
Most fractions were subjected to ultimate, MW and phenolic -OH analyses.<br />
Number average MWs were determined isopiestically using an Hitachi-Perkin-Elmer<br />
115 instrument. Phenolic -OH contents were measured by enthalpimetric titration.<br />
Some typical results for these analyses are given in Table 1.<br />
2.3 Spectroscopy<br />
'H NMR spectra were obtained at 60 MHz using an Hitachi-Perkin-Elmer R24B<br />
instrument with chloroform-d and pyridine-dg as solvents. Figure 2 shows the<br />
'H NMR spectra of the asphaltenes from the HDS extract of bituminous coal 1<br />
and of the SCG extracts of bituminous coal 3, perhydrous coal and lignite 1.<br />
68
Fourier transform 1% NMR spectra were obtained at 45 MHz using a Bruker<br />
WH 180WB instrument with chloroform-d as solvent. Chromium acetylacetonate was<br />
added to the samples and gated decoupling was employed to obtain reliable<br />
quantitative data (12). Figure 3 shows the 1% NMR spectra of the asphaltenes<br />
from the HDS extract of bituminous coal 1 and of the SCG extracts of bituminous<br />
coal 3, the polars from SCG extract of perhydrous coal and the aromatics from<br />
SCG extract of lignite 3.<br />
2.4 Structural Analysis Scheme<br />
The distribution of hydrogen types determined by 'H NMR, as shown in<br />
Figure 2, has been combined with elemental and phenolic -OH analyses and MW to<br />
give the numbers of the various atoms or groups in the average molecule; these<br />
have then been used to derived the structural parameters defined in Table 2.<br />
The number ot' aliphatic carbon atoms (Cal) was obtained using the assumed<br />
atomic H/C ratios (a,b,c and d) for the different aliphatic environments measured<br />
by 'H NMR. These were chosen by consideration of the groups contributing to the<br />
bands in the 'H NMR spectra. For example, since only methyl groups contribute<br />
to the H band, d = 3 and similarly, since mainly methylene groups contribute to<br />
the H ,2 band, a = 2. The choice of values of b and c was more difficult since<br />
they were found to be dependent on coal rank, both methylene and methyl groups<br />
being major contributors to the H and H bands. Therefore, b and c were chosen<br />
to give Cal and fa (aromaticity) values consistent with the direct measurement<br />
of these parameters by I3C NMR.<br />
Values of the structural parameters for a selection of the asphaltenes, BI<br />
and aromatic fractions oi typical extracts are given in Table 3. The structural<br />
parameters have been used to construct representative structures for some of<br />
the asphaltenes and these are given in Figure 4. Where necessary, more than one<br />
structure has been given so that a better fit is achieved with the calculated<br />
structural parameters. The structures illustrated must, of course, be considered<br />
as averages of the many species present in each fraction.<br />
3. DISCUSSION ON COAL EXTRACTS<br />
3.1 Yields and Molecular Weights<br />
The results of extraction and fractionation given in Figure 1 are not<br />
comprehensive, but present a range of values for the processes under<br />
investigation. Comparison of the compositions of the various extracts is of<br />
considerable interest since they are derived by using widely varying degrees of<br />
extraction severity from coals with markedly different characteristics.<br />
Extraction of coals with toluene gave very small yields of soluble materials<br />
( 5% d.a.f. coals) while pyridine gave much larger yields (up to 20% d.a.f. coal),<br />
which increased with increasing coal rank. These findings are in agreement with<br />
those of previous investigators (13,141.<br />
Extraction with toluene and with pyridine is likely to involve only<br />
solvation of low MW molecules trapped in the coal matrix and some disruption<br />
(particularly with pyridine) of hydrogen bonds with consequent release of<br />
materials of higher MW and polarity. Thus the pyridine extract of bituminous<br />
coal 3 contains a large proportion of BI of MW about 1500.<br />
A t temperatures between 620 and 690 K, SCG extraction of bituminous coals<br />
yielded quantities of BI comparable to those obtained by pyridine extraction.<br />
The quantities of these BIs increased with increasing extraction temperature.<br />
69
The large proportions of benzene soluble fractions always present in SCG<br />
extracts indicate that, apart from simple solvation and hydrogen bond breaking,<br />
some thermolysis of chemical bonds may have occurred, although little gas was<br />
generated during extraction.<br />
In HDS extraction the material obtained in excess of that released by SCG<br />
extraction is largely benzene insoluble with a MW 2000. Such high MW material<br />
is too involatile to be dissolved in supercritical solvents.<br />
For the lignites, the overall picture is somewhat similar to that of the<br />
bituminous coals except that both pyridine and SCG extraction gave much smaller<br />
quantities of BI material (MW 1000). No BIs were obtained by SCG extraction of<br />
lignite 3 at 610 K, but at 690 K a small amount ( 5% d.a.f. coal) was produced.<br />
These findings imply that MW distributions are a function of coal rank.<br />
The perhydrous coal yielded four times more BIs by SCG extraction than by<br />
pyridine extraction, but the MWs of both fractions are close to 2000. This<br />
suggests that the large quantities of both benzene soluble (30% d.a.f. coal)<br />
and BI ( 20%) material could be produced from the perhydrous coal by mild<br />
thermolysis of, for example, long alkyl bridging groups between aromatic nuclei<br />
and that the high MW benzene insoluble material is more structurally amenable<br />
to dissolution in the SCG than are the BIs from bituminous coal.<br />
3.2 Elemental and Functional Group Analyses<br />
Table 1 shows that for all the extracts, the solvent separation procedure<br />
has given fractions with decreasing H/C ratio and increasing heteroatom content<br />
going from n-PS to BI material. Silica gel adsorption chromatography of PS<br />
yielded aromatic fractions which contain little phenolic -OH.<br />
The overall H/C ratios of the extracts from the lignites and perhydrous<br />
coal are significantly higher than those of the bituminous coals. The extracts<br />
from lignites generally have much larger heteroatom contents than those from<br />
the bituminous and perhydrous coals. The heteroatom contents of all thc pyridine<br />
and SCG extracts of bituminous and perhydrous coals are similar to those of the<br />
parent coals. For thc SCG extracts of bituminous coals H/C varies little as the<br />
temperature is increased from 620 to 690 K. However, the SCG extract of<br />
lignite 3 shows a significant decrease in heteroatom content at 690 K which<br />
suggests that a number of the heteroatoms are in structures, such as carbonyl and<br />
aliphatic ethers, which are easily cracked. The heteroatom contents of the HDS<br />
extracts of the bituminous coals are slightly less than those of the parent<br />
coals and also of the corresponding SCG extracts; this implies that the digestion<br />
conditions have resulted in some chemical cleavage of bonds containing<br />
heteroatoms.<br />
Table 1 indicates that acidic hydroxyl groups generally account for<br />
approximately 65% of the oxygen in the bituminous and perhydrous coal extracts,<br />
while acidic hydroxyl (i.e. phenolic and carboxyl) groups account for well under<br />
half the total oxygen in most of the pyridine and 610 K SCG extract fractions of<br />
1 ignite .<br />
3.3 NMR Spectra<br />
The NMR spectra show that the extracts of bituminous coals (Figures 2a and<br />
b, 3a and b) contain fewer aliphatic groups than the extracts of lignite<br />
(Figures 2c and 3c). the 1H spectra of the former containing much more prominent<br />
H bands. The sharp bands at 1.3 ppm in the 1H spectra and at 29.7 ppm in the<br />
1% spectra of the lignite and perhydrous coal extracts are attributed to<br />
methylene groups in alkyl side chains containing at least 8 carbon atoms (15).<br />
70
The bands between 1.5 and 2.0 ppm in the 'H spectra of the HDS bituminous coal<br />
and lignite extracts indicate the presence of hydroaromatic groups. These groups<br />
probably result from hydrogen transfer reactions occurring in the former case,<br />
but in the latter they possibly originate from the parent coal. A comparison<br />
of the 1% spectra shows that the SCG extract of bituminous coal contains a<br />
greater proportion of bands between 18 and 22.5 ppm; these are largely<br />
attributed to methyl groups (15).<br />
In the 13C spectra of the HDS and SCG extracts of bituminous Coal (Figures<br />
3.3 and b), the intensity of the CAR-0 band between 148 and 168 ppm, together<br />
with the absence of carbonyl resonances between 170 and 210 ppm, indicate that<br />
virtually all the non-phenolic oxygen is present in aromatic ether groups.<br />
3.4 Extract Structures<br />
The structural parameters (Table 3) and the average structures (Figure 4)<br />
highlight the differences in the chemical nature of the various extracts. The<br />
aliphatic carbon contents of the lignite and perhydrous coal extracts are<br />
significantly larger than those of the bituminous coal extracts, but methyl is<br />
the main constituent in all the extracts. As previously described, long alkyl<br />
side chains are prominent in the extracts of the lignites and perhydrous coal,<br />
occurring mainly in the low MW fractions. The average alkyl chain length (CL)<br />
for extracts of the lignites and the perhydrous coal is between 2.5-4 and<br />
decreases to 2 for those from the bituminous coals. The overall aliphatic H/C<br />
ratio is approximately 2 for all the extracts, except those obtained with<br />
pyridine and by SCG extraction of the bituminous coals where the ratio is 2.5<br />
because of a greater proportion of methyl. For all extracts decreases with<br />
increasing MW.<br />
The degree of condensation for the lignite SCG extracts (dC = 0.73-0.82)<br />
indicates that the aromatic nuclei consist mainly of single rings. The dCs<br />
for the SCG extracts of the perhydrous and bituminous coals (0.6-0.7) are<br />
characteristic of 1-3 ring aromatic nuclei in the molecules. For the bituminous<br />
coals, little variation occurs, either in the nature and content of alkyl groups,<br />
or in the degree of condensation of aromatic nuclei between simple solvent<br />
and SCG extracts. The aromatic structure of the HDS extract is slightly more<br />
condensed than those of the solvent and SCG extracts.<br />
4. CONCLUSIONS ON ORGANIC COAL STRUCTURES<br />
The determinations of the structural characteristics of extracts<br />
representing large proportions of the organic matter in the coals from which<br />
they were derived make it reasonable to draw conclusions about the molecular<br />
constitution of the coals themselves. Arguably the thermal treatments used in<br />
the two NCB extraction processes will cause some cleavage of less stable<br />
molecular bonds. However, the extraction temperatures used are only around 670 K<br />
and the molecular fragments once formed are either volatilised by the SCG and<br />
removed or stabilised by the presence of hydrogen-donor species. Furthermore,<br />
it has been shown that the structures of SCG extracts of bituminous coal are<br />
similar to those of the corresponding solvent extracts.<br />
Results of this structural study indicate an increase in aromaticity of the<br />
extracts (0.4-0.8) with increase of coal rank which is consistent with extensive<br />
data for coals (16). Further, the average sizes of aromatic clusters in the<br />
extracts are in general agreement with published work on these types of coal.<br />
For example, Hayatsu et a1 (17) found that alkaline cupric oxide oxidation of<br />
lignites produced mainly single ring aromatic carboxylic acids, while bituminous<br />
coals gave substantially 2 and 3 ring derivatives.<br />
71
The indications from our work are that coals consist of aromatic ring<br />
clusters of varying sizes and degrees of condensation, depending on coal rank,<br />
interlinked by simple molecular bridge systems and by hydrogen bonding. This<br />
evidence contrasts with some of the earlier data which suggested that hydro-<br />
aromatics and, in particular, adamantyl groups (18,19) are major contributors to<br />
coal structure. There is certainly no evidence of adamantyl groups being<br />
present in our coal extracts. Such structures would give rise to broad bands<br />
in the IH NMR spectra between 1.0 and 2.0 ppm, probably centred at 1.5-1.7 ppm<br />
(20). and not the sharp bands centred at 1.3 ppm as observed in Figure 2. Apart<br />
from simple bridge systems, alkyl groups must account for the majority of<br />
aliphatic carbon present in the coals used. Simple bridge systems, such as<br />
methylene, were deduced by Heredy et a1 (4) from the products obtained by<br />
depolymerisation of coal with phenol and boron trifluoride.<br />
Information on the structure of the parent coals may be obtained from the<br />
molecular weight data for various extract fractions. Extracts from all of the<br />
coals contain large quantities of benzene soluble material released by mild<br />
thermolysis at temperatures between 620 and 690 K. The quantities yielded<br />
represent a far greater proportion of low ( 600) MW material than was previously<br />
thought to be present in the coals on the basis of results from simple solvent<br />
extraction and low temperature carbonisation. If extensive thermolytic<br />
degradation of the basic coal structure has not occurred during extraction, then<br />
this benzene soluble material must be representative of lower MW structural<br />
\units in the coals.<br />
The BIs from the SCG extracts of the lignites and perhydrous coals are<br />
predominantly of high MW ( 2000). Those from pyridine and HDS extracts of the<br />
bituminous coals are similar, being 1500 and 2000 respectively. However, the<br />
fact that no BI material was obtained by low temperature (610 K) SCG extraction<br />
of lignite supports the view that coalification processes involve reduction in<br />
molecular size of unit structures brought about mainly by loss of large alkyl<br />
side chains with aromatisation procedures accounting for increasing size of<br />
ring clusters (21).<br />
5. ACKNOWLEDGEMENT<br />
We thank the National Coal Board fur permission to publish this paper. The<br />
views expressed are those of the authors and not necessarily those of the Board.<br />
6. REFERENCES<br />
1.<br />
'2.<br />
Brown, J.K., J. Chem. Soc., 744 (1955).<br />
Maciel, G.E., Bartuska, V.J. and Miknis, F.P., Fuel, 58, 391 (1979).<br />
3. Hayatsu, R., Scott, G., Moore, L.D. and Studier, M.H., Nature,<br />
- 257, 378 (1978).<br />
4. Heredy, L.A., Kostyo, A.E. and Neuworth, M.B., Fuel, 9, 414 (1964).<br />
5. Maddocks, R.R. and Gibson, J., E, 59, June 1977.<br />
6. Whitehead, J.C. and Williams, D.F., J. Inst. Fuel, 48, 182 (1975).<br />
7. Davies, G.O., Chem. Ind., 560 (1978).<br />
8. Paul, P.F.M. and Wise, W.S., "The Principles of Gas Extraction",<br />
Mills and Boon, London, 1971.<br />
9. Neavei, R.C., Fuel, s, 237 (1976).<br />
10. Bartle, K.D., Ladner, W.R., Martin, T.G., Snape, C.E.<br />
Williams, D.F., Fuel, 3, 413 (i979).<br />
11. Snape, C.E. and Bartle, K.D., Fuel, 58, 898 (1979).<br />
12. Ladner, W.R. and Snape, C.E., Fuel, E, 656 (1978).<br />
and<br />
72
13.<br />
14.<br />
15.<br />
16.<br />
17.<br />
18.<br />
19.<br />
20.<br />
21.<br />
Wise, W.S., "Solvent Treatment of Coal", M i l l s and Boon, London, 1971.<br />
Lahage, P. and Decroocq, D., Revue de 1'Institut Francais du Petrole,<br />
- 31, 99 (1976).<br />
Snape, C.E., Ladner, W.R. and Bartle, K.D., Anal. Chem., 2,<br />
2189 (1979).<br />
Van Krevelen, D.W.,<br />
Amsterdam, 1961.<br />
"Coal - Its Formation and Constitution", Elsevier,<br />
Hayatsu, R., Winans, R.E.,<br />
Fuel, 57, 541 (1978).<br />
Scott, R.G., Moore, L.P. and Studier, M.H.,<br />
Farcasiu, M., ACS Div. Fuel Chem., 24(1), 121 (1979).<br />
Chakrabatty, S.K., World Conf'. of Future Sources of Organic Raw<br />
Materials, Toronto, July 1979.<br />
Podehradska, J., Hajek, M. and Hala, S., Collect. Czech Chem. Commun.,<br />
- 43, 250 (1978).<br />
Gamier, R.J. and Sieman, S.R., Fuel, 58, 67 (1979).<br />
73
0<br />
u)<br />
4<br />
m<br />
-<br />
0<br />
N<br />
u)<br />
rl<br />
m<br />
-<br />
'9<br />
In<br />
%/"<br />
m m<br />
t<br />
p5<br />
9<br />
z<br />
0<br />
In<br />
N<br />
-<br />
In<br />
p.<br />
N<br />
0<br />
E<br />
-<br />
x<br />
0<br />
u)<br />
4<br />
O<br />
U<br />
m<br />
m<br />
-<br />
-<br />
x<br />
0<br />
0<br />
W<br />
O<br />
U<br />
m<br />
-<br />
-<br />
m<br />
h<br />
a<br />
N<br />
P<br />
5:<br />
I\<br />
4<br />
in<br />
0<br />
?<br />
0<br />
m<br />
u)<br />
-<br />
-<br />
0<br />
m<br />
0<br />
N<br />
0<br />
4<br />
4<br />
-<br />
-<br />
u)<br />
0<br />
9<br />
m<br />
0<br />
4J<br />
0<br />
L<br />
a<br />
v<br />
.r(<br />
0<br />
42<br />
x<br />
w<br />
4<br />
u<br />
.3<br />
n<br />
c<br />
c1<br />
0<br />
m<br />
ar<br />
x<br />
3<br />
C<br />
I<br />
4<br />
w<br />
-I<br />
a<br />
m<br />
a<br />
I<br />
1<br />
f<br />
m<br />
u)<br />
m<br />
o m<br />
f<br />
m<br />
p.<br />
m<br />
0<br />
p5<br />
m<br />
P<br />
4<br />
9<br />
m<br />
ci<br />
rf<br />
-<br />
-<br />
N<br />
0<br />
?<br />
O N<br />
+<br />
4<br />
9<br />
p5<br />
-<br />
Y<br />
W<br />
W<br />
0<br />
?<br />
-<br />
u)<br />
0<br />
9<br />
f / K<br />
m<br />
z j o<br />
z<br />
P O<br />
I.<br />
m<br />
O O L<br />
O N 4<br />
mu)<br />
H<br />
m<br />
-<br />
74
TABLE 2 - Definitions of Structural Parameters<br />
Structural Parameter<br />
No. of aliphatic carbon atoms,<br />
'a1<br />
Aromaticity ,<br />
fa<br />
Degree of alkyl substitution,<br />
Average alkyl chain length, CL<br />
Degree of condensation, dC<br />
H<br />
Aliphatic - ratio<br />
C<br />
n<br />
Definition<br />
k+"x+3+"v<br />
a b c d<br />
c-c<br />
a1<br />
C<br />
-<br />
b<br />
H ~ +". ~ , ~ ~<br />
HAR,OH + 3 + 2(& + non-phenolic O+N+S<br />
b a<br />
(C - Gal) + (k + non-phenolic O+N+S)<br />
a<br />
H aliphatic hydrogen<br />
C<br />
- x<br />
C H * aliphatic carbon<br />
(from 1~ NMR) (from 1 3 NMR) ~<br />
75
I<br />
.3 c,<br />
0<br />
L<br />
Lr.<br />
CI<br />
s<br />
i,<br />
L;1 X<br />
3<br />
0<br />
.i<br />
R<br />
c<br />
L<br />
CI<br />
m<br />
L<br />
c,<br />
a,<br />
m<br />
m<br />
a<br />
3<br />
m<br />
c, J<br />
V<br />
42 L<br />
m<br />
I<br />
m<br />
w -1<br />
m<br />
a<br />
c<br />
m U<br />
N Y<br />
yg4<br />
mw<br />
f<br />
-<br />
3<br />
rl P<br />
m<br />
-<br />
p.<br />
m<br />
9<br />
3<br />
N<br />
-<br />
'9<br />
N 0<br />
9<br />
m<br />
-<br />
p.<br />
p.<br />
m<br />
p. -<br />
I:<br />
i<br />
m<br />
in<br />
N 3<br />
-<br />
3<br />
m<br />
U<br />
-<br />
a<br />
'9<br />
0<br />
N<br />
9<br />
0<br />
I-<br />
-IOU<br />
'9'9'9<br />
000<br />
0<br />
m<br />
0<br />
r- (D<br />
0<br />
alz<br />
..<br />
bp.<br />
024<br />
-<br />
30<br />
?t:<br />
OO<br />
L.<br />
- -<br />
P m<br />
0<br />
-<br />
0<br />
?<br />
0<br />
N<br />
m<br />
0<br />
- m<br />
r'!<br />
0<br />
p.<br />
m<br />
0<br />
-<br />
x<br />
0<br />
b<br />
?<br />
0<br />
-<br />
N m<br />
0<br />
3<br />
-<br />
N<br />
3 m N 0<br />
-<br />
4<br />
in<br />
3<br />
m<br />
-<br />
m<br />
N<br />
I:<br />
N<br />
-<br />
I:<br />
N<br />
r'! '4<br />
0<br />
N P<br />
0<br />
N m<br />
0 -<br />
N<br />
0<br />
3<br />
ci<br />
3<br />
9<br />
-<br />
9<br />
z<br />
in<br />
2<br />
-<br />
m<br />
I:<br />
0<br />
W<br />
'9<br />
0<br />
-<br />
9<br />
z -<br />
3<br />
N<br />
3<br />
(u<br />
-<br />
n<br />
z<br />
9<br />
z<br />
-<br />
0<br />
z<br />
9<br />
z<br />
- -<br />
0<br />
P<br />
'9<br />
N<br />
0 I:<br />
0 z<br />
m<br />
'9<br />
0<br />
W<br />
N 0 - -<br />
N<br />
m<br />
N<br />
76<br />
'9<br />
'9<br />
0<br />
m<br />
N<br />
n<br />
z -<br />
r'!<br />
N<br />
P<br />
i, a,<br />
3<br />
x<br />
3 .A<br />
m<br />
L.<br />
0<br />
cs<br />
B z<br />
U<br />
rm f m<br />
?-.<br />
II<br />
L.<br />
D: I:<br />
z<br />
0<br />
m<br />
3<br />
E<br />
i, L<br />
m a,<br />
rf<br />
m<br />
><br />
i,<br />
0<br />
L"<br />
.i<br />
U<br />
II<br />
h<br />
-<br />
3<br />
Y<br />
rn rl a,<br />
f<br />
3<br />
rn 0<br />
a,<br />
5<br />
i,<br />
C<br />
R<br />
C<br />
3<br />
(00 Q V )<br />
M<br />
L ' D<br />
3 0 a,<br />
m c c<br />
0 0 .3<br />
.i 'D E<br />
i,I L<br />
a,Tlc a,<br />
C L a , c,<br />
d V M<br />
' D L O T2<br />
.3 a, L<br />
L a v 4J<br />
hJh 0<br />
amr c
COAL<br />
- EXTRACT -<br />
Figure 1 Some Yields or Extracts and their Solvent Fractions<br />
77<br />
Q4 Benzene-ineolublqe<br />
a Aepheltsnes<br />
n-Pentane solublss<br />
Py pyfldine<br />
scc supsrcri tical gas<br />
TO1 toluene
78<br />
u<br />
8<br />
L<br />
c
AN <strong>IN</strong>VESTIGATION <strong>OF</strong> <strong>THE</strong> OXYGEN AND NITROGEN GROUPS <strong>IN</strong><br />
- SUPERCRITlCAL GAS EXTRACTS <strong>OF</strong> COAL BY NMR<br />
T.G. Martin and C.E. Snape<br />
National Coal Board, Coal Research Establishment<br />
Stoke Orchard, Cheltenham, Glos., GL52 4RZ, England.<br />
K.D. Bartle<br />
Department of Physical Chemistry, University of Leeds<br />
Leeds, LS2 YJT, England.<br />
ABSTRACT<br />
In the liquefaction processes under development by the National Coal<br />
Board coal extracts, including supercritical gas extracts, are subjected to<br />
catalytic hydrocracking. Thus, characterisation of heteroatoms in these<br />
extracts is important for identifying species which may give rise to catalyst<br />
poisoning. NMR methods are described for nitrogen and oxygen group<br />
determinations. Hydroxyl groups in extracts may be completely silylated so<br />
that they can bg estimated from the OSi(CH3)3 band in the 1H NMR spectrum.<br />
The solubility of benzene-insoluble fractions is also significantly increased<br />
by silylation so that they can be easily studied by NMR. The 19F nucleus<br />
provides a magnetic label for hydroxyl via reagents such as hexafluoroacetone,<br />
and may allow identification of different environments for such groups.<br />
NMR is suitable for characterising non-phenolic oxygen groups, since the<br />
1%<br />
resonances of carbon in carbonyl and aromatic ether groups are well separated.<br />
Basic nitrogen can be studied by 1H and 19F NMR via hydrogen-bonding interactions<br />
with model phenols such as 2,6-xylenol and p-fluorophenol. For neutral<br />
nitrogen, labelling with 19F, using e.g. trifluoroacetyl imidazole, shows<br />
promise.<br />
1. <strong>IN</strong>TRODUCTION<br />
Supercritical gas (SCG) extraction of coal with aromatic solvents, such as<br />
toluene, at temperatures around 690 K and pressures of about 200 bar (1)<br />
givesup to 50% d.a.f. coal as a homogeneous extract, which is then subjected to<br />
catalytic hydrocracking to produce liquid products. Characterisation of<br />
heteroatoms in the extract is important in helping to identify species which<br />
may contribute to catalyst poisoning.<br />
Established titrimetric methods for hydroxyl group (2,3) and basic nitrogen<br />
group (4,5) determinations are of great value in structural characterisation<br />
of extracts. There are, however, no established procedures for the measurement<br />
oi' non-hydroxylic functions or neutral nitrogen functions. We describe here<br />
our attempts to compliment and extend existing functional group methods by<br />
utilising the NMR spectroscopic methods which are summarised in Table 1.<br />
Hydroxyl groups have been determined by 'H and I9F spectroscopy following<br />
derivatisation with trimethylsilyl (groups) and adduction with hexafluoroacetone<br />
(HFA). Non-hydroxyl groups have been determined directly from 13C NMR<br />
spectroscopy. Basic nitrogen groups have been estimated from their interaction<br />
with 2,6-xylenol by observing the changes in the -OH chemical shift.<br />
Preliminary results using an alternative I9F NMR method with p-fluorophenol<br />
have been obtained. Derivatisation with trifluoroacetyl imidazole, which acts<br />
as an I9F magnetic label, is under investigation as a possible route for<br />
estimating neutral nitrogen directly.<br />
79
2. EXPERIMENTAL<br />
The sCG extracts were fractionated by solvent separation and silica gel<br />
adsorption chromatography, as previously described (6). Asphaltenes and<br />
methylated asphaltenes (prepared by the method used by Liotta (7)) were separated<br />
by Sternberg's acid/base procedure (8). Silylation of the extract fractions<br />
was carried out as previously (9), and HFA adducts of some asphaltene fractions<br />
were prepared by bubbling the gas into ethyl acetate solutions (10). Also,<br />
trifluoroacetyl esters of carbazole and indole were prepared by warming at<br />
8OoC in pyridine with trifluoroacetyl imidazole for 30 minutes.<br />
'H NMR spectra were obtaincd at 60 and 220 MHz using Perkin-Elmer R24B<br />
and R34 instruments respectively. For the IH NMR studies of basic nitrogen,<br />
silylated extract fractions were added to 0.2 molar 2,6-xylenol in carbon<br />
tetrachloride, and changes in the hydroxyl chemical shift were observed.<br />
NMR spectra were obtained at 45 MHz in chloroform-d using a Bruker !hM 180WB<br />
instrument under experimental conditions which have been shown to yield<br />
quantitative data (11). 19F NMR spectra were obtained at 84.6 MHz using a<br />
Bruker WH90 instrument; furfuryl alcohol was used as an external standard for<br />
determination of -OH contents from the spectra of HFA adducts. The procedure<br />
described by Gurka and Taft (12) was followed for studying basic nitrogen using<br />
0.01 molar p-fluorophenol where 0-fluoroanisole is employed as an internal<br />
standard.<br />
Basic nitrogen contents were also determined by non-aqueous potentiometric<br />
titration (4,5) and acidic hydroxyl contents were measured by enthalpimetric<br />
titration (3,6). Gas chromatographic analysis was carried out on the<br />
trifluoroacetyl esters of indole and carbazole.<br />
3. RESULTS AND DISCUSSION<br />
3.1 Hydroxyl Oxygen<br />
The hydroxyl contents determined from the intensity of the -OSi(CH3)3<br />
band in the IH NMR spectra of extract fractions were in reasonable agreement<br />
with the values obtained by enthalpimetric titration (see Table 2), indicating<br />
that all the hydroxyl groups in the extracts have been silylated. In addition,<br />
silylation gives a significant enhancement of' extract solubility (9). The<br />
presence of non-acidic (alcoholic) hydroxyl groups was discounted since there<br />
was no evidence of -0CH2 resonances in the 13C NMR spectra. Figure 1 is the<br />
lH NMR spectrum of the silylated benzene-insolubles from an SCG extract of'<br />
bituminous coal. It shows that the -OSi(CH3)3 band, which is well separated<br />
from the other aliphatic resonances, has a maximum at 0.3 ppm with a broad<br />
shoulder extending to -1 ppm indicative of' the presence of both unhindered<br />
(meta- and para-substituted) and hindered (ortho-substituted) phenolic groups<br />
(13). Unlike the spectra of Synthoil products (14). no splitting of the<br />
-OSi(CH3)3 band was observed at 220 MHz. The two sharp peaks between 0 and 0.2<br />
ppm are attributable to a little hexamethyldisiloxane (hydrolysis product) and<br />
silylating reagent (hexamethyldisilazane). Methylation (7) and acetylation (15)<br />
are alternatives to silylation for measurement of hydroxyl groups, but both<br />
these methods have much longer preparation times ( 1 day) than silylation<br />
( 1-2 hours). Also, there is an overlap of' -OCH3 resonances with ring-joining<br />
methylene resonances between 3.4 and 4.2 ppm in coal extracts (6).<br />
Silylation, which gives a reliable measure of the total hydroxyl content,<br />
provides little information on the distribution of hydroxyl groups. On the<br />
other hand, HFA adducts considerably less than half the total number of<br />
hydroxyl groups (see Table 2), but gives a good separation in the I9F NMR<br />
spectra between hindered and unhindered phenolic hydroxyl groups. The evidence<br />
80
I<br />
~<br />
obtained so far suggests that there are similar numbers of hindered and<br />
unhindered groups in an asphaltene SCG extract fraction of a bituminous coal.<br />
3.2 Non-Hydroxyl Oxygen<br />
13<br />
c NMR spectroscopy is particularly useful for assessing the environments<br />
of non-hydroxyl groups because the resonances due to carbonyl groups, which lie<br />
between 170 and 210 ppm, are well separated from those due to aromatic ethers<br />
(148-168 ppm) and aliphatic ethers (55-70 ppm) (161, although the resonances<br />
of aromatic ether groups partially overlap with those of phenolic hydroxyl<br />
groups (148-158 pprn). Figure 2 shows that no carbonyl and aliphatic ether<br />
resonances are discernible in the spectrum of the asphaltene fraction of an<br />
SCG extract of bituminous coal, but the distinct band between 158 and 168 ppm<br />
is Solely attributed to aromatic ether groups. From silylation and<br />
integration of the CAR-0 band between 148 and 168 ppm, the aromatic ether<br />
groups were estimated to account for 30% of the total oxygen content in SCG<br />
extracts of bituminous coal.<br />
3.3 Basic Nitrogen<br />
The changes observed in the position of the hydroxyl band in the 'H NMR<br />
spectrum of 0.2 molar 2,6-xylenol when (a) model compounds and (b) silylated<br />
Coal extracts were added are shown in Table 3. Linear plots of the<br />
concentration of the basic species against shift in the spectrum were found up<br />
to a concentration of' about 0.15 molar of the basic species and the values<br />
shown in Table 3 were taken from those graphs. A similar correlation was<br />
found by Tewari et a1 (17) who used o-phenyl phenol, but in the present work<br />
2,6-xylenol was preferred because it gives a sharp hydroxyl resonance in CCl4.<br />
The hydroxyl chemical shift of 2,6-xylenol on its own remains constant at<br />
4.3 ppm for concentrations 0.2 molar, which indicates that hydrogen bonding<br />
of 2,6-xylenol itself ceases to be significant at these concentrations. For<br />
the SCG extract fractions prior silylation was required to prevent exchange of<br />
hydroxyl hydrogen between the extract and 2.6-xylenol.<br />
The results of the studies on model compounds (Table 3) show that little<br />
change in chemical shift for non-basic species, such as dibenzofuran and indole<br />
occurs while changes between 0.8 and 1.2 ppm/O.l mole were obtained for alkyl<br />
substituted pyridines and quinolines. The changes in hydroxyl chemical shift<br />
generally increased with increasing degree of alkyl substitution and it is<br />
thought that di- and trisubstituted pyridines are the most realistic models for<br />
basic nitrogen environments in SCti extracts. The changes in chemical shift<br />
were found to vary greatly for the silylated SCG extract fractions and an<br />
encouraging correlation, shown in Figure 3, was obtained with basic nitrogen<br />
contents determined by non-aqueous potentiometric titration.<br />
In an alternative approach, 19F NMR was utilised and preliminary results<br />
obtained with 0.01 molar p-fluorophenol suggest that some correlation may exist<br />
between the I9F chemical shift titration curves obtained for silylated SCti<br />
extract fraction and basic nitrogen content. For model bases, the change in<br />
19F chemical shift reaches a maximum value, e.g. 2.5 ppm for pyridine, when<br />
large concentrations ( 0.4 molar) have been added. However, for extract<br />
fractions, this maximum value cannot be measured directly because of their<br />
limited solubility in CCl4, and therefore information has to be derived from<br />
the titration curves obtained for low ( 0.2 molar) extract concentrations.<br />
To isolate basic fractions for.the studies described above, Sternberg's<br />
acid/base procedure (8) was employed for the asphaltenes of a bituminous coal<br />
SCG extract. This gave 60% bases which is significantly larger than the<br />
mounts thought to be present by the -OH chemical shift method ( 30%) and by<br />
81
non-aqueous potentiometric titration ( 20%). The analysis of the base-hydrochloride<br />
salt suggested that not every molecule contained a basic nitrogen<br />
group. To help to resolve this issue, methylated asphaltenes were separated<br />
by the same acid/base procedure, but only 20% of bases was obtained, indicating<br />
that the acid/base procedure is inappropriate for SCG extracts of bituminous<br />
coals, probably due to the relatively low basic nitrogen contents and high<br />
phenolic hydroxyl contents.<br />
3.4 Non-Basic Nitrogen<br />
Recently, trifluoroacetyl derivatives of indole and carbazole ( 50% yield)<br />
have been prepared with trifluoroacetyl chloride (18). This is an important<br />
development since most non-basic nitrogen in extracts of bituminous coal is<br />
thought to be in the form of aromatic secondary amines. In the present work,<br />
we found that 90% of indole and carbazole can be derivatised using trifluoro-<br />
acetyl imidazole. In an attempt to measure non-basic nitrogen in SCG extracts,<br />
methylation prior to esterification with this reagent and detection by 19F NMR<br />
is being carried out.<br />
4. CONCLUSIONS<br />
The results of this investigation demonstrate that NMR methods (IH, 1 3C,<br />
19F) offer viable alternatives to existing titration techniques for<br />
determining phenolic hydroxyl and basic nitrogen in coal extracts and provide<br />
ways for the direct measurement of non-hydroxyl and non-basic nitrogen groups.<br />
5. ACKNOWLEDGEMENTS<br />
The authors wish to thank the European Coal and Steel Community for<br />
financial support, Mr. M.P. Mendoza for carrying out basic nitrogen and acidic<br />
hydroxyl determinations and the National Coal Board for permission to publish<br />
this paper. The views expressed are those of the authors and not necessarily<br />
those of the Board.<br />
6. REFERENCES<br />
1.<br />
2.<br />
3.<br />
4.<br />
5.<br />
6.<br />
7.<br />
8.<br />
9.<br />
10.<br />
11.<br />
12.<br />
13.<br />
14.<br />
15.<br />
16.<br />
17.<br />
18.<br />
Whitehead, J.C. and Williams, D.F., J. Inst. Fuel, 48, 182 (1975).<br />
Blom, L., Edelhausen, L. and van Krevelen, D.W., Fuel, E, 135 (1957).<br />
Vaughan, G.A. and Swithenbank, J.J., Analyst, 95, 891 (1970).<br />
Moore, R.T., McCutchan, P. and Young, D.A., Anal. Chem., 3. 1639<br />
(1951).<br />
Darlage, L.J., Finkbone, H.N., King, S.J., Ghosal, J. and Bailey,<br />
M.E., Fuel, 57, 479 (1978).<br />
Bartle, K.D., Ladner, W.R., Martin, T.G., Snape, C.E. and<br />
Williams, D.F., Fuel, E, 413 (1979).<br />
Liotta, R., Fuel, 58, 724 (1979).<br />
Sternberg, H.W., Science, 188, 49 (1975).<br />
Snape, C.E. and Bartle, K.D., Fuel, 58, 898 (1979).<br />
Leader, G.R., Anal. Chem., 5, 1700 (1973).<br />
Ladner, W.R. and Snape, C.E., Fuel, E, 656 (1978).<br />
Gurka, D. and Taft, R.W., J.A.C.S., 91, 4794 (1969).<br />
Schwager, I. and Yen, T.F., Fuel, 58, 219 (1979).<br />
Schweighardt, F.K., Retcofsky, H.L., Friedman, S. and Hough, M.,<br />
Anal. Chem., 50, 368 (1978).<br />
Baltisberger, R.J., Patel, K.M., Stenberg, V.I. and Woolsey, N.F.,<br />
ACS, Div. Fuel Chem., 51(2), 310 (1979).<br />
Snape, C.E., Ladner, W.R. and Bartle, K.D., Anal. Chem., 2, 2189 (1979).<br />
Tewari, K.C.. Kan, N., Susco, D.M. and Li, N.C., Anal. Chem., 51, 182<br />
(1979).<br />
Dorn, H.C., Szabo, P.. Koller, K. and Glass, T., ACS, Div. Fuel Chem.,<br />
51(2), 309 (1979).<br />
82
Hydroxyl oxygen<br />
Table 1 Summary of NMR Methods for Heteroatoms<br />
1 :F<br />
I<br />
1H<br />
lgF<br />
Method<br />
Silylation<br />
Adduction with hexafluoroacetone<br />
Non-hydroxyl oxygen 1 1% 1 Observation of I3C chemical shifts<br />
Basic nitrogen<br />
Neutral nitrogen<br />
Observation of change in hydroxyl chemical<br />
shift of 0.2 molar 2,6-xylenol<br />
Observation of change in chemical shift<br />
of 0.01 molar p-fluorophenol<br />
I I<br />
Esterification with trifluoroacetyl<br />
imidazole<br />
I lgF I<br />
Table 2 Hydroxyl Contents of SCG Extract Fractions<br />
Fraction<br />
Asphal tenes,<br />
bituminous coal<br />
Benzene-insolubles ,<br />
bituminous coal<br />
Acid asphaltenes,<br />
bituminous coal<br />
Asphaltenes,<br />
perhydrous coal<br />
nthalpimetry<br />
4.7 I<br />
4-6<br />
% Hydroxyl<br />
Silylation HFA Adduction<br />
I<br />
N.D. = Not Determined<br />
83<br />
N*D*
E<br />
R a<br />
a,<br />
c"-<br />
m~<br />
V.ca Q<br />
??<br />
%<br />
'i P<br />
r '3 E<br />
3 L<br />
m k<br />
.3 0-<br />
E<br />
.c U<br />
-<br />
+J<br />
0<br />
+J L<br />
w X<br />
3U .i 3 -<br />
m + J 2<br />
J<br />
P m<br />
+Jh W L<br />
3<br />
x<br />
4 .rl<br />
VI<br />
-<br />
-<br />
E<br />
C<br />
a,<br />
2-<br />
m E<br />
ru a<br />
4 P. 4 m .<br />
.A P r VIE<br />
$2<br />
.i 0-<br />
E<br />
W<br />
V .c<br />
Ln P O<br />
9 N ?<br />
0 0 0<br />
Lo<br />
m<br />
N<br />
0 rl<br />
.................<br />
N N N Lo t- N 0 0 C Lo U, 0 PI 0 a) W W<br />
o o o ~ m m m ~ o a ) m o<br />
oooooOc.-4oodoo333<br />
~ m o ~ ~
8 6 4 2 0<br />
CHEMICAL SHIFT ppm<br />
FIGURE I. IH NMR SPECTRUM <strong>OF</strong> SILYLATED BENZENE <strong>IN</strong>SOLUBLES FROM SCG EXTRACT.<br />
AROMATIC CARBON<br />
SOLVENT<br />
CDCLS<br />
I50 100 50<br />
CHEMICAL SHIFT ppm<br />
ALlPMATlC CARBON<br />
FIGURE 2. 13C NMR SPECTRUM <strong>OF</strong> ASPHALTENES FROM SCG EXTRACT.<br />
85<br />
0
86<br />
M
MEASUREMENT <strong>OF</strong> <strong>THE</strong> REACTIVITY <strong>OF</strong> A KENTUCKY 9 AND 11<br />
COAL US<strong>IN</strong>G A MICROAUTOCLAVE<br />
Shuji Mori and Burtron H. Davis<br />
University of Kentucky, Institute for Mining and Minerals Research<br />
Iron Works Pike P.O. Box 13015, Lexington, KY 40583<br />
The liquefaction reactivity of Kentucky #9 and #11 coal was measured in a microautoclave.<br />
The conversions were carried out using a tetralin solvent and 2000<br />
psig hydrogen pressure. The noncatalytic conversion, based on pyridine extraction,<br />
exhibited a maximum at less than 15 minutes reaction time; reaction times longer<br />
than 15 minutes resulted in conversion lower than 90-95% maximum conversion. The<br />
catalytic and noncatalytic conversions showed contrasting behavior at reaction<br />
times longer than 15 minutes. The conversion continued to increase with time<br />
when a cobalt-molybdena catalyst was and secondary reactions caused<br />
the "apparent conversion" to decline at reaction times greater than 15 mintues.<br />
The noncatalytic reactivity at the maximum conversion depends on the length of<br />
time the coal is presoaked in the tetralin solvent; presoaking at room temperature<br />
for four days results in a conversion that is about 5% greater than the conversion<br />
obtained after only a two hour presoaking.<br />
<strong>IN</strong>TRODUCTION<br />
Attempts have been made to correlate the liquefaction reactivity of coals<br />
to the carbon content (l,Z), with the petrography (3,4) or with the "reactive<br />
maceral" content (5,6). Also, experimental difficulties (7-9) have limited the<br />
data available for short reaction times.<br />
Diffusion is usually not a problem for reaction in a conventional batch<br />
autoclave with vigorous agitation, but the heatup period is long for such a<br />
system and it is difficult to assess the influence of slow heatup on short time<br />
coal conversion experiments.<br />
In the present work, a small glass lined reactor capable of a rapid heatup<br />
was used to measure the noncatalytic and catalytic coal conversions at short<br />
reaction times.<br />
EXPERIMENTAL<br />
Samples of Kentucky No. 9 and tin. 11 were ground to -60 mesh and to 16-36<br />
mesh, respectively. The ultimate and proximate analytical data for these materials<br />
are given in Table 1.<br />
The reactor, illustrated in Figure 1, was fabricated from 316 SS. A glass<br />
liner of about lOcc volume was placed in the reactor. The reactor was attached to<br />
a manifold with a pressure gauge and a valve. A thermowell of 1.59m 0.d. (1/16"<br />
O.D.) extended into the liquid contained in the reactor.<br />
Approximately 1.5gr of a Kentucky No. 9 coal was mixed with 1.5gr of ground<br />
ceramic material as a filler (16-36 mesh); the solids were slurried with approximately<br />
6gr of test value. For the noncatalytic reaction with Kentucky No. 11<br />
coal was approximately 3gr of the coal mixed with 6gr of tetralin. For the<br />
catalytic run approximately 1.5gr of Kentucky No. 11 and the same amount of a<br />
prereduced Co/Mo catalyst (American Cyanamid HDS-1442-A, 1/16" extrudate) were<br />
mixed with app oximately 6gr of tetraline. All of the reaction was initiated at<br />
3.45 x 10⁶ N/M E (500 psig) hydrogen pressure.<br />
The reactor was immersed to the "nut" top in a fluidized sand bath (Tecam<br />
Model SLB-2) at 435OC. The bath temperature decreased slightly when the reactor<br />
was introduced, but the temperature was restored to 435OC within approximately<br />
one-half minute by manual adjustments of the heater control, and was maintained<br />
at 435 2 2OC thereafter. Reactor pressure was recorded at one-minute intervals<br />
87
and temperatures of the reactor and the sand bath were recorded continuously.<br />
At the end of the reaction period the reactor was quickly immersed in a cold sand<br />
bath for a period of one minute, then quenched in cold water. No mechanical<br />
agitation was applied to the reactor or its contents during reaction.<br />
The reactor contents were transferred to a dry, weighed Soxhlet extraction<br />
thimble with the aid of pyridine and Sochlet extraction with hot pyridine (150 ml<br />
total) was carried out under an atmosphere of nitrogen for a period of 42 hours.<br />
Pyridine was replaced with methanol and extraction was continued for six hours,<br />
after which the thimble and its contents were dried overnight in a vacuum desiccator<br />
over calcium chloride.<br />
Drying of the extraction residue was continued in a vacuum<br />
oven at 60OC and was considered to be completed when the weight loss between<br />
successive four-hour drying periods less than 10mg. Conversion calculations are<br />
based on weights of residues and are given on a moisture-ash-free basis.<br />
In the course of this work it became evident that the methanol extraction step<br />
did not remove all of the pyridine from the pyridine insolubles and that some<br />
pyridine was strongly retained by the residues at 6OoC (vacuum).<br />
Thorough removal<br />
of pyridine could be accomplished at 150°C (vacuum) but the resulting weight losses<br />
were too small to change calculated conversions significantly or alter interpre-<br />
tations given below.<br />
RESULTS AND DISCUSSION<br />
For a Kentucky No. 9 coal, the conversion depends on the reaction temperature<br />
as shown in Figure 2. The conversion, in the absence of a catalyst, reached a<br />
maximum in 10 to 15 minutes and slowly decreased for longer reaction times due<br />
to the pyridine-insoluble "coke" formation. Such conversions at 15 minutes are<br />
shown in Figure 1 as a function of temperature between 350° and 50OOC. Above<br />
450°C, coking is so severe at the reaction time that the coal conversion, based<br />
on pyridine-insoluble, appears to be quite low.<br />
Preliminary work indicated that the length of coal presoaking time in the<br />
tetralin solvent prior to reaction may alter the maximum conversion. The<br />
influence of room temperature presoaking of the coal sample in tetralin was<br />
determined for periods varying from two hours to two weeks. The maximum conversion<br />
for a 15-minute retention time was three to four percent lower for the two hour<br />
presoaking than for soaking for one day or longer (Figure 3).<br />
in this report a presoaking of 24 hours was employed.<br />
In the other runs<br />
The conversion with and without a catalyst is presented in Figure 4. For<br />
the noncatalytic conversion of the Kentucky No. 9 coal at 435OC, a maximum<br />
conversion of about 90% is obtained after a reaction time of 10 to 15 minutes.<br />
The reproducibility of the conversion for duplicate runs at each retention time<br />
was better than 2 1.5%. At reaction times greater than 15 mintues, the conversion<br />
shows a gradual decrease. This conversion decline appears to be due to the<br />
formation of "pryidine insoluble coke." Petrographic analysis of the residue from<br />
the pyridine extraction confirmed the presence of coke at the later reaction times.<br />
Some investigators have reported a similar maximum (10) while others have not<br />
observed the maximum (11).<br />
The Kentucky No. 9 coal was obtained as a -60 mesh powder. In order to<br />
prevent compaction of the coal particles due to settling, the coal was mixed with<br />
ceramic Particles 16-36 mesh. The larger particle size Kentucky No. 11 coal was run<br />
without the ceramic material. The use of the larger coal particles, as well as the<br />
ebullating bed agitation due to the initial heating of the botton of the tall, narrow,<br />
reactor, enabled us to obtain reproducible conversion without mechanical a itation.<br />
The temperature dependence of the noncatalytic conversion of a Kentucay No.<br />
11 coal was presented in Figure 2. The conversion at the 15-minute reaction<br />
times was nearly the same in the temperature range 400-45OOC and this conversion<br />
is represented in Figure 4 by the symbol a. The maximum conversion, based on<br />
pyridine solubles, is the same for the Kentucky No. 9 and No. 11 coal; however,
many more coals must be converted to verify whether this is generally the case.<br />
The catalytic conversion of a coal should be more rapid than the noncatalytic<br />
conversion. However, the observed fifteen minute catalytic conversion is lower<br />
than the noncatalytic conversion. The catalytic conversion also differs from the<br />
noncatalytic conversion at longer reaction times since the catalytic conversion<br />
continues to increase whereas the noncatalytic conversion decreased with longer<br />
reaction times.<br />
The catalytic conversion is more difficult to explain than the noncatalytic<br />
conversion. One complication is due to chemical changes in the catalyst during<br />
the reaction period. In the present runs the catalyst was prereduced at 5OO0C<br />
and transferred to the reactor in a dry box. However, the catalyst is sulfided<br />
to some extent during the reaction period. The catalyst used for the 60 minute<br />
run contained, after the Sochlet extraction, one wt.% sulfur. However, this<br />
amount of sulfur can account for only a small fraction of the lower conversion<br />
observed at the 15 minute reaction time. One possibility is that "coke" deposits<br />
on the Co-Mo/A1203 catalyst are responsible for apparent low conversion much the<br />
same as observed in the run with Kentucky No. 9 coal with the ceramic material.<br />
The catalyst may cause coke deposition more rapidly than the ceramic material since<br />
the catalytic conversion is higher at all times than the noncatalytic conversion<br />
at 60 minutes with ceramic material present. In addition, the "coke" on the<br />
catalytic material appears to be slowly hydrogenated to yield gaseous and liquid<br />
products at higher conversions as the reaction time increases.<br />
There are a number of possibilities to explain why the catalytic conversion<br />
is lower than the noncatalytic conversion at early reaction times. Another<br />
reason for this may be due to a rapid catalytic conversion to secondary products<br />
compared to the conversion of coal to primary products. Since these catalytic<br />
conversions of primary liquid products are hydrogen consuming, it is possible<br />
that the hydrogen donor solvent (and/or hydrogen) is depleted to the point where<br />
the primary coal liquefaction is hindered because of lower hydrogen concentration.<br />
PROXIMATE<br />
ANALYSIS (WT.%)<br />
Moisture<br />
Ash<br />
VM<br />
FC<br />
ULTIMATE<br />
ANALYSIS (WT.%)<br />
TABLE 1<br />
ULTIMATE AND PROXIMATE ANALYSIS<br />
KY-9 COALa<br />
1.7<br />
10.9<br />
42.1<br />
45.3<br />
KY-11 COALb<br />
6-47'<br />
9.81<br />
38.4<br />
45.7<br />
C 66.5 66.89<br />
H 4.9 4.63<br />
N 0.9 0.54<br />
S 4.3 3.11<br />
aCalorific value, 12,230 BTU/lb.<br />
bCalorific value, 12,310 BTU/lb.<br />
'As received basis.<br />
89
The SRC conversion data in Figure 5 was obtained in the Wilsonville, Alabama<br />
6 tonlday demonstration plant (10)- and the H-coal data was obtained in the 3 ton/<br />
day PDU at Hydrocarbon Research, Incorporated (11). The conversion, compared on a<br />
hydrogen consumption basis, is lower for the runs without a catalyst than when a<br />
catalyst was used.<br />
The conversions in both runs were based on pyridine soluble<br />
materials. Thus, it appears that the data obtained in the nicroautoclave show the<br />
same trend as obtained in the much larger reactors.<br />
1.<br />
2.<br />
3.<br />
4.<br />
5.<br />
6.<br />
7.<br />
a.<br />
9.<br />
10.<br />
11.<br />
REFERENCES<br />
Storch, H.H., L.L. Fisher and G.C. Sprunk, "Hydrogenation and Liquefaction of<br />
Coal ," U.S. Bureau of Mines, 1941, Tech. Paper 622.<br />
Fisher, C.H., G.C. Sprunk, A. Eisner, H.J. O'Donnel, "Hydrogenation and<br />
Liquefaction of Coal," U.S. Bureau of'Mines, 1942, Tech. Prog. Report 642.<br />
Stopes, M.C., Roy. SOC. London, Proceedings, Series 6, 1919, V, 90.<br />
Storch, H.H., Industrial and Engineering Chemistry, 1937, 29, No. 12, 1376.<br />
Given, P.H., D.C. Cronauer, W. Spackman, H.L. Lovell, A. Davis and B. Biswas,<br />
Fuel 1975, 54, 34.<br />
Given, P.H., D.C. Cronauer, W. Spackman, H.L. Lovell, A. Davis and B. Biswas,<br />
Fuel 1975, 54, 40.<br />
Given, P.H., W. Spackman, A. Davis, P.L. Walker, H.L. Lovell and M. Coleman,<br />
"The Relation of Coal Characteristics to Liquefaction Behavior," 1976, FE<br />
2494- 1.<br />
Given, P.H., W. Spackman, A.<br />
1977, FE 2494-2.<br />
Davis, P.L. Walker, H.L. Lovell and M. Coleman<br />
Schall, J., "Compilation and Assessment of SRC Experience:<br />
1979, EPRI AF-1019.<br />
Data Book,"<br />
Weber, W.H., J.W. Roberts, G.B.<br />
Hollenack, C.R. Mcllwain, A.K.<br />
Vsnick, B.H. Cottle, Jr., C.T. Harwell, M.R.<br />
Rao, C.G. Churchman, F.L. Pate and G. Haider,<br />
EPRI AF-918, Nov., (1978), page 191.<br />
H-Coal Integrated Pilot Plant, Phase 1, Final Report, Vol. 11, July (1977).<br />
90
' ""I<br />
1/16" dia. Thermocouple<br />
/-<br />
lass Liner Tube<br />
,,-/Reactor Wall, SS-316<br />
Figure 1. A schematic drawing of the bottom portion<br />
of the microautoclave reactor.<br />
Reaction time 15 min.<br />
Kentucky Coal #11<br />
Toluene/coal = 2/1 wt.<br />
nonca ta lyt ic conv.<br />
initial H2 press. 500 psig<br />
particle size 16-35 mesh<br />
I<br />
0<br />
I<br />
01 I I I I<br />
350 400 450 500<br />
TEMPERATURE (OC)<br />
Figure 2. The dependence on the conversion for the noncatalytic<br />
reaction at fifteen minutes reaction time.<br />
91
0<br />
I 0<br />
\<br />
- I I I<br />
e m ru<br />
I I I I<br />
0<br />
m m<br />
cn cn m m m m m<br />
92<br />
(4eu %) NOISLEIAN03<br />
S<br />
0 .-<br />
ln<br />
L<br />
a,<br />
5<br />
E<br />
0<br />
u<br />
u<br />
.P<br />
c,<br />
P<br />
a
I IJU<br />
BO<br />
60<br />
40<br />
2c<br />
(<br />
@ Non-cat. Ky #11, 400-<br />
45OoC<br />
Catalyst Ky #11, 45OoC<br />
0 10 20 30 40 50 60<br />
Figure 4.<br />
catalyst.<br />
REACTION TIME (min.)<br />
The time dependency of the conversion with and without<br />
93
~<br />
:,.<br />
0 2%<br />
I I<br />
0 0<br />
Ol W<br />
94<br />
0 ‘oq
K<strong>IN</strong>ETICS AND MECHANISMS <strong>OF</strong> <strong>THE</strong> HYDROLIQUEFACTION <strong>OF</strong> COAL:<br />
ILL<strong>IN</strong>OIS NO. 6, BURN<strong>IN</strong>G STAR COAL <strong>IN</strong> SRC-I1 HEAVY DISTILLATE*<br />
M. G. Thomas and T. C. Bickel<br />
Sandia National Laboratories, Albuquerque, NM 87185<br />
Introduction<br />
Four major industrial processes are currently being applied to<br />
Coal liquefaction at the demonstration level, H-Coal1, Exxon Donor<br />
Solvent (EDS)2, plvent Refined Coal I (SRC-I) and Solvent Refined<br />
Coal.11 (SRC-11) . One of the reasons for parallel development of<br />
these processes is the lack of basic understanding of the reaction<br />
mechanisms, activation energies, and rates of reaction of coal liquefaction.<br />
We have begun a multifaceted program to delineate information<br />
on a number of coal-solvent combinations in order to develop a<br />
process kinetic model for coal liquefaction that will better enable<br />
process designers to make sound technical decisions.<br />
The present study has been conducted to obtain rates of reaction<br />
and activation energies for one coal--Illinois No. 6, Burning Star<br />
high volatile bituminous coal--and one solvent--coal-process derived<br />
SRC-I1 Heavy Distillate (450-850<strong>OF</strong> distillation range). Coal to solvent<br />
ratio, reaction time, temperature, and pressure are variables in<br />
a parametric study between 275OC and 475OC. Two different types of<br />
reactors were employed, a microreactor system for screening and a<br />
continuous flow reactor for the derivation of kinetic data. No attempt<br />
to generalize the results is made; although the autors believe that<br />
the descriptions contained are applicable to other systems. Generalizations<br />
will be attempted as the overall study continues.<br />
Experimental<br />
Illinois No. 6, Burning Star Mine coal was used in all experiments.<br />
The coal was ground to -45 mesh and riffled into 1 gallon containers.<br />
Proximate and ultimate analyses are provided in Table I. The liquefaction<br />
solvent used was untreated SRC-I1 heavy distillate received<br />
from the Ft. Lewis, Washington Pilot Plant. Elemental analysis,<br />
gravity, and boiling range is provided in Table 11. Although the<br />
solvent was a 450-850°F cut, it contained % 5-10% pentane insoluble<br />
material. The solvent was received in 55 gallon drums, rolled, and<br />
transferred to 5 gallon cans from where it was sampled.<br />
Microreactors were used to study the initial dissolution of coal<br />
and the effects of solvent/coal ratio on conversion. The microreactors<br />
have a total volume of % 20 cm3, and are designed to operate between<br />
0-2000 psi hydrogen and 25-500OC. The total mass of the reactors is<br />
0.6 Kg. A Tecann fluidized bed sand bath is used for rapid reactor<br />
heating and provides a 2-2.5 minute heat-up time. A water quench<br />
provides a 90 sec quench between 400° and 5OOC. Wrist-action shaking,<br />
'I, 300 cpm, with a 2-inch stroke, is used for mixing. Mass balances<br />
are routinely within 1% based upon total reactor charge.<br />
Data for the rates of reaction and activation energies were<br />
obtained using a non-recycle continuous flow tubular reactor, Figure 1.<br />
The reactor consists of 4 independently heated stages (.203" ID heli-<br />
cal coils) and was operated isothermally at 400°, 425', 450°, and 47SoC,<br />
* This work supported by the U.S. Department of Energy.<br />
95
Table I. Proximate and Ultimate Analysis of Illinois No.<br />
Burning Star Coal<br />
Proximate Analysis Wt %<br />
6<br />
Moisture 3.41<br />
Ash 10.39<br />
Volatile 36.70<br />
Fixed Carbon 49.50<br />
Ultimate Analysis Wt %<br />
Moisture 3.41<br />
Carbon 69.90<br />
Hydrogen 4.59<br />
Nitrogen<br />
Chlorine<br />
1.15<br />
0.07<br />
Sulfur 3.06<br />
Ash 10.39<br />
Oxygen (dif f) 9.43<br />
Sulfur Form Wt %<br />
im-m<br />
Pyritic 1.11<br />
Sulfide 0.09<br />
Organic (diff 1 1.86<br />
Total Sulfur 3.06<br />
Table 11. Analysis of SRC-I1 Heavy Distillate<br />
Ash (9) 0.05<br />
Carbon (8) 89.8<br />
Hydrogen (%) 7.6<br />
Nitrogen (%) 1.4<br />
Sulfur (%I 0.4<br />
Oxygen (%I 1.8<br />
Pentane Insols 6%<br />
D i s t i 1 1'a te 86.5 850'F<br />
Yield<br />
at coal plus solvent mass flowrates of 0.7 to 6 lb/h, hydrogen pressure<br />
of 2000 psi, and gas flowrates of 10-200 MSCF per ton of coal.<br />
Reaction temperatures are predicted to be attained within 6.5 ft of<br />
the reactor inlet and the total length of the reactor was varied<br />
between 10-83.5 ft. Liquid and gas samples are obtained separately<br />
at atmospheric pressure.<br />
Data reported are obtained from analyses<br />
of samples withdrawn at steady state conditions; i.e., after 1.5 h at<br />
fixed reactor operating conditions. The coal derived products, ob-<br />
tained at the conclusions of the runs, were extracted exhaustively<br />
into pentane-soluble (oil), benzene-soluble pentane-insoluble (asphal-<br />
tene), THF-soluble benzene-insoluble (preasphaltene), and THF-insolu-<br />
ble (inorganics + IOM) fractions. Elemental analyses were provided<br />
96
y Huffman Laboratories. Viscosities were measured with a Brookfield<br />
model LVT viscometer. Gas samples were obtained at all conditions and<br />
analyzed with an nP 5840 gas chromatograph equipped with a TC detec-<br />
tor. The columns are teflon-lined aluminum packed with 800-100 mesh<br />
Poropak q.5<br />
Results and Discussion<br />
In order to establish a kinetic model for coal liquefaction, we<br />
have endeavored to determine a stepwise reaction mechanism. The proposed<br />
first step is the dissolution of coal. Data from microreactor<br />
runs in the temperature range 275°-3750C--below typical liquefaction<br />
temperatures--are presented in Table 111. There is a small solubility<br />
of coal in the solvent at low temperatures, and marked increases at<br />
temperatures between 275OC and 35OOC. Equilibrium in terms of gas<br />
make and solubility are attained rapidly. Up to 350'C the SRC-I1<br />
solvent is depleted.<br />
Solvent is a reactant with c0al.l The stoichio-<br />
metry of the coal-solvent reaction can be estimated by weight loss of<br />
solvent and net THF sols. Based upon these data, it appears that the<br />
reaction can be represented as<br />
1 Coal + 3 Solvent + 3 Preasphaltene.<br />
This stoichiometry is also consistent with published values for molecular<br />
weights of solvent (250), preasphaltene (1000) , and coal (2250)6.<br />
The stoichiometry and approximate molecular weights establish a mass<br />
balance for the initial dissolution step. It is also seen that it is<br />
primarily the pentane insoluble fraction of the initial solvent--the<br />
heavier, more functional portion--that reacts with coal in this initial<br />
reaction.<br />
The second reaction step appears to be the decomposition of preasphaltene.<br />
In a recent study, reactions of preasphaltene and asphaltene<br />
obtained from liquefaction experiments with another Illinois No. 6<br />
coal, River King, were shown to react thermally<br />
Preasphaltene + Asphaltene 400-425OC<br />
Asphaltene + Oil.<br />
7<br />
10-15 minutes<br />
Both coal-derived substrates appear to react in a series reaction path,<br />
ultimately producing oil. Thus, the mechanistic reaction path used<br />
for subsequent kinetic analysis is<br />
1<br />
Coal + Solvent- Preasphaltene<br />
Oil- Asphaltene 2<br />
Although the production of gas accompanies each step, the primary gas<br />
production occurs at short time and is primarily (in terms of mass)<br />
associated with coal.<br />
Kinetics Treatment<br />
The coal liquefaction reaction kinetics were determined using data<br />
from a non-recycle continuous tubular flow reactor (Figure 1). The<br />
reaction mechanisms were the result of the microreactor experiments<br />
previously described. The scale-up to the continuous flow reactor is<br />
necessary for reaction kinetics in order for industrial application of<br />
the results because the microreactor eliminated aspects of the overall<br />
reaction scheme such as hydrogen mass transfer, and multiphase flow<br />
regimes, and mixing.<br />
97
Table 111. Microreactor Data from Liquefaction Runs Between 215-375°C<br />
Run<br />
No.<br />
1<br />
2<br />
3<br />
4<br />
. 5<br />
6<br />
7<br />
8<br />
9<br />
Run<br />
Temp<br />
OC<br />
275<br />
300<br />
300<br />
325<br />
325<br />
- 350<br />
375<br />
315<br />
Blank<br />
rameters<br />
Time<br />
6.5 min<br />
6.5 min<br />
26 rnin<br />
6.5 rnin<br />
26 rnin<br />
6.5 min<br />
6.5 min<br />
26 min<br />
-<br />
-<br />
Gas<br />
-<br />
c02 -<br />
1.49<br />
1.25<br />
1.85<br />
1.32<br />
1.83<br />
1.84<br />
2.30<br />
2.12<br />
-<br />
-<br />
'1-'4 PreA<br />
.04<br />
.50<br />
-59<br />
.03 ,41<br />
.09 .60<br />
.11 .65<br />
.47 -92<br />
1.29 .90<br />
- Io<br />
Produl<br />
THF<br />
Insols<br />
2.3<br />
2.1<br />
2.1<br />
1.7<br />
1.6<br />
1.5<br />
1.2<br />
1.0<br />
2.67<br />
- , Wt g&<br />
-<br />
.46<br />
.31<br />
.48<br />
.38<br />
.61<br />
-<br />
-<br />
.58<br />
g<br />
-<br />
4.7<br />
5.0<br />
5.2<br />
5.2<br />
5.1<br />
-<br />
-<br />
4.8<br />
-<br />
Convers<br />
Toluene<br />
-<br />
-1<br />
-1<br />
15<br />
11<br />
16<br />
-<br />
-<br />
-<br />
-<br />
,n<br />
-<br />
THF<br />
15<br />
24<br />
24<br />
40<br />
44<br />
44<br />
61<br />
10<br />
Because of the complicated multiphase flow in the reactor, we<br />
are unable (at this time) to quantitatively determine the residence I<br />
time of each reactant phase in the reactor. As a consequence, reac-<br />
tion times are expressed as space time, 8, i.e.,<br />
e =<br />
Volume of Reactor ft<br />
3<br />
-hr<br />
Coal/Solvent Slurry Mass Flowrate (r )<br />
It is possible to determine the activation energy of the various<br />
liquefaction reactions, but the pre-exponential multiplier (frequency<br />
factor) in the Arrhenius type rate constant will be a function of the<br />
spacetime and therefore is questionable when used in other reactor<br />
systems.<br />
The data obtained using the flow reactor were analyzed as previously<br />
described. The product slate from the reactor was found to be<br />
independent of the gas flowrate over the range used (10-200 MSCF/ton<br />
coal).<br />
Thus, hydrogen transfer from the vapor phase to the liquid<br />
phase was insignificant for this work and was eliminated from the<br />
further consideration. The kinetic parameters were estimated using a<br />
non-linear minimization algorithm (Powell's con jugate gradient method81<br />
in conjunction with a Runga Khulta 7/8 numerical integrator.<br />
upon the reaction mechanism and stoichiometry determined from the<br />
microreactors, a component mass balance can be written for the<br />
- k2<br />
- 0 SI<br />
Based<br />
-<br />
1
where: [C] = weight fraction in whole liquid product (WLP)<br />
of coal<br />
[PI = weight fraction in wLP of preasphaltene<br />
[A] = weight fraction in WLP of asphaltene<br />
[SI = weight fraction in WLP of solvent<br />
[GI = weight fraction gas (C1-C4, CO, COz, H2S)<br />
3<br />
t = space time (hr ft /lb,,,)<br />
kl-k7 = Arrhenius rate constants.<br />
The reaction rate constants k -k were determined numerically<br />
using the data obtained from the t&bu?.ar flow reactor at a given<br />
reactor isothermal operating condition (i.e., Figure 2 as an example).<br />
For a given set of k -k7, the concentration profiles as a function of<br />
space time of IC], [&I, [AI, IS], and [GI can be obtained by numeri-<br />
cally integrating the mass balance equation (eqns 1-5) using the<br />
concentration profiles. By using the deviation between the calculated<br />
and experimental concentration profiles as the objective function of<br />
an unconstrained minimization algorithm, e.g.,<br />
*<br />
where: Cij = weight fraction of component j at space time ti<br />
C. (t ) = calculated weight fraction of component j at<br />
7 i time ti<br />
n = number of components (n = 5)<br />
m = number of experimental data points<br />
an optimal set of reaction rate constants kl-k7 can be obtained. The<br />
technique in effect chooses the best set of k -k in order that the<br />
deviation between the experimental and calculate2 concentration profiles<br />
is minimized. A set of optimal reaction rate constants is<br />
obtained for each isothermal reactor data set. Shown in Figure 2 are<br />
the experimental data and the calculated concentration profiles of the<br />
99
-coal, preasphaltene, asphaltene, solvent, and gas components obtained<br />
during the 450OC isothermal reactor run. Here, agreement between the<br />
experimental data and the predicted concentrations is within experi-<br />
mental precision, 2 2% absolute. The treatment considers isothermal<br />
conditions and the initial preasphaltene and IOM concentrations are<br />
extrapolated from tubing reactor experiments. Activation energies<br />
for the series reactions are presented in Table IV.<br />
Table IV. Activation Energies for Selected Liquefaction<br />
Reactions<br />
Activation Energies Reaction<br />
15 Preasphaltene + Asphaltene<br />
21 Asphaltene -+ Oil<br />
32 Coal + Preasphaltene<br />
Activation energies are obtained from an Arrhenius treatment of rate<br />
constants obtained at four temperatures, 400, 425, 450, and 475'C.<br />
The treatment of the entirety of these data is beyond the scope of<br />
this presentation and can be found elsewhere.9<br />
Summarv<br />
We have shown that the liquefaction of Illinois No. 6 Burning<br />
Star coal in SRC-I1 Heavy Distillate procedes via a series reaction:<br />
Gas<br />
-> Preasphaltene-Asphaltene<br />
Solvent<br />
t<br />
From parametric studies in tubing reactors and a continuous tubular<br />
flow reactor, we have calculated stoichiometries, rate constants, and<br />
activation energies. The stoichiometries for the reaction at 45OOC<br />
were<br />
Coal t 3 Solvent -+ Preasphaltene<br />
Preasphaltene + 2 Asphaltene<br />
Asphaltene + 3 Oil<br />
Activation energies for the preasphaltene and asphaltene conversions<br />
are 15 and 21 Kcal/mole, respectively.<br />
References<br />
1. Comolli, A. G., Bernard, R. R., and Johanson, E. S., "Advances in<br />
H-Coal," Proceedings of the 14th Intersociety Energy Conversion<br />
Engineering Conference, Vol. 1, pp. 815-820, August 5-10, 1979.<br />
2. Epperly, W. R., Schutter, R. T., "Donor Solvent Coal Liquefaction<br />
Process," Coal Processing Technology, Vol. V, AIChE, 1979.<br />
3. Schmid, B. X., and Jackson, D. M., "Liquid and solid Fuels by<br />
Recycle SRC," Coal Processing Technology, Vol. V, AIChE, 1979.<br />
100
'4. Thomas, M. G., Traeger, R. K., "A Low Temperature Reaction Path<br />
for Coal Liquefaction," Preprints of the National ACS Meeting,<br />
Div. of Fuel, Vol. 24, No. 3, September 1979.<br />
5. Thomas, M. G., Noles, G. T., "Sandia Fossil Fuel Analytical<br />
Laboratory,'' Sandia National Laboratories Report SAND-78-0088,<br />
April 1978.<br />
6. Sternberg, H. W., Raymond, R., and Schweighard, F. K., Science,<br />
188, 49 (1975).<br />
7. Thomas, M. G., Sample, D. G., Floyd, J. L., "Selectivity Of<br />
Catalysts Toward Coal-Derived Products," submitted to FUEL,<br />
January 1980.<br />
8. Himmelblau, D. M., Applied Non-linear Programming, McGraw-Hill,<br />
New York, 1972.<br />
9. Thomas. M. G.. Bickel. T. C., "The Kinetics and Reaction Mechanisms<br />
in coai Liquefaction, manuscript in preparation.<br />
CELL YURRI<br />
A0<br />
1<br />
YOLlEN YLl UTI(.<br />
1UmNG COIL<br />
,Y<br />
MUCK PRESSURE<br />
I)ECUUTOII<br />
WID PROWCl<br />
Figure 1. Continuous Coal Liquefaction Reactor<br />
101<br />
A<br />
I<br />
KmNH
Figure2. Experimental data and model predictions of<br />
Concentrations as a function of time.<br />
102
Chemical Changes In Coal Liquefaction<br />
N. C. Deno, Kenneth W. Curry, J. Edward Cwynar, A. Daniel Jones, Robert D. Minard,<br />
Thomas Potter, Walter G. Rakitsky, and Karen Wagner<br />
Department of Chemistry, Pennsylvania State University, University Park,<br />
PA 16802<br />
Mobil Research and Development Corp. supplied five coals and their soluble<br />
and insoluble fractions after 3 mins solvent refining and their soluble<br />
fraction after 90 mins solvent refining. All samples were oxidatively<br />
degraded with CF3C03H-H2S04. The major effects of solvent refining on molecular<br />
structure were the large increases in arylmethyl, arylphenyl, and total aromatic<br />
material.<br />
Liquefaction (solvent refining) of coal involves thermolysis of benzyl-oxygen<br />
and/or benzyl-benzyl bonds as the first step in the depolymerization. This<br />
view derives from NMR studies1, studies with model compounds1r2, and oxidative<br />
degradations with Na2Cr 073 and CF3C03H24. The oxidative degradations with<br />
CF3C03H are now extende8 to five new coals.<br />
Products have been determined from<br />
the original coal, the soluble and insoluble fraction after 3 mins. and the<br />
soluble fraction after 90 mins. The data are summarized in Tables 1 and 2.<br />
The best method for determining the amount of arymethyl groups in coals is<br />
from the yield of acetic acid formed in oxidative degradation with CF3C03H-H2S044-6.<br />
The data from this method are shown in Table 1. The following observations and<br />
interpretations are made.<br />
1. A sharp increase in arylmethyl accompanies liquefaction in all five<br />
coals and in two coals which were studied earlier4. This increase is the result<br />
of thermal cleavage to benzyl radicals and abstraction of hydrogen atoms by the<br />
benzyl radicals to form arylmethyl.<br />
2. All five coals give about the same percenta3.e increase in arylmethyl<br />
after 90 mins nf sclvert refining, but not after 3 mins. This indicates that<br />
benzyl radicals form from more than one type of structure. Arylmethyl formation<br />
is 87-99% complete in the last three coals in Table 1 after 3 mins whereas it is<br />
only 33% and 50% complete in the first two coals. Based on studies of model<br />
compounds1t2, it is attractive to ascribe arylmethyl formation in 3 mins to<br />
cleavage of benzyl ethers and slower cleavage to bibenzyl structures. Despite<br />
the obvious oversimplification, this is the best estimate as yet of the rela-<br />
tive amounts of C-0 and C-C cleavage. It is also direct evidence for bibenzyl<br />
structures in PSOC 372 and 330 and the first direct evidence for such structures<br />
in any coal.<br />
3. It might have been expected that the more arylmethyl, the more<br />
cleavage, and the more SRC. In fact the opposite is shown in Table 1. The<br />
conflict would be resolved if coal liquefaction depended more on certain critical<br />
cleavages and the conversion of a 3-dimensional polymer to a 1-dimensional<br />
polymer than on the total amount of cleavage and the extent of depolymerization.<br />
4. The amount of arylmethyl in the residue (3 min) is about the same as<br />
in the original coal. This indicates that arylmethyls do not play any role in<br />
liquefaction as expected.<br />
103
5. No higher homologs of acetic acid were observed indicating the<br />
absence of arylalkyls above methyl.<br />
The data in Table 2 show that biaryl structures are rare or absent in the<br />
original coals but appear in significant quantity on liquefaction. The foremost<br />
evidence for this are the changes in yields of benzoic acid (column 136).<br />
This product was not observed from any of the five coals, but it was an important<br />
product from SRC (solvent refined coal). Model studies have shown that benzoic<br />
acid forms from biphenyl and other biaryls in which one of the phenyl rings is<br />
unsubstituted. It does not form from alkylbenzenes, a variety of polyaromatics,<br />
and many other model compoundsbf6.<br />
There are three other products in Table 2 whose appearance or increase indi-<br />
cate biaryl structures. These are benzene-1,4-dicarboxylic acid (194b).<br />
benzene-1,3-dicarboxylic acid (194c), and benzene-1,3,5-tricarboxylic acid<br />
(310b). All have non-adjacent carboxyl groups. These are more characteristic<br />
of biaryl structures in contrast to fused aromatics which form products with<br />
adjacent (1,2) carboxyls.<br />
We interpret the appearance of simple phenyl substituents to the reductive<br />
removal of the heteroatom in benzthiophenes, benzfurans, and possibly<br />
benzpyrroles. If one of the benz rings is unsubstituted, such a reductive<br />
hydrogenolysis would create a simple phenyl group attached to the remaining<br />
polymer by a biphenyl type of bond. While phenyl groups would also be generated<br />
by hydrogenolysis of fluorenes, fluorenes are expected to be stable under the<br />
conditions of liquefaction.<br />
On the basis of oxidative degradations of Illinois no. 6 and Wyodak coals<br />
before and after liquefaction, it was concluded that the aromatic structure<br />
increases on liquefaction4. The evidence was an increase in phthalic<br />
(benzene-1.2-dicarboxylic) acid, which is the dominant product from most<br />
polyaromatic systems'.<br />
The increase in aromatic structure is also shown by certain lactones which are<br />
minor products from oxidation of a variety of polyaromatic hydrocarbons5.<br />
They appear from oxidation of the solvent refined samples but not from the<br />
original coals (Table 4).<br />
Oxidation of coals with 40% HNOs at 60' provides a reliable method for<br />
determining the amounts and lengths of linear alkane chains in coals by<br />
converting such chains to linear diacids of two less carbons7. As expected,<br />
the amounts and lengths showed no change on solvent refining on Illinois no. 6<br />
Monterey coal.<br />
Illinois no. 6 Monterey coal and Wyodak coal showed marked decreases in the<br />
yields of succinic acid after solvent refining4. This was interpreted as<br />
showing a marked decrease in dihydrophenanthrene structures. This decrease<br />
in succinic acid product is not shown by the five coals in Table 2. It is<br />
possible that dihydroaromatic structures donate hydrogen to benzyl radicals<br />
but are regenerated by transfer of hydrogen from solvent to the coal polymer.<br />
ACKNOWLEDGEMENT<br />
We are grateful for support for this work from EPRI (Electric Power Research<br />
Institute) and DOE (U.S. Department of Energy). We are also grateful to<br />
104
Dr. Duayne D. Whitehurst of Mobil Research and Development Corporation for<br />
supplying the samples of coals and solvent refining coals.<br />
EXPERIMENTAL<br />
The samples were kindly provided by Dr. D. D. Whitehurst of Mobile Research<br />
and Development Corporation. The parent coals were bituminous and had been<br />
originally obtained from the Penn State Coal Base and carry their code number.<br />
The procedure for oxidation with CF3C03H-H,S0, is identical to that reported<br />
earlier'. The analysis and conversion to methyl esters was modified as follows.<br />
The acetic acid was determined from the proton magnetic resonance<br />
spectrum of the filtered reaction mixture. The area of the acetic acid peak<br />
was compared to the area of the peak of a weighed amount of DSS as originally<br />
described'. This method is preferable to the distillation method5 providing<br />
line broadening is not too severe.<br />
The isolation of the methyl esters has been made more quantitative by modifying<br />
the procedure for isolation. The removal of volatile material and the<br />
conversion to methyl esters was unchanged'. After esterification with BF<br />
3<br />
in methanol, 100 cm3 of saturated aqueous NaCl was added and the mixture<br />
extracted with three 35 cm3 portions of CHzC12. The combined CHzClZextracts<br />
were washed with 100 cm30f 3% NaHC03 followed by washing with saturated aq.<br />
NaC1. A weighed amount of acetophenone was added as an internal standard.<br />
The solution was dried over MgSOs. The responses to the detector in the gas<br />
chromatogram were calculated from effective carbon numbers as before'.<br />
REFERENCES<br />
1.<br />
2.<br />
3.<br />
4.<br />
5.<br />
6.<br />
7.<br />
Whitehurst, D. D., Mitchell, T. O., Farcasiu, M., and Dickert, J. J., Jr.,<br />
"The Nature and Origin of Asphaltenes in Processed Coals," EPRI Report<br />
AF-480, Second Annual Report under Project RP-410-1, July 1977<br />
Hayatsu, r., Winans, R. E., Scott, R. G., Moore, L. P., and Studier, M. H.<br />
in Organic Chemistry of Coal, Am. Chem. SOC. Symposium Series No. 71,<br />
J.W. Larsen, ed., 1978<br />
Benjamin, B. M., Raaen, V. F., Maupin, P. H., Brown, L. L., and Collins, C. J.<br />
Fuel 1978, x, 269<br />
-<br />
Deno, N., Greigger, B. A., Jones, A. D., Rakitsky, W. G., Whitehurst, D. D.,<br />
and Mitchell, T. 0. Fuel, in press<br />
Deno, N., Curry, K. W., Greigger, B. A., Jones, A. D., Rakitsky, W. G.,<br />
Smith, K. A., Wagner, K., and Minard, R. D. e, in press<br />
Deno, N., Greigger, B. A., and Stroud, S. G. Fuel 1978, 57, 455<br />
Deno, N., Curry, K. W., Jones, A . D., Keegan, K. R., Rakitsky, W.G.,<br />
Richter, C. A., and Minard, R. D. Fuel, submitted<br />
105
Table 1 Yields of acetic acid from oxidative<br />
degradations with CF CO H-H2S04<br />
3 3<br />
Penn State coal base numbera<br />
372 330 256 312 405<br />
Kentucky Penn. Penn. Arizona Oklahoma<br />
Imboden Middle Lower Red Lower<br />
Name Kittaning Freeport Hartshorne<br />
% liquifieda 79 70 65 51 25<br />
(3 min)<br />
% C (maf) 85.9 83.5 88.2 ' 78.4 89.8<br />
rank HVA HVB med. vol. HVC low vol.<br />
Yield of acetic acid (meq. per g of rnaf) b<br />
parent coal 0.44 0.33 0.31 0.42 0.31<br />
SRC (3 min) 0.77 0.74 1.05 1.46 1.51<br />
SRC (90 min) 1.45 1.15 1.06 1.60 1.69<br />
residue 0.33 0.41 0.27 0.27 0.24<br />
(3 min)<br />
aSamples and liquefaction data were supplied by D. D. Whitehurst,<br />
Mobil Research and Development Corp.<br />
bThe percentages of moisture (m) and ash (a) are available from the<br />
Penn State Coal Base computer printouts. The SRC samples had<br />
negligible moisture or ash. In calculating the yields of acetic<br />
acid from the residue, it was assumed that all of the ash in the<br />
coal was retained in .the residue in correcting to a maf (moisture<br />
and ash free) basis.<br />
106
I<br />
0 VI<br />
?*<br />
3:<br />
m<br />
0<br />
u<br />
m<br />
h<br />
u<br />
c U<br />
.rl<br />
3<br />
;<br />
.rl<br />
U<br />
m<br />
a<br />
t4<br />
M<br />
a<br />
m<br />
vi 3<br />
U<br />
m<br />
.rl<br />
a<br />
x<br />
E<br />
t4<br />
W<br />
rd v)<br />
u<br />
U<br />
1<br />
a<br />
h<br />
a<br />
v(<br />
0<br />
n<br />
W<br />
E<br />
M<br />
a<br />
M<br />
E<br />
w<br />
v)<br />
'd rl<br />
.rl<br />
h<br />
m<br />
U<br />
.-I 3<br />
0<br />
v)<br />
P<br />
4<br />
N<br />
0<br />
rl<br />
P<br />
F<br />
Q<br />
3<br />
m<br />
3<br />
i<br />
.l<br />
Q<br />
u<br />
A<br />
U<br />
td<br />
U<br />
A<br />
\1<br />
0 . u<br />
0<br />
P<br />
n<br />
-I<br />
n<br />
Q<br />
n<br />
-I<br />
m<br />
P<br />
n<br />
-I<br />
0<br />
n<br />
-I N<br />
ld<br />
I)<br />
4 N<br />
* 3<br />
N<br />
9 ?-I<br />
d<br />
9<br />
U<br />
rl<br />
N<br />
m<br />
rl<br />
N<br />
U<br />
(0<br />
rl<br />
><br />
5<br />
E<br />
v(<br />
0<br />
52<br />
; ?7?<br />
IO00<br />
'm..-j. I<br />
ION I<br />
m0r.m .... mmam<br />
I quu<br />
I * . I O N 0<br />
I I 1 0<br />
I l l - IIId<br />
....<br />
r.r.m-<br />
0000<br />
mr-mr. .... urn-0<br />
r.mr.a .... horn"<br />
drlrl<br />
I "ip:<br />
I orlo<br />
a - u m<br />
ddU4<br />
I r.rlL!l<br />
I ... IOrlO<br />
.... ???4<br />
I'rl.1<br />
I \ I<br />
I 1 0 1<br />
momN .... r l a m ~<br />
NmON<br />
I N ? I<br />
I . 1<br />
1 0 0 I<br />
...<br />
d<br />
....<br />
....<br />
m m o ?<br />
m m ~ r .<br />
cn-n\D<br />
ONrnd<br />
umrna<br />
OdNO<br />
N u m u .... ONUO<br />
mmrnul<br />
orlmo<br />
NONr. .... ONmd<br />
mqma . . . NONO<br />
rl<br />
mum- .... 0000<br />
7?7?<br />
0000<br />
t q m.. m<br />
rlONN<br />
N*"?rlN ..<br />
0400<br />
.... ?'9?<br />
....<br />
U3r.N.Y<br />
dOON<br />
rl<br />
....<br />
amoN<br />
oorlo<br />
107<br />
I W N O<br />
I I 'p:<br />
I l l<br />
I I 1 0<br />
Y???<br />
ooau<br />
rlrl<br />
comma .... dodo<br />
?:m~ .. NrlOrl<br />
;?a?:<br />
I murl<br />
m m m u .... U N U m<br />
drl<br />
rnr-bm .... marlu<br />
rl rld<br />
?'9?'?<br />
ooorl<br />
o.... n m r l<br />
rlu'Na<br />
?N? 1<br />
000 I<br />
?N??<br />
mr.mo<br />
rl<br />
....<br />
co\Da\D<br />
o ~ m m<br />
tnr. i m<br />
..I.<br />
O N Id<br />
cn\DoIuY .... o m a r l<br />
?"?<br />
dNUN<br />
....<br />
4qmm<br />
O d d 0
Table 3 Identification of products in Table 2<br />
- -__<br />
Mw of Relative GC Name of corresponding acid (X is COOH)<br />
methyl ester ret. time<br />
132 3.20 malonic acid (XCH2X)<br />
14 6 4.60 succinic acid (XCH2CH2X)<br />
13 6 5.15 benzoic acid<br />
204 9.23 1,1,2-ethanetricarboxylic acid<br />
218a 10.54 1,2,3-propanetricarbosylic acid<br />
218b 10.97 oxiranetricarboxylic acid<br />
194a 11.10 benzene-1,2-dicarboxylic acid<br />
194b 11.33 benzene-1,4-dicarboxylic acid<br />
194c 11.58 benzene-1,3-dicarboxylic acid<br />
276 14.33 oxiranetetracarboxylic acid<br />
252a 15.79 benzene-1,2,4-tricarboxylic acid<br />
252b 16.14 benzene-1,3,5-tricarboxylic acid<br />
310a 19.18 benzene-1,2,4,5-tetracarboxylic acid<br />
310b 19.50 benzene-1,2,3,5-tetracarboxylic acid<br />
====--<br />
108
I IT1<br />
I I I<br />
I 1 0 1<br />
....<br />
umor.<br />
0040<br />
mmr. I ... I<br />
000 I<br />
I I m l<br />
I I * I<br />
I 1 0 1<br />
I N mN<br />
I . . .<br />
I O 0 0<br />
<strong>IN</strong>m I<br />
I * - I<br />
1 0 0 I<br />
lNvl I<br />
I - * I<br />
100 I<br />
<strong>IN</strong>N I<br />
I * * I<br />
1 0 0 I<br />
v1I I I<br />
* I I I<br />
0 1 I I<br />
el";'<br />
- 1 I<br />
0 1 0 1<br />
NI I I<br />
*I I I<br />
0 1 I I<br />
4 I m N<br />
.I ..<br />
0 I O 0<br />
I I?'<br />
I I I<br />
I 1 0 1<br />
I I I I I I Y I<br />
I I I I I l l<br />
I I I I I 1 0 1<br />
mr.01 U1-Y-j<br />
...I .I . .<br />
0041 0100<br />
4.... N m m emu31 . . .I<br />
0040 0001<br />
I I I I I I Y I<br />
I I I I I I I<br />
I I I I I 1 0 1<br />
* * I ?N.". I<br />
0 0 0 1 0001<br />
I q"1 I I?U I *I I<br />
1 0 0 1 1 0 0 1<br />
I ?? I I mc14<br />
1 ...<br />
I O 0 I I O 0 0<br />
Ir.O I I 0 U I<br />
I * * I<br />
1 0 0 I<br />
I * . I<br />
1 0 0 I<br />
I I m l l u m I<br />
I I * I I * . I<br />
I 1 0 1 1 0 0 1<br />
N I I I I l l 1<br />
.I I I I I I I<br />
0 1 1 1 I I I I<br />
adlm rnl Ir.<br />
. . I . * I 1 *<br />
0410 0 1 1 0<br />
m l l I I I I I<br />
. I l l I I I I<br />
0 1 1 I I I I I<br />
delN I 1 I ?<br />
. * I . I l l<br />
0010 I I 10<br />
I I Y I I ImN<br />
I I I<br />
I 1 0 1<br />
I I .-<br />
I 1 0 0<br />
n<br />
n E n<br />
h<br />
-€h<br />
-E-<br />
EOE €0 E EO E<br />
0 m m o a mcnm c1 mmm<br />
m vww m vvw 4 vvv<br />
m 4<br />
I mvvln<br />
v 0E:a a,<br />
OUrnVIh<br />
v)<br />
a a Pd<br />
109<br />
I y y I<br />
I O 0 I<br />
&NNU<br />
uddd<br />
4UN. I<br />
. * I<br />
000 I<br />
I Y I I<br />
I I I<br />
1 0 1 I<br />
NE? I<br />
UCd I<br />
1 ' 1 '<br />
I I I<br />
I 1 0 1<br />
uNNal<br />
Uddd<br />
h5Jo'I<br />
QOO I<br />
I Nm I<br />
I * * I<br />
I O 0 I<br />
I I I I<br />
I I I I<br />
I I I I<br />
4 m u 4 ....<br />
07lmm<br />
I I I I<br />
I I I I<br />
I I I I<br />
I a m m<br />
I ... IO00<br />
1I.D.Y<br />
lI ~ l d d i
Table 4 (continued)<br />
aThe following identifications (somewhat speculative) are based on<br />
from chemical ionization mass spectra, the number of carbonyls<br />
from the PlW of the CD30H ester, and fragmentation in electron<br />
impact mass spectra. The MW's in the Table are of the methyl esters<br />
,and the following names are of the corresponding carboxylic acids:<br />
-209, 3-carboxypyridine-2-acetic acid; 239, pyridine-2,x,y-tricarboxylic<br />
acid (the 2-COO11 does not esterify); 253, pyridine-3,4,5tricarboxylic<br />
acid; 297, pyridine-2,3,4,5-tetracarboxylic acid (the<br />
2-COOH does not esterify); 311, a pyridinetetracarboxylic acid.<br />
The lactones (named as the corresponding hydroxy acid) were as<br />
follows: 192, 2'-carboxyphenyl-2-hydroxyacetic acid (a major<br />
product from naphthalene); 250b-e, analogs of 192 with an additional<br />
carboxyl on the benzene ring (one at each of the four positions);<br />
264, 2'-carboxyphenyl-3-hydroxypropanoic acid; 308a and b, analogs<br />
of 192 with two carboxyl groups on the benzene ring; 322, the analog<br />
of 264 with an additional carboxyl group on the benzene ring.<br />
110
SOLUBILT.ZATION <strong>OF</strong> <strong>COALS</strong> By NON-REDUCTIVE ALKYLATION <strong>IN</strong> LIQUID<br />
AMMONIA<br />
M. Gawlak, N. Cyr, D. Carson and B. Ignasiak<br />
Alberta Research Council<br />
11315 - 87 Avenue<br />
Edmonton, Alberta, Canada<br />
In a previous communication we reported that a major portion<br />
of a low rank vitrinite (80.8% C, daf) could be converted to chlor-<br />
oform soluble products by non-reductive ethylation in liquid ammo-<br />
nia (A). This paper presents the results of our more in-depth stu-<br />
dies on non-reductive alkylation of five Cretaceous and two Carbon-<br />
iferous coals. To assist in understanding of the chemical aspects<br />
of the non-reductive alkylation, which has been only marginally<br />
explored in organic chemistry, a considerable amount of work was<br />
carried out on alkylation of various model compounds.<br />
Experiment a1<br />
The particle size of coal samples was reduced to below 300 mesh<br />
and, prior to reaction, the samples were dried in vacuo (13 pascals)<br />
at 7OoC. The reaction was conducted under protective cover<br />
of oxygen-free helium in 150 ml of vigorously stirred liquid ammonia<br />
containing sodium and potassium amides generated "in situ" by<br />
action of anhydrous ferric chloride (0.8-1.0 g) on metallic sodium<br />
(3.0 g) and potassium (3.0 9). Precautions were taken to ensure<br />
that a complete conversion of metals to the respective amides took<br />
place prior to addition of coal sample.<br />
for six hours. 100 ml of anhydrous ethyl ether was added and the<br />
contents were alkylated with 2.05 molar excess (on the combined<br />
alkali metals) of the desired alkyl bromide. Solvents and excess<br />
alkyl bromide evaporated overnight.<br />
The mixture was stirred<br />
The contents were acidified<br />
with 5 N hydrochloric acid, the product was washed thoroughly with<br />
cold water, extracted overnight with refluxing water and dried.<br />
Three successive ethylations were carried out on each sample of<br />
coal.<br />
Alkylation of model compounds was carried out under similar<br />
conditions except that smaller quantities of ammonia (70-80 ml),<br />
ferric chloride (0.5 g), sodium (1.7 g) and potassium (1.7 g) were<br />
used. The amount of substrate was always the same (0.028 M).<br />
Reaction product was recovered either by filtration (solids), or by<br />
extraction with organic solvent (chloroform or ether). Products<br />
were analysed by GC, GC-MS and NMR spectroscopy.<br />
111
Proton and C-13 spectra of soluble products (alkylated coals and<br />
model compounds) were recorded in CDC13 using Brueker WP-80 apparatus.<br />
For C-13 NMR spectra signal accumulation was necessary. C-13<br />
spectra of solid coals were recorded in the Laboratories of the<br />
National Research Council, Ottawa, using a Brueker CXP-180 spectrometer<br />
and cross polarization-magic angle spinning technique.<br />
Number average molecular weights of coal extracts and of their<br />
subfractions were determined in pyridine using Corona-Wescan vapour<br />
pressure osmometer and concentrations 1-20 g/Kg.<br />
GPC fractionation was carried out on column of Sephadex LH-60,<br />
an hydroxypropylated dextran gel, 80 cm in length and 2.5 cm in<br />
diameter using chloroform as solvent.<br />
Results and Discussion<br />
Alkylation of Coals. The information regarding the origin and<br />
rank of coals tested and the results of alkylation studies conducted<br />
on these coals is summarized in Table 1. The number of alkyl<br />
groups introduced into coal varied from 7 to 18 per 100 original<br />
carbon atoms. The carboniferous coals tested in these studies<br />
appeared to be more susceptible to solubilization than their Cretaceous<br />
counterparts. Alkylation took place on both oxygen and<br />
carbon atoms. Depending on coal, the ratio of alkylated oxygen to<br />
alkylated carbon atoms varied from 0 (coal 115) to approximately<br />
0.5 (coals P1, 2 and 3).<br />
Long chain alkyl groups, n-butyl and n-hexyl, seem to alkylate<br />
hydroxyl groups more efficiently than short chain, ethyl groups.<br />
There is a residual level of hydroxyl groups which defies ethylation.<br />
No simple relationship exists between the number of alkyls<br />
introduced and the degree of solubilization.<br />
Non-reductive alkylation of coal 117 led to high conversion of<br />
this coal to chloroform soluble product. Extraction of a small<br />
sample (0.5 g) of triply ethylated coal resulted in 63% solubility.<br />
However, when larger sample (10 g) was similarly extracted, the<br />
solubility was lowered to 48.1%. Essentially the same total solubility<br />
(49.6%) was obtained when ethylation was alternated with<br />
extraction after each of the three ethylation steps. Such experimental<br />
sequence will be referred to in this text as alternate ethylations<br />
l, 2 and 3.<br />
Number average molecular weights of fractions solubilized by<br />
either method are similar: 1260 for triply ethylated coal, and<br />
1140, 1300 and 1250 for soluble parts of alternate ethylations 1, 2<br />
and 3 respectively.<br />
Gel permeation chromatography of solubilized fraction of triply<br />
ethylated coal showed that 8.7% of sample had molecular weight of<br />
15,440; 11.2% - 10,430; 10.4% - 5,740; 12.3% - 2,570; 35.2% - 910<br />
to 1,040; 10.4% - 875; 2.6% - 580; and 9% of sample was not recovered<br />
from the column, even after the polarity of chloroform was increased<br />
by addition of 1% ethanol.<br />
NMR Spectra. NMR spectra of untreated solid coal #7 and of its<br />
solubilized fractions are reproduced in Figures 1-4. Comparison of<br />
112
I<br />
1<br />
the aliphatic region of C-13 spectra of our fractions with C-13<br />
spectra of solid coal, coal liquids and coal extracts published in<br />
literature (2, 2, A) is made in Table 2. The most consistent and<br />
intense line is that at 29-30 ppm. Absorption bands at 9, 12 and<br />
14 ppm are strong in the fractions of ethylated coal. These bands<br />
are associated with the methyl carbons of the introduced ethyl<br />
groups. This was proven conclusively by ethylation with Dg-ethyl<br />
bromide, which led to disappearance of these bands (Figure 3) together<br />
with elimination of much of the underlying hump in the 25-<br />
35 ppm region (methylene absorptions f3 to an aromatic ring; ref z).<br />
Noticeable difference between the C-13 spectra of non-reductively<br />
solubilized coal and the spectra of fractions resulting from<br />
other methods of solubilization is the C-13 line at 46 ppm. Absorption<br />
band approximating this frequency is seen in the spectrum<br />
of solid coal of Zilm and co-workers (2). It is also present in<br />
coal #7. The environment responsible for this absorption was lost<br />
in other methods of solubilization but was preserved in our alternatively<br />
ethylated samples. The intensity of this spectral line<br />
increases progressively for solubilized fractions of alternate<br />
ethylations from 1 to 3. This strengthening of absorption at 46<br />
ppm seems to be associated with a weakening signal at 29 ppm.<br />
Another relevant observation is that the line at 46 ppm is absent<br />
in triply ethylated coal. It also disappeared on second ethylation<br />
of soluble product from alternate ethylation 1. The above spectral<br />
observations could be interpreted in terms of changes in C-13 chemical<br />
shifts occurring on alkylation of structural unit of coal of a<br />
9,lO-dihydrophenanthrene (DHP) type.<br />
Secondary carbons in 9 and 10 positions of 9,lO-DHP absorb at<br />
29 ppm. On ethylation, when both hydroaromatic carbons are transformed<br />
into tertiary carbon atoms (-CHR-CHR-) their C-13 absorption<br />
shifts to 46 ppm. Under conditions of exhaustive ethylation (triple<br />
ethylation of the same coal sample, and second ethylation of<br />
solubles of alternate ethylation 1) the easily accessible sites do<br />
not exist any more. The more difficult tertiary environments are<br />
then substituted which leads to disappearance of the spectral line<br />
at 46 ppm.<br />
Ethylation of Model Compounds. Eight model compounds (adamantane,<br />
indan, dibenzyl, diphenylmethane, 9,1O-dihydrophenanthrene,<br />
9,lO-dihydroanthracene, fluorene and acenaphthene) were ethylated<br />
under the conditions of non-reductive alkylation of coal. GC-MS<br />
and NMR analyses of the products provided information on relative<br />
reactivity of hydrogen atoms in these compounds (Table 3). Hydrogen<br />
atoms in polycyclic condensed network of adamantane are unreactive.<br />
Negligible monoethylation (0.1%) occurred in indan. Ethylation<br />
of dibenzyl was low, and that of 9,lO-DHP only moderate. Activation<br />
of methylene group by two phenyl rings makes the hydrogen<br />
quite reactive in liquid ammonia.<br />
Activation by phenyl ring and an<br />
olefinic bond as in indene (an impurity in indan) is also effective.<br />
Hydrogen atoms in 9 and 10 positions of dihydroanthracene and in 9<br />
position of fluorene substitute very readily.<br />
113
Acenaphthene produced a puzzle: all of it reacted to give<br />
multiple isomers of di-, tri-, tetra-, and even penta-ethylated<br />
compounds. Ten major and at least twenty minor components resulted.<br />
Work on their identification is now in progress.<br />
The C-13 spectra of ethylated coal and of some of the model<br />
compounds have absorption lines upfield to 8.4 ppm. These are the<br />
absorption lines of the methyl carbons 'd to an aromatic ring. The<br />
presently known upfield absorption limit for the 8 methyl groups<br />
extends only to about 10 ppm (5). In addition to 8.5 band in the<br />
ethylated coals, the high field absorption was observed for the<br />
methyl carbon in diethyldiphenylmethane (8.4 pprn), 9,9,10,10-tetraethyl-9,lO-dihydroanthracene<br />
(8.6 ppm) and 9.9-diethylfluorene (8.5<br />
ppm). C-13 absorption in the region of 46 ppm was observed for<br />
9,10-diethyl-9,10-dihydrophenanthrene (46.3 pprn); 9,10-diethyl-9,-<br />
10-dihydroanthracene (48.4 ppm) and in 1-ethyl-1,2-diphenylethane<br />
(carbon 1-49.9 ppm; carbon 2-43.6 pprn).<br />
Acknowledgement<br />
The authors express their thanks to Dr. J. Ripmeester of the<br />
National Research Council of Canada for recording of the spectra<br />
of samples of solid coal, and for his valuable discussion.<br />
Literature Cited<br />
1. Ignasiak, B.; Carson, D.; Gawlak, M. Fuel, 1979, 2, 833.<br />
2. Fisher, P.; Stadelhofer, J. W.; Zander, M. Fuel, 1978, 57, 345.<br />
3. Zilm, K. W.; Pugmire, R. J.; Grant, D. M.;<br />
W. H. Fuel, 1979, 58, 11.<br />
Wood, R. E.; Wiser,<br />
4. Pugmire, R. J.; Grant, D. M.; Zilm. K. W.; Anderson, L. L.;<br />
Oblad, A. G.: Wood, R. E. Fuel, 1977, 56, 295.<br />
5.<br />
6.<br />
Stothers, J. B., "Carbon-13 NMR Spectroscopy", Organic Chemistry<br />
Monograph Series vol. 14; Academic Press, 1972, p. 97.<br />
Yosuke Maekawa; Tadashi Yoshida; Yuji Yoshida Fuel, 1979, 58,<br />
064.<br />
114<br />
I
c9n<br />
a2<br />
W d<br />
ma<br />
rl<br />
d<br />
-arl<br />
"<br />
A<br />
'9 ?????? ?<br />
n n u ~ u m n<br />
0 0<br />
? ? y : ? - ! ? ? ? ?<br />
m m m w m o y I c d<br />
rl rl<br />
'9<br />
U rl<br />
I<br />
Y<br />
c<br />
?<br />
rl d<br />
d<br />
m<br />
?<br />
c<br />
? ?<br />
c rl N<br />
? ?<br />
N C<br />
rl<br />
'9<br />
9 1 I<br />
rc)<br />
N.?<br />
u m<br />
N rl<br />
'9<br />
VI<br />
? ? Y<br />
m m<br />
h.?<br />
t-c<br />
o"?<br />
Inm<br />
U 4<br />
?<br />
n<br />
rl<br />
h<br />
d<br />
rl<br />
? h . Y ? ? ? Y ?? 0 : ' "<br />
N d r l N r l O d 0 0 0 0 m<br />
n . i f ? ? , I Y ?<br />
U ~ n n 00<br />
'0. S ?<br />
n o n<br />
?<br />
c<br />
I<br />
-!<br />
U<br />
Y<br />
m<br />
?<br />
c<br />
-!<br />
In<br />
B<br />
'9': z!<br />
0:c. y: ? L o 5<br />
n e<br />
- 1 5<br />
. .<br />
r l N<br />
o w m<br />
m w m<br />
. ..<br />
n Q V I<br />
115<br />
a<br />
LI<br />
8<br />
n I c m<br />
m m a<br />
h<br />
- e n<br />
wt.
Sample<br />
coal #7 (solid)<br />
Table 2. Aliphatic Region of C-13 IWR Spectra of Coals and Some Coal<br />
Derived Products<br />
Chemical Shifts, ppm from THS<br />
-46-435 -301* - -19- -14-11-<br />
coal (solid) (2) -44-<br />
-29- -<br />
-20-15coal<br />
extract (2)<br />
37.8 32.4 30.2 29.8 23.1 21.5 19.1 14.2<br />
31.9 - 29.7 22.1 21.4 19.8 14.1<br />
coal liquid (2) 33 - 29 22 20 17 15<br />
coal liquid (5)<br />
triply ethyli 67<br />
d<br />
triply Dg-ethyl-<br />
17<br />
alt.ethylation 1<br />
alt.ethylation 2<br />
alt.ethylation 3<br />
alt. ethylation 1<br />
ethylated again<br />
31 30 22<br />
37 32 _. 29.5 22.5 21.5<br />
-<br />
43 37 32<br />
29.7 23 21.5 19<br />
46 37 33 32 - 29 23 22 19<br />
- 46 32 31 2 22<br />
- 46 29 28 22<br />
-33- - 29 -22-<br />
*-43-iadicates a broad band with a maximum. for example, at 43<br />
**underline indicates a high intensity absorption<br />
116<br />
15<br />
-14 -12 -2-<br />
14<br />
15 14 -2-<br />
15 14 -8.5-<br />
15 14 12-9-<br />
-15-14-12-8.5<br />
1
Model<br />
Compound<br />
Adamant ane<br />
Indan<br />
Dibenzyl<br />
Diphenyl-<br />
methane<br />
9.10-Di-<br />
hydrophenan-<br />
threne<br />
9.10-Di-<br />
hydroanthra-<br />
cene<br />
Fluorene<br />
Table 3. Sunraary Information on Ethylation of Model Compounds<br />
Molar X - Aliphatic C-13 nmr shifts of -<br />
Ratio* Conversion originally present C<br />
modified by ethylation<br />
introduced ethyl<br />
C cn C"2 a 2 m3<br />
1.07 NR**<br />
1.07 99.9 NR<br />
0.1 mono-<br />
1.07 98 NR<br />
2 mono-<br />
2.14 93.6 mono-<br />
6.4 di-<br />
1.07 66.7 NR<br />
24.7 mono-<br />
0.6 di-<br />
1.07 53.4 di-<br />
24.3 tri-<br />
22.3 tetra-<br />
2.14 100 di-<br />
49.9 43.6<br />
53.4<br />
- 40.2 33.6<br />
- 46.3 -<br />
- 48.3 -<br />
56.2 - -<br />
moles of combined alkali metals to moles of hydrogen on o<<br />
carbon to an aromatic ring<br />
** NR - no reaction<br />
117<br />
28.4<br />
28.6<br />
29.4<br />
26.2<br />
27.9<br />
35.2<br />
32.8<br />
12 .o<br />
12.8<br />
8.4<br />
12 .o<br />
12.2<br />
13.3<br />
8.6<br />
8.5
Figure 1. C-13 nmr spectrum of solid coal no. 7.<br />
1 1 1 1 1 1 1 1 1 1 1 1 4 ,<br />
ppm 120 100 80 60 40 20<br />
5<br />
L<br />
h 0<br />
Figure 2. C-13 nmr spectra of solubilized coal no. 7 after:<br />
A-first alternate ethylation; B-second alternate<br />
ethylation; C-third alternate ethylation.<br />
118
I<br />
I<br />
1<br />
1 1 1 1 1 1 1 I I I * 1 1 1 "<br />
ppm from TMS 100 80 60 40 20 0<br />
Figure 3. C-13 nmr spectra of solubilized coal no. 7 after:<br />
A-triple ethylation; B-triple Dg-ethylation.<br />
b<br />
ppm from TMS 100 80 60 40 20 0<br />
Figure 4. C-13 nmr spectra of solubilized coal no. 7 after:<br />
A-first alternate ethylation; B-sample A ethylated<br />
once more.<br />
B
<strong>IN</strong>TROOUCT ION<br />
Reactions of Three Double Ring Heteroaromatic<br />
Model Coal Compounds in Excess Tetralin<br />
R.G. Mallinson, K.C. Chao, and R.A. Greenkorn<br />
School of Chemical Engineering<br />
Purdue University<br />
West Lafayette, Indiana 47907<br />
The liquefaction of coal is one of the ways needed for extending liquid<br />
fuel supplies. In order to better utilize these resources through modelling and<br />
optimization of processes, a fundamental understanding about the nature of the<br />
chemical and physical changes taking place is necessary. One of the major processes<br />
now under development involves a donor solvent to help transfer hydrogen to the<br />
coal. Recently more and more effort has been devoted to the understanding of the<br />
chemistry of reactions between the solvent and model coal compounds which contain<br />
structural similarities to coal moieties (1 ,2,3,4,5,6,7).<br />
This study investigates the reaction rates of three heteroaromatic compounds;<br />
benzothiophene (I), indole (111, and benzofuran (III), in excess tetralin.<br />
Temperatures from 400 to 45OoC are used with a pressure of 1500 psig in a batch<br />
microreactor without hydrogen gas. The reactions of tetralin in the absence of<br />
acceptor compounds have also been examined. The major reactions for all of the<br />
systems have been modelled as first or second order reactions which give rise<br />
to a coupled nonlinear system of equations which is solved numerically.<br />
EXPERIMENTAL<br />
The batch microreactor system is depicted in Figure 1. The reactor is a<br />
9/16 inch tee made of 316 stainless steel by Autoclave Engineers. To this are<br />
fitted reducers which allow the use of 1/8 inch tubing for inlet and exit lines,<br />
The actual lines to the reactor are 1/16 inch O.D. tubing with an I.D. of 0.005<br />
inches.<br />
Pieces of 1/8 inch tubing are fitted over the 1/16 inch tubing at the ends<br />
to couple them to the aforementioned reducers, and the inlet and exit valves. The<br />
reactor volume is 4.1 milliliters. A fluidized bed sandbath with an external<br />
controller maintains the reactor temperature to within t 0.5OC of the desired value.<br />
The reactor remains in the bath at all times and is charged from a manually operated<br />
piston displacement pump. The operating pressure for all experiments is 1500 psig<br />
which is sufficiently high to suppress vaporization of reaction products. The<br />
pressure is generated by the pump, rather than by gas pressure. The basic procedure<br />
to charge a sample to the reactor is to first evacuate the reactor through valves<br />
C and B (Figure 1).<br />
Then, after valve C is closed, the reactor is charged with the<br />
appropriate volume of fluid from the pump sufficient to achieve a pressure of 1500<br />
Psig after thermal equilibrium is reached. The temperature initially drops 30 to<br />
35OC upon charging, but recovers to within about 30C in about one minute. After<br />
the temperature has recovered and the operating pressure reached, valve D is shut.<br />
At the end of the reaction period the sample is discharged through valve E from<br />
which it expands and condenses into a trap. After the sample has cooled, a nitrogen<br />
120
purge displaces the sample into a sample vial. The reactor is evacuated and is<br />
then ready for another sample.<br />
The chemicals used in this study were all purchased from Aldrich Chemical<br />
Company. The purity of all reactants was at least 99%. Tetralin was redistilled<br />
to 99.8 percent purity with naphthalene the only observed impurity.<br />
Analyses are made by gas liquid chromatography. A Hewlett Packard 5710A G.C.<br />
with thermal conductivity detector is used. Two types of liquid phases are used,<br />
Apiezon L for a boiling point separation and Bentone 34 for a 1~ bond separation,<br />
both Supported on chromasorb W packing. Quantification of the samples is accomplished<br />
with a Columbia Scientific CSI-208 digital integrator. Further details Of this work<br />
are available elsewhere (6).<br />
RESULTS AND DISCUSSION<br />
Tetralin. We have studied the decomposition of tetralin by itself in order<br />
to establish "baseline" reaction rates. Temperatures of 400 and 45OoC have been<br />
used. The two major reactions are:<br />
At 450oC a small amount of indan is also observed along with trace amounts of<br />
benzene, toluene, and ethylbenzene. These products are as expected from the<br />
literature (5). Reactions 1 and 2 are modelled as first order in tetralin.<br />
The rate constants and activation energies are listed in Table 1. Figures 2, 3<br />
and 4 show the data (points) with the curves generated by the models:<br />
= -(Kl+k2)[TET] 3)<br />
dt - k2[TET] 5)<br />
where: [TET] = mole fraction tetralin<br />
[NAPTH] = role fraction naphthalene<br />
[MEI] = mole fraction methylindan<br />
It can be seen that the model fits the data well. A zero order model was<br />
found to give a worse fit of the data.<br />
Benzothio hene in tetralin. Benzothiophene with an initial mole fraction<br />
of 0.10 in tet:alin was reacted at 400, 425, and 45OoC. The major product was<br />
di hydrobenzothiophene. At 45OoC toluene and ethyl benzene appeared in smal 1 amounts.<br />
These two products appeared in equimolar amounts with a rate that increased with<br />
time, indicative of a secondary product. They reached a concentration of 0.63 mole<br />
121
percent at the maximum reaction time of 120 minutes. Benjamin et.al. (1) also<br />
found toluene and ethylbenzene as well as benzene as products from benzothiophene<br />
reacted in excess tetralin at 400oC for 18 hours. It thus appears that benzothiophene<br />
desulfurized thermal ly .<br />
Based on the observed reactions of benzothiophene the proposed model is:<br />
The stoichiometry requires that two moles of benzothiophene react with one mole<br />
of tetralin in order to balance the hydrogen. This is written as a net reaction.<br />
We have made the steady state assumption for dihydronaphthalene to simplify the<br />
rate expression from the reactions:<br />
Dihydronaphthalene is observed in very small amounts (
Indole in tetralin. Indole was reacted in tetralin with an initial indole<br />
Inole fraction of 0.128. The reaction was run at 425 and 450OC. The major product<br />
was indoline (2,3-dihydroindole). At 45OoC small amounts of o-ethylaniline and<br />
0-methylaniline (0-toluidine) were observed. Figure 9 shows the indole concentration<br />
versus time at the two temperatures. The model again fits the data well, and the<br />
model a1 so represents the tetralin, naphthalene, and methylindan concentrations<br />
Well at both temperatures. The rate constants and activation energies are given<br />
in Table 3.<br />
Benzofuran in tetralin, The initial mole fraction of benzofuran in tetralin<br />
Was 0.10. The reactions were run at 400 and 45OOC. The reaction was very fast<br />
at 45OoC with a half life of 25 minutes. Unlike the previous two acceptors,<br />
the hydrogenated acceptor, 2,3-dihydrobenzofuran, was not observed. At 45OoC the<br />
major products were o-ethyl phenol and o-methyl phenol (0-cresol ). At 4OO0C, however,<br />
only small amounts of these two products were observed. Since dihydrobenzofuran<br />
was not observed it was not clear whether it was an unstable intermediate or whether<br />
the reaction proceeded through another chemical route. An experiment was conducted<br />
with 5 mole percent dihydrobenzofuran in excess tetralin at 425OC to help elucidate<br />
the pathway. The same products (alkylphenols) were formed, and the rate was comparable<br />
to that of the reaction of benzofuran (eg; not instantaneously). An additional<br />
note is that benzofuran was formed from the dihydrobenzofuran. Thus it seems that<br />
the reaction of benzofuran is different from its sulfur and nitrogen analogs. It<br />
was found that the model used for the previous two acceptor compounds represented<br />
poorly the benzofuran concentration at 400OC, but not so poorly at 45OoC. At both<br />
temperatures the model fittings of methylindan, naphthalene and tetra1 in were good.<br />
Evidently a non-hydrogen transferring reaction is dominant at 40OoC. To account for<br />
this different reaction a first order decomposition model is used:<br />
The kinetic equation is then:<br />
Equations 3,4, and 5 are then used for tetralin, naphthalene and methylindan<br />
concentrations respectively. Table 4 shows the values for kl, k2, and k4 along<br />
with the activation energies. Figure 10 shows the predicted benzofuran concentration<br />
for reaction 12 and the data. The fit of the data is good, much better at<br />
4000C than for the hydrogen transfer model and no worse at 45OoC. The predictions<br />
for tetralin, naphthalene, and methylindan are also as good for this model as with<br />
the hydrogen transfer model at both temperatures.<br />
Comparative discussion. Figure 11 summarizes the result of the acceptor<br />
reaction models. It can be seen that benzothiophene and indole react at similar<br />
rates while benzofuran reacts at a significantly higher rate. The activation<br />
energies range from 30.0 to 51.2 kcal/gmole with benzothiophene exhibiting the<br />
largest temperature effect, with indole and benzofuran considerably less.<br />
The end products of the three reactions indicate that only benzothiophene<br />
loses its heteroatom, producing alkylbenzenes. Indole and benzofuran produce the<br />
corresponding anilines and phenols. The products of the benzothiophene reaction<br />
and the stability of anilines and phenols under the type of reactilon conditions<br />
as in this study is confirmed by the literature (1).<br />
The kinetics of reaction 4 (production of naphthalene via tetralin decomposition<br />
that is not due to acceptor reactions) is sumnarized in Figure 12. The activation<br />
energy for this reaction with no acceptor present is 27.9 kcal/gmole, lower than in<br />
any of the acceptor systems. The rates are also lowest for the non-acceptor system,<br />
123
y a significant amount. The benzothiophene and indole systems have similar rates<br />
with activation energies of 38.7 and 60.1 kcal/gmole, respectively. Originally<br />
it was planned to not optimize the rate constants for reactions 1 and 2, but to<br />
keep them constant at the values determined from the non-acceptor tetralin decomposition<br />
run. The variation in the rate has been observed previously (2) with changes<br />
in acceptor or solvent components, and we also noted changes in the methylindan<br />
rates, despite its model independence from the acceptor reaction. The values of<br />
kl's and Ea's are in the range of values previously reported for reaction 4 (2)<br />
except that the Ea = 60.1 kcal/gmole for indole is significantly higher.<br />
Figure 13 summarizes the results of the reaction producing methylindan. The<br />
rate constants are very similar to those in (2) again, although with less variation<br />
than those of (2). The activation energies range from 46.9 kcal/gmole for tetralin<br />
decomposition, to 57.0 kcal/gmole for benzothiophene. The activation energies<br />
are significantly higher in this study than in (2). As previously noted, the<br />
variation in k's is evidently due to the effect of the acceptor. Possibly the<br />
acceptor acts as an "initiator" by enhancing hydrogen abstraction from the solvent.<br />
Once the tetralin free radical is formed it can give up another hydrogen to form<br />
dihydronaphthalene or rearrange to form a more stable methylindan free radical and<br />
then accept a hydrogen atom back.<br />
REFERENCES<br />
1. Benjamin, B.M., Raaen, V.F.,<br />
Fuel, 57, 269 (1978).<br />
Maupin, P.H., Brown, L.L., Collins, C.J.,<br />
2. Cronauer, D.C., Jewell, D.M., Shah, Y.T., Kueser, K.A., Ind. Eng. Chem.<br />
Fundam., 17, 4, 291 (1978).<br />
3. Cronauer,T.C., Jewell, D.M.,<br />
- 18, 2, 153 (1979).<br />
4. Cronauer, O.C., Jewell, D.M.,<br />
Shah, Y.T.,<br />
Shah, Y.T.,<br />
Modi, R.J., Ind. Eng. Chem. Fundam.,<br />
Modi, R.J., Seshadri, K.S., Ind. Eng.<br />
Chem. Fundam., 18, 4, 368 (1979).<br />
5. Hooper, R.J., Bztaerd, H.A.J., Evans, D.G., Fuel, 58, 132 (1979).<br />
6.<br />
7.<br />
Mallinson, R.G., M.S. Thesis, Purdue University (1979).<br />
Whitehurst, O.D., Farcasiu, bl., Mitchell, T.O., EPRI Annual Report No. AF-480,<br />
RP-410-1, (July 1977).<br />
124
Table 1. Rate Constants and Activation Energies for Tetralin Blank Run<br />
kl(min- 1 )<br />
4OO0C 45OoC E, (Kcal /gmol e)<br />
2.89 1.23 27.9<br />
k2(min-’) 5.66 6.46 46.9<br />
Table 2. Rate Constants and Activation Energies for Benzothiophene Run<br />
4OO0C 425OC 45OoC Ea (Kcal /gmol e)<br />
kl(min-’) 2.79 x 1.41 x 3.70 x 38.7<br />
k2(min-l) 7.00 x 3.86 x 1.34 x 57.0<br />
k3(min-l) 1.991 x 7.4 x 2.81 x 51.2<br />
Table 3. Rate Constants and Activation Energies for Indole Run<br />
425OC 45OoC E, ( Kcal /gmo 1 e)<br />
kl (mi n-l ) 1.17 5.18 60.1<br />
k2(min-l) 3.84 10-4 1.44 53.4<br />
k3(min-’ ) 1.08 2.43 32.7<br />
Table 4. Rate Constants and Activation Energies for Benzofuran Run<br />
4OO0C 45OoC Ea (Kcal /go1 e)<br />
kl (min-’ ) 1.64 1.55 43.6<br />
k2(min”) 1.24 1.82 x 52.2<br />
k4(min-l) 5.93 2.78 x lo-‘ 30.0<br />
125
DEGASSER<br />
Figure 1. Experimental<br />
I<br />
a<br />
i<br />
TCZ<br />
TEMPERATURE<br />
CONTROLLER<br />
Mi croreactor System<br />
-<br />
1 .oo I I I<br />
n<br />
0<br />
I<br />
.e6 1 LH)o<br />
0 450 c<br />
TETRAL<strong>IN</strong> C0NCEt:TRRTION. RUN 0801<br />
.80 0 30 60<br />
"<br />
go 120 150 180 216<br />
TrME ( M<strong>IN</strong>UTES 1<br />
Figure 2. Tetralin Composition in Tetralin Blank Run<br />
126<br />
0
*030 I-’.‘ --<br />
0<br />
I- .02q NRPTHALWE U<strong>IN</strong>CWMRTION, RUN 0801<br />
0.000 I 0<br />
I I I 1<br />
30 QJ go 120<br />
TiME (M<strong>IN</strong>UTES)<br />
I M<br />
150 183 21c<br />
Figure 3. Naphthalene Composition in Tetralin Blank Run<br />
Figure 4.<br />
TIME (M<strong>IN</strong>LITES I<br />
Methylindan Composition in Tetralin Blank Run<br />
127
_.__ .<br />
0 M EO 93 120 150 180 210<br />
TIME (M<strong>IN</strong>UTES)<br />
Figure 5. Benzothiophene Composition in Benzothiophene Run<br />
*-<br />
I<br />
, , I I<br />
;, -61<br />
.6 .<br />
0 30 60 90 120 150' 1%'<br />
T<strong>IN</strong>E IM<strong>IN</strong>UTESI<br />
Figure 6. Tetra1 in Composition in Benzothiophene Run<br />
128<br />
0
W<br />
0 1<br />
II<br />
Y<br />
z<br />
.10<br />
.OY<br />
c .oa L L I .<br />
M 60 93 120 150 160 210<br />
TlME (M<strong>IN</strong>UTES)<br />
Figure 7. Naphthalene Composition in Benzothiophene Run<br />
0<br />
u<br />
.2u<br />
.16<br />
METHYL ItiOffl CDNCENTRiiTIGii <strong>IN</strong> RUN 0617<br />
A 450 C<br />
0.00 0' 30 60 90 120 150 180 210<br />
T<strong>IN</strong>E (M<strong>IN</strong>UTES1<br />
Figure 8. Methylindan Composition in Benzothiophene Run<br />
129
.15<br />
<strong>IN</strong>DOLE CONCENTRRTIM <strong>IN</strong> RM Wl+<br />
0.00 a 3a 60 90 i20 150 18D<br />
Figure 9.<br />
TIME i SECONDS 1<br />
Indole Composition in Indole Run<br />
I I I I<br />
30 60 90 120 150 ieo 210<br />
TIME (M<strong>IN</strong>UTES)<br />
Figure 10. Benzofuran Composition in Benzofuran Run<br />
130
i<br />
5.0<br />
z 10-2<br />
x<br />
1 - 6.0<br />
' R5SHCfWS PLDT FOR <strong>THE</strong> REflCTION <strong>OF</strong> RLCEPTOR<br />
E BE'liOTtlIOPHENE <strong>IN</strong><strong>IN</strong> 06171<br />
3 1tiSU.E IRUN 08191<br />
d <strong>OF</strong>I(i0FURtlN IRUll 05221<br />
d<br />
1.S i.36 1.91 1.99 1.97 1.50<br />
100O/T (1/ Kl<br />
Figure 11. Arrhenius Plot for Acceptor<br />
Reaction Model<br />
1 2.0 ; E T<br />
2.0<br />
5.3<br />
Figure 12, Arrhenius Plot for Reaction<br />
of Tetralin to Naphthalene<br />
IRUN OS?2:<br />
TETRRL<strong>IN</strong> OECOfipOSITION LRbN wall<br />
, 1<br />
IOa I<br />
1 z 1.36 1.Vl 1.59 1.97 1.a<br />
1000/T [1/ HI<br />
Figure 13. Arrhenius Plot for Reaction<br />
of Tetra1 in to Methyl indan<br />
131
Introduction:<br />
HYDROGEN TRANSFER FROM ALCOHOL DONORS TO AROMATIC SUBSTRATES<br />
M.J. Garry and P.S. Virk<br />
Department of Chemical Engineering<br />
Massachusetts Institute of Technology<br />
Cambridge, MA 02139<br />
The use of alcohols in coal liquefaction by donor solvents dates to the earliest<br />
works (1) wherein the tetralin donor used also contained phenol and cresol<br />
additives; chemically similar mixtures have been used more recently (2,3) to simu-<br />
late commercial donor solvents.<br />
Alcohols have also directly been employed as hydro-<br />
gen donors for coal liquefaction, in which application isopropanol, cyclohexanol<br />
and o-cyclohexylphenol have proven effective (4), whereas t-butanol is ineffective<br />
(5). The mechanism of hydrogen transfer from alcohol donors to coal is obscure.<br />
However, free radical types of mechanisms, such as recently proposed (6,7) for coal<br />
liquefaction, seem especially unsatisfactory because the essential step would have<br />
to involve abstraction of a relatively strongly bonded hydrogen in the alcohol by a<br />
coal fragment radical formed from homolysis of a weak bond in the coal.<br />
The present work was motivated by a hypothesis (8,9) that coal liquefaction<br />
may entail concerted, pericyclic reaction paths. In this context, hydrogen transfer<br />
from an alcohol donor, such as isopropanol, to a coal acceptor, such as phenanthrene,<br />
may be viewed<br />
($<br />
as a six electron [4e(ao) + 2e(II)] group transfer reaction:<br />
(RO) u"b- qd+ tI --3 [ V'H. PI$ 01 ]Lx y$ + P<br />
Isopropanol Phe anthrene Pericyclic Acetone 9,1'% dihydro-<br />
4e(oo) ze(n) Transition State phenanthrene<br />
Donor Acceptor<br />
According to the Woodward-Hoffmann (10) rules for orbital symnetry conservation,<br />
reaction (RO) would be thermally allowed for supra-supra stereochemistry, which is<br />
sterically favorable.<br />
Pursuit of our hydrogen transfer hypothesis suggested exploration of a grid<br />
comprising two alcohol donors, namely cyclohexanol and ortho-cyclohexylphenol , and<br />
two aromatic acceptors, namely phenanthrene and anthracene. Of these substrates,<br />
the cyclohexanol is a 4e(ao) donor akin to isopropanol while the o-cyclohexylphenol<br />
is a 6e(ona) donor of the contrary orbital symmetry. Similarly, the phenanthrene,<br />
a 2e(n) acceptor, has orbital symnetry opposite to anthracene which is a ~~(JIII)<br />
acceptor. In the 2 x 2 matrix of thermal reactions between these donor-acceptor<br />
pairs, combinations with a total of (4n+2)e should theoretically (10) be allowed<br />
in supra-supra stereochemistry while those with a total of (4n)e should be forbidden<br />
in supra-supra but a1 lowed in supra-antara stereochemistry. Such differences<br />
should be manifest, and hence experimentally discernible, in the respective<br />
reaction kinetics. Figure 1 illustrates these principles of orbital symmetry corservation<br />
for the present hydrogen transfer reactions. Experimental results ohtained<br />
to date with the cyclohexanol donor are reported in this paper.<br />
Experimental :<br />
All experiments were conducted in stainless steel batch reactors with an<br />
132
internal volume of 0.503cm3; the reactors were imnersed in a salt bath for times<br />
ranging from 0.16 to 12 hours at temperatures from 300 to 425OC. Heating and cooling<br />
times were calculated to be insignificant compared with reaction times.<br />
Experiments conducted in an argon atmosphere, when compared with reactions in air,<br />
indicated no effect of atmosphere on reaction rate. Vapor-liquid equilibrium calculations<br />
were used to ensure that >95% of the reactants remained in the liquid<br />
phase at all times. Upon reaction and subsequent quenching, the products were<br />
dissolved in solvent--toluene for anthracene reactions, carbon tetrachloride for<br />
phenanthrene reactions--and analyzed on an HP 5720 gas chromatograph. Product<br />
identification was based on G.C. coinjection techniques as well as nmr spectra.<br />
Material balance closure was effected in all experiments, and particular care was<br />
taken to effect a hydrogen transfer balance. Thus, we define a ratio H of the mols<br />
of hydrogen donated, hd, as measured by appearance of dehydrogenated donor, to the<br />
mols of hydrogen accepted, h , as measured by the appearance of hydrogenated acceptor;<br />
in all cases H = (hd/haT = 1.00 20.08. The chemicals used were all of purity<br />
> 99.5% as received; the anthracene and phenanthrene substrates were further purified<br />
and assayed to ensure that the content of the related dihydro compound was below<br />
detection limits, i.e., < 0.05%.<br />
Resul ts.<br />
Prel iminary investigation of reaction pathways revealed that three types of<br />
reactions occurred. First, the hydrogen transfer reaction, our primary objective,<br />
which is symbolically reoresented by:<br />
(R1) D + A + DD + HA<br />
D, A, OD, and HA are respectively the donor, acceptor, dehydrogenated donor and<br />
,hydrogenated acceptor; the initial (donor/acceptor) ratio is termed S. Second, the<br />
hydrogenated acceptor HA could, in general, revert to the original acceptor:<br />
(R2) HA + A<br />
This usually occurred by elimination of molecular hydrogen but disproprotionation,<br />
with formation of a further hydrogenated form of HA, was also possible. Third, the<br />
donor D could react by paths other than (l), typically suffering pyrolytic decompos<br />
i ti on :<br />
(R3) D + products<br />
In the present work, D = cyclohexanol (CHL), A = either anthracene (ANT) or<br />
phenanthrene (PHE), OD = cyclohexanone (CHN), and HA = either dihydroanthracene<br />
(OHA) or dihydrophenanthrene (DHP). The experimental grid constructed to examine<br />
the preceding pathways is shown in Table 1, which indicates substrate(s), diluent,<br />
and reaction conditions of temperature, time and concentration for each of five sets<br />
of reactions.<br />
Broadly, the experimental results showed that hydrogen transfer, (Rl), was by<br />
far the major reaction in all circumstances. Reversion of hydrogenated acceptor,<br />
(RZ), was usually small relative to (R1) but occurred to an appreciable extent at<br />
the higher temperatures and holding times. Donor decomposition, (R3), was always<br />
negligible relative to (Rl) at T Q 400 C. Thus, in deriving the desired kinetic<br />
parameters for (Rl), the experimental data could directly be treated as if (Rl)<br />
were the only reaction occurring; corrections for (RZ), which were small, allowed<br />
more refined parameters to be obtained for (Rl) while corrections for (R3) were so<br />
small as to be neglible. The kinetic analyses employed are sumnarized in Table 2.<br />
133
Data for hydrogen transfer from cyclohexanol to anthracene at T = 375 C are<br />
presented in Figure 2, which essentially displays anthracene conversion x vs time<br />
for various initial donor/acceptor ratios, 15.4 > S > 0.25. The ordinate of Figure<br />
2 is a function of conversion chosen to test the presumed second order form of<br />
(Rl), as suggested by Case 1 of Table 2.<br />
s = 15.4 (squares), the ordinate, starting from the origin, increases with increasing<br />
time, linearly at low times, t < 2 hr, but with decreasing slope thereafter,<br />
eventually becoming constant, independent of time, for t > 6 hr. Physically, the<br />
initial linear portion represents the kinetics of the forward reaction (Rl) alone,<br />
while the long-time asymptote of constant conversion represents an approach to<br />
equilbrium. It is noteworthy that the initial slopes are much the same for all S,<br />
directly yielding kl = 5.6 x 10⁻⁶ l/mol s independent of substrate proportions,<br />
which supports the second order kinetics presumed for (Rl). It is also interesting<br />
that the asymptotic long-time conversions available a each of S 1 and S = 15.4<br />
both lead to apparent equilibrius constants Kapp = [Xi/(l-X)(S-X)j 2, 0.02.<br />
Refined rate constants, derived from the initial slope data of Figure 2 after<br />
taking account of all other reactions, are displayed in Figure 3 on co-ordinates of<br />
loglokl vs logloS. It can be seen that log Okl = -5.25 f 0.07 over -0.6 < 1ogloS<br />
< 1.2, i.e. a variation in loglok of about i.1 unit over 1.8 decades of substrate<br />
proportions ranging on either side of stochiometric. The observed invariance of k<br />
relative to S confirms that the cyclohexanol-anthracene hydrogen transfer reaction<br />
follows second order kinetics at T = 375 C.<br />
Having established the order, and hence being assured of a meaningful bimolecular<br />
rate constant kl, the hydrogen transfer reaction kinetics were explored over<br />
the temperature range from 300-400 C at a fixed S = 4. An Arrhenius plot of these<br />
results i<br />
Following a typical set of data, fay<br />
presented in Figure 4, using coordinates of loglokl vs W1, where<br />
e-1 = (103/4.573 T in Kelvins) is an inverse temperature scale; it should be noted<br />
that an Arrhenius relation of form log1 k - loglOA - E*/8 , where A is the pre-<br />
exponential factor with units of k and !* is the activation energy in kcal/mol, will<br />
yield a straight line on Figure 4 with slope a10 lok/AB-l = -E*. Data for the cyclohexanol-anthracene<br />
reaction (circles in Figure 47 show loglokl linearly related to<br />
8-1 over nearly two decades of the ordinate. The best fit then yielded the hitherto<br />
unknown Arrhenius parameters, loglOA(R/mol s) = 6.0 t 0.2 and E* (kcal/mol) = 33.1 t<br />
0.6, which were our goal.<br />
Hydrogen transfer from cyclohexanol to phenanthrene, set 2 in Table 1, was investigated<br />
in a manner exactly analogous to that described for cyclohexanol-anthracene<br />
in Figures 2, 3, and 4, and similar conclusions could be drawn. Thus, for<br />
cyclohexanol-phenanthrene, at T = 4n0 C, plots akin to the earlier Figure 2 forinitial<br />
donor/acceptor ratios 8 > S > 0.125 yielded initial slopes independent of S, with<br />
kl Q 0.65 x Umol s. Also, asymptotic long-time conversions led to k ' Q 0.15<br />
x 10-3 at each of S = 4, 1, and 0.125. A further plot of loglokl vs logl,-J?f shown<br />
in Figure 3, yielded.loglOk1 = -6.2 f 0.2 over the range -0.9 < loglos < 0.9, affirming<br />
the relative invariance of k to substrate proportions and showing the hydrogentransfer<br />
kinetics to be second order. Finally, cyclohexanol-phenanthrene hydrogen<br />
transfer rate constants were derived at temperatures from 375-425 C at fixed S = 4.<br />
These results, plotted in Figure 4 (squares), yield Arrhenius parameters log,oA(t/<br />
mol s) = 7.6 0.6 and E* (kcal/nol) = 42.5 f 3.5. Since the data for cyclohexanol-<br />
Phenanthrene span only a Single decade of loqokl, the corresponding Arrhenius<br />
parameters are subject to rather more uncertainty than in the case of cyclohexanolanthracene.<br />
Reversion of the hydrogenated acceptor to the original acceptor, general reac-<br />
tion (RZ), was studied at the conditions indicated for entries3 and 4 in Table 1,<br />
Using dihydroanthracene (DHA) and dihydrophenanthrene (DHP) substrates with decalin
diluent, which latter was inert. In general, reversion occurred by two parallel<br />
pathways, namely hydrogen elimination (R2') and disproportionation (RZ"), of the<br />
form:<br />
k '<br />
(R2') HA 2 A + H2<br />
k "<br />
(R2") 2HA 2 A + JA<br />
where all symbols have their earlier meaning and JA is a more hydrogenated form of<br />
the acceptor, e.g. tetrahydroanthracene.<br />
Experiments with DHA substrate at T = 375 C revealed that with neat substrate,<br />
4.0 M, the initial rates of (R2') and (R2") were of comparable magnitudes. With<br />
increasing dilution, however, the initial rates of (R2") decreased relative to (R2')<br />
until, at the lowest substrate concentration of 0.2 b\ (R2") was negligible relative<br />
to (R2'). Further, examination of the kin tics showed (R2') to be strictly first<br />
order in DHA with kf' (27 f 2) x s-? at initial substrate concentrations<br />
from 0.23 to 4.3 mo /liter; reaction (R2") was approximately second order at initial<br />
concentrations from 0.9 to 4.3 mol/liter, where it could be measured, yielding<br />
k2" = (37 f 11) x 10-6 Il/mol s. Additional experiments with nea DHA over the temperature<br />
range 325-400 C provided Arrhenius parameters logloA(s-') = 12.5 t 0.6 and<br />
E* (kcal/mol) = 50.8 t 0.8 for the first order DHA reversion rate constant k2';<br />
these experiments also yielded data for (R2") but corresponding Arrhenius parameters<br />
are yet unavailable, pending confirmation of the reaction order.<br />
Experiments with DHP substrate showed (R2') to be the only reversion pathway,<br />
with (R2") undetectable. At T = 425 C, the reaction was strictly first order with<br />
kz' = (34 f 2) x 10-6 s-l at initial substrate concentrations from 0.22 to 4.0 mol/<br />
liter. Arrhenius parameters for DHP reversion over the temperature range 375-420 C<br />
were logioA(s-1) = 12.6 f 0.3 and E* (kcal/mol) = 58.1 2 0.8.<br />
Relating the reversion experiments (R2) to the hydrogen transfer experiments<br />
(Rl), it should be noted that in the latter reaction, the hydrogenated acceptor<br />
initially appears at infinite dilution. Thus, of the two reversion pathways, (R2')<br />
and (R2"), which are respectively first and second order, (R2') makes much the more<br />
significant contribution. Analytically, the overall reversion rate constant<br />
k2 = k2' + k "[HA] -+ k2' as [HA] -+ 0. The cyclohexanol-anthracene series of<br />
experiments further confirmed this inference in that the tetrahydroanthracene pro-<br />
duct symptomatic of (R2") was not detected at times < 2 hr.<br />
for (R2') thus adequately accounted for the reversion reaction (R2) in the present<br />
study .<br />
Finally, in regard to the donor decomposition reaction (R3), set 5 in Table 1,<br />
the cyclohexanol alone was substantially stable at T 6 400 C, with fractional de-<br />
compositions < 0.03 in 4 hr.<br />
The rate data obtained<br />
At T = 425 C cyclohexanol decomposition, initially to<br />
cyclohexa one, became appreciable, with a pseudo first order rate constant k3 % 20<br />
x 10-6 s-'. In processing the hydrogen transfer data, corrections for (R3) were<br />
always negl igibl e.<br />
Discussion:<br />
Kinetic data for hydrogen transfer reactions between alcohol donors and aromatic<br />
acceptors have not hitherto been reported, precludina comparisons with earlier<br />
work. However, the experimental evidence can reasonably be interpreted in favor of<br />
a concerted reaction mechanism. Both the hydrogen transfer reactions studied exhibited<br />
second order kinetics, being first order in each of the donor and acceptor.<br />
This is a necessary condition that must be fulfilled for (R2) to be considered<br />
135
imolecular, as written.<br />
Further, the Arrhenius parameters (loglOA(ll/mol s),<br />
E*(kcal/mol)) were respectively for CHL-ANT (6.0, 33.1) and for CHL-PHE (7.6, 42.5).<br />
Of these the loglOA '~r 6.8 f 0.8 represent activation entropies AS' (cal/mol K) =<br />
-31.7 i 3.7 which are large and negative and of much the same magnitude reported<br />
(11,12) for Diels-Alder reaction which is well known to be a concerted cyclo-addi-<br />
tion (10). There is evidently close steric similarity between the pericyclic tran-<br />
sition state of our hydrogen transfer reaction, as shown in the prototype (RO), and<br />
the transition state for cyclo-addition. The observed activation energies E*(kcal/<br />
mol) = 38 f 5 cannot independently be interpreted, though their magnitudes are en-<br />
tirely comparable to values known for allowed hydrogen shifts (13), which involve<br />
similar orbital interactions.<br />
IJhile the thermochemistry of the present hydrogen transfer reactions is not<br />
we1 1 known, estimates (14) suggest (ASor(cal/molK), AHor(kcal/mol) for CHL-ANT<br />
(2. 0 , ~ 0 and ) for CHL-PHE (% 0, +5); i.e. the reactions are virtually thermoneutral<br />
Consequently, invoking microscopic reversibility, Arrhenius parameters for the<br />
reverse hydrogen transfer reactions should be quite similar to those obtained for<br />
the forward reactions. In regard to thermochemistry it is also worth notiny that<br />
the present experiments led to apparent equilibrium constructs of order 10- for<br />
CHL-ANT and 0.15 x for CHL-PHE at T = 400 C. These cannot be directly interpreted<br />
for want of activity coefficient data but their ratio should depend solely<br />
on the differences between the entropies and enthalpies of hydrogenation of the<br />
acceptors. Estimates (14) of (AHOf,So) for each of ANT, DHA, PHE, DHP lead, at<br />
T = 400 C, to the theoretical ratio K(CHL-ANT)/K(CHL-PHE) '~r 60 which is of the<br />
order of the experimentally observed ratio Kapp( CHL-ANT/Kapp( CHL-PHE) % 70.<br />
It is interesting to compare the present hydrogen transfer from cyclohexanol<br />
with that from A'-dialin, a hydrocarbon donor of the same orbital symmetry. Com-<br />
parable experiments reoorted elsewhere (15) yielded (loglOA(ll/mol s), E*(kcal/mol))<br />
= (6.1, 31.0) for the A'-dialin-phenanthrene system; loglOA is similar to that ob-<br />
tained in the present work for CHL-PHE while the activation energy is lower by an<br />
amount comparable to the reduction in the enthalpy of reaction, in rough agreement<br />
with the Evans-Polanyi Frinciple.<br />
The reversion reactions (R2) also merit brief discussion inasmuch as kinetic<br />
data have not hitherto been reported for hydrogen elimination from either of the<br />
DHA or DHP substrates studied in this work. The general reaction (R2') has literature<br />
precedent, the case HA = 1,4 cyclohexadiene, A = benzene having been studied<br />
(13,16) in !he gas phase and found to be unimolecular with Arrhenius parameters<br />
(logl0A (s- ), E*(kcal/mol)) = (12.4, 43.8); the reaction mechanism has been interpreted<br />
(10) as a concerted thermally-allowed 6e suprafacial group transfer. In<br />
the present study, (R2') with HA = DHA was strictly unimolecular with Arrhenius<br />
parameters (log10A,E*) = (12.6, 50.8). Since there is a clear stereo-electronic<br />
analogy between hydrogen elimination from 1,4 cyclohexadiene and that from 9,lOdihydroanthracene,<br />
the analogous kinetic data can be taken to imply that the latter<br />
reaction is also a 6e pericyclic group transfer.<br />
The case of (R2') with HA = DHP<br />
which is unimolecular with (logIoA,E*) = (12.6, 58.1) is not yet directly amenable<br />
to theoretical interpretation. According to the Woodward-Hoffman rules (lo), this<br />
hydrogen elimination is thermally allowed with antara-supra stereochemistry and<br />
without further stereochemical information it is not obvious whether the higher E*<br />
relative to DHA represents a stereochemical demand or an orbital symnetry barrier.<br />
However, it is interesting that in regard to hydrogen elimination, DHP is more re-<br />
fractory than DHA to essentially the same extent that 1,3 cyclohexadiene (17) is<br />
more refractory than 1,4 cyclohexadiene (16).<br />
Finally it is worth noting that with present system of donors and acceptors,<br />
136
the hydrogen transfer from donor to acceptor was appreciably faster than either<br />
hydrogenated acceptor reversion or donor decomposition. This is evidently desirable<br />
in the context of actual coal liquefaction operations. Further studies, with appropriate<br />
coal-related model donors and acceptors, which thus elucidate the pathways<br />
for hydrogen transfer could be practially useful in suggesting donors and<br />
processing conditions for the optimal deployment of hydrogen during direct liquefacti<br />
on.<br />
Conclusions :<br />
1.<br />
2.<br />
3.<br />
4.<br />
5.<br />
6.<br />
7.<br />
Hydrogen transfer reactions between cyclohexanol (CHL) donor and each of anthra-<br />
cene (ANT) and phenanthrene (PHE) acceptors have been studied in the liquid<br />
phase at temperatures from 300 to 425 C, times from 0.16 to 12.0 hr and initial<br />
donor/acceptor ratios of 0.125 to 15.4.<br />
In addition to the desired hydrogen transfer reaction (Rl), two other pathways<br />
were observed, namely, (R2) reversion of the hydrogenated acceptor to original<br />
acceptor by way of both hydrogen elimination (R2') and disproportionation (R2");<br />
and (R3) pyrolytic donor decomposition.<br />
The kinetics of (R2) and (R3) were<br />
also investigated and it was found that (R2) was small and (R3) negligible re-<br />
lative to (Rl).<br />
The hydrogen transfer reactions were bimolecular, being of order one in each of<br />
donor and acceptor. Arrhenius parameters (log1 A(%/mol s), E*( kcal/mol)) were<br />
respectively for CHL-ANT (6.0 f 0.2, 33.1 f 0.63 and for CHL-PHE (7.6 f 0.6,<br />
42.5 f 3.5).<br />
The observed moleculari ty and Arrhenius parameters suggest a concerted pericy-<br />
cl ic mechanism for the hydrogen transfer with a relatively tight transition<br />
state akin to that well known for Diels-Alder cycloaddition.<br />
Hydrogen elimination from dihydroanthracene (DHA! and dihydrophenthrene (DHP)<br />
liquids was studied at temperatures from 300 to 450 C, times from 0.16 to 10.0<br />
hrs and substrate concentration ranges of 0.2 to 4.0 mol/liter.<br />
The hydrogen elim'nation reactions were strictly unimolecular. Arrhenius parameters<br />
(loglOA(s- 1 ), E*(kcal/mol) were respectively for OHA (12.6 f 0.6, 50.8<br />
f 0.8) and for DHP (12.6 f 0.3, 58.1 f 0.8).<br />
The observed hydrogen elimination from DHA to ANT is strikingly analogous to<br />
thatfrom 1,4 cyclohexadiene to benzene and suggests a similar concerted peri-<br />
cyclic group transfer reaction.<br />
Ac know1 edgement :<br />
This work was supported by U.S.<br />
Energy Laboratory.<br />
D.O.E. seed funds administered by the M.I.T.<br />
137
References:<br />
1.<br />
Pott, A. and Broche, H., Gluckauf 69 903 (1933).<br />
2. I*lhitehurst, D.D.: "Asphal tenes in Processed Coals," Annual Report EPRI-AF-480<br />
(1977) and references therein.<br />
3. Ruberto, R.G., Cronaner, D.C., Jewell, D.M., and Seshadri, K.S., Fuel 56 25<br />
(1977).<br />
4. Curran, G.P., Struck, R.T., and Gorin, E., Ind. & Eng. Chem. Proc. Des. & Dev.<br />
- 6 (2) 166 (1967).<br />
5.<br />
6. Neavel, R.C., Fuel 3 161 (1976).<br />
7.<br />
Ross, D.S., and Blessing, J.E., ACS Div. of Fuel Chem. Preprints 2 (2) 208<br />
(1977).<br />
Whitehurst, D.D., ACS Symposium Series fl 1 (1978).<br />
8. Virk, P.S. "Pericyclic Pathways in 1,2-Diphenylethane Decomposition", Fuel 58,<br />
149 (1979).<br />
9. Virk, P.S., ACS Div. of Fuel Chem. Preprints 24 (Z), 000 (1979).<br />
10.<br />
11.<br />
12.<br />
13.<br />
14.<br />
15.<br />
16.<br />
17.<br />
Woodward, R.B., and Hoffmann, R.: "The Conservation of Orbital Symnetry",<br />
Verlag Chemie GmbH, Weinheim (1970). Pericyclic reaction terminology defined<br />
in this text is used in the present paper.<br />
Wasserman, A.: "Diels-Alder Reactions", Elsevier Pub1 . Co., Amsterdam (1965).<br />
Sauer, J., Angew. Chem. Intnl. 5 (1) 14 (1967).<br />
Frey, H.M. and Walsh, R., Chem. Rev. 103 (1969).<br />
Shaw, R., Golden, D.M., and Benson, S.W., J. Phys. Chem. 81 1716 (1977).<br />
Bass, D.H., and Virk, P.S.: "Hydrogen Transfer from Dialin Donors", paper<br />
presented to the Div. of Fuel Chem., ACS Houston Meeting (1980).<br />
Benson, S.W., and Shaw, R., Trans. Faraday SOC. 63 985 (1967).<br />
Benson, S.W., and Shaw, R., J. Am. Chem. SOC. 89 5351 (1967).<br />
138
I<br />
Table 1. Reaction Conditions.<br />
Reaction Conditions<br />
Set Substrates Diluent Temperature Time Concentration<br />
C hr S or M<br />
1 CHL + ANT None 300-400 0.16-1 2. 0.25-1 6.<br />
2 CHL + PHE None 350-425 0.25-10. 0.25-0.0<br />
3 DHA DEC 300-400 0.1 6-1 0. 0.25-4 .O( Neat)<br />
4 DHP OEC 375-450 0.25-1 2. 0.25-4.O(Neat)<br />
5 CHL None 325-425 0.25-10.0 4.0 f 0.2<br />
Notes: Compound abbreviations are as follows:<br />
CHL - cyclohexanol AllT - anthracene PHE - phenanthcene<br />
DEC - decalin DHA - 9,lO dihydroanthracene DHP - 9,lO dihydrophenanthrene<br />
s = initial substrate ratio CHL/ANT or CHL/PHE (sets 1 and 2).<br />
M = concentration, mol/liter of DHP, DHP or CHL (sets 3, 4, and 5).<br />
Table 2. Kinetic Analyses<br />
Reactions : (Rl)<br />
(R2)<br />
Differential Equation:<br />
k<br />
D + A 1, DD + HA<br />
HA k- A + H2<br />
2<br />
d(HA)/dt = kl(D)(A) - k2(HA)<br />
Constraints :<br />
Solutions:<br />
Case 1. k2 = 0, all S.<br />
A,(s-IJ<br />
l n [ p ]<br />
Case 2. k2 > 0, S > 1<br />
t = 0: (D/A)o = S; (HA/A), = 0<br />
t>O: Ao=A+HA<br />
= klt ; X = 1 - (A/Ao)<br />
= (HA/Ao)<br />
1 1<br />
AOS ( 1 +k2/kl SA,) In' ( 1 -X (1 +k2/kl SAo ) = kl<br />
Case 3. k2 > 0, S < 1<br />
klSAo exp( - kl Aot)<br />
ln[klSA0 exp(-klAot) - k2X1 = k2t<br />
139
(i) I I +<br />
,"A '\\d \- .-<br />
4 e donor 2 e acceptor<br />
4 e donor 4 e acceptor<br />
?<br />
( \<br />
1 Further reaction<br />
4 H shifts<br />
Thermally allowed<br />
stereochemistry<br />
Figure 1. Orbital symmetry conservation in hydrogen transfer.<br />
140
0.0<br />
-5,<br />
-7.<br />
A<br />
0 0<br />
?i<br />
A<br />
e +<br />
aa<br />
A<br />
n<br />
L7<br />
D = CIlL<br />
A = ANT<br />
0 T = 375 c<br />
I I<br />
S<br />
0 15.4<br />
e 4.0<br />
A 1.0<br />
-k 0.25<br />
O 2 4 6 8 10 12<br />
t, hr<br />
F‘i-qure 2. iiydrogcn transfer kinetics: Cmversion vcrsus time.<br />
n<br />
DONOR = ii0<br />
ACCEPTOR = i&;<br />
T = 400°C<br />
141
-4.0<br />
-6.0<br />
-7.0<br />
Figure 4. Hydrogen transfer kinetics: Arrhenius plot.<br />
\ i7<br />
REACTION: D + A + DD + HA<br />
DONOR =<br />
ACCEPTOR mlOA<br />
*<br />
E<br />
6.0 t0.2 33.1 t0.6<br />
7.6 50.6 42.5 t3.5<br />
\<br />
--l--l._l_.- I I<br />
0.30 0.35 0.40<br />
142<br />
8-l
I<br />
BACKGROUND<br />
SULFUR REMOVAL FROM COAL CHAR US<strong>IN</strong>G " CONVERT-REMOVE'' TECHNOLOGY<br />
ANN BAUGH TIPTON<br />
OCCIDENTAL RESEARCH CORPORATION,<br />
P.O. BOX 19601,<br />
IRV<strong>IN</strong>E, CALIFORNIA 92713<br />
The reactivity of the organic sulfur in coal and char continues to be the<br />
major challenge to finding an economical method to produce a compliance boiler<br />
fuel, i.e., to remove ninety percent of the sulfur from run-of-mine coal prior to<br />
combust ion.<br />
Two recent studies, one by Contos, Frankel and McCandless(1) and another by<br />
Attar and Dupuis(Z), offer clues to what w i l l be needed in an improved method to<br />
meet these goals for coal desulfurization. The study by Contos, et al., described<br />
the economic and technical strengths of existing processes for chemical coal<br />
cleaning. The study concludes, "Chemical Coal Cleaning Processes can remove as<br />
much as 95 to 99 percent of pyritic sulfur and up to about 40 percent of the<br />
organic sulfur from run-of-mine coal ." The comparison of the major processes from<br />
this study is shown in Table 1.<br />
Table 1<br />
COMPARISON <strong>OF</strong> MAJOR CHEMICAL COAL CLEAN<strong>IN</strong>G PROCESSES*<br />
Max. % Removal Product Cost<br />
Process Pyrite Organic S $/Ton<br />
Magnex<br />
Syracuse<br />
Meyers<br />
Ledgemont<br />
DOE<br />
GE<br />
Battel le<br />
JPL<br />
I GT<br />
KVB<br />
Arc0<br />
* Ref. (1)<br />
90<br />
50-70<br />
90-95<br />
90-95<br />
95<br />
-<br />
95<br />
90<br />
95<br />
95<br />
95<br />
75% Total<br />
0<br />
0<br />
0<br />
D<br />
40<br />
25-50<br />
70<br />
85<br />
40<br />
"some "<br />
40.70<br />
37.00<br />
43.40<br />
46.90<br />
51.60<br />
41.80<br />
55.90<br />
46.00<br />
65.80<br />
47.50<br />
46.00-58.00<br />
With the exception of IGT, all of the processes in Table 1 which remove organic<br />
sulfur rely on oxidizing agents. The evidence seems quite convincing that the most<br />
difficult to remove organic sulfur is not reactive to oxidizing agents. This, in<br />
turn, leads us to pursue reducing agents.<br />
Recent research by Attar and Dupuis(2) offers evidence for the capability of<br />
reducing agents for organic sulfur removal. Attar d. used strong reducing<br />
agents with catalyst at temperatures up to 400°C as a method to identify and<br />
quantify organic sulfur groups in coal. Attar et al. found that almost half of the<br />
organic sulfur in high sulfur bituminous ,,coaE Tid not react under their test<br />
conditions. Attar and Dupuis conclude, An upper bound exists on the maximum<br />
portion of the orga;ic sulfur than can be removed without the complete destruction<br />
of the coal matrix.<br />
143
These studies, then, point to a coal desulfurization method which uses<br />
reducing agents at temperatures which destruct the coal matrix. The technology to<br />
be reported is one such approach to the problem. The conventional approach which<br />
incorporates these features is hydrodesulfurization (HDS). This is used in the<br />
IGT process listed in Table 1 with the hishest product cost of all, $GG/ton, and<br />
before that was the major step in the Clean Coke Process. HDS uses very high<br />
hydrogen to solids ratios to remove sulfur. An example of IiDS with char is shown<br />
in Fisure 1. Here, almost 200,000 SCF H2/ton was required to take 2.4% sulfur<br />
to 0.7% sulfur. In this example, even with large volumes of hydrogen, a com-<br />
pliance fuel was not produced. The main chemical reaction which controls the<br />
sulfur removal in HDS and demands the high hydrogen capacity is the equilibrium<br />
reaction between ferrous sulfide and hydrogen,<br />
FeS t ti2 = Fe + H2S. Eq. (1)<br />
At 800"C, the concentration of hydrogen sulfide in hydrogen would have to be less<br />
than 2000 ppm before this reacticn would proceed forward. To keep the hydrogen<br />
sulfide dilute enough for sulfur removal to occur requires 125,000 SCF of hydrogen<br />
per ton of coal to remove one percent of sulfur.<br />
CHEMISTRY <strong>OF</strong> <strong>THE</strong> "CONVERT-REMOVE" TECHNOLOGY<br />
The "Convert-Remove" technology uses two types of treatment steps to produce<br />
a low sulfur product. The Convert step is concerned with lowering the organic<br />
sulfur while the Remove step only affects inorganic sulfur.<br />
<strong>THE</strong> CONVERT STEP<br />
The chemistry of the Convert step includes two reactions. First, hydrosen,<br />
reacts with organic sulfur (RS) to form hydrogen sulfide,<br />
RS + H2 = R' t HpS. Eq- (2)<br />
Next, the hydrogen sulfide is free to react with in-situ sulfur scavengers to<br />
form inorganic sulfides because the hydrogen to solids ratio is low,<br />
FeO t 1!2S = FeS t R20. Eq. (3)<br />
The overall result of hydrosen treatment is the conversion of organic sulfur<br />
to inorganic sulfur with total sulfur remaining constant. This is in extreme<br />
contrast to the conventional approach to hydrogen treatment (HDS) where much<br />
higher hydrogen to solids ratios are used and sulfur is removed.<br />
<strong>THE</strong> RENOVE STEP<br />
The removal of the inorganic sulfide sulfur could be accomplished in a<br />
number of ways, e.g., acid leach(3), oxidation. However, we have chosen an<br />
approach which regenerates the sulfur scavensers, i.e., steam displacement using<br />
the reverse of the reaction by which it was formed,<br />
FeS t H20 = FeO + H2S. Eq. (4)<br />
While high flow rates of stean, are now required to sweep out the hydrosen sulfide<br />
to maintain removal, very little water is actually consumed - probably no more<br />
than a Sallon per ton of char.<br />
EX PER IM ENTAL<br />
Two laboratory batch reactor systems are used for desulfurization studies.<br />
Figure 2 shows the schematic diagram of the reactor setup. One of the reactor<br />
144
systems is equipped with two gas chromotographs for on-line gas analysis. One gas<br />
chromatograph (a Perkin Elmer Sigma 1) is used to monitor hydrocarbons and fixed<br />
gas composition in steam and hydrogen treatments of solids. The sulfur species<br />
such as HzS, S02, COS, CH3SH, CH3SCH3, CH3SSCH3 and CS2 of the gas stream are<br />
measured by a Tracor gas chromatograph with a Hall detector.<br />
The high sulfur chars used in the experiments reported in the next section<br />
were produced in a bench scale entrained flow reactor using an air-nitrogen<br />
mixture as carrier gas. Pulverized West Kentucky No. 9 seam coal (tiamilton Mine)<br />
at 1075°F for 0.69 sec. with 3% oxygen for decaking was used to produce the coal<br />
char.<br />
.-___. RESULTS<br />
The strength of the "Convert-Remove'' technology comes from the discovery that<br />
repetition of short cycles of the two treatment steps is more effective for sulfur<br />
removal than is a single two-step cycle with long treatment times. Also we find<br />
that when an initial coal devolatilization step has produced a char with a high<br />
sulfide sulfur content, an initial Remove treatment step prior to the "Convert-<br />
Remove" cycle will produce a lower sulfur product. The results which established<br />
these effects are given in Table 2.<br />
Process<br />
Steps<br />
Table 2<br />
CONVERT (C) AN0 REMOVE (R) TREATMENT STEPS<br />
CHAR DESULFURIZATION RESULTS<br />
Total Sulfide Organic SCF H2<br />
____ Sulfur .___ Sulfur Sulfur Ton MMBTU<br />
__.<br />
Coal<br />
Starting Char<br />
2.75<br />
2.42<br />
0.04<br />
0.59<br />
1.74<br />
i.73<br />
--<br />
--<br />
4.3<br />
4.2<br />
CR 0.64 0.13 0.43 76,800 1.1<br />
R CR<br />
CRCR<br />
0.49<br />
0.34<br />
0.03<br />
0.04<br />
0.37<br />
0.29<br />
76.800<br />
153;600<br />
0.9<br />
0.6<br />
CRCRCR 0.23 0.05 0.13 230,400 0.4<br />
CCCRRR 0.46 0.18 0.18 230,400 0.8<br />
Starting Char 2.48 0.80 1.59 -- 4.3<br />
CR 0.94 0.34 0.52 12,800 1.6<br />
CCRRR 0.50 0.10 0.27 25,600 0.7<br />
CRCR 0.43 0.14 0.22 25,600 0.5<br />
RCRCR 0.27 0.11 0.09 25,600 0.4<br />
In the first series of tests, high volumes of hydrogen were used. In the second<br />
series, we reduced the hydrogen volume by an order of magnitude. For an initial<br />
Convert treatment we have found that volumes as low as 1000 SCF/ton are effective.<br />
The results are shown in Figure 3.<br />
The technology has also been tested on a Wyoming sub-bituminous coal and a "Flash<br />
Pyrolysis" char (4) from this coal. The results of these tests are shown in<br />
Table 3. These data give strong support to our mechanism for organic sulfur<br />
removal via an in-situ sulfur scavenger. All treatment times - 5, 10, 15, or<br />
30 min. - with hydrogen produced identical results. The sulfide sulfur capacity<br />
of this material is quickly saturated by the hydrogen treatment. Until this<br />
sulfide sulfur is removed with steam, the residual organic sulfur is unreactive to<br />
the hydrogen. The three step RCR treatment is marginal for ninety percent remo-<br />
val, while the five step RCRCR treatment accomplished almost complete removal.<br />
145
Total<br />
Treatment* Sulfur<br />
Feed Coal<br />
Char<br />
0.79<br />
0.54<br />
C(5)<br />
C(10)<br />
C(15)<br />
C(3P)<br />
~(15)<br />
R(30)<br />
RCR<br />
RCRCR<br />
0.64<br />
0.65<br />
0.58<br />
0.64<br />
0.36<br />
0.35<br />
0.11<br />
0.03<br />
Table 3<br />
"CONVERT - REMOVE" TREATMENTS <strong>OF</strong><br />
WYOM<strong>IN</strong>G SUB-BITUM<strong>IN</strong>OUS COAL AND CHAR<br />
Flash Pyrolysis Char Coal<br />
Sul f i de<br />
Sulfur<br />
0<br />
0.06<br />
C.13<br />
0.11<br />
0.15<br />
0.14<br />
0<br />
0<br />
0.03<br />
0.01<br />
Organic<br />
Sul f ur<br />
0.63<br />
0.41<br />
0.49<br />
0.51<br />
0.40<br />
0.47<br />
0.34<br />
0.32<br />
0.06<br />
0<br />
* C-10 min., R-30 min. unless given in parenthesis<br />
Tot a 1<br />
Sulfur<br />
0.72<br />
0.74<br />
0.68<br />
0.59<br />
0.74<br />
0.55<br />
0.53<br />
0.16<br />
0.c7<br />
Sulfide Organic<br />
Sulfur Sulfur<br />
0.02 0.61<br />
0.18 0.48<br />
0.19 0.40<br />
0.19 0.32<br />
0.21 0.46<br />
0.04 0.46<br />
0.06 0.40<br />
0.04 0.08<br />
0.04 0<br />
A side benefit of the "Convert-Remove'' technoloqv is the removal of ni trosen.<br />
The nitrogen contents of the coals,<br />
Table 4.<br />
chars, and desulfurized chars are given in<br />
Coal<br />
Cescri pti on<br />
Table 4<br />
"CONVERT - REMOVE" TCEATMENT<br />
ALSO TAKES OUT HALF <strong>OF</strong> <strong>THE</strong> COAL F!ITROGEN<br />
Z N (Dry Basis)<br />
Feed<br />
Coal Char<br />
-<br />
W. Ky. No. 9 Seam 1.55 1.65<br />
Wyoming Sub-bit umi nous 1.24 1.33<br />
Desulfurized<br />
Char<br />
0.77<br />
0.64<br />
For both the bituminous and sub-bituminous coals about half of the nitrogen was<br />
removed.<br />
CHAR REACTIVITY<br />
Reactivity of char to both combustion and desulfurization is important to the<br />
utilization of the "Convert-Reri,ove" technology. All of the chars tested in<br />
our program were devolatilized in an entrained flow reactor with high heating<br />
rates, short resistance time and moderate temperature using ORC's "Flash Pyroly-<br />
sis" technolosy (4). Such conditions have been shown to be ideal for producing<br />
reactive chars (5,6,7,8). Essenhigh (5,6) found that a Gasification char had<br />
equivalent reactivity tc colnbustion as coal, while a COED char produced with<br />
lower heatins rates and lonser residence times had a much lower reactivity.<br />
Walker (73) in studying reactivity of chars to gasification, found that both<br />
rapid heating and low temperature air oxidation of caking coals enhance the<br />
reactivity of the chars produced.<br />
146
We have found that less sulfur is removed by direct "Convert-Remove" treatment of<br />
a decaked high sulfur bituminous coal than is removed from char. However, the<br />
same level of sulfur removal is found for sub-bituminous coal and char. Conse-<br />
quently when caking high sulfur coals are to be desulfurized, an initial coal<br />
devolatilization treatment which produces a reactive char, e.g., partial gasifica-<br />
tion or decaking and rapid pyrolysis, will be needed. Recovery of the volatilized<br />
coal fraction will be important to good economics for any coal feed.<br />
CONCLUSION<br />
The "Convert-Remove" technolosy is effective in removins ninety percent or more of<br />
the sulfur in a reactive char from high sulfur bituminous coals and in sub-bitumi-<br />
nous coals or chars.<br />
REFERENCES<br />
1.<br />
2.<br />
3.<br />
4.<br />
5.<br />
6.<br />
7.<br />
8.<br />
Contos, G.Y.,<br />
Technology:<br />
Frankel, I.F., McCandless, L.C., "Assessnent of Coal Cleaning<br />
An evaluation of Chemical Cclal Cleaning Processess," EPA-6@0/7-<br />
78-173A, PB-l89493/9WE, August 1978.<br />
Attar, A. and Dupuis, F., "Cata cn the Distribution of Grganic Sulfcr Func-<br />
tional Groups in Coal," Preprints of Civision of Fuel Chemistry, ACS, 2 ( l),<br />
166 (1979).<br />
Tipton, A.B., "Ifliproved Hydrodesulfurization of Coal Char by Acid Leach,"<br />
ACS Symposium Series, No. 64, 280 (1977).<br />
Che, S.C., Curaiswamy, K., Knell, E.K.. and Lee, C.K., "Flash Pyrolysis Coal<br />
Liquefaction Process Developnient," Occidental Research Corporation Final<br />
Report to the U.S. Department of EnerSy. Fe-2244-26. April 1979.<br />
Essenhigh, R.H. and Csaba, J., F!inth Syriposiunl (Internation) on Combustion,<br />
p. 111, Academic Press, 1963.<br />
Cogoli, J.G., Gray, C. and Essenhish, R.H., "Flame Stabilization of Low<br />
Volatile Fuels," Combustion Science and Technology, s, 165, (1977).<br />
Ashu, J.T., Nsakala, N.Y., Mahajan, C.P. and Walker Jr., P.L., "Enhancement<br />
of Char Reactivity by Rapid Heating of Precusor Coal," E, 57, 250 (1978).<br />
Kahajan, C.P., Koniatsu, M. and Walker Jr., P.L., "Low Temperation Air<br />
Oxidation of Caking Coals, I. Effects on Subsequent Reactivity of Chars<br />
Prodcced," x, to be published.<br />
147
o o a<br />
148
I<br />
2<br />
n<br />
-<br />
-<br />
2.80<br />
2.40<br />
2.00<br />
2 1.60<br />
3<br />
v)<br />
5<br />
* 1.20<br />
.80<br />
.40<br />
0<br />
Figure 3<br />
Convert Treatment Uses<br />
Low Hydrogen Volumes<br />
SCFfTon<br />
1000 2000 3000 4000 5000 6000 7000<br />
I I I 1 I I I'<br />
0<br />
0 Total Sulfur<br />
0 Sulfide Sulfur<br />
A Organic Sulfur<br />
n n n 0<br />
L /<br />
O<br />
\ /<br />
' /<br />
- '/<br />
0<br />
I I I I I I<br />
1 2 3 4 5 6 7<br />
Residence Time (Minutes)<br />
149<br />
n
1. <strong>IN</strong>TRODUCTION<br />
PYROLYSIS <strong>OF</strong> <strong>THE</strong> POLYMER COAL: STRUCTURE AND K<strong>IN</strong>ETICS<br />
BY<br />
AMIR ATTAR AND GREGORY G. HENDRICKSON<br />
DEPARTMENT <strong>OF</strong> CHEMICAL ENG<strong>IN</strong>EER<strong>IN</strong>G<br />
UNIVERSITY <strong>OF</strong> HOUSTON<br />
HOUSTON, TEXAS 77004<br />
A kinetic model which predicts the rate of formation of gaseous products<br />
produced during coal pyrolysis has been developed. The basis assumptions of<br />
the kinetic model are similar to those o€ Attar (1) for the kinetics of coal<br />
liquefaction in a hydrogen donor solvent. The main assumption is that<br />
different coals consist of the same organic Functi.onal groups and that the<br />
differences between coals are due to the dif€erent concentrations of the<br />
ruiictional groiips. The functional groups most important in forming gaseous<br />
products are hydroaromntic hydrogen, methyl groups, ethyl groups and oxygen<br />
tunctionalities. i..e., carboxyl groups, carbonyl groups, phenols and ether<br />
linkages. The products of coal pyrolysis are to a large extent determined<br />
by tlie initial concentration of each of the above mentioned functinnalities.<br />
The chemistry and thermodynamics of functional group reactions in coal are,<br />
to a first-order approximation, independent of the particular coal (2). It<br />
is also plausible to assume that the reaction rate of each functional group is<br />
independent of the particular coal and only dependent upon the regent, the<br />
reactive group and the temperature. Thus the kinetic parameters, the activation<br />
energy and tlie frequency €actor, are assumed to be independent of the particular<br />
coal. Arrlienius dependence of the rate constants are assumcd.<br />
'l'he rate of product generation appears to bc controLled hy thermal decomposition<br />
of the coal (3). thus the rate of chemical reaction is assiimed to be the<br />
control I ing r:itc. Mass transfer crfccts have hcvn nefiicrtcxl. 'The I)ond I)rcaking<br />
1"'"""':' ll;ls Ilc.(*II ~IIIIIC~ to prorecd hy ;I rrce rad ic:iI mccIi;iii isis Tor wliicli tlie<br />
stc-:idy state, ;issiiaptiori can be ;ippLicd. 'I'Iic rrce r;idic;ils ciiii tlicii form<br />
SLahlc products by coinhiiiatioii reactions with other radic:iIs nr by hydrogen<br />
ahs traction reactions. Secondary react ions, other than the water-shif t reaction,<br />
have been neglected.<br />
equil ibr ium .<br />
l'he water-shift reaction has been assumed to proceed to<br />
The kinetic model incorporates all of the above assumptions into a set of rate<br />
equations for, the transformations of the various functional groups. Isothermal<br />
150
kinetics or a constant heating rate can be used. The rate expressions are<br />
integrated numerically using a semi-implirit third order Runge-Kutta method<br />
with thc initial functional group distribution in a cos1 as the boundary<br />
condition. After each integration step, the water-shift reaction is shifted<br />
to equilibrium.<br />
2. K<strong>IN</strong>ETIC MODEL<br />
The kinetic model which has been developed is based on the premise that free<br />
radicals are released from the coal matrix and then undergo combination reactions<br />
or hydrogen abstraction reactions to form stable products. The free radica1.s<br />
which are released from the coal matrix include hydrogen atoms, methyl.groups<br />
and ethyl groups. Each of these radicals is released from the coal matrix<br />
according to the first-order reaction<br />
where S* is the radical remaining in the solid phase to later take place in<br />
tar forming or char forming reactions and R* is either H., 'CH3 or -C H<br />
2 5:.<br />
Once formed, the free radicals can either undergo a second-order combination<br />
reaction of the type<br />
R; + R.. -t R.R.<br />
J 1 J<br />
where i and j refer to any of the above mentioned radicals and R.R is the<br />
stable product, or they can abstract hydrogen from the coal matr$J to result<br />
in the stable product RH. The hydrogen abstraction reaction is a second-order<br />
reaction of the type.<br />
Re + S'H -+ S'. + RH<br />
The reactions involving free radicals can produce the gaseous products H2,<br />
CtI4, C H , C I1 and C H,,,. .Once a stable product is formed, cracking reactions<br />
3 8<br />
to fori 'lover molecufar weight products are not assumed to occur. This<br />
assumption is approximately correct in that the components most likely to crack,<br />
i.e., C H and C4H1,,, are produced only in minor quantities. Ethylene production<br />
is nssuJe8 to occur as a resulted of the unimolecular decomposition of ethvl<br />
radicals according to the reaction<br />
-C2H5 -f C2114 + H'<br />
Othcr reactions which must be considered involve oxygen functional groups.<br />
'1'111x oxyr.c!n 1iiiic.t iiiiiiil j:roiips arc rcspons ililc for tlic Torin:it ion of (:I) CO<br />
:iii,1 11. 1).<br />
1.<br />
il~vol<br />
(::irl)oii cl iiix irli. is :issjiinc(I tii a)i.i.i1r iliic to ilc~.:lrliiixyIac.ii)ii 2;c>:lg.t 11)ns<br />
v 1111:
-f<br />
H20 + co
the rate constants associated with the Cunctional group transformations are<br />
activation energies for the decomposition reactions of the polymers assumed<br />
to characterize the bond breaking process involved in the functional group<br />
transformations.<br />
In order to integrate the given rate equati-ons the radical concentrations must<br />
be available. The radical concentrations have heen obtained with radical<br />
balances and the assumption that the stcady-state approximation is valid.<br />
According to Benson (6), the steady-state assumption has been shown to be valid<br />
i E the total radical concentration is negligible compared to the reactant and<br />
product concentrations. The radical concentrations are usiral1.y negligible in<br />
the integration procedure which has heen incorporated. The utility of the<br />
steady-state assumption is that it converts differential. equations into algebraic<br />
equations which can then be solved for the radical concentrations.<br />
radical balances are presented in equations 3.8 - 3.10.<br />
The<br />
%u = d(S-ll)<br />
dt dt<br />
2<br />
- 2k (Ha) (M) - k2 (11.) (S-ti) - k3 (*CH3) (H*)-<br />
1<br />
k7 ('C2Hs) (H') + kl.O (.C2H5) = 0 3.8<br />
d('CH 3 ) = d(S-C1t3) - k3 ('CH3)(H')<br />
__ __<br />
dt dt<br />
2<br />
- k4 ('Cl13) (S-H) - 2k5 (*CH3) -<br />
k6 (.CH3) (.C2H5) = 0 3.9<br />
d(.C2H5) = d(S-C2H5) - k6 (.CH3) ('C2115) - k7 ('C 2H 5 ) (11') -<br />
kg (.C2H5)<br />
2<br />
(S-H) - 2k9 (.C2Il5) - k10 (.C2H5) = 0<br />
In Llie kinetic model the radical balances are solved by successive<br />
approximations until a solution is obtained within allowable error.<br />
Table 3.1<br />
- Functional Group Decomposition Rate Constants<br />
Fu nc ti ona 1<br />
_____ Group- ____ h(sec-' - ) E(kcal/mole)<br />
-11 73.0<br />
25.0<br />
-(:ll, I<br />
16.7<br />
18.0<br />
I: ,11,<br />
. ><br />
l:oolI<br />
I,<br />
!I,./ SlII<br />
',*,(I .(I<br />
I l . 4<br />
I ') . 'i<br />
-c=o r I-<br />
.>.). 0<br />
18.0<br />
-0- 2500.0 15<br />
30.2<br />
-OH 1.05 X 10<br />
153<br />
3.1.0
Model<br />
Compound<br />
-<br />
___- E (kcal/mole)<br />
Tetralin (41) 22.0<br />
Polybenzyl (-CH ) 53.0<br />
Polyacrylic Acid (1-COOH) 27.0<br />
Poly (2,6-dimethyl-<br />
1,h-phenylene ether) (OH) 57.0<br />
Table 3.2<br />
Radial Reaction RaLe Constants<br />
-- Reference<br />
____ Reaction __ k(cc/mole sec) ____. Reference<br />
H' + tl. + M + H2 + M<br />
*CH3 t H- + CH<br />
4<br />
15"<br />
8.9 x 10<br />
12<br />
6.0 x 10<br />
.CH3 + 'CH3 + 3.16 17<br />
'CH3 t 'C I{<br />
2 8<br />
12<br />
2.51 x 10<br />
*C H + tl' + C2H6<br />
2 5<br />
12<br />
3.63 x 10<br />
'C 2H 5 + + -C2H5 c4'i10 1.0 d3 18<br />
.C2H5 + C2H4 + H -<br />
-1<br />
k = 2.7 x 10¹⁴ exp (-40,90O/RT)sec<br />
Table 3.3<br />
Hydrogen Abstraction Reactions Rate Constants<br />
Reaction log A(cc/mole zed. E(kal/mole) Reference<br />
H' + S-H + H2 + S. 10.61 5.4 20<br />
.CII. + s-ll -+ C1I4 + S' 10.61 8.0 cs t ima t cd<br />
3<br />
.C2N5 + s-ti -+ c H i s- 13.5 4.4 es timated<br />
2 6<br />
154<br />
11<br />
12<br />
13<br />
14<br />
15<br />
16<br />
18<br />
17<br />
19
I<br />
4. RESULTS<br />
The concentrations of the various gaseous products produced during coal<br />
pyrolysis and the rate of formation of these gases can be obtained by<br />
employing the kinetic model previously described. The results of modeling<br />
the prolysis of two typical coals are described in this section. In both<br />
cases, the results from the kinetic model have been compared to experimental<br />
data obtained from the literature. The published data is that of Campbell and<br />
Stephens (7) and Makino and Toda (8,9).<br />
Campbell and Stephens (7) pyrolyzed Wyodak subbituminous coal at temperatures<br />
between 110' and 1000°C. A constant heating rate of 3.33'C/mm was used to<br />
heat a sample weighing 50 gm and consisting of particles sized between 10<br />
mesh and 6 mesh. Argon was used as a carrier gas to sweep the gaseous products<br />
to a mass spectrometer for quantitative determination of the product<br />
composition. Experimentally obtained gas evolution curves are compared with<br />
the curves obtained trom the kinetic model in Figures 1-4. A material balance<br />
is presented in Table 4.1. The experimental carbon dioxide yield was estimated<br />
by graphical integration of the experimental rate of evolution curve.<br />
It is interesting to compare the initial functional group distribution with<br />
the calculated gaseous yield. It can be seen that all of the methyl groups go<br />
into the formation of methane and all of the ethyl groups form ethane.<br />
Radical combination reactions other than with hydrogen are negligible. Also,<br />
if enough hydrogen is subtracted from-the initial hydrogen concentration<br />
to account for methane and ethane formation, the yield of molecular hydrogen<br />
would be 61.3 cm3/gm compared to the calculated yield of 98.9 cm3/gm. This<br />
apparent discrepancy, along with the observation that more carbon dioxide is<br />
in the products than there is carboxyl groups in the feed is the result of<br />
the water-shift reaction. For this case, the overall effect of the water-shift<br />
reaction is a shift in the direction<br />
H 0 + CO + C02 + 11<br />
2<br />
2<br />
It should be noted that all of the calculated water yield is formed from the<br />
.phenols. If some moisture is initially present and the water-shift reaction<br />
proceeds in the same direction as before, the calculated hydrogen yield could<br />
be made to approach the experimental yield.<br />
The methane and ethane yields are presented in Figure 1. It can be seen that<br />
first-order kinetics do not adequately describe the rate of methane formation,<br />
espedally at the tail end of the rate curve. This observation is in agreement<br />
wil 11 l:i~zj:t.i-;ilil iiinl V:III Krc.v~~I~~Ii (IO) wIIo :;aid I~I:II r111- ratv or I I I I * I ~ I ~ I I ~ P<br />
i i i<br />
IOII,I.lI 1011 ,l,!a.:; 111l1
Table 4.1<br />
Characterization of Wyodak Subbituminous Coal<br />
Gaseous Equivalent of the<br />
3<br />
Coal Initial Functional Gaseous Yield (cm /am) --<br />
Composition Group Distribution- Component Experimental Model<br />
Component wt.% Group Conc. (cm3/&<br />
C 66.76 -H 196.4 H2 124.8 98.9<br />
H 5.25 -CH3 67.2 CH 4 67.2 67.2<br />
0 16.99 -C2H5 6.6 C2H6 6.63 6.6<br />
N<br />
S<br />
I .11<br />
0.74<br />
-coot1<br />
c =o<br />
-0-<br />
-OH<br />
18.2<br />
26.1<br />
73.1<br />
101.9<br />
c02<br />
C0<br />
H2°<br />
48<br />
45.9<br />
---<br />
54.9<br />
63.6<br />
66.8<br />
The ruptureof alicyclic rings should be more important in lower ranked coals<br />
since the concentration alicyclic ring is postulated to decrease with an<br />
increase in rank.<br />
h compari.son between calculated and experimental volatilization yields for an<br />
anthraci.te are illustrated in Figures 5-8. Makino and Toda (8.9) used a<br />
flow-type high pressure reactor and a constant heating rate of 3.3" C/min up<br />
to a final temperature of 900°C in their experiments. A constant flowrate of<br />
helium was used to sweep gaseous products out of the reactor and into a high<br />
speed chromatograph for analysis. Argon was used as a carrier gas in separate<br />
experiments for the determination of hydrogen. The experimental curves reproduced<br />
herein were obtained by graphical integration of experimental rate curves. An<br />
estimated 10-15% error in the calculated yields is possible. A material balance<br />
is included in Table 4.2.<br />
Table 4.2<br />
Characterization of Omine Anthracite<br />
Coal<br />
-__ Composition<br />
Component Wt.%<br />
Gaseous Equilvalent of<br />
the Initial Functional<br />
Group Distribution<br />
Group Conc. (c?/gm) Component Experimental Model<br />
C 93.2 -ti 150.1 H2 138.7 71 .8<br />
I1 '1.1 -1:Il.) 1n.n (:I I<br />
11.7 1n.R<br />
/I<br />
(1 I.? -(:yI> 0. 0') I;p(, -_--- 11.0')<br />
N I . 7 -(:ooIl 0. on94 cn2 1.52 I . 3.1<br />
S 0.7 c =o 0.76 CO 3.18 7.36<br />
-0- 7.81<br />
------<br />
H2°<br />
7.16<br />
-0H- 8.25<br />
The main observations are:<br />
1. All the methyl. and ethyl groups form methane and ethane respectively. For<br />
this case, first order kinetics can adequately describe the methane evolution<br />
rate. This observation is another point in favor of the secondary methane<br />
source required for lower ranked coals being the cleavage of alicyclic rings.<br />
156
2. The water-shift reaction shifts in the direction<br />
H20 + co + co2 + H2<br />
The calculated carbon dioxide yield shown in Figure 7 is a di.rect result<br />
of the water-shift reaction. A negligible amount of the carbon dioxide<br />
evolved is the result of decarvoxylation reactions.<br />
5. MO!)EL LIMLTATlONS<br />
The 1 imitations of lie model are:<br />
1. The model does not predict tar yields.<br />
2. The model is limited to low pressure applications due to the neglect<br />
of secondary reactions.<br />
3. The rate constants for the release of the Cree radicals from the<br />
coal are applicab1.e to low heating rates. A heating rate of as<br />
high as 60" C/sec will shift the calculated initial temperature<br />
for methane Eormation away from the experimental temperature<br />
by approximately l.O°C.<br />
4. Correl.ations predicting the initial functi.ona1 group distribution<br />
are limited to coa1.s containing between approximately 70% C and 92X C.<br />
157
BIBLIOGRAPHY<br />
1. Attar, A., Prep. Div. Fuel Chem., A.C.S., 3 (4), 169 (1978).<br />
2. Messenger, L. and Attar, A,, Fuel, (9), 655 (1979).<br />
3. Anthony, D. B. and Howard, J. B., A.I.Ch.E.J., 2 (4), 625 (1976).<br />
4. Suuberg, E. M., W. A. Peters and J. B. Howard, I.E.C., Proc. Des. Div.,<br />
- 17 (l), 37 (1978).<br />
5. Wen, C. Y. and T. Z. Chaung, I.E.C., Proc. Des. Div.,g (4), 684 (1979).<br />
6. Benson, S. W., "Thermochemical Kinetics", Wiley, N. Y., 1976, p. 229.<br />
7. Campbell, J. It.<br />
San Francisco.<br />
and D. R. Stephens, A. C. S. Prep. For 1976 meeting in<br />
8. Makino, M. and Y. Toda, Fuel, s, 231 (1979).<br />
9. Makino, M. and Y. Toda, Fuel, 58, 573 (1979).<br />
10. Fitzgerald D. and D. W. Van Krevelen, Fuel, 38, 17 (1959).<br />
11. Bredael, P. and T. H. Vinh, Fuel, 3, 211 (1979).<br />
12. Madorsky, S. L. and S. Straus, J. Res. Nat'l. Bur. Standards, 2 (6), 361.<br />
13.<br />
Eisenbert, A. and T. Yokoyama, A. C. S. Div. Polym. Chem., 9 (2), 1408 (1968).<br />
14. Factor, A., J. Polym. Sci., Part A-1, 1, 363 (1969).<br />
15. Kretschmer, C. B. and H. L. Peterson, J. Chem. Phys., 3, (7), 1772 (1963),<br />
16. Mulcahy, M., "Gas Kinetics", Wiley, N. Y., 1973.<br />
17. Kochi, J. K.<br />
p. 6.<br />
(ed.), "Free Radicals" Vol. I., John Wiley and Sons, N. Y., 1973,<br />
18. Benson, S. W., "Thermochemical Kinetics", Wiley, N. Y., 1976, p. 164.<br />
L9. Loucks, I,. F. and K. 3. Laidler, Canadian J. Chem., 45, 2795, (1967).<br />
20. Denisov, I:. T., "1.iquid Phase Reaction Rate Constants", I. F. I./Plenum,<br />
N. Y., 1974, pp. 286-287.<br />
158
70 r CHa<br />
IO<br />
0 500 600 700 800 900 1000 1100 1200 1300<br />
"t 50<br />
TI'KI<br />
Figure 1, cf14 and CZf16 Ref.. (7)<br />
/ .<br />
/<br />
/--,<br />
.<br />
I<br />
I50<br />
140<br />
130<br />
120<br />
E 110-<br />
"? 100 -<br />
4 90-<br />
d 80-<br />
' 70-<br />
-<br />
E<br />
60<br />
50-<br />
40 -<br />
30 -<br />
20 -<br />
10<br />
"7 50<br />
E,<br />
-<br />
-<br />
-<br />
-<br />
-<br />
-<br />
€0-<br />
- 40-<br />
- 30 -<br />
w<br />
><br />
-<br />
-<br />
-<br />
Figure 2, Hydrogen Ref. (7)<br />
/<br />
1011<br />
. . - - I I . . . I . . - l - L - L . 2<br />
d0 - 600 700 800 900 loo0 1100 Ixx) 1300<br />
T I'K I<br />
20<br />
IO -<br />
0-<br />
Figure 3,, Carbon Dioxide Ref. (7) Figure 4- Carbon t4onoxide Ref. (7)<br />
159<br />
"t 70<br />
I--<br />
/<br />
/<br />
/<br />
/<br />
I<br />
y-
14<br />
13<br />
12<br />
II<br />
5'0-<br />
2 9- -<br />
-<br />
-<br />
-<br />
6 e -<br />
9 7-<br />
6-<br />
5-<br />
4-<br />
3-<br />
2-<br />
I -<br />
o.--,-<br />
500 600<br />
05<br />
nr<br />
MODEL<br />
_----<br />
/--<br />
J<br />
r , , # % # b J<br />
,<br />
r)<br />
70<br />
60<br />
40<br />
30<br />
20<br />
700 BOO 900 1000 1100 1200 1300<br />
500<br />
TI*Kl TI'KI<br />
I., -/ , , ,<br />
600 700 BOO 900 1000 1100 1200 1300<br />
Figure 5, Methane Ref. (8,g) Figure 6. Hydrogen Ref. (8,9)<br />
-/ /! MAKlNO<br />
I<br />
I<br />
/<br />
I<br />
TOD4 8<br />
r<br />
/<br />
I<br />
160 I
I ~<br />
<strong>IN</strong>TRODUCTION<br />
AN <strong>IN</strong> SITU STUDY <strong>OF</strong> RAPID COAL PYROLYSIS US<strong>IN</strong>G FTIR"<br />
J. D. Freihaut, P. R. Solomon,** D. 3. Seery<br />
United Technologies Research Center, East Hartford, CT 06108<br />
Recent investigations of rapid coal pyrolysis have generally been limited to<br />
two approaches -- entrained flow techniques and heated grid devices. The entrained<br />
flow technique provides a method wherein injected coal samples experience heating<br />
rates comparable to those expected in combustion processes. However, the data<br />
collected is generally limited to weight loss as a function of apparent residence<br />
time in the reactor hot zone (1,2,3). The heated grid techniques provide a more<br />
clearly defined time-resolved thermal environment for small particles (60 - 100 pm)<br />
and allow determination of the volatile species evolved into a cold environment<br />
surrounding the grid (4-8). Due to the mode of heating oE the particles in the<br />
grid technique one is limited to the particle size ranges that can be employed.<br />
Both approaches have provided useful information concerning the nature of rapid<br />
devolatilization. It is also clear chat other techniques and reactor designs are<br />
needed to provide information concerning rapid pyrolysis phenomena for a range of<br />
temperatures, particle sizes and reactive atmospheres.<br />
__-<br />
EXPERIMENTAL DESIGN<br />
A reactor has been constructed in which small samples of coal (20 - 60 mg) are<br />
rapidly injected (- 25 msec) into a preheated environment. The injection device<br />
allows one to deliver particles as small as 100 pm or as large as several millimeters<br />
in diameter. Injection of the small samples into a preheated zone insures that the<br />
particles experience initial heating rates comparable to those expected in coal<br />
combustors. The gases produced by the thermal decomposition process are monitored<br />
in situ by use of a Nicolet FTIR Spectrometer operated in the rapid scan mode. A<br />
schematic of the pyrolysis system is shown in Fig. 1.<br />
PYROLYSIS GAS SPECTRA<br />
Figure 2 displays a portion of the time-resolved spectra obtained from the<br />
devolatilization of a Pittsburgh bituminous coal (PSOC 170). Figure 3 displays the<br />
same spectral window obtained from the rapid scan FTIR data collected from the de-<br />
volatilization of a Montana lignite. The difference in characteristics of the gaseous<br />
yields are apparent. The bituminous coal yielded the greater ratio of hydrocarbon<br />
species to carbon oxide species. The same trend is noted in the high resolution<br />
scans taken a; the completion of the rapid scans (See Figs. 4 and 5). These trends<br />
*Work supported by the Department of Energy under Contract ET-78-C-01-3167<br />
**Present Address: Advanced Fuel Research, P.O. Box 18343, East Hartford, CT 06118<br />
161
\<br />
were to be expected on the basis of work previously preformed by use of a heated<br />
grid to devolatilize the coal. That is, the relative yields of the light gases<br />
reflect the functional group characteristics of the parent coal (8).<br />
APPARENT FIRST ORDER ARRHENIUS RATE CONSTANTS<br />
The rise times of the various gaseous species were used to extract apparent<br />
first order rate constants from the time-resolved FTIR data. For the sake of<br />
.comparison, the method of extracting the rate constants was the same as that previously<br />
employed using the heated-grid apparatus. Figure 6 shows the results<br />
obtained for the Pittsburgh bituminous coal and the Montana lignite. Obviously,<br />
there is a significant difference in the apparent rate constants obtained by devolatilization<br />
in each of the two reactors. It is believed that the variation<br />
in rate constants reflect the variations in the thermal flux experienced by the<br />
coal particles within each reactor. The initial heating rate of 100 pm coal<br />
particles in the heated grid apparatus employed was determined by thermocouple<br />
measurements to be of the order of lo2 to 1030C/sec. In the isothermal furnace the<br />
initial heating rates are estimated to be of the order of 1040C/sec and greater (9).<br />
The rate constants obtained in the furnace experiments are about a factor of ten<br />
higher than those obtained from the heated grid. It is believed that the nonisothermal<br />
nature of the pyrolysis process in the furnace is responsible for the<br />
apparent lack of temperature sensitivity in the rate constant values.<br />
APPARENT FIRST ORDER RATE CONSTANTS AND COAL TYPE<br />
Inspection of Fig. 6 indicates that, within the resolution of the experiment,<br />
the coal type does not have a significant effect upon the apparent first order<br />
rate constant for a particular gaseous species evolved. The reactor type has a much<br />
greater effect on apparent rates than does the coal type.<br />
The independence of apparent rate constant with coal type is in agreement with<br />
results obtained by use of the heated grid that indicated that the amount of a<br />
particular gaseous species evolved to be highly dependent on coal type but the rate<br />
of evolution to be independent of coal type.<br />
APPARENT RATE AND PARTICLE SIZE<br />
As shown in Fig. 6 there is a decrease in rate with particle size if the particle<br />
size range of the sample is changed from -100 mesh to -40 mesh. There does not<br />
appear to be any significant difference in the yield structure of the light gases<br />
evolved. For the small sample sizes employed, the yield structure of the light gases<br />
appeared to vary more with the particular sample employed than with the particle size<br />
chosen.<br />
F<strong>IN</strong>AL REMARKS<br />
As indicated by the comments above, the current pyrolysis configuration has been<br />
useful in determining the validity of hypotheses formulated by studies performed with<br />
the heated grid apparatus. However, in its current configuration it is not without<br />
162
its disadvantages: calibration of the reactor is extremely difficult: the alumina<br />
walls tend to provide active sites for the transformation of sulfur-containing gases:<br />
the tar-soot mist formed at higher operating temperatures and by use of smaller<br />
particle sizes tends to interfere with the IR signal.<br />
ACKNOWLEDGMENTS<br />
The authors wish to express gratitude for the technical assistance of Dave<br />
Santos and Gerald Wagner.<br />
163
REFERENCES<br />
1.<br />
2.<br />
3.<br />
4.<br />
5.<br />
6.<br />
7.<br />
8.<br />
9.<br />
Badzioch, S. and Hawksley, P. G. W.,<br />
4, 521 (1970).<br />
Ind. Eng. Chem. Proc. Des. Develop. 9, No.<br />
Nsakala, N. Essenhigh, R. H. and Walker, P. L., Jr., Studies on Coal Reactivity:<br />
Kinetics of Lignite Pyrolysis in Nitrogen at 808OC, Pennsylvania State Univ.<br />
(1977).<br />
Scaroni, A. W., Walker, P. L., Jr. and Essenhigh, R. H., Amer. Chem. SOC. Div.<br />
of Fuel Chem. Preprints 2, No. 3, 123 (1979).<br />
Juntgen, H. and van Heek, K. H., Fuel, 47, 103 (1968).<br />
Anthony, D. B. and Howard, J. B., AIChE 2, No. 4, 625 (1976).<br />
Suuberg, E. M. Peters, W. A. and Howard, J. B.,<br />
Chem. Preprints 2, No. 1, 112 (1977).<br />
Amer. Chem. SOC. Div. of Fuel<br />
Solomon, P. R. and Colket, M. B., Seventeenth Symp. (International) on Combustion,<br />
131 (1978).<br />
Solomon, P. R., Amer. Chem. SOC. Div. of Fuel Chem. Preprints z, No. 2, 184<br />
(1979).<br />
Freihaut, J. D. and Vastola, F. J., Preprints -- Eastern States Section: The<br />
Combustion Institute, November (1978).<br />
164
KBr<br />
IR<br />
KBr Window<br />
IR Cut<br />
FIG. 1: PYROLYSIS SYSTEM<br />
i<br />
L 1<br />
<strong>IN</strong>JECTOR<br />
COAL SAMPLE<br />
165
FIG. 2<br />
0<br />
D<br />
N<br />
d<br />
0<br />
D<br />
9<br />
d<br />
0<br />
a<br />
(D<br />
P.l<br />
0<br />
a<br />
m<br />
d<br />
Om<br />
aa<br />
o w<br />
NE<br />
:y<br />
0<br />
a<br />
9<br />
N<br />
0<br />
(D<br />
N<br />
0<br />
m<br />
N<br />
0<br />
3<br />
Z
t 1 1 I I I<br />
09 os ' OB. O& 02 01' 00<br />
33NtMUDS9U<br />
167<br />
FIG. 3
I<br />
33NVWOSW<br />
168<br />
0<br />
-0<br />
Q<br />
-8<br />
2<br />
8<br />
-E<br />
0<br />
-0<br />
0<br />
N<br />
o m<br />
-0 n<br />
z g<br />
f<br />
z<br />
W<br />
-8 2<br />
:3<br />
0<br />
-2<br />
m<br />
0<br />
-0<br />
%<br />
0<br />
-0<br />
0<br />
v
W<br />
t<br />
z<br />
'2<br />
2<br />
I I I I I I<br />
0 0 0<br />
9<br />
cr,<br />
0<br />
2<br />
0<br />
169<br />
E<br />
0<br />
0<br />
8 4:<br />
0<br />
0<br />
00<br />
0<br />
8<br />
c<br />
0<br />
0<br />
'0<br />
0<br />
0<br />
0 N<br />
o m<br />
o a<br />
l?Jg<br />
5<br />
5<br />
o><br />
o a<br />
E %<br />
0<br />
0<br />
N m<br />
0<br />
0<br />
%<br />
0<br />
0<br />
8<br />
0
Y<br />
RATE CONSTANT FOR METHANE EVOLUTION<br />
103 - 1 I I I I 1<br />
102 -<br />
101 -<br />
10-1 -<br />
10-2 -<br />
10-3 -<br />
0.4<br />
0.6 0.8 1 .o 1.2 1.4 1.6 1.8<br />
1OOOlT (K-l)<br />
170<br />
FIG. 6
<strong>THE</strong> <strong>THE</strong>RMOCHEMICAL EFFECTS <strong>OF</strong> GAS-<strong>COALS</strong> <strong>IN</strong> PYROLYSIS PROCESS<br />
Zhaoxiong Wang and James K. Shou<br />
Institute for Mining and Minerals Research, University of Kentucky<br />
P.O. Box 13015, Lexington, Kentucky 40583<br />
<strong>IN</strong>TRODUCTION<br />
The gas-coal is a young bituminous coal. In its organic matter there is a large<br />
quantity of thermally unstable constituents. The intense thermal decomposition may<br />
be initiated at a temperature as low as slightly above 30OoC. Much tar, water of<br />
decomposition and gaseous products are liberated sharply (1).<br />
thermochemical conversion influence the pyrolysis process.<br />
These features of<br />
During pyrolysis, chemical changes and phase transformation are accompanied by<br />
certain thermal effects. Chemical reactions occur in opposite directions - degradation<br />
and polycondensation. For instance, the high-molecular-weight substances of<br />
coal decompose and produce volatile products with low molecular weights, which evolve<br />
successively. On the other hand, organic matter remaining in the solid phase will<br />
continue to strengthen its linkage between structural units. The thermal effects<br />
alternate between exothermic and endothermic during the pyrolysis process.<br />
a1 ternation of thermal effects reflects the nature of chemical interreactions. At<br />
each turning point the chemical composition of coal organic matter will undergo a<br />
remarkable change.<br />
EXPERIMENTAL PROCEDURE<br />
The thermal effects generated by pyrolytic reactions and phase exchanges under<br />
the action of heat may be studied by means of differential thermal analysis (DTA)<br />
(2-6). Brief description of DTA experiments are as follows.<br />
About lg of finely ground coal with a particle size of less than 0.2m was<br />
packed in a porcelain crucible. hother crucible contained the calcined magnesia,<br />
which was used as the inert reference. Both crucibles were separately covered with<br />
a lid, on which a thermowell was connected. Samples were heated to 850-950°C at a<br />
constant rate of 50C/min.<br />
galvanometer in coordinates of coal temperature versus heating time and temperature<br />
difference versus heating time.<br />
To detect chemical changes, the composition of heated coal organic matter at its<br />
peak temperature was determined. A series of log coal samples were taken and were<br />
heated in the same pyrothermograph furnace.<br />
The thermographic curves were plotted by a mirror<br />
match that in the DTA tests. When each relative peak temperature was reached, the<br />
crucible was immediately taken off the furnace and cooled in the desiccator. The<br />
proximate and ultimate analyses of these samples were carried out.<br />
<strong>THE</strong> GENERALIZATION <strong>OF</strong> <strong>THE</strong>RMOGRAPHIC PEAKS<br />
RESULTS AND DISCUSSION<br />
The<br />
The heating was strictly controlled to<br />
DTA curves of several coals studied have shown general characteristics and also<br />
have revealed some differences, with respect to peak temperature, peak width, peak<br />
altitude and peak shape (Figure 1). Analytic data of these coals are given in Table<br />
1. Coals No. 1 and No. 2 are good caking coals, theothers are weakly caking coals.<br />
171
TABLE 1. ASSAY DATA <strong>OF</strong> TESTED GAS-<strong>COALS</strong><br />
PROXIMATE ANALYSIS, WT.% ULTIMATE ANALYSIS, WT.%,DAF<br />
COAL 1-<br />
MOISTURE ASH P LA STOM ETR I C<br />
SAMPLE AS DETER- CONTENT MATTER SULFUR <strong>IN</strong>DEX*, m<br />
M<strong>IN</strong>ED (dry) (daf) (dry) X Y<br />
No. 1 1.90 7.86 39.9 3.04 80.51 5.83 1.97 11.69 43 17<br />
No. 2 2.14 12.40 36.5 2.94 81.20 5.59 1.96 11.25 48 14<br />
No. 3 3.29 5.39 46.3 0.52 78.10 5.72 1.94 14.24 40 7<br />
No. 4 4.28 7.08 42.7 0.38 80.48 5.60 2.81 13.11 27 7<br />
No. 5 3.55 9.64 43.9 0.50 80.88 5.90 - - 40 7-8<br />
*Index X (final shrinkage) and Y (maximum thickness of plastic layer) were determined<br />
by special plastometric testing equipment. The value of Y was served as the<br />
parameter for measuring the caking capacity of coal.<br />
1.<br />
To interpret the thermograms, the following points should be considered.<br />
The primary effect (the first endothermic peak) appears at about 100°C. This<br />
effect occurs only in connection with evaporation of physically absorbed water.<br />
2. Above 15OoC, the differential curve spreads upward. Its peak temperature indicates<br />
the initiation of intense thermal decomposition of organic matter. With<br />
respect to gas-coals, the temperature of this peak is located at about 270OC.<br />
The temperature of this exothermic peak will be affected by the heating rate.<br />
Structural studies had not shown the breakdown of coal structure when it was<br />
heated to below 25OoC and there was a little possibility of chemical change.<br />
Some reactions, such as dehydrogenation, surface oxidation and dehydration,<br />
exhibit an exothermic effect (7). A t this poigt water of decomposition is<br />
already yielded from gas-coals (1).<br />
3. Beyond 3OO0C the differential curve starts to decline. The thermal effects of<br />
coal pyrolysis show endothermic character as a result of the decomposition<br />
reaction, polycondensation of pyrolysis products and phase transformation. The<br />
quantity of volatile yield between the second and third peaks makes up almost<br />
one half of the total volatile matter.<br />
The existence of a W-shape peak expresses the situation of coal in plastic stage.<br />
AS illustrated in Figure 2, there is little difference in the appearance of differ-<br />
ential curves between the original coal and the fast preheated (5OoC/min) to 28OoC<br />
coal. It shows that deep destruction has not taken place during the fast heating of<br />
coal. However, on the thermogram of char, a similar W-shape peak disappears. The<br />
curve is smooth before the temperature reaches 536OC. This is because the primary<br />
decomposition and evolution of volatile matter and the phase conversion essentially<br />
have been completed. Therefore the existence of that W-shape peak is characteristic<br />
Of the plastic state. The phenomenon of exothermic effect within a W-shape peak<br />
might also be affected by the increase in thermal conductivity when the particles<br />
became agglomerated. In essence, the first dip of the curve occurs when coal softens<br />
and changes to a plastic state. The second dip occurs during resolidification of<br />
the plastic mass.<br />
4.<br />
The general thermal effect becomes clearly exothermic at temperatures of 51O-55O0C.<br />
The rise of the curve indicates the formation of a semi-hard structure. This<br />
secondary carbonization, accompanied by liberation of residual hydrogen from the<br />
periphery of aromatic clusters, in every casegives rise to an exothermic peak.<br />
172
5. At temperatures above 76OoC, slight endothermic effects could be observed.<br />
These effects are due to further regulation in the arrangement of hexagonal<br />
carbon network.<br />
6.<br />
The effect of mineral matters under high temperatures may be reflected on the<br />
thermogram. The thermogram of coal sample No. 2 with a 20% lime additive is<br />
shown in Figure 3. To a certain degree, mineral matters affect thermal<br />
decomposition of organic matter. Particularly at temperature ranges of 75O-85O0C,<br />
there appears an obvious endothermic effect, which is characteristic of this<br />
additive.<br />
CONSTITUENT CHANGES <strong>OF</strong> NONVOLATILIZED MATERIAL<br />
The chemical reaction of thermal decomposition of gas-coal organic matter is<br />
extremely complex. klhile it is difficult to postulate the thermochemical reactions,<br />
the study of constituent alternation of gas-coal organic matter is helpful in explaining<br />
the mechanism of thermal decomposition.<br />
Elemental composition data of nonvolatilized material from gas-coals No. 1 and<br />
No. 2 heated to each characteristic peak temperature are given in Tables 2 and 3.<br />
is the ratio of total hydrogen and carbon to total content of other elements.<br />
;ac e hydrogen-containing grade (fH) is the atomic ratio of hydrogen to carbon. The<br />
carbonization grade (fc) is an index of the atomic ratio of carbon to noncarbon<br />
elements. This ratio for the original coal is assigned an index value of 1.0. The<br />
aromaticity (fa) is calculated according to Van Krevelen and Schuyer's formula (8).<br />
These two gas-coals begin to decompose at about 27OoC. It appears that thermochemical<br />
decomposition is initiated from hydrogen- and oxygen-rich groups. As data<br />
indicate, the hydrogen content of nonvolatilized material decreases sharply as the<br />
pyrolysis process proceeds. On the contrary, the main part of the carbon ring<br />
structure is strengthened because of the polycondensation reaction. The carbonization<br />
grade of nonvolatilized material increases steadily with the increase of temperature.<br />
For coal sample No. 1, carbon-to-hydrogen ratio changes from C6H5.2, approximated to<br />
the aromatic composition of benzene, to CgH0.9. As shown in Figure 4, fc rises from<br />
0.722 to 0.999 and eventually stabilizes.<br />
The carbonization process is carried out simultaneously with dehydrogenation.<br />
This is shown by the decreasing hydrogen-containing grade. Meanwhile, the carbonization<br />
of condensed carbon rings exhibits an aromatizing characteristic, as indicated<br />
by the increase of aromaticity. So it may be presumed that chemical structure<br />
changes only in the direction of high polycondensation of aromatic rings.<br />
CONSTITUENT CHANGES <strong>IN</strong> VOLATILIZED MATERIAL<br />
As a result of thermochemical decomposition, certain fractions of coal organic<br />
matter turn into volatile matter. The changes in volatile matter content of gascoals<br />
No. 1 and No. 2 are listed in Tables 2 and 3.<br />
As previously stated that in the temperature range between the second and third<br />
peaks, i.e. 258-435OC for gas-coal No. 1 and 274-438OC for gas-coal No. 2, the<br />
evolving rate of volatile products is higher than in other ranges. The higher evolution<br />
rate for gas-coal No. 2 appears in a higher temperature interval ranging from<br />
372OC to 438OC. It shows that gas-coal No. 2 probably has a higher thermal stability<br />
than gas-coal No. 1.<br />
The devolatilization process may be divided into three stages. Referring to the<br />
DTA curve for gas-coal No. 1, temperature ranges for the three stages are 20-435OC,<br />
435-53OoC and beyond 530OC. The chemical composition of evolved volatilized material<br />
changes significantly, depending on the various temperature ranges. These data are<br />
listed in Tables 4 and 5. Where, Cv, Hv, (O+S)v and Nv are contents of carbon,<br />
hydrogen, oxygen and sulfur, and nitrogen in volatilized material in wt.% respectively,<br />
6C, 6H, 6(O+S) and 6N (wt.9 daf) are the quantities of each element converted into<br />
volatile products in certaih temperature ranges.<br />
173
TYPE <strong>OF</strong><br />
ANALYSIS DATA<br />
Volatile Matter*,<br />
VMo, %<br />
Evolving Rate of<br />
Volatile Matter<br />
(AVMO~C)<br />
x loo<br />
Composition of nonvolatilized<br />
material, %, daf<br />
Carbon<br />
Hydrogen<br />
Oxygen & Sulfur<br />
Nitrogen<br />
RH C<br />
fH<br />
f C<br />
fa<br />
Wei ht of VM of<br />
*"'" = Wei:ht of origi<br />
TYPE <strong>OF</strong><br />
ANALYSIS DATA<br />
Volatile Matter*,<br />
VMo, %<br />
Evolving Rate of<br />
Volatile Matter<br />
(AVMO~C)<br />
TABLE 2. CONSTITUENT CHANGES <strong>OF</strong> NONVOLATILIZED<br />
MATERIAL DUR<strong>IN</strong>G HEAT<strong>IN</strong>G <strong>OF</strong> COAL SAMPLE NO. 1<br />
x loo<br />
Composition of nonvol<br />
ati 1 i zed<br />
material, %, daf<br />
Carbon<br />
Hydrogen<br />
Oxygen & Sulfur<br />
Nitrogen<br />
RH C<br />
fH<br />
f C<br />
fa<br />
PEAK TEMPERATURE<br />
ORIG<strong>IN</strong>AL<br />
39.9 15.6<br />
80.51<br />
5.83<br />
11.69<br />
1.97<br />
6.3<br />
0.87<br />
1 .oo<br />
0.722<br />
O!?IG<strong>IN</strong>AL<br />
COAL<br />
36.5<br />
81.20<br />
5.59<br />
11.25<br />
1.96<br />
6.5<br />
0.82<br />
1 .oo<br />
0.757<br />
3.6 10.4<br />
82.20 84.04<br />
5.51 4.11<br />
10.29 9.57<br />
2.00 2.28<br />
7.1 7.4<br />
0.81 0.59<br />
1.09 1.44<br />
0.771 0.937<br />
TABLE 3. CONSTITUENT CHANGES <strong>OF</strong> NONVOLATILIZED<br />
MATERIAL DUR<strong>IN</strong>G HEAT<strong>IN</strong>G <strong>OF</strong> COAL SAMPLE NO. 2<br />
34.4<br />
1.2<br />
82.11<br />
4.95<br />
10.95<br />
1.99<br />
6.7<br />
0.73<br />
1.13<br />
0.77C<br />
25.7<br />
8.9<br />
82.50<br />
4.25<br />
11.12<br />
2.13<br />
6.5<br />
0.62<br />
1.29<br />
0.85<br />
7.0<br />
9.7 1.7 1.3<br />
84.70<br />
3.51<br />
9.40<br />
2.39<br />
86.70<br />
3.11<br />
7.85 1 :4<br />
91.60<br />
1.93<br />
4.18 1 2.29<br />
94.20<br />
1.19<br />
2.74<br />
1 1.87<br />
7.5 14.4 20.7<br />
-7<br />
IIP<br />
AK TEMPERATUR & __ -<br />
438 - 51 4 563 735<br />
174<br />
15.4<br />
15.6<br />
34.77<br />
3.30<br />
9.70<br />
2.23<br />
7.4<br />
0.47<br />
1.65<br />
0.931<br />
1.8<br />
4.7<br />
5.18<br />
3.20<br />
9.37<br />
2.19<br />
7.7<br />
0.45<br />
1.72<br />
0.97:<br />
1 .o<br />
1.6<br />
7.44<br />
2.86<br />
7.59<br />
2.11<br />
9.3<br />
3.39<br />
2.00<br />
3.95<br />
-<br />
5.41<br />
3.3<br />
30.76<br />
1.83<br />
5.20<br />
2.21<br />
12.5<br />
0.24<br />
3.11<br />
0.988<br />
OKE<br />
1.91<br />
1.6<br />
4.27<br />
0.70<br />
3.11<br />
1.92<br />
9.0<br />
0.09<br />
7.26<br />
0.998
TABLE 4. CHEMICAL COMPOSITION <strong>OF</strong> VOLATILIZED MATERIAL<br />
RELEASED FROM HEAT<strong>IN</strong>G GAS-COAL NO. 1<br />
TEMPERATURE RANGE, "C<br />
CHEH I CAL COMPOS I T I ON 20-435 435-530 BEYOND 530<br />
Element Converted, Wt.%, daf<br />
6C<br />
6H<br />
6(0tS)<br />
6N<br />
Elemental Composition, %<br />
cv<br />
Hv<br />
(O+S)v<br />
Nv<br />
Atomic Ratio<br />
C<br />
H<br />
0<br />
11.30<br />
2.44<br />
3.71<br />
0.08<br />
64.46<br />
13.92<br />
21.16<br />
0.46<br />
5.4<br />
13.9<br />
1.3<br />
5.01<br />
1.13<br />
2.21<br />
0.17<br />
58.80<br />
13.26<br />
25.94<br />
2.00<br />
4.9<br />
13.3<br />
1.6<br />
TABLE 5. CHEMICAL COMPOSITION <strong>OF</strong> VOLATILIZED MATERIAL<br />
RELEASED FROM HEAT<strong>IN</strong>G COAL SAMPLE NO. 2<br />
2.85<br />
1.50<br />
3.98<br />
0.50<br />
32.28<br />
16.98<br />
45.08<br />
5.66<br />
2.7<br />
17.0<br />
2.8<br />
TEMPERATURE RANGE, OC<br />
CHEMICAL COMPOS1 TION 20-438 438-563 BEYOND 563<br />
Element Converted, Wt.%, daf<br />
6C<br />
6H<br />
S(0tS)<br />
6N<br />
Elemental Composition, %<br />
cv<br />
Hv<br />
(O+S)v<br />
Nv<br />
Atomic Ratio<br />
9.93<br />
2.82<br />
2.98<br />
0.06<br />
62.87<br />
17.86<br />
18.87<br />
0.40<br />
4.03<br />
0.54<br />
2.33<br />
0.07<br />
57.82<br />
7.75<br />
33.43<br />
1 .oo<br />
3.59<br />
1.69<br />
3.80<br />
0.13<br />
38.98<br />
18.35<br />
41 -26<br />
1.41<br />
C 5.2 4.8 3.2<br />
H 17.9 7.8 18.3<br />
0 1.2 2.1 2.6<br />
175
Although carbon evolves during the pyrolysis of coal, most of the carbon remains<br />
nonvolatilized. Referring to Tables 6 and 7, only about 25% of the carbon in coal<br />
sample No. 1 converts into volatile products, and 21.6% of carbon in coal sample No.<br />
2 converts into volatile products. Furthermore, the evolution of volatile carbon is<br />
relatively concentrated in the 270-550°C temperature range. Below 27OoC, carbon<br />
hardly participates in devol at1 il i zation.<br />
TABLE 6. DECOMPOSITION AND DEVOLATILIZATION RATES <strong>OF</strong><br />
EACH ELEMENT <strong>IN</strong> HEATED GAS-COAL NO. 1*<br />
RATE <strong>OF</strong> ELEMENTAL<br />
PEAK TEMPERATURE, OC<br />
DECOMPOSITION, % 258 435 482 530 760 COKE<br />
Ac - 14.0 18.9 21.4 22.5 25.0<br />
AH 6.0 41.7 53.3 61.2 77.4 86.8<br />
A(O+S) 12.9 31.7 38.2 50.6 75.6 84.5<br />
*<br />
Ac = Weight of carbon devolatilized<br />
Weight of carbon in original coal sample<br />
= Weight of hydrogen devolatilized<br />
Weight of hydrogen in original coal sample<br />
x 100%<br />
x 100%<br />
= Total weight of oxygen and sulfur devolatilized<br />
Total weight of oxygen and sulfur in original coal sample<br />
TABLE 7. DECOMPOSITION AND DEVOLATILIZATION RATES<br />
<strong>OF</strong> EACH ELEMENT <strong>IN</strong> HEATED GAS-COAL NO. 2<br />
x 100%<br />
RATE <strong>OF</strong> ELEMENTAL PEAK TEMPERATURE, OC<br />
DECOMPOSITION, % -274 372 438 514 563 735 COKE<br />
AC 1.4 5.7 12.3 15.7 17.2 18.6 21.6<br />
AH 13.4 29.1 50.5 53.1 60.1 76.0 90.4<br />
A(o+s) 3.7 6.9 26.5 29.6 47.3 66.4 81.0<br />
Hydrogen plays an important role in the coal pyrolysis process. The basis of<br />
pyrolytic change may be looked at as a redistribution of hydrogen among newly formed<br />
products (1). Large quantities of hydrogen are consumed for the formation of water,<br />
hydrogen sulphide and ammonia.<br />
The remaining hydrogen, called free hydrogen, is<br />
necessary for the yield of tarry products and for the formation of fusible matter in<br />
the plastic stage. The amount of liquid phase and the degree of softening increase<br />
with increasing amounts of free hydrogen in the coal. For coal sample No. 2, which<br />
produces a more stable plastic mass, the quantity of hydrogen evolved at the second<br />
stage (plastic stage) is lower than that in sample No. 1.<br />
The free hydrogen may be better preserved in plastic mass under pressure.<br />
has been proven by experiment that up to 6OO0C, plastic coal briquettes gave off less<br />
hydrogen than the same coal packed in a loose mass (9). Thus, pressurization is<br />
extremely important in the destructive hydrogenation of coal. In the conventional<br />
pyrolysis process, however, the nonvolatile part of carbon cannot be devolatilized<br />
because of a lack of thorough structural destruction. Furthermore, the amount of<br />
free hydrogen is limited, thus it is impossible to yield a great deal of liquid<br />
products.<br />
176<br />
It
After 55OoC, the quantity of devolatilizable hydrogen is still sizable. It holds<br />
three-fourths of the total atomic amount of various elements (Tables 4 and 5). In a<br />
small degree, carbon converts into volatile products. At this stage volatile products<br />
should be light gaseous products, such as hydrogen and methane. Clearly, the production<br />
of liquid products by either pyrolysis or other conversion processes may be<br />
controlled only before reaching the exothermic peak within the W-shape (Figure 1).<br />
CONCLUSIONS<br />
1.<br />
2.<br />
3.<br />
4.<br />
1.<br />
2.<br />
3.<br />
4.<br />
5.<br />
6.<br />
7.<br />
8.<br />
9.<br />
This study of thermographical curves and corresponding assay data of gas-coals at<br />
peak temperatures has shown that thermal effects were closely connected with the<br />
decomposition of coal organic matter and its changes in chemical composition.<br />
After the second peak (exothermic) temperature, gas-coals started to decompose<br />
intensely. Thermal decomposition was initiated from hydrogen- and oxygen-rich<br />
thermally unstable constituents.<br />
The evolution of volatile carbon from solid substances was concentrated in the<br />
temperature range between the second and third peaks. The control of thermal<br />
decomposition before reaching the exothermic peak within the W-shape is of great<br />
importance. Improving interreaction between volatile carbon and free hydrogen,<br />
coal pyrolysis and other coal conversion processes could be improved to yield a<br />
greater amount of hydrocarbon products.<br />
Beyond the second endothermic peak within the W-shape, the atomic ratio of carbon<br />
to the sum of other elements in nonvolatilized material increased markedly. The<br />
aromaticity of nonvolatilized material tends to increase with the rise of the<br />
carbonization degree.<br />
REFERENCES<br />
Wang, Zhaoxiong, Journal of Tienjin University, No. 13, 27 (1963), (in Chinese).<br />
Wang, Zhaoxiong, Chemical World, No. 5, 224 (1962), (in Chinese).<br />
Pope, M.I., et al., Differential Thermal Analysis, London (1977).<br />
Shou, J.K., et al., Proceedings of 11th IECEC, 300 (1976).<br />
Heilpern, S., Thermal Analysis, Vol. 3, 283, London (1974).<br />
Arseneau, D.F., et al., Proceedings of the Coal and Coke Sessions, 28th Can. Chem.<br />
Eng. Conf., 56 (1978).<br />
Takekawa, T., et al., Fuel, 57, 797 (1978).<br />
Francis, W., Coal, London (1961).<br />
Gryaznov, N.S., et al., Koks i Khimiya, No. 6, 1 (1975).<br />
177
a. C.<br />
E-<br />
a. Coal Sample No. l<br />
b. Coal Sample No. 2<br />
c. Coal Sample No. 3<br />
d. Coal Somple No. 4<br />
FIGURE 1. <strong>THE</strong>RMOGRAMS <strong>OF</strong> GAS-<strong>COALS</strong><br />
a. Orlgtnal Coal<br />
b. Fast Preheated Coal<br />
c. Char From Preheated Coal<br />
d. Coke From Preheated Coal<br />
FIGURE 2. <strong>THE</strong>RMOGRAMS <strong>OF</strong> GAS-COAL SAMPLE NO. 5
0.<br />
FIGURE 3. <strong>THE</strong>RMOGRAM <strong>OF</strong> GAS-COAL SAMPLE NO. 2<br />
WITH LIME ADDITIVE<br />
0.6<br />
t 4<br />
x c 200 400 600 800 960<br />
Heating Ternpererature, "C<br />
I. fa IT. fo m. fH<br />
FIGURE 4. CHANGES <strong>OF</strong> AROMATICITY, CARBONIZATION<br />
GRADE AND HYDROGEEJ-CONTA<strong>IN</strong><strong>IN</strong>G GRADE <strong>OF</strong><br />
COAL SAMPLE NO. 1 WITH HEAT<strong>IN</strong>G TEMPERATURE<br />
179
Introduction:<br />
MODEL PATHWAYS FOR GEX RELEASE FROM LIGNITES<br />
by<br />
M.T. Klein and P.S. Virk<br />
Department of Cheinical Engineering<br />
Massachusetts Institute of Technology<br />
Cambridge, MA 02139<br />
Recent developments limiting petroleum supplies have intensified the search<br />
for other sources of energy and chemical feedstocks. Two such alternatives are<br />
coal, of which lignites are especially abundant in the U.S. (l), and those renewable<br />
resources termed biomass, of which lignin is a major component (2). Commercial<br />
methods for processing both coal and biomass invariably involve high temperature<br />
treatments, aspects of which have been investigated in many laboratory pyrolyses of<br />
lignin and lignites (3-5). Unfortunately, the basic pathways and reaction mechanisms<br />
involved in these pyrolyses have remained obscure, on account both of the<br />
refractory nature of the substrates and the lack of unequivocal chemical structures<br />
to describe them. Pyrolyses of several very simple lignin-related substrates have<br />
also been reported, notably by Russian investigators (6-11). Among these, the pyrolyses<br />
of anisole and guaiacol (6-9) have been interpreted (11) in terms of analogous<br />
free radical demethylation and detnethoxylation mechanisms which describe<br />
the formation of the observed gaseous products, methane and carbon monoxide, but<br />
are unable to rationalize the corresponding observed liquid products, benzene,<br />
phenol, and catechol. Overall, the literature still provides no framework, either<br />
theoretical or experimental, for modeiling gas release during pyrolysis of lignites<br />
and lignin. This motivated the present work.<br />
Our investigation derives from two hypotheses. First, the primary evolution<br />
of gas during lignite pyrolysis is presumed to occur from lignin-related, residues<br />
in the coal. Second, it is hypothesized that the molecular topology of lignoid<br />
structures favors elimination of gases by concerted pericyclic reactions which are<br />
thermally (i.e., ground state)-allowed. In regard to the first hypothesis, the<br />
evolutionary link between biomass and coal is relatively well established (12,13!<br />
with lignin akin to peat, which is adjacent to lignite in the coalification series.<br />
It is therefore quite reasonable to expect lignin-related residues in lignite;<br />
indeed, such residues can be recognized in most structural models (1 ,14) of this<br />
Coal. Our second hypothesis, which has not hitherto been mooted, is based on analysis<br />
of the Freudenberg model of lignin (2) in light of the Woodward-Hoffman (15)<br />
description of therm1 pericyclic reactions. Such analyses revealed a variety of<br />
lignoid chemical moieties susceptible to pyrolysis by pericyclic pathways that involve<br />
elimination of gaseous products such as methane, carbon monoxide, carbon dioxide<br />
and water. According to the pericyclic formalism, methane might originate<br />
by concerted<br />
p%[q q<br />
6e(onu) group-transfer elimination from a guaiacyl moiety:<br />
&Ctl -+ + +g; T3,.<br />
(RO)<br />
OH t+<br />
Guaiacyl 6e Transition o-diquinone + Methane<br />
Moiety State Products<br />
The guaiacyl moiety is relatively abundant in the lignin structure itself, within<br />
coniferyl alcohol monomer units which have suffered polymerization in the 5 and/or<br />
6 Positions; guaiacyl moieties can also arise from reversion of the prevalent<br />
6-ether linkage between monomer units. In similar vein, carbon monoxide could<br />
arise by cheletropic extrusion of a carbonyl unit, such as that in coniferaldehyde,<br />
1 eo
and carbon dioxide by cyclo-reversion of lactones and aryl-carboxyl ic ("humic")<br />
acids. Finally, pericyclic elimination of water could result from retro-ene reactions<br />
among the guaiacyl-glycerol units in lignin, possibly following B-ether reversion.<br />
The preceding hypotheses for gas release from lignites are amenable to experi-<br />
mental probing by pyrolysis of appropriate model compounds. In the present paper we<br />
report preliminary results for two series of substrates respectively associated<br />
with methane and with carbon monoxide production. Methane formation was examined<br />
by pyrolyses of guaiacol, the prototypical guaiacyl moiety, along with anisole (con-<br />
trol), and a nu!iiber of substituted guaiacols, including 2,6 dimethoxyphenol, iso-<br />
eugenol, and vanillin. Carbon monoxide release was investigated by pyrolysing<br />
benzaldehyde, the prototypical moiety, along with related carbonyl compounds in-<br />
cluding acetophenone (control), cinnanialdehyde and vanill in, the latter two res-<br />
pectively intended to illustrate the effects of extended conjugation and guaiacyl<br />
substitution.<br />
Experimental :<br />
The substrates pyrolysed were all commerciallv available in purities exceeding<br />
98% and were used as received. The batch reactors employed were stainless steel<br />
"tubing bombs", fashioned from Swagelok components and ranging in volume from 0.6<br />
to 10.5 cnd. The larger reactors were equipped with valves for gas sampling,<br />
while the smaller reactors were used to minimize heat-up and quench times in experiments<br />
of short duration. Kinetic data were demonstrably unaffected by variations<br />
in reactor volume. A11 reactors were loaded and sealed in a glove box maintained<br />
with an inert atmosphere of either nitrogen or argon, the inert serving as<br />
an internal standard in later gas analyses. The reactors were then immersed in a<br />
fluidizedsandbath for the duration of reaction and finally quenched in an ice<br />
water bath. The pyrolysis experiments were conducted at temperatures from 250 to<br />
600 C, with holding times of 2 to 40 minutes. Substrate conversions were generally<br />
held to less than 30%, in an effort to emphasize primary reactions; however, kinetic<br />
data were also obtained at very low conversions, of < 10% for some substrates<br />
which were prone to form coke, and at high conversions, up to 90%, in other selected<br />
instances. The amount of substrate charged varied. from 10 to 200 mg, to provide<br />
initial substrate concentrations ranaing from 0.15to 3.1) mol/il in the gas<br />
phase. Product analyses were effected by gas chromatography on a Hewlett-Packard<br />
5730 instrument. Gaseous products, sampled by syringe, were analysed on molecular<br />
sieve, silica gel, and Porapak Q columns using helium carrier gas and thermal conductivity<br />
detectors. Liquid and solid reactor contents were dissolved in solvent<br />
and analysed on Porapak P and Q, and silicone oil columns, using either thermal<br />
conductivity or flame-ionization detection. Care was taken to effect material<br />
balance closures and to match gas and liquid product yields. In all cases, the<br />
liquid (and solid) phase material balance, which invariably included unreacted substrate,<br />
could be closed to within +lo$. In favorable cases, where reaction stoichiometry<br />
was known, the absolute gas and liquid products agreed to within +lo% of<br />
each other and separately equalled the amount of substrate converted. However in<br />
certain other cases, noted in the text, reaction stoichiometry was uncertain and<br />
precise matching of gaseous and liquid products impossible; in such instances,<br />
substrate decomposition kinetics were based on 1 iquid phase analyses.<br />
Results:<br />
Table 1 sumnarizes the present experimental grid. For each substrate pyrelysed,<br />
the table lists chemical structure, purity, and reaction conditions of<br />
temperature, holding time and concentration. The experimental results will be<br />
described in three parts, namely (i) prototype pyrolyses, of guaiacol and benzal-<br />
181
dehyde, which revealed major pathways for methane and carbon monoxide formtion,<br />
(ii) substituenteffects, inferred from pyrolyses of substituted guaiacols and<br />
benzaldehydes, and (iii) control pyrolyses, of the relatively refractory sub-<br />
strates anisole and acetophenone, for comparisons with the prototype pyrolyses.<br />
(i) Prototype Pyrolyses<br />
Guaiacol pyrolysis yielded methane, carbon monoxide,cztechol and phenol as<br />
the only products at low conversions; at high conversions a solid 'coke' also<br />
formed, being accompanied by reduced yields of catechol relative to the other<br />
products. Relationships among products are illustrated in Figure 1. The mol<br />
ratios of (methane/catechol), Figure la, and (carbon monoxide/phenol), Figure<br />
lb, were each separately close to unity in essentially all cases, covering<br />
fractional substrate conversions 0.5 x 10 -3 < x < 0.10 at all temperatures<br />
from 250 to 450 C. Also, the mol ratios of (CO/CH4) and (phenol/catechol)<br />
were each substantially independent of substrate conversion at any given<br />
temperature, as shown in Figure IC. These observations suggest two parallel<br />
pathways for guaiacol decomposition, respectively termed (Rl) and (R2):<br />
The parentheses to the right of each expression indicate the difference in<br />
hydrogen atoms between the substrate and the observed pair of stable products.<br />
The order of reactions (Rl) and (E2) with respect to guaiacol was examined<br />
by varying the initial substrate concentration from 0.45 to 3.0 mol/l in a<br />
series of experiments at T = 350C. These data are disnlayed in Figure 2,<br />
parts a, b, and c of which respectively plot the variation with time of guaiacol,<br />
catechol, and phenol concentrations, each normalized by the initial guaiacol concentration.<br />
On the co-ordinates of Figure 2, a reaction with rate expression<br />
r = kCa , i.e. rate constant k and order a ,would yield an initial slope<br />
I dln (C/Co)/ dtl +, 0 = kC0a-l In each of Figures 2a, 2b, and 2c, a sin-<br />
gle average slopesufficed to describe all of the data. No systematic varia-<br />
tion of initial slope with initial substrate concentration could be discerned<br />
and the absolute uncertainties in the slope, respectively ?20% in Figures 2a<br />
and 2b and *50% i n Figure Zc, were small relative to the seven-fold range of<br />
initial concentrations used. The foregoing show that a=l for each of reac-<br />
tions (Rl) and (R2); that is, the kinetics of guaiacol disappearance, catechol<br />
appearance, and phenol appearance were all essentially first order in guaiacol.<br />
Further study of guaiacol pyrolyses at temperatures from 330 to 525 C with<br />
fixed initial concentration 0.45 mol/l revealed the temperature-dependence of the<br />
first order rate constants kl and k2 respectively associated with reactions<br />
(R1) and CR2). These results are shown in Figure 3, an Arr enius diagram with<br />
co-ordinates of log k (5-j) vs. reciprocal temperature e -? where 0 =<br />
4.573 x T i n Kigvins; on these co-ordinates, the usual Arrhenius relation-<br />
ship describes a straight line, loglok = logl A - E*/e, where the pre-exponen-<br />
tial factor A has units of the rate constant f! and the activation energy E*<br />
is expressed in kcal/mol. In Figure 3 it is evident that log1 k (sho n by<br />
Circles) increases linearly with decreasing reciprocal tempera?uJe obeying<br />
an Arrhenius relationship over a range of five orders of magnitude in kl. The<br />
best fit of these data yields Arrhenius parameters of (log1 A (s-I),<br />
E: (kcal/mOl)) = (10.9 * 0.5 , 43.7 1.4) for the reaction TR1). Also in<br />
Figure 3, loglokz (squares) is seen to increase linearly with e-1 over a range<br />
182
I<br />
1<br />
1<br />
of four orders of magnitude in k and this provides the Arrhenius parameters<br />
(logleA (s-11 E* (kcal/mol)) = (?1.5 2 0.5, 47.4 f 1.6) for reaction (R2). These<br />
resu s also reveal that the selectivity of (CO/CH4) formation from guaiacol, given<br />
directly by the ratio (kz/kl), was typically on the order of 10-1 but increased<br />
with increasing temperature, from 0.05 at 300C to 0.25 at 450C.<br />
Benzaldehyde pyrolysis yielded carbon monoxideand benzene as the major products;<br />
traces of biphenyl and phenolic products were also detected, their concentration<br />
being from oneto two orders of magnitude less than that of benzene. The<br />
mole ratio of (CO/benzene)products was unity, 1.0 t 0.1, while the mols of CO and<br />
of benzene formed each closely equalled the moles of benzaldehyde that disappeared<br />
in all cases, covering fractional substrate conversions from 0.01 to 0.30 at temperatures<br />
from 300 to 550C. Thus the benzaldehyde pyrolysis pathway was evidently:<br />
Variation of the initial substrate concentration from 0.45 to 3.0 mol/L at T = 400C<br />
showed reacticn (R3) to be strictly first order in benzaldehyde, with the rate constant<br />
k3 = (8.0 ? 2.0) x 10-3 s-1 essentially independent of concentration. Finally,<br />
measurements of reaction (R3) kinetics at temperatures from 300 to 500C pro-<br />
vided the data shown in Figure 4, an Arrhenius ylot.<br />
(circles) increased linearly with decreasing e- , the best fit Arrhenius parameters<br />
being (loglo A (s-I), E* (kcal/mol)) = (9.5 f 0.8, 41.5 2 2.7).<br />
(ii) Substituent Effects<br />
It is evident that loglo ki<br />
Pyrolyses of 2,6 dimethoxyphenol, iso-eugenol, vanillin, and t-cinnamaldehyde<br />
probed the effect of substituents on the prototype pathways described above.<br />
Both of the 2,6 dimethoxyphenol and iso-eugenol substrates decomposed clearly<br />
by pathways (R1) and (R2) analogous to guaiacol to yield methane, carbon monoxide,<br />
and the corresponding 1 iquid produs$, namely:<br />
-. v 'VI1<br />
where the substit:Ient R is either 6-methoxy or 4-propenyl. The dssociated kinetic<br />
results are sumar'zed in Table 2 which gives a matrix of first order rate constants,<br />
loglok (5- 1 1, obtained at 400C for each substrate decomposing by each prototype<br />
pathway. In Table 2, values of kl and k2 obtained for each of 2,6 dinethoxyphenol<br />
and iso-eugenol are close to the corresponding values for guaiacol. That is,<br />
the kinetics of both methane and carbon nonoxide formation from these two substituted<br />
guaiacols were very similar to those from guaiacol itself.<br />
Vanillin pyrolysis yielded CO and methane as the principal gaseous products,<br />
the former predominant. Among liquids, at low conversions, guaiacol and dihydroxybenzaldehyde<br />
were najor products, the former predominant, while at higher conversions<br />
catechol also arose, along with lesser amounts of phenol; at the highest conversions<br />
solid coke formed. At conversions of 0.02 < X < 0.20, the mol ratios of<br />
(CO/guaiacol) and (CHq/dihydroxybenzaldehyde) were each approximately unity; the<br />
latter pair of products were always less than the former at low conversions, with<br />
the ratio (CH4/CO)<br />
0.1- at T = 400C. These data suggest that vanilli n decom-<br />
posed by pathways o!?he type (R3) and (R1) earlier established for benzaldehyde<br />
and guaiacol :<br />
183
At high substrate conversions, the guaiacol and dihydroxybenzaldehyde products<br />
could further decompose by the same kinds of pathways to yield the catechol and<br />
phenol products observed. Kinetic data for vanillin pyrolysis at 400°C are summa-<br />
rized in Table 2. It is noteworthy that the rate constant k for vanillin far<br />
exceeded that for benzaldehyde while the rate constant k was essentially equal<br />
to that from guaiacol. Thus the rate of arylaldehyde deiarbonylation was markedly<br />
enhanced by the guaiacyl substituents while the rate of guaiacyl demethanation was<br />
virtually unaffected by the carbonyl substituent.<br />
Pyrolysis of t-clnnamaldehyde yielded CO as the major gaseous product, with<br />
much smaller amounts of hydrogen, methane, and acetylene also detected. A number<br />
of liquid products arose among which a dimeric condensation product, phenols, plus<br />
cresols, and styrene, were each appreciable, along with lesser amounts of toluene,<br />
benzene, other a1 kyl benzenes and biphenyl. Product pathways for this pyrolysis<br />
have not yet been fully established. tiowever it was significant that the mol ratio<br />
of (CO/styrene) products always approached unity at low substrate conversions and<br />
the kinetics of styrene appearance were essentially first order in substrate over<br />
a three-fold range of initial concentrations at 350°C. This allows tentative<br />
isolation of a pathway of type (R3) for CO formation from cinnamaldehyde:<br />
The first order rate constant k for cinnamaldehyde, shown in Table 2, was about<br />
three-fold greater than that fo8 benzaldehyde, suggesting that decarbonylation<br />
rates are enhanced by conjugation.<br />
(iii) Control Pyrolyses<br />
Anisole pyrolysis produced methane and carbon monoxide as the major gaseous<br />
products with hydrogen also present in appreciable amounts. The major liquid products<br />
were ortho-cresol , phenol, and benzene, with smaller amounts of toluene, xylenes,<br />
and xylenols also detected. At low substrate conversions, the product pro-<br />
portions were strongly influenced by reaction temperature.<br />
Thus at 400’C it was<br />
found that CH4:CO::1 .0:0.4 and o-creso1:phenol:benzene: :3:1 :O.l, whereas at 55OOC<br />
these ratios were CH4:CO: :1:1 and o-cresol :phenol :benzene: :0.6:1 :l. Among<br />
products, the ratios (methane/phenol) = 0.2 ? 0.1 and (CO/benzene) = 0.6 ? 0.2<br />
were roughly constant at substrate conversions 0.01 < x < 0.30 and T = 450OC.<br />
Anisole pyrolysis thus appears to involve at least three major pathways, namely,<br />
re-arrangement to o-cresol, formation of methane and phenol, and the formation<br />
of CO and benzene. Further experiments at T = 450°C and spanning initial substrate<br />
concentrations from 0.45 to 3.1 mo1/2 showed that the overall substrate disappear-<br />
ance, as well as the normalized phenol and benzene product appearances, were all<br />
essentially first order in anisole. This allowed association of a first order rate<br />
constant with the overall anisole disappearance, termed reaction (R4):<br />
(R4) @ k& all products<br />
184
where (R4) is, of course, a sum of the individual anisole decomposition pathways<br />
identified above but not as yet decisively delineated. Study of (R4) at various<br />
temperatures provided the values of k depicted in figure 3 (diaponds 1; the Corresponding<br />
Arrhenius parameters for ogerall anisole decomposition are<br />
(1oglOA(S-<br />
1 1, E*(kcal/mol)) = (12.12 0.8, 51.4 ? 2.4).<br />
The value<br />
of k for anisole at T = 400°C is also quoted in Table 2, for comparison with<br />
guai?col. From Figure 3 and Table 2 it is clear that the overall anisole decomposition<br />
by (R4) was typically at least an order of magnitude slower than guaiacol<br />
decomposition by (R1) in the present experiments. Exact comparisons between the<br />
kinetics of CH4 and CO formation from guaiacol and from anisole cannot yet be made<br />
but the data suggest that both gases form roughly a hundred times faster from<br />
the former substrate.<br />
Acetophenone pyrolysis led to carbon monoxide and methane as the major gaseous<br />
products with (CO/CH,) 2r 2; hydrogen was also present. Liquid product spectra<br />
were complex, benzene, toluene, xylenes and styrene being the major components,<br />
along with apparent dimers; additionally present were benzaldehyde, biphenyl,<br />
cresols, and aromatic ethers. No clear link has yet been established between gas<br />
and liquid products, precluding enunciation of possible pyrolysis pathways. The<br />
overall decomposition of acetophenone was found to be roughly first order in<br />
substrate at T = 550°C for initial concentrations from 0.14 to 1.4 mol/L. This<br />
allows use of a first order overall decomposition pathway of type (R4):<br />
I<br />
Experiments on acetophenone pyrolyses at various temperatures yielded the values of<br />
the rate constant k shown in Figure 4 (diamonds ); the corresponding Arrhenius<br />
parameters for over41 1 acetophenone decomposi tion are<br />
(loglOA(s-<br />
1<br />
), E*(kcal/mol)) = (10.3 ? 1.6, 50.7 ? 5.8). A value of k4 for acetophenone<br />
at 400°C is given in Table 2, for comparison with benzaldehyde. From<br />
Figure 4 and Table 2 it can be seen that overall acetophenone decomposition by<br />
(R4) is more than two orders of magnitude slower than benzaldehyde decomposition<br />
by (R3) in the present experiments.<br />
Discussion :<br />
Comparisons of the present results with previous literature is possible only<br />
in a few instances. Prior studies of guaiacol pyrolysis (8-10) provide no activation<br />
parameters but do give overall decomposition rate constants loglok(s-1) =<br />
-1.0 at 500C and -0 at 540C which are of the order of magnitude of our log Okl for<br />
guaiacol in that temperature range. An earlier study of benzaldehyde pyrolysis (16)<br />
yielded an overall decomposition rate constant loglOk(s-1) = -2.2 at 550C which<br />
agrees with our value of loglok 2.3 at 550C. Two prior anisole pyrolysis (E,7)<br />
at 500C yield overall decomposiiiin-rate constants loglok(s-l] = -1.8 and -1.9<br />
which compare favorably with our value of log10k4 = -2.5 at 490C.<br />
Also, an ani-<br />
sole pyrolysis (17) at 800C showed a product spectrum akin to ours but with the<br />
ratio of (CO/CH4) and (benzene/phenol) each -3, which accords with our observations<br />
showing these ratios to increase from -0.3 at 350C to -1.0 at 550C. In summary,pyrolysis<br />
data from the present study are in reasonable agreement with the<br />
available literature for guaiacol, benzaldehyde and anisole, lending credence to<br />
our experimental methods and hence to those results reported here for the first<br />
time.<br />
185
The kinetic data obtained invite mechanistic interpretations. First, in regard<br />
to methane formation, guaiacol and anisole offer striking contrasts. The former substrate<br />
produced methane at rates a hundred times faster than the latter; also, methane<br />
formation from guaiacol was stochiometrically linked with production of catechol<br />
whereas that from anisole was associated with appreciably less than stochiometric<br />
amounts of phenol; finally, the products from anisole pyrolysis included numerous<br />
methyl-benzenes and methyl-phenols, suggestive of radical methylation, whereas such<br />
products were absent from guaiacol pyrolyses. Thus the guaiacol evidently had access<br />
to a methane-forming pathway that was far more facile than the radical pathway likely<br />
responsible (11) for methane formation from anisole. A possible pericyclic reaction<br />
path accessible to guaiacol, but not to anisole, involves the concerted group transfewshown<br />
in (RO). Here the experimental activation parameters obtained for (Rl),<br />
which iras first order with (log A, E*) = (10.9, 43.7), are relevant. The value of<br />
log. A implies a tight transitih! state with activation entropy AS+= -12 cal/mol K;<br />
thiAOis close to the magnitude expected for the loss of two bond rotations that must<br />
accompany guaiacyl moiety alignment for concerted methane elimination. Further, the<br />
observed activation energy for (Rl) is close to the values of 45i3 kcal/mol that have<br />
been reported for isoelectronic group transfer eliminations of hydrogen and methane<br />
from various 1,4 cyclohexadienes (18). Finally, if (Rl) is indeed pericyclic like<br />
(RO), then its kinetics should be dominated by frontier orbital interactions between<br />
the methane and o-diquinone products. However, methane has a relatively large HOlQ-<br />
LUMO energy gap, while the diquinone, which is further conjugated, must have a small<br />
HOMO-LUNO separation. Thus the dominant frontier orbital energy differences, of the<br />
form HOPlO(methane)-LUMO(diquinone) ana v.v., should be relatively large and only<br />
little influenced by substituents on the diquinone. Experimentally, it was seen in<br />
Table 2 that the kinetics of methane formation from guaiacol were insensitive to substituents.<br />
Turning next to carbon monoxide formation, it was clear that benzaldehyde<br />
produced CO via (R3) far faster than acetophenone, which latter yielded a product<br />
spectrum suggestive of a radical decomposition. In regard to benzaldehyde, we suspect<br />
that the pathway (R3) might involve a non-linear cheletropic mechanism (15), with the<br />
concerted shift of hydrogen, as in the aldehyde, being more facile than that of<br />
methyl, as in the ketone. Although molecular mechanisms for CO release from benz-<br />
aldehyde have previously been mentioned (16,17), cheletropic extrusions specifically<br />
have not hitherto been proposed. In the present case, Arrhenius parameters for the<br />
first order forward reaction (R3), namely (log oA, E*) = (9.5, 41.5), can be combined<br />
with thermochemical data of (AH (kcal/mol),AS Icallmol K)) = (2.3, 25.5) to provide<br />
activation parameters for the bymolecular revgrse reaction, namely (log A (2/mol s),<br />
E*) = (5.7, 39.2). The reverse of cheletropic extrusion is, of course,'theletropic<br />
addition, which is well known (15,19) to possess tight transition states akin to<br />
cycloaddition. It is therefore interesting that the parameters inferred for the<br />
reverse of reaction (R3) yield an activation entropy ASt= -36 cal/mol K, of magnifude<br />
typically encountered in cycloadditions. Also, cheletropic decarbonylation reactions<br />
are reported in the literature (20) to exhibit great sensitivity to stereoelectronic<br />
factors and indeed the present kinetic data showed CO formation to be appreciably<br />
affected by modifications of the benzaldehyde structure to vanillin and cinnamalde-<br />
hyde. The foregoing arguments suggest that pericyclic group transfer elimination<br />
and chelctropic extrusion constitute plausible reaction mechanisms for methane and<br />
carbon monoxide formation respectively from guaiacol and benzaldehyde pyrolyses.<br />
Acknowledgement:<br />
This work was financially supported by the US DOE through seed funds distributed by<br />
the MIT Energy Laboratory.<br />
186
References :<br />
1.<br />
2.<br />
Wender, I., ACS Div. Fuel Chem. preprints, 20(4) 16(1975)<br />
Freudenherg, K. and Neish, A.C., Constitution and Biosynthesis of Lignin,<br />
Springer-Verlag, New York (1968)<br />
3. Allan, G.G. and Mattila, T., in Sarkanen, K.V. and Ludwig, C.H., ed.,<br />
Lignins Occurrence, Formation, Structure and Reactions, bliley Interscience,<br />
New York (,1971)<br />
4. Suuberg, E.M., Sc.D. Thesis, M.I.T., August 1977<br />
5. Solomon, P.R., ACS Div. Fuel Chem. preprints, 2331, 154-9(1979)<br />
6. Obolentsev, R.D., J. Gen. Chem. (U.S.S.R.) 16, 1959-70(1946)<br />
7. Friedlin, L.Kh; Balandin, A.A; :lazarova, N.M;<br />
Otdel Khim. Nauk ,no. 1, ,102-9(1949)<br />
Izvest. Akad. Nauk S.S.S.R.,<br />
8. Shaposhnikov, Yu. K.<br />
no. 3, 6-9 (1965)<br />
and Kosyukova, L.V., Khim. Pererabotka Drev., Ref. Inform.,<br />
9. Kravchenko, M.I.; Kiprianov, A.I.; Korotov, S. Ya; Nauch. Tr. Leningrad Lesotekh.<br />
Akad., 135(2)., 60-4(.1970)<br />
10. Kiprianov, A.I. and Kravchenko, M.I.,<br />
p121-5(1972)<br />
Izv. Vyssh. Ucheb. Zaved., Les Zh. 15(5),<br />
11. Kislitsyn, A.N.; Rodionova, Z.M.; Savinykh, V.I.; Ill'ina, E.I.; Abakhumov,<br />
G.A., Sb. Tr., T sent. Nauch - Issled. Prockt. Inst. Lesokhim. Prom., no.<br />
22, p4-16 (1971)<br />
12. Flaig, W., Chemistry of Humic Substances in Relation to Coalification, in<br />
Coal Science, Advances in Chemistry Series, ACS, Wash., D.C. (1966)<br />
13. van Krevelen, D.W., Coal, Elsevier, Amsterdam (1961)<br />
14. Hill, G. and Lyon, L., Ind. Eng. Chem., 53(6), 30-9(1962)<br />
15. Woodward, K.B. and Hoffmann, R., The Conservation of Orbital Symmetry, Verlag<br />
Chimie, Academic Press, Germany (1971)<br />
16. Smith, R.E.<br />
(1940)<br />
and Hinshlewood, C.N., Proc. Roy. SOC., (London)A, 175, 131-142<br />
17. Ingold, K.V. and Lossing, F.P., Can. J. of Chem., 31, 30-41(1953)<br />
18. Frey, H.M., and Walsh, R., Chem. Rev., 69 103(1969)<br />
19. Mock, W.L. in Pericyclic Reactiow Volume 11, A.P.<br />
Editors, Academic Press, NEW York (1977)<br />
Marchand and R.E. Lehr,<br />
20. Clarke,S.C. and Johnson,B.L., Tetrahedron, 2,3555-61(1971)<br />
187
Table 1. Experimental Grid<br />
Set Substrate Structure<br />
Guaiacol<br />
Benza 1 de hyde<br />
2,6 dime thoxy phenol<br />
Iso-eugenol<br />
Vani 1 1 i n<br />
t-C i nnara 1 de hyde<br />
Ani sol e<br />
Acetophenone<br />
Table 2. Sumnary of Kinetic Data at 400C<br />
Pathway:<br />
Set Substrate Rate Constant:<br />
1 Guaiacol<br />
2 Benzaldehyde<br />
3 2,6 dimethoxyphenol<br />
4 Isoeuoenol<br />
5 Vanillin<br />
6 t-Ci nnamaldehyde<br />
7 Anisole<br />
8 Acetophenone<br />
Reaction Conditions<br />
Purity Temperature Holding<br />
Range Times<br />
wt% c S<br />
99 250-525 110-6000<br />
99 300-500 120-3600<br />
99 300-500 120-1 800<br />
99 300-500 60-1 560<br />
99 300-500 120-1 500<br />
99 250-600 120-1 500<br />
98 344-550 180-1 500<br />
98 350-550 120-4980<br />
R1<br />
logioki<br />
-3.2<br />
-3.1<br />
-3.2<br />
-3.4<br />
R2<br />
10910k2<br />
-3.8<br />
-3.6<br />
-3.7<br />
Notes: See text for pathway definitions. All k in s-'.<br />
188<br />
R3<br />
Initial<br />
Concentration<br />
mol/l<br />
0.46-3.07<br />
0.16-3.3<br />
0.32<br />
0.33<br />
0.85<br />
log10k3<br />
-3.7<br />
-<br />
-<br />
-2.5<br />
-3.4<br />
-<br />
0.38-1.3<br />
0.46-3.07<br />
0.14-1.4<br />
R4<br />
log10k4<br />
-4.5<br />
-6.3
-1<br />
-3<br />
-4<br />
-1<br />
-a<br />
-4<br />
-0 5<br />
;O'T--<br />
' I<br />
c 0 04<br />
0 .Bi?<br />
0.00<br />
0 0<br />
J I I I<br />
0 s 10 15 ee I
190
<strong>THE</strong> ENERGY BALANCE <strong>OF</strong> SHORT-ROTATION COPPICE FORESTS:<br />
A PARTIAL ASSESSMENT FOR GEORGIA<br />
Klaus Steinbeck<br />
Associate Professor, School of Forest Resources,<br />
University of Georgia, Athens, Ga. 30602. USA<br />
Biological energy sources should be evaluated in terms of energy inputs<br />
needed to achieve various levels of biomass yields and energy outputs. Site preparation,<br />
seed or seedling production, and the establishment, cultivation, harvest,<br />
transport and conversion of the crop all necessitate energy expenditures. These<br />
inputs can include energy needed to manufacture the machinery and that needed to<br />
run it in the various production and utilization processes, produce fertilizers,<br />
and feed the labor force. They may also include environmental energy inputs like<br />
solar radiation, rain and wind energies. Outputs can be measured at several<br />
stages, such as before or after harvest, transportation, pretreatment (e.g.<br />
chipping, pelletizing, drying), or final conversion. Comprehensive energy balances<br />
for agricultural crops such as corn (Pimentel et al., 1973) and sugar cane<br />
(Hopkinson and Day, 1980) have been calculated, but relatively little is known<br />
about such balances for forest crops.<br />
All types of biomass share certain advantages and disadvantages as energy<br />
sources. Among the most important positive, long-term aspects are that they are<br />
renewable indefinitely, cause no net change in atmospheric carbon dioxide levels<br />
and contain relatively few pollutants. Biomass is versatile in that it can be con-<br />
verted into a variety of liquid or gaseous fuels or directly into heat.<br />
Dis-<br />
advantages of biomass include the removal of nutrients and organic matter from<br />
soils and high harvest and transport costs because the resource is generally<br />
scattered, bulky and high in moisture.<br />
Forest tree species offer several advantages as energy crops in comparison<br />
with agricultural crops or other herbaceous plants. The perennial nature of trees<br />
offers flexibility in harvest timing and the accumulation of large amounts of<br />
biomass in the field. Trees make low nutritional demands on soils and protect them<br />
from erosion with an organic litter layer. Broadleaved species sprout from the<br />
stump or root system, obviating the need for additional site preparation or planting<br />
once they are established and thereby reducing energy inputs needed for the<br />
second or subsequent rotations. Woody materials also are less subject to deterioration<br />
in post-harvest storage than are the more succulent, herbaceous ones.<br />
There are many different types of forest materials which can and do currently<br />
serve as alternate energy sources. They range from logging and mill residues to<br />
thinnings and stands which currently lack a market. The specific biomass production<br />
system for which I wish to develop energy input / output ratios are short-rotation<br />
coppice forests in Georgia. These consist of plantations of broadleave2 tree<br />
species which are planted much like an agricultural row crop.<br />
Seedlings in our<br />
current research outplantings are spaced in rows 2.4m apart and 1.2m apart within<br />
the rows. These seedlings are allowed to grow, generally with cultural help like<br />
fertilization and weed control, until they have fully captured the site. Then they<br />
are harvested mechanically and the rootstocks, which remained in the ground after<br />
the harvest, will sprout and automatically establish the next stand. These sprouts<br />
will grow more rapidly than a new planting would because they are supported by an<br />
established rootsystem, designed for a larger plant, which has access to soil water<br />
and nutrients. Such rootstocks also act as carbohydrate reservoirs so that the new<br />
stern and leaf tissues for the reemerging stand can be developed rapidly. Generally<br />
the new stand will fully occupy the site within the first or second growing season<br />
after harvest.<br />
191
For this preliminary assessment it will be necessary to combine energy inputs<br />
for a plantation established in 1978 (Steinbeck, 1979) with the energy outputs de-<br />
termined for a spacing, yield and rotation length experiment which was installed in<br />
1967 (Steinbeck and May, 1971). Both plantings, however, are in similar, rolling<br />
terrain in the Piedmont province of Georgia and in the main also on the same soil<br />
series.<br />
Literature Cited<br />
Hopkinson, C. S. and J. W. Day. 1980. Net energy analysis of alcohol production<br />
from sugar cane. Sci. 207: 302-304.<br />
Pimentel, D., L. E. Hurd, A. C. Belloitti, M. J. Forster, I. N. Ob, 0. D. Sholes,<br />
and R. J. Whitman. 1973. Food production and the energy crisis. Sci. 182:<br />
443-449.<br />
Steinbeck, K. 1979. Increasing the biomass production of short rotation coppice<br />
forests. In: 3rd Ann. Biomass Energy Systems Conf. Proc., SERI, 1536 Cole<br />
Blvd., Golden, Colo. 80401, 615 pp.<br />
Steinbeck, K. and J. T. May. 1971. Productivity of very young Platanus<br />
occidentalis L. plantings grown at various spacings. In: Forest Biomass<br />
Studies. Misc. Pub. 132, Life Sci. and Ag. Expt. Sta., Univ. of Maine, Orono,<br />
205 pp.<br />
192<br />
I
GRCXJTH, YIELD AND CaMPoSITIONAL cXARACI'ERISl'ICS <strong>OF</strong> JERUSALEM ARTICHOKE<br />
AS IT FEMES To BIOE'ASS PWDUCITON<br />
1/ 2/<br />
M. D. Stauffer- , B. B. Chube&/ and D. G. knell-<br />
1/ International Harvester Co., Advamed Harvesting Systems<br />
- Hillside, IL 60162<br />
- 2/ Agriculture Canada, Research Branch Research Station,<br />
Iforden, Manitoba, Canada ROG 1JO<br />
Jerusalem artichoke (Helianthus tuberosus L.) has sham excellent potential<br />
as a carbohydrate-rich crop. Cur initial investigations determined inulin and<br />
tuber yields; hawever, when additianal studies showed that good quality pulp<br />
r-ined after inulin extraction and high forage yields per hectare were obtainable,<br />
the scope of our investigation was broadened to assess utilization of the<br />
total plant. Plant growth, yield and ccmpositicmal characteristics of Jemsalem<br />
artichoke as they relate to bicmass production will be reported.<br />
P_ant description and characteristics<br />
Jerusalem artichoke is native to teerate I ort5 ).erica ad sdapted to the<br />
region circumscribed by the agricultxral region contiguous with the northern<br />
shore of the Great Lakes, the Red and Mississippi Rivers on the West as far South<br />
as Arkansas, eastward to the Piedmmt coastal plain of the Eastern seaboard,<br />
extending fran George north to @ebec. Although often referred to as wild sunflower,<br />
it differs frcm other native Helianthus species by proking perennial,<br />
fleshy tubers. Plants grm tall and upright, having either a branching or non-<br />
branching form of growth.<br />
Small yellow ray and disk florets borne at the end<br />
of min stem and branches m y produce small, hard seeds although seed production<br />
is often poor. Tuber shape, size and display vary frm round, knotty clusers to<br />
long, snooth single tubers.<br />
Growth begins frm tubers early in the season. PQturity is reached within<br />
100 to 130 days. Jerusalem artichoke's m a t e tolerance to spring and fall<br />
frosts extends its growiqg seasm beyond ttiat of convmtional field crops. This<br />
characteristic aids s m qe-iuer-tal lines in achievkg high tuber yields. Late<br />
amr ring zenotypes .do not mtmre.<br />
Pest and disease problans are few. Of the diseases, Sclerotinia wilt<br />
(Sclerotinia sclerotim) is the mst efficacious; hmever, rust, Septoria leaf<br />
spot ar.d downy mildew are potential problems. White mold and soft rot tuber<br />
diseases may occur in storage. Ulharvested tubers winter well in the soil and remin<br />
healthy until their r d in the spring. In all respects, Jerusalem artichdce<br />
is adaptable and remarkably resilient to m e which explains its high<br />
yield potential.<br />
Grcrwth functions<br />
Tne growth of plant tops and tubers are influenced by the flwring process.<br />
Considerable variation in tim of flowering occurs within the species, the earliest<br />
lines flaring in early July, and the latest at the end of Septder. when<br />
fl-r buds appeared, the rate of dry Fatter acdation in t5e aerial parts decreased<br />
(Fig. 1). Maximrm dry ratter (D-0 yields of plant tops were 12.2 T/ha and<br />
occurred after flaring. The subsequent loss of dry matter was, ia part, the<br />
result of leaf senescence and abscission.<br />
193
Tubers develop frcm stolons which enlarge with the onset of flmering (Fig. 1).<br />
The d e r of tubers increased m.til 50 percent flmering occurred and subsequently<br />
declined to approximately 25 tubers/plant. During that t*, the weight per<br />
tuber increased exponentially. It is hypothesized that translocation of material<br />
from saw tubers, as well as leaf senescence, contributes to increasing the rate<br />
of individual tuber dry matter acdation. Tuber yields were 283.5 g Wplant<br />
which is equivalent to 9450 kg lN/ha (42 T/ha fresh weight). Plant growth was<br />
terminated by killing frosts.<br />
Variability in forage yield and cornposition<br />
Forage ccmposition changes with advancing mturity (Table 1). Protein de-<br />
creased continually, but between week 6 and 7 there was a significant reduction.<br />
Conversely, the ADF and lignin fractions increased between w4cs 7 and 8. These<br />
changes were associated with cessation of flmering. Cellulose and ash contents<br />
ranained relatively constant throughout the sampling period.<br />
Considerable variation in dry matter yield and forage canposition exists<br />
anvxlg accessions (Table 2). High forage yielding lines generally were those which<br />
flowered late. All accessicms were harvested hen flowering began so the variability<br />
in IM cmtent was not influmced by stage of maturity. Rather, cp.I content<br />
appeared to be associated with prevailing climatic conditions at time of harvest.<br />
The lcw yielding line (NC10-50) is a leafy, relatively fine st-d accession<br />
having the highest protein and lmst ADF and lignin contents among all accessions<br />
evaluated. The greatest ammt of protein, ADF and lignin in the respective high<br />
accession was 1.8, 2.1 and 3.4 times that of the lmvalue accession. Based on<br />
the mgnitude of variability, it appears that forage canposition could be readily<br />
improved through plant breeding.<br />
Variability in tuber yield and ccmposition<br />
Total reducing sugar (TRS) content and fructose: glucose (F/G) ratios were<br />
used to estimate irniin content and its mlecular size. Actual inulin content and<br />
molecular size found in Jerusalem artichoke is not clearly understood, but research<br />
is currently underway at a western Canadian university to identify degree<br />
of polymerization and the changes which occur during tuberization and later during<br />
storage.<br />
Ontogenetic changes in carbohydrate content and composition were recorded in<br />
tm Jerusalem artichh accessions (Table 3). The native Manitoba accession had<br />
a higher average TRS content and a wider range of values over the sapling period<br />
than the higher yielding Russian occession. A trend toward lower reducing sugar<br />
content and percent fructose was evident in the native strain, xhereas ‘IRS content<br />
remined relatively constant in the Russian line.<br />
zhe duration and conditions of storage al&er carbohydrate and DPI content of<br />
the tubers (Table 4). Holding the tubers at 3 C and 75% relative humidity for<br />
eight wxks allawed safe dehydratim of the tubers and the greatest reducticn in<br />
‘IRS cmtent. Freezing the tubers caused a smll increase in M content, but the<br />
least rechctim in TRS of those storage treammts imposed.<br />
‘the variability in carbohydrate content among several selected accessions<br />
q e d from 13.2 to 27.7 percent when harvested late in the season (Table 5).<br />
Fructose: glucose ratios also differed, but no relatimship existed between high<br />
TR.5 yields and high FIG ratios. In another study to determine composition of the<br />
carbohykated-extracted pulp, significant variability was identified for IDF, AiY,<br />
acid-detergent 1.ig-h and eit! -act (Table 6). Keither protein zor digestible<br />
w g y varied greatly; however, the levels fmid indicates that the pulp bas good<br />
194
feeding value. Amino acid analysis revealed that lysine and methionine contents in<br />
the pdp are high (Table 7). Protein qudlity is considered to be very good.<br />
It is evident that considerable variability in yield and carbohydrate content<br />
exists within the species although accessions high in carbohydrate often prodme<br />
low yields. A SrrdLl breeding effort shmed interesting results. As sumrarized<br />
in table 8, high TRS lines crossed with intermediate carbohydrate-high yielding<br />
branching and non-branching lines (standards) produced significant rmses in percent<br />
TRS, fructose and protein. 'Ibis suggests that rapid progress could be mde<br />
when plant utilization is determined and plant breedjng objectives are established.<br />
Production requirerents<br />
Ihe highest Jerusalem artichoke yields of 75 tonnes/ha (34 T/ac) occurred in<br />
a year whm temperatures were belcw noml and precipitation above noml. Since<br />
tubers contain apprhtely 87.5 percent water, yield is highly dependent on soil<br />
water potential throughout the growing season and particularly durinp tuberization.<br />
Production requirerents for Jerusalem artichk are similar to potatoes. Generally,<br />
the requirerents are:<br />
- soils; sandy-loam, sandy clay loam<br />
- fertilizers (&/ha) ; N-90, P205 - 56, K20-50<br />
(or according to regid potato recamwdations)<br />
- weed control; inter-rcw cultivation<br />
- fungicide; (possibly)<br />
- pesticides; (none required to date)<br />
Estimated energy requirements for prcducinp the crop are derived using data<br />
by Southwell and Rothwell (1978). The data are presented in terns of energy resource<br />
depletim (ERD). Distinction is made between fossil fuel and total energy<br />
resomces consumd in producing the crop (Table 9). ERD is based on colorific<br />
values of fuel used (converted frm BTU's) tims the supply system efficiency<br />
factor (i.e., the actual plus energy absorbed in the supply system as losses or<br />
expendimres).<br />
Stating Jerusalem artichoke forage and tuber yields in term of alcohol<br />
production, each respective component Tydd yield 4580 and 2880 l/ha (Table 1:).<br />
The energy cutput of each is 1181 X 10 kcalh fran the tubers and 1176 X 10<br />
kcal/ha from the forage component.<br />
195
60<br />
20<br />
800<br />
600<br />
400<br />
200<br />
2 4 6 a 10 12<br />
I 1<br />
0<br />
TU3E.RS<br />
IJEIGHT/TUBI:R<br />
I . I . 1 ' '<br />
4 2 4 6 8 10 12<br />
Bud<br />
FIGURE 1 -- Flowering pattern and growth rates of<br />
tubers and plant tops sampled at weekly<br />
intervals beginning at the bud stage.<br />
10<br />
6<br />
12.5<br />
10.0<br />
3<br />
7.5 2<br />
v<br />
8<br />
6.0 5<br />
!4<br />
H<br />
sr<br />
2:5<br />
196
i<br />
t<br />
Table 1. h g e in composition and content of Jerusalem artichoke forage<br />
sampled at weekly intervals follming the flower bud stage of<br />
developrmt<br />
Plant Fraction Sanp1i.n~ Period (Ideeics)<br />
1" 2 3 4 5 6 7 8 9 10 11 12<br />
Protein (% 18.0 17.0 l5.0 14.3 U.5 12.5 9.7 9.7 7.9 6.2<br />
m (X W) 35.3 31.8 33.9 31.1 32.1 35.5 35.4 40.9 45.6 46.6<br />
Lignin (Z m) 6.21 6.0 7.2 6.1 6.3 6.9 6.7 7.8 9.4 8.9<br />
Cellulose (% 23.0 23.2 22.3 22.3 23.6 23.9 24.2 - -<br />
Ash (% W) 2.1 2.0 2.2 2.3 2.3 2.4 2.3 - -<br />
a Bud stage<br />
Table 2. Forage wntent of crude protein (e), acid-detergent fiber (ADF)<br />
lignin (Lig) content of selected Jerusalem artichoke accessions<br />
sampled at earLv 9-m-5 or prim to frost.<br />
Accession DM DM<br />
Yield Cm-tmt CP ADF Lig<br />
--------<br />
(t/ha) (%) % of Total DM ---------<br />
NC LO- 5 9.81 32 11.96 52.21 11.40<br />
8 31.78 28 13.85 45.76 8.48<br />
9 8.35 35 10.72 50.69 12.02<br />
13 14.67 38 15.95 42.16 12.77<br />
18 7.26 40 11.92 44.14 7.69<br />
44 22.97 22 9.54 34.37 7.10<br />
50 2.30 23 17.28 25.21 3.78<br />
60 26.04 31 13.21 40.25 7.21<br />
197
Table 3. The effect of harvest dates on the content and composition of<br />
reducing sugars in fresh tubers of two strains of Jerusalan<br />
artichoke.<br />
Harvest Reducing sugar Fructose Glucose FIG<br />
Strain date z % 9. racio<br />
Manitoba Sept. 28<br />
Oct. 12<br />
20<br />
26<br />
Nov. 2<br />
14<br />
23<br />
MEAN<br />
Russian Sept. 28<br />
Oct. 12<br />
20<br />
26<br />
Nov. 2<br />
14<br />
23<br />
MEAN<br />
21.5<br />
23.3<br />
21.8<br />
19.9<br />
22.7<br />
18.5<br />
16.5<br />
20.6<br />
14.5<br />
18.7<br />
16.8<br />
16.2<br />
19.9<br />
13.8<br />
18.4<br />
-<br />
16.9<br />
198<br />
87.6<br />
80.9<br />
81.8<br />
78.7<br />
74.3<br />
78.9<br />
76.0<br />
-<br />
79.7<br />
82.4<br />
78.7<br />
76.8<br />
74.9<br />
74.1<br />
79.2<br />
71.8<br />
-<br />
76.8<br />
9.1<br />
12.5<br />
12.0<br />
13.2<br />
16.1<br />
12.6<br />
13.6<br />
12.7<br />
11.2<br />
12.9<br />
14.4<br />
14.8<br />
14.6<br />
11.8<br />
14.9<br />
-<br />
13.5<br />
9.6<br />
6.5<br />
6.8<br />
6.0<br />
4.6<br />
6.3<br />
5.6<br />
6.5<br />
7.4<br />
6.1<br />
5.3<br />
5.1<br />
5.1<br />
6.7<br />
4.8<br />
-<br />
5.8
Table 4. Dry matter and total reducing sugar (TRS) content in Jerusalem<br />
artichoke tubers stored at different t-eratures and relative<br />
humidity levels.<br />
Storqe Time ami Conditicnls<br />
0 weeks 8 Weeks<br />
3OCI954RH 3OCI 75%RH -40~~/.~ient RH<br />
Dry Matter (%) 25.8 25.5 28.2 26.5<br />
TRS (4: of DM) 78.4 66.7 62.9 72.5<br />
Table 5. Cantent and camposition of reducing sugars in fresh tubers of<br />
six strains of Jerusalan artichoke harvested on October 23,<br />
1972.<br />
Strain Reducing sugar Fructose Glucose FIG<br />
% 4: % ratio<br />
27.7 75.3 14.9 5.1<br />
20.7 74.7 l5.1 4.9<br />
17.1 78.2 13.4 5.8<br />
18.6 71.0 16.1 4.4<br />
17.3 75.2 16.0 4.7<br />
L3.2 80.6 12.3 6.6<br />
199
Accessim Digestible<br />
==gY<br />
M&lFg (W<br />
brden 15 3.509 26.9 47.8 34.4 1.43 3.9<br />
Perron 3.551 26.7 45.1 42.8 2.62 2.9<br />
Branching 3.603 25.6 47.6 38.1 0.92 3.3<br />
Non-Branching 3.563 25.4 50.4 38.1 0.60 3.2<br />
'fable 7. Amino acid analysis of inulin-extracted hialen aztichok pulp.<br />
Amino Content<br />
Acid (al1OOg<br />
Sample N)<br />
Lys . 48.98<br />
His. 13. oa<br />
NH3<br />
12.67<br />
Arg. 31.70<br />
Asp. 59.52<br />
Thr 33.36<br />
kisture<br />
5.9%<br />
A 2 0 Content<br />
Acid fg/lOOg<br />
Sauple N)<br />
Ser . 30.42<br />
Glut. 71.43<br />
pro. 21. a3<br />
GlY 32.01<br />
Ala 35.44<br />
Vi1 38.31<br />
Protein (D.B., N X 5.7) 16.16%<br />
Recovery. 86.9%<br />
Meth. 11.79<br />
I so 30.80<br />
LeU 46.45<br />
Tyr. 22.37<br />
Phe 28.63
Table 8. %ri&ility in percent total reducing sqar ('IT!), fructose (F) and<br />
protein amme Jerusalem atichoke dvmced selection ar,d new crosses<br />
compared to standar+ branchiii and non-branckk~ types.<br />
A&. selections 21<br />
No. of or RarWe (%)<br />
Comparisons TRS F Prot .<br />
17.4-22.4 68.0-80.4 23.1-27.0<br />
New crosses 41 10.66-22.8 65.9-80.1 21.0-30.3<br />
Branching (standard) 21.2 75.3 25.6<br />
Nm-branching (standard) 20.3 75.5 25.4<br />
201
Table 9. Energy requirments in term of energy resource depletion<br />
(EPD) of fossil fuel (FF) and total (T) to produce 1<br />
hectare of Jerusalan artichoke*<br />
Energy inputslha<br />
(Xllivatim<br />
Planting<br />
Fertilizer*<br />
Inter-row cultivation (2)<br />
Fungicide<br />
Sprout irhibitim<br />
Harvesting - tops *<br />
- tubers<br />
Ibuling to storage<br />
Total<br />
81<br />
171<br />
2327<br />
145<br />
184<br />
148<br />
311<br />
767<br />
878<br />
5012<br />
* Potato production energy requiranents by category according to<br />
Southwell, P. H. and T. M. Rothwell.<br />
* Fertilizer rates &/ha) in Manitoba: N - 90; P2)5 - 56; 3) - 50.<br />
* Assumes values similar to corn silage.<br />
202<br />
83<br />
174<br />
2402<br />
146<br />
193<br />
160<br />
317<br />
780<br />
878<br />
5u3
Table 10. Theoretical yields of ethyl alcohol from several crops<br />
(-Manitoba yield basis)<br />
Crop<br />
Plant<br />
Part<br />
Yield !YXH<br />
Fresh wt. Carbohydrate l/ha<br />
------- -- k,/ha _-_-----_<br />
J. artichoke Tuber 42000 7088 4580<br />
Sugar beet Root 33600 4930 3185<br />
Corn Grain 6700 4150 2680<br />
wheat Grain 3360 2240 1447<br />
203
<strong>IN</strong>TRODUCTION<br />
Carbon and Light Limitation in Mass Algal Culture<br />
D. E. Brune<br />
Department of Agricultural Engineering<br />
University of California, Davis 95616<br />
A variety of potential applications for mass algal culture are often proposed. The<br />
suggested uses for algal biomass include use as fertilizers, raw material for extracted<br />
commercial chemicals, animal or human protein supplements either directly, or<br />
indirectly through incorporation into aquaculture systems, as well as energy via conversion<br />
to methane gas (1). In spite of the apparent potential usefulness of algal<br />
biomass and years of research centered around understanding algal growth in both laboratory<br />
and field culture, mass algal culture has not yet been commercially realized<br />
to any large extent.<br />
The primary reason for this lack of success lies in the complexity of the process of<br />
large scale algal culture. Attempts at modelling the species' specific responses of<br />
algal culture has been attempted with varying degrees of success (2-6). The contin-<br />
ued development of such models will likely be the only successful means of answering<br />
the many questions concerning optimum design and operation of future algae culture.<br />
Most mathematical models describing algal growth revolve around three central submodels.<br />
These sub-models attempt to define the growth of a particular alga as a function<br />
of the important environment parameters; nutrient concentration, light levels and<br />
temperature. These models attempt to simulate the response of algal cell production<br />
as a function of these three factors. Although simple in concept, because of the<br />
many possible limiting nutrients, multitudes of possible dominating algal species, combined<br />
with interaction between the three central variables, the resultant models become<br />
extremely detailed and complex. However, in the situation of high density algae<br />
culture, it is often the case that two factors, in particular, become most important<br />
in controlling production.<br />
The supply of inorganic carbon at a sufficient rate and<br />
concentration to meet algal carbon uptake rates and the availability of sufficient<br />
light intensity to supply the energy needs of the growing culture, are often suggest-<br />
ed as controlling net cell productivities (1,7,11).<br />
For these reasons, attention has been directed at understanding more fully the situa-<br />
tion of light and inorganic carbon limitation of algal growth. It is the purpose of<br />
this discussion to examine the nature of the carbon limited response of algae and to<br />
combine a quantitative model of this behavior with models describing the carbonate<br />
equilibrium chemistry and flow-through algal culture. These relationships will be<br />
examined under both non-light and light limiting conditions.<br />
PREDICT<strong>IN</strong>G <strong>THE</strong> RESPONSE <strong>OF</strong> A CARBON LIMITED CONT<strong>IN</strong>UOUS ALGAL CULTURE<br />
I. Algal Response to C0zf<br />
Over the years considerable controversy has developed over the interpretations of<br />
data concerning the uptake of the various forms of inorganic carbon by unicellular<br />
algae (4,7,8,9,10,12). Early investigators felt that most algae were capable of using<br />
either dissolved carbon dioxide (COz ) or bicarbonate (HCq) as a carbon source.<br />
f<br />
The basis for the belief in HC<strong>OF</strong> uptake was centered on observations of algal culture<br />
growth to pH values as high as 11.0. Since in vitro studies on the Ksco2 of the<br />
--<br />
enzyme Ribulose diphosphate carboxydismutase yielded values as high as<br />
liter, it was felt that the C02 concentrations in high pH cultures<br />
204<br />
moles/<br />
- lo-* m/l)
was Simply too low to supply to carbon needs of the growing culture (9).<br />
I Goldman (12) on the other hand suggested that the interconversion of one carbon form<br />
to another was much more rapid than was the carbon uptake rate of a growing algal culture.<br />
This led him to conclude that carbon limited response of an algal culture may<br />
best be represented as a Monod model of the specific growth rate vs. the total carbon<br />
concentration (CT). He further suggests that this relationship must be modified by<br />
effects of culture pH.<br />
Recent work by Brune (15) has, however, led to the continued development of yet another<br />
model first proposed by King (7). The basis for this model exists in an array of<br />
experiments in which the batch growth of laboratory cultures of various freshwater algae<br />
were studied. The typical behavior of these cultures is illustrated in Figures<br />
1-5. It was found that for these cultures growing over a wide range of pH (7-11) the<br />
carbon limited growth response could best be modelled as a Monod fit of II vs. COzf<br />
(Figure 1). In contrast to this, fits of p to HCO; (Figure 2) or p to CT (Figure 3)<br />
yielded plots atypical of what is considered normal microbial response to limiting<br />
nutrient levels.<br />
In an attempt to quantify any effects from varying culture pH on this relationship,<br />
several cultures were grown in which the initial culture alkalinity was varied. The<br />
net result of this modification was the observation of p at similar COzf concentrations<br />
but at differing pH values. A sample of the data (Figure 4) did indicate an<br />
effect, which was first interpreted as a suppression of growth rate by increased culture<br />
pH. However, attempts to relate p to pH did not prove particularly successful.<br />
On the other hand, a strong correlation was discovered between the Ksco2 of the algal<br />
response and the ionic strength of the growth medium. It was later discovered that<br />
this effect could be reproduced independently of pH by increasing the ionic strength<br />
of the growth medium with additions of NaCl (Figure 5).<br />
Thus, to date, the simplest model capable of simulating the carbon limited algal response<br />
over the widest possible combinations of environmental conditions appears to<br />
be a Monod fit of p vs. COzf modified by increasing Ksco2 with increasing culture<br />
ionic strength. For the algae examined thus far, culture pH over a wide range appears<br />
to have little, if any, effect on this relationship.<br />
The importance of this model is realized when this biological response is combined<br />
with equations describing the carbonate equilibrium chemistry to produce a powerful<br />
predictive model of algal culture behavior.<br />
11. Combininz the Biological, Physical and Chemical Responses<br />
Given that the specific growth rate (p) of a carbon limited algal culture can be de-<br />
fined as:<br />
In addition in a continuous flow algal culture, an algal cell mass balance gives (12);<br />
- :t = DX1 - DX2 + pX2 - K<br />
d<br />
X<br />
2<br />
At steady state (dx/dt = 0) and in the case of a rapidly growing culture with the<br />
decay rate (Kd) taken as zero, and with the influent cell concentration (XI) also zero,<br />
this equation reduces to:<br />
= D = i/e 3)<br />
205
Therefore, the above relationship suggests that once the dilution rate (D) of a con-<br />
tinuous algal culture is fixed and steady state is achieved, the specific growth rate<br />
is also fixed. The COzf concentration of the effluent can then be obtained from the<br />
combination of equations 1 and 3;<br />
[CO 1 =<br />
KSC02<br />
-- 'max<br />
D 1<br />
If the buffering caFacity of the culture media is dominated by the C02-carbonate-bi-<br />
carbonate system and if the influent pH and total titratable alkalinity are known,<br />
then the cell concentration and pH of the effluent can be obtained by combining equa-<br />
tion 4 with the carbonate equilibrium equations given by Stumm;<br />
algal<br />
biomass = 'A = 'T1<br />
-c<br />
T2<br />
- [AlK] + [H+] - [OH-]<br />
a .+ 2a<br />
where: cT1 1 2<br />
The C concentration (effluent) is determined by p max, D and KSCO and is given by:<br />
T2 2<br />
Since alkalinity is unaffected by algal growth (except for minor modification; see<br />
Brewer 14) and is known, and since [C02l2 isdetermined by D, umax and Ks,-02 and are<br />
also known, the effluent culture pH can be obtained. The solution is in the form of<br />
a 4th order equation and given by Ricci (17). The predicted culture pH for a hypothetical<br />
algae (a composite of pooled data) with a pmax of 0.10 hr-l and Ks~o~ranging<br />
from 0.17 x 10⁻⁶ m/l to 8.1 x 10⁻⁶ m/l (depending on ionic strength) is given in Figure 7.<br />
As can be seen, the tendency toward higher culture pH as a result of increasing alkalinity<br />
is eventually overpowered by the decreasing ability of the algae to extract C02<br />
to low levels at the increased ionic strength due to higher alkalinity levels. The<br />
net result; at high alkalinity, continuous cultures will stabilize at lower pH values<br />
at a given detention time. Support for the theoretical model has been obtained in the<br />
form of data from actual continuous cultures of the alga Scenedesmus quadricauda. As<br />
can be seen (Figure 6) the form of the curve is as predicted.<br />
The important implications of this model are summarized in Figures 8 and 9. If culture<br />
pH is allowed to drift without control, a large percentage of total carbon in the influent<br />
medium will not be utilized. At the detention time giving optimum production<br />
(Figure 8) the carbon utilization will range from only 10 to 30% depending on culture<br />
alkalinity. Therefore, attempts to increase carbon supply by alkalinity addition alone<br />
(as NaHC03) will not provide for efficient utilization of inorganic carbon. PH control<br />
through acid addition would markedly improve tlre situation; however, the costs of continuous<br />
acid addition combined with dangers of instability produced by destroying the<br />
206<br />
4)
culture buffering capacity do not favor this technique.<br />
Apparently the only effective means of maintaining carbon supply through pH control<br />
will be through C02 addition. Unfortunately, the low C02 content of air makes aeration<br />
a very energy intensive means of C02 transfer. An alternative method which has<br />
been utilized for years in sewage treatment lagoons is the supply of C02 from bacterial<br />
degradation of waste organics. However, nothing comes free and so it is in this<br />
case; the price being the loss of algal productivity by shading of light from the added<br />
bacterial biomass.<br />
LIGHT LIMITED ALGAL CULTURE<br />
Once the carbon limitation of the algal culture is removed, the culture will respond<br />
by increasing cell density until another factor finally limits cell production. In<br />
many cases this factor will be the availability of light. Pipes (18) demonstrated<br />
that net algal cell production in a light limited culture is independent of culture<br />
detention time. Thus the algal cell density (X) is a linear function of detention<br />
time (e);<br />
Smith (19) showed that the overall productivity (P) could be related to the biologi-<br />
cal response of the alga to limiting light and the incipient light levels by the equa-<br />
tion;<br />
Using the integrated form of this equation given by Groden (20), with values of the<br />
extinction coefficient of algal biomass from Lehman (3) (E = 1.2 x 10⁻⁷ l/cell-m)<br />
the response of the cell density of a shallow light limited culture of an alga with<br />
Pmax = 0.10 hr-1, Io= 5000 fc, to increasing detention time is given in Figure 10<br />
(computer generated solutions to equation IO).<br />
As seen in this figure, cell density<br />
responses linearly to hydraulic detention time as predicted by the earlier equation<br />
from Pipes. The ideal behavior illustrated in this figure will be modified by many<br />
factors; of prime importance will be the additional light shading by the added bacterial<br />
biomass and the effects of bacterial CO production. The bacterial biomass<br />
present may be predicted from equations descri2ing the decay of influent BOD;<br />
where BOD E = BODI 11)<br />
The bacteria biomass may be predicted from equations given by Lawrence and McCarty<br />
(16) ;<br />
(BODI - BODE)<br />
x = Y<br />
B B i + ~ ~ e<br />
and the rate of supply of C02 from the bacterial decomposition of the incoming BOD:<br />
Using these equations Figure 10 is modified to account for added bacterial biomass<br />
and CO production and the resultant modifications are presented in Figures 12 and<br />
2<br />
207
13. Assuming a strong waste influent with a BOD of 500 mg/l, a yield coefficient<br />
Y = 0.55, decay rate b = 0.55, C1 = 0.018 milli-moles COg/mg BOD oxidized and a coefficient<br />
of extinction of light from the bacterial biomass the same as for the algal<br />
biomass, the effects of the added bacterial biomass are illustrated in Figure 1;.<br />
Perhaps the most important result of this effect can be seen as the requirement for<br />
longer and longer detention time at increasing depth to achieve a stable algal cell<br />
population. This effect is due solely to the slower algal growth rate as a result<br />
of lowered average light levels per unit of algal biomass.<br />
The final upper limit on cell biomass will again come through carbon limitation and<br />
this added effect is combined with the shading effect to produce Figures 11 and 13.<br />
These figures illustrate these combined effects on culture pH and algal cell biomass.<br />
When bacterial CO2 production exceeds algal CO2 fixation the effect will be to drive<br />
the pH below the atmospheric equilibrium pH. The lowest level that pH will fall to<br />
will depend on the rate at which Cog transports across the water surface and exits<br />
from the culture. At a steady state pH;<br />
d C02<br />
--<br />
dt<br />
net<br />
CO2<br />
- production = KLa (c02s - “2)<br />
On the other hand, if algal CO2 uptake exceeds bacterial CO2 production, the culture<br />
pH will rise according to the carbonate equilibrium chemistry and carbon uptake be-<br />
havior of the algae as detailed in equation 8. Unfortunately, because of low atmos-<br />
pheric CO2 levels, CO2 input (unless aggressively supplied) from surface transport<br />
will not usually create a significant pH stabilizing effect as will C02 transport out<br />
of the solution. The total algal cell biomass will respond by increasing in density<br />
with increasing detention time until, as a result of the pH rise, the CO2f concentra-<br />
tion again limits cell production. The effect of either increasing culture depth or<br />
increased influent BOD levels will both delay the onset of carbon limitation and in-<br />
crease the detention time for a stable algal biomass population.<br />
LIGHT AND C02 MODELS AS A PREDICTIVE TOOL<br />
The model presented here considers only the case of carbon and light limited growth<br />
of algal culture. It is, of course, an over-simplification of complex algal-bacter-<br />
ial culture; rather,this model is viewed as a starting point for a more comprehensive<br />
model which will be developed to include the important modifiers of the relationships<br />
presented here. Of particular importance will be additions to the chemical model to<br />
account for various non-carbonate buffers such as ammonia, phosphates, borates, etc.<br />
Field determination of the many empirical constants must be made, as well as an as-<br />
sessment of the validity of applying the laboratory derived kinetic data to field<br />
situations.<br />
Although the model may be simplistic in nature, the power of a simple carbon and<br />
light limitation model in predicting, in general, responses of field algal culture<br />
should not be dismissed. Observations of algal cell production from a recent pilot<br />
study (21) indicate that the theoretical behavior describes reasonably well the actual<br />
culture responses (Figure 14). Although complicated by changing influent BOD load-<br />
ing rates used in this study, the observations of cell density compare well with pre-<br />
dicted light and carbon limited values. The culture pH, which was observed to rise<br />
to 10 in shallow cultures, and level off at 8.0-9.0 in deeper cultures, while drop-<br />
pingto7.6 in the bacterial cultures, behaves as predicted by the C0zf limitation<br />
model. A simple yet often unappreciated corollary of the carbon model suggests<br />
that whenever culture pH rises above the atmospheric equilibrium value, external car-<br />
bon is not being supplied at a rate fast enough to meet the algal carbon fixationrate,<br />
thus the culture obtains the needed carbon by extracting it from the carbonate system.<br />
Unless this situation is carefully controlled, the pH may stabilize at values which<br />
yield C0zf concentrations that will limit algal grow rates.<br />
208
An attempt has been made to quantitatively show the importance of COff concentration<br />
in controlling algal cell production. One promising method of CO2f - pH control is<br />
j through careful section of detention time, influent BOD,<br />
gal-bacterial culture.<br />
and depth of a combined al-<br />
Even though bacterial decomposition of organics to C02, followed by C02 fixation by<br />
algae, does not represent a net organic carbon fixation, it can be used to obtain a<br />
net energy fixation. This may be particularly applicable to the situation in which<br />
algal biomass is converted to methane gas via anaerobic digestion. The resulting C02<br />
from gas combustion and the low energy short chain organics in the digester effluent<br />
represent a recyclable carbon supply to be returned to the algal ponds. In this situation<br />
the importance of proper balancing of algal C02 uptake against bacterial C02<br />
production cannot be over-emphasized. An imbalance in either direction will result<br />
in a loss of efficiency in carbon utilization.<br />
Proper selection of the control param-<br />
eters will likely come through continued development and refinement of models such as<br />
presented here.<br />
SUMMARY<br />
Thecarbonlimitedkineticresponsesofvarious fast growin galgal specieshavebeen summarized.<br />
These results suggest that the growth responses of many algae used in mass<br />
culture may best be represented as a Monod fit the specific growth rate (p) to the<br />
free carbon dioxide concentration (C0zf). The environmental modifiers of primary<br />
importance appear to be light levels, temperature and the ionic strength of the growth<br />
media.<br />
The various mathematical models describing the algal biological response to limiting<br />
COzf concentration, the carbonate equilibrium chemistry and the physical configura-<br />
tion of a flow-through microbial culture are combined to yield equations which pre-<br />
dict the pH, total carbon concentration (CT) and algal cell concentration of a con-<br />
tinuous algal culture, given a pmax and Ksco2 for the alga of interest. This model<br />
is further used to illustrate the under-utilization of inorganic carbon in mass algal<br />
cultures in which the pH is uncontrolled.<br />
One method of pH control in such cultures involves the utilization of CO2 supply from<br />
bacterial degradation of waste organics in the influent culture medium. In such a<br />
situation both the culture pH and algal cell production will often be governed by<br />
either carbon or light limitation depending primarily on the influent BOD loading, detention<br />
time and culture depth. An example is given in which the light dependent<br />
response of a particular alga is combined with equations describing the bacterial<br />
cell and C02 production as a function of influent BOD. The resultant calculations<br />
are used to explain why algal populations in combined algal-bacterial culture are<br />
often observed to be unstable at detention times considerably longer than theoretical<br />
minimum detention time based on laboratory culture data. The effect of increasing<br />
culture depth is shown to amplify this effect.<br />
In spite of the obvious over-simplification of considering only light and carbon<br />
limits in describing the behavior of mass algal culture, comparisons to actual field<br />
data suggest that these two parameters will be of paramount importance in controlling<br />
net algal cell production rates.<br />
NOMENCLATURE<br />
BOD = Influent BOD<br />
BOD' = Effluent BOD:<br />
E<br />
209<br />
P, = Light saturated photosynthetic rate<br />
P = Average photosynthetic rate
C02f = Free carbon dioxide concentration<br />
[C02J2 = Effluent CO<br />
2f<br />
= Influent total carbon concentracT1<br />
t ion<br />
CT~ = Effluent total carbon concentration<br />
[C02]s = Atmospheric equilibrium COzf<br />
concentration<br />
C1 = Moles C02 produced per mg BOD5<br />
oxidized<br />
D = Dilution rate<br />
I = Effective light level<br />
k = BOD decay coefficient<br />
Kb = Bacterial decay coefficient<br />
Kd = Algal decay coefficient<br />
K = Overall algal productivity<br />
(from Pipes, 18)<br />
K L = ~ CO2 transfer coefficient<br />
KSCO~ = COZf concentration at which<br />
N = 112 umax<br />
REFERENCES<br />
t = Time<br />
V = Reactor volume<br />
X1 = Influent algal cell concentration<br />
X2 = Effluent algal cell concentration<br />
XA = Algal cell concentration<br />
XB = Bacterial cell concentration<br />
YB = Bacterial yield coefficient<br />
a = Slope of photosynthetic rate vs.<br />
light intensity curve<br />
a. = C0zf fraction of CT<br />
a, = HCQ; fraction of CT<br />
a2 = CO- fraction of CT<br />
3<br />
u = Specific growth rate<br />
pmax = Maximum specific growth rate<br />
0 = Hydraulic detention time = 1/D<br />
Goldman, J. C. Water Research 13:l-19, 1979a.<br />
Lehman, J. T., Botkin, D. B., and Likens, G.E. Verh. Internat. Verein. Limnol.<br />
19:300-307, 1975.<br />
Lehman, J. T., Botkin, D. B., and Likens, G. E. Limn. and Ocean 29:343-364, 1975.<br />
Lehman, J. T. J. Physol. 14:33-42, 1978.<br />
Toerien, D. F., and Huang, C. H. Water Research 17:1673-1681, 1973.<br />
Modeling the Eutrophication Process, Proceeding of a Workshop at St. Petersburg,<br />
Florida, 1969. National Technical Information Service, No. PB-217-383.<br />
King, D. L. JWPCF 42:2035-2051, 1970.<br />
King, D. L., and Novak, J. T. JWPCF 48:1812-1815, 1974.<br />
Steemann, Nielsen, E., and Jensen, P. K. Physiol. Plant 11:170-180, 1958.<br />
Osterlind, S. Physiol. 4:242-254, 1951.<br />
King, K. L. p. 98-105, Nutrients and Eutrophication, Amer. SOC. Limnol.<br />
Oceanography Spec. Symp.<br />
Goldman, J. C., Oswald, W. J., and Jenkins, D. San. Eng. Lab Rept. No. 72-11,<br />
Univ. of Calif., Berkeley, 1972.<br />
Stumm, W., and Morgan, J. J. A uatic Chemistr . John Wiley 6 Sons, Inc., 1970.<br />
Brewer, P. G., and Goldman, J . b m n . and 0;ean 21:108, 1976.<br />
Brune, D. E. "The Growth Kinetics of Freshwater Algae." Ph. D. dissertation,<br />
Univ. of Missouri-Columbia, 1978.<br />
Lawrence, A. W., and McCarty, P. L. JSED, ASCE, 96:757-778, 1970.<br />
Ricci, J. E. Hydrogen Ion Concentration. Princeton Univ. Press, Princeton,NJ<br />
1952.<br />
Pipes, W. 0. Appl. Microbiol. 1O:l-5, 1962.<br />
Smith, E. L. National Acad. of Sciences Proceeding 22:504-511, 1936.<br />
Groden, T. W.<br />
____<br />
Report to Center for Ecological Modeling, Renssalaer Polytechnic<br />
Inst.. Troy, NY 1977.<br />
Boersma, L. L., Gasper, E ., Miner, J . R., Oldfield, J. E., Phinney, H. K., and<br />
Cheeke, P. R., Management of Swine Manure for the Recovery of Protein and Bio-<br />
5. Final Report to the National Science Foundation, 1978.<br />
21 0
OO 1<br />
,005 ,010 ,015 .I<br />
0<br />
AVE. COP (mm/l)<br />
Fieure - 1: 95% confidence intervals around a Monod fit of u vs.<br />
CO2f for Chlorella vulgaris grown at 15OC and saturated<br />
light levels.<br />
.06<br />
.04<br />
I<br />
-<br />
L<br />
c<br />
-<br />
3.<br />
.02<br />
-<br />
L - r<br />
- Scencdesmur quadricaudo<br />
0- 600 foot- condles<br />
-<br />
-<br />
0<br />
0<br />
e-420 foot-condlee 0 o o<br />
0 0<br />
O n<br />
.06 - Scenedermua quodricoudo .'<br />
.04<br />
3. .02<br />
S- 600fOot-Condlr8<br />
- 0- 420fOOt- candle8<br />
-<br />
-<br />
0<br />
0<br />
0 0<br />
,001 I I I I<br />
0.05 0.10 0.15 0 .,i<br />
AVE. HCO;(mm/l)<br />
Figure 2. HC03 concentration vs. u for batch cultures of<br />
Scenedesmus quadricauda grown at 27OC and two<br />
light levels.<br />
.oo P<br />
0.5 1.0 1.s 2 .o<br />
AVE. CT (mm/l)<br />
Fieure 3. CT concentration vs. u for batch cultures of<br />
I<br />
Scenedesmus quadricauda grown at 27OC and two<br />
light levels.<br />
21 1
-__<br />
A- I meq 0.102 0. 167<br />
0- 2 meu 0. I04 3.323<br />
o-3meq 0.106 0.562<br />
I I I I I<br />
0 0.5 I .o I .5 2 .o 2.5<br />
AVE. COP (micro-molerlliter)<br />
Figure 4. p vs. COzf for batch cultures of Chlorella vulgaris grown<br />
in a medium of varying initial alkalinity.<br />
c<br />
n<br />
0<br />
X<br />
Y<br />
I<br />
c<br />
-<br />
Figure 5.<br />
0 0 1 2 3 4 5 6 7 8<br />
In(K~ C O ~ mm/l x 106)<br />
Observed relationship between Ks,-02 and the culture ionic<br />
strength for Chlorella salina.<br />
9.0<br />
8.0<br />
(r<br />
Scenedesmus quadricoudo<br />
chemostot pH response<br />
7 . 0 0 " 1 1 ' 1 1 f l 1* 1 1 1 1 1<br />
5 IO 15<br />
DETENTION TIME (days)<br />
Figure 6. Continuous culture pH response of Scenedesmus quadricauda<br />
with influent alkalinity of 2.5 nleq/liter.<br />
21 2
Figure 7.<br />
,O.OC<br />
OLIEWT~ON TIYE inns1<br />
Theoretical pH response of continuous algal CUI ture at<br />
varying influent alkalinity.<br />
1.0-<br />
4.0<br />
: 3.0-<br />
0<br />
L<br />
: 2.0-<br />
I .o<br />
-<br />
-<br />
-<br />
I I I t I I<br />
20 40 60 70 80 100<br />
OLTLNTION TIME1 HRSI<br />
Figure 9. Percent of total carbon in influent medium converted to algal bio-<br />
mass in a carbon-limited continuous culture.<br />
21 3
Figure In. Theoretical algal cell biomass vs. detention time in a ight<br />
limited continuous culture.<br />
7.0<br />
I I I I I I 1<br />
)I 10 75 100 I25 150 175<br />
OLTCNIIOW liui 111111<br />
Figure 11. Prediction of culture pH based on algal response to COzf and batter-<br />
ial CO production with influent BOD5 = 500 mg/9..<br />
2<br />
Figure 12. Effect of bacterial biomass production from BOD degradation on<br />
algal biomass density.
BOO5 * 500 mqfl<br />
AIK =5meq/L<br />
1 I<br />
25 50 75 100 125 150 175<br />
DETENTION TIME ( HRSI<br />
Figure 13. Combined effects of carbon limitation and bacterial biomass shading<br />
on algal biomass at different culture depths.<br />
lOOOr<br />
0<br />
700<br />
600<br />
400<br />
300<br />
300r I<br />
I 1 1 J<br />
I I<br />
25 50 75 100 125 I50<br />
25 50 75 IO0 125 I50<br />
OETENTION TIME (HRSI<br />
Figure 14. Data from pilot scale algal-bacterial culture (from Boersma, et al.),<br />
Total and algal biomass at culturedepths of 7.5, 15 and 20 cm.<br />
21 5<br />
7.5
Plants as a Source of High Energy Liquid Fuels<br />
E. K. Nemethy, J. W. Otvos, and M. Calvin<br />
Laboratory of Chemical Biodynamics, Lawrence Berkeley Laboratory,<br />
University of California, Berkeley, California 94720<br />
The growing of green plants has received much discussion as a renewable<br />
energy source (1). Two distinct approaches are possible for energy farms.<br />
Either whole plants can be harvested as in a biomass plantation, or plants<br />
capable of producing reduced photosynthetic materials can be cultivated.<br />
In the<br />
latter case, the net product is a derivative of the total biomass, and the<br />
process would be unlike many other biomass systems where the whole plant is<br />
burned for its heat value. Conversion processes for hydrocarbon-like extracts<br />
are expected to be more efficient and less energy demanding, since the material<br />
is already in a reduced state.<br />
A large number of plant species are capable of synthesizing isoprenoids and<br />
other hydrocarbon-like chemicals. Perhaps the best known example is the rubber<br />
tree, Hevea brasil iensis (family Euphorbiaceae). The family Euphorbiaceae consists<br />
ofproximately 2000 species ranging from small herbs and succulents to<br />
large trees, the large majority of which produce a milky latex which is rich in<br />
reduced isoprenoids. One member of this family, Euphorbia lathyris, grows wild<br />
in California. To explore the feasibility of obtaining fuels or chemical feedstocks<br />
from this Eu horbia species, field studies were undertaken in the cultivation<br />
and harveshuphorbia lathyris. Preliminary results with wild<br />
seed and without the benefit of optimization of fertilizer and irrigation conditions<br />
gave an annual biomass yield of 10 dry tons per acre.<br />
Reduced photosynthetic material can be obtained from the dried plant<br />
material by hot solvent extraction. Various solvents can be used for the isolation<br />
of different plant constituents; one such extraction scheme is shown in<br />
Figure 1. The high heat value and low oxygen content of the heptane extract<br />
warranted a more detailed investigation of its chemical composition (2). This extract<br />
is a complex mixture of over 100 individual components. By various analyitcal<br />
methods, primarily by gas chromatography, combined gas chromatography-mass<br />
spectroscopy and high resolution mass spectroscopy, we identified approximately<br />
fifty major components. The extract is composed almost entirely of tetra- and<br />
pentacyclic triterpenoids functionalized as ketones, alcohols, or fatty acid<br />
esters. Two representative structures for a tetra- and a pentacyclic case are<br />
shown in Figure 2. Triterpenoids arise via the enzyme mediated cyclization of<br />
squalene 1,2-oxide, followed by rearrangement sequences to yield a large array of<br />
interrelated C30 compounds. In Euphorbia lathyris, terpenoid biosynthesis is<br />
almost exclusively shunted via this pathway, since no major amount of lower terpenoids<br />
have been detected. A few of these triterpenoids have been previously<br />
identified as the major components of the latex itself (3); however, the whole<br />
plant extract yields a much greater variety of these compounds. The nature of<br />
these compounds suggests that their conversion to chemical feedstock material<br />
might be advantageous. Such conversion studies have already been carried out on<br />
vegetable oils and a Euphorbia latex (4).<br />
A substantial amount of a more polar fraction can be obtained from the dried<br />
plant by methanol extraction, as shown in Figure 1. We have identified simple<br />
hexoses as major components of this fraction. These sugars are fermentable to<br />
alcohol; therefore, the possibility of obtaining this additional liquid fuel from<br />
Euphorbia lathyris shows promise.<br />
A1 though Euphorbia lathyris produces reduced isoprenoids, it would be<br />
economically desirable to improve this yield. The first plant selection experi-<br />
ment toward this end was done using the two cultivars native to California, the<br />
21 6
I<br />
Northern and the Southern variety. In a population of one hundred individual<br />
Northern and one hundred Southern California seed source plants, we could not<br />
detect a statistically significant difference in terpenoid content between the<br />
two Sets. The relatively small dispersion( 8% Of the mean) observed for each set<br />
is probably indicative of the limited seed source available at this time. In<br />
order to explore the feasibility of increasing terpenoid as well as biomass yields,<br />
further experiments using plant growth hormones, similar to the ones used<br />
successfully in guayule and e, are in progress (5).<br />
Since Euphorbia lathyris and other hydrocarbon producing crops are new<br />
species from the point of view of cultivation, their agronomic characteristics,<br />
requirements, and yield potentials are not yet well known. Consequently, any<br />
conceptual economic or technical evaluation will contain several uncertainties.<br />
A recent study by Stanford Research Institute on the feasibility of growing<br />
Euphorbia lathyris for energy usage identified these major uncertainties as the<br />
feedstock cost and supply (6). This conceptual process study is essentially<br />
based on solvent extraction of field dried plants at 1000 tons per day, and<br />
recovery of the sugars by water extraction. Credit is given for the sugars at<br />
4t per lb. (base case) or 6$ per lb. (optimistic case). The overall process uses<br />
the cellulose (bagasse) of the plant to generate the energy required for solvent<br />
extraction and recovery. According to this model, after recovery of the useful<br />
products, a considerable quantity of bagasse is left over. If one includes in<br />
this model an estimate of the required energy input for cultivation, the entire<br />
process still remains energy positive(7).<br />
Based on this study, the estimated product costs are greatly dependent on the<br />
method of cultivation. In areas such as California where irrigation is required,<br />
one barrel of "oil" from Eu horbia lath ris may be produced for $100 (optimistic<br />
case) or $200 (base case). !ultivation Ef Euphorbia lathyris in a geographic<br />
region where irrigation requirements are minimal would lower the feedstock costs<br />
significantly. Consequently, one barrel of "oil" form Euphorbia lathyris grown<br />
in the Midwest is estimated to cost $43.<br />
Comparison of a new crop such as Euphorbia to other established ones like<br />
corn or sugar cane, which yield ethanol, indicates that in terms of energy yield<br />
of liquid fuel per acre/yr , Eu horbia lath ris is comparable. The liquid fuel<br />
yield from corn is 16 x lo6 BT$acre/yr; ft& sugar cane it is 25 x 106 BTU/acre/yr.<br />
both in the form of ethanol (8). The Eu horbia lathyris yield is 20 x lo6 BTU/acre/<br />
yr. in the form of hydrocarbons and 13 k<br />
x 10 BTU/acre/yr. in the form of alcohol.<br />
In addition a potential yield of approximately 7 x 10⁶ BTU/acre/yr. may yet be<br />
realized from fermentation of yet unidentified carbohydrates.<br />
1.<br />
2.<br />
3.<br />
4.<br />
5.<br />
6.<br />
REFERENCES<br />
M. Calvin, Energy Res. 1, 299 (1977); Chem. En%. News (March ZO), 30 (1978);<br />
Bioscience 3, 533797B).<br />
E.K. Nemethy, J.W. Otvos, and M.Calvin, JAOCS 56, 957 (1979).<br />
P.E. Nielsen, H. Nishimura, J.W. Otvos, and M. Calvin, Science 198 942 (1977).<br />
P.B. Weisz, W.O. Haag, and P.G. Rodewald, Science 206, 57 (1979).<br />
H. Yokoyama, E.P. Hayman, W.J. Hsu, and S.M. Poling, Science 197, 1076 (1977).<br />
D.A. Mendel, F.A. Schooley, and R.L. Dickenson, "A Production Cost Analysis<br />
of Euphorbia lathyris," SRI Report. August 1979.<br />
21 7
7.<br />
D. Wil helm, "Recovery of Hydrocarbon-like Compounds and Sugars from Euphorbia<br />
lathyris," SRI Report. January 1980.<br />
P. 9. Weisz and J.F. Marshall, Science 206, 24 (1979).<br />
8. Information obtained from: Alcohol Fuel Information Center, Southwest State<br />
University, Marshall MN 56258. Department of Energy.<br />
Acknowledgment: This work was supported,in part, by the Biomass Energy Systems<br />
Division of the Department of Energy under contract W-7405-eng-48.<br />
218
.77'0.06<br />
17,800 BTU/lb.<br />
Figure 1<br />
EUPHORBIA LATHYRIS EXTRACTION<br />
DRIED PLANT<br />
heptane extraction<br />
parti tion<br />
8 hrs.<br />
I<br />
MeOH Extract<br />
3 0%<br />
I<br />
MeOH<br />
extraction<br />
8 hrs.<br />
E<strong>THE</strong>R SOLUBLE H20 SOLUBLE<br />
21 9<br />
CH1 .97'0.93<br />
7300 BTU/1 b.<br />
RESIDUE
I<br />
220<br />
w<br />
X
METHANE PRODUCTION BY ANAEROBIC DIGESTION<br />
<strong>OF</strong> WATER HYAC<strong>IN</strong>TH (EICHHORNIA CRASSIPES)<br />
D. L. Klass and S. Ghosh<br />
Institute of Gas Technology<br />
3424 South State St.<br />
Chicago, Illinois 60616<br />
<strong>IN</strong>TRODUCTION<br />
Water hyacinth (Eichhornia crassipes) is an aquatic biomass species that exhibits<br />
prolific growth in many s s o f h e world (1). It has been suggested as a strong candidate<br />
for production of methane because of high biomass yield potential (2). Several studies have<br />
been carried out which establish that methane can be produced from water hyacinth under<br />
anaerobic digestion conditions (3-6). Both batch and semicontinuous digestion experiments<br />
were performed. The highest apparent gas yields reported were obtained in the batch mode<br />
of operation over long detention times (4), but the yields were based on wet hyacinth<br />
containing unspecified amounts of water and ash. Some of the data in the literature on gas<br />
yield and production rate are difficult to interpret because they are experimentally observed<br />
values and are not reduced to standard conditions. The energy recovery efficiencies in the<br />
product gas are also not available because the energy contents of the feed were not<br />
determined. The work described in this paper was initiated to develop more quantitative<br />
data in terms of the physical and chemical characteristics of water hyacinth.<br />
Digesters<br />
MATERIALS AND METHODS<br />
The digestion runs were carried out in the semicontinuous mode in cylindrical,<br />
complete-mix, 7- II digesters (7). The culture volume for all experiments was 5 and the<br />
internal diameter of the digesters was 19 cm. Continuous mixing at 130 rpm was provided<br />
with two 7.6-cm propellertype impellers located 7.6 and 15.2 cm from the digester bottom<br />
on a central shaft.<br />
Analytical Techniques<br />
Most analyses were performed in duplicate; several were performed in triplicate or<br />
higher multiples. The procedures were either ASTM, Standard Methods, special techniques as<br />
reported previously (8), or other techniques as indicated by footnotes in the tables.<br />
Data Reduction<br />
Gas yield, methane yield, volatile solids reduction, and energy recovery efficiency<br />
were calculated by the methods described previously (8). All gas data reported are converted<br />
to 60°F and 30 in. of mercury on a dry basis.<br />
Digester Feeds<br />
One-half to one ton samples of water hyacinth were harvested for this work.<br />
Water hyacinth was harvested from an experimental sewage-treatment lagoon of<br />
NASA's National Space Technology Laboratory in Bay St. Louis, Mississippi. Whole adult and<br />
young plants were collected and fed directly to an agricultural chopper that provided<br />
particles about 3 in. or smaller in size. The chopped hyacinth was placed in polyethylene-<br />
lined fiber drums, frozen, shipped by refrigerated truck to IGT, stored at -lO°F, ground in a<br />
laboratory grinder, mixed in a double-ribbon blender to ensure homogeneity, placed in one-<br />
half gallon cartons, and stored at about -20°F.<br />
\<br />
During one of the harvests (June 3, 1977), small samples of whole plants were also<br />
collected, in addition to the chopped plants, and shipped separately to IGT overnight in sealed<br />
221
ottles without freezing for moisture, volatile matter, and ash analyses. The results are<br />
shown in Table 1 along with the corresponding analyses for the hyacinth treated as described<br />
above.<br />
Whole water hyacinth plants were collected from a 0.25-ac freshwater pond in the Lee<br />
County Hyacinth Control District, Fort Myers, Florida. This pond is located northeast of<br />
Fort Meyers in an unincorporated area known as Buckingham and receives both surface run-<br />
off and ground water. The pond is stagnant, has no outlet, is about 3 m deep, and has a<br />
mucky bottom. The whole plants were shipped by unrefrigerated truck to IGT in<br />
polyethylene-lined fiber drums. After arrival at IGT, the water hyacinth was treated in the<br />
same manner as the Mississippi shipments.<br />
Grinding of the water hyacinth in the laboratory was achieved with an Urschel<br />
Laboratory Grinder (Comitrol 3600) equipped with 0.030-in. cutting head. A typical particle<br />
size analysis is shown in Table 2, and the effects of storage time on the moisture, volatile<br />
matter, and ash contents are shown in Table 3.<br />
The characteristics of the particular lots of hyacinth used to make the feed slurries<br />
for the digestion runs reported in this paper are summarized in Table 4. Feed slurries were<br />
prepared fresh daily by blending the required amounts of ground hyacinth and demineralized<br />
water. The properties of the slurries are compared in Table 5. The pH of the digester<br />
contents was maintained in the desired range by adding a predetermined amount of caustic<br />
solution to the feed slurry before dilution to the required amount with water. When added<br />
nutrient solutions were used, the compositions of which are shown in Table 6, preselected<br />
amounts were also blended with the feed slurries before dilution to the final feed volume.<br />
Innum, Start-up and Opera-<br />
The inoculum for the initial replicate digestion runs (Runs 1M-B and 2M-B) was<br />
developed by accumulating daily effluents from existing laboratory digesters operating on<br />
giant brown kelp and primary-activated sewage sludge as described previously (7). These<br />
digesters were then operated in the semicontinuous mode with initial mixed inoculum<br />
volumes of 2.511 and a daily feeding and wasting schedule aimed at increasing the working<br />
volume to 5~ over an 8-day period, after which a transition period was incurred to change the<br />
feed to 100% hyacinth (7). The total time required from start-up to conversion to hyacinth<br />
feeds was 42 days. A second transition period was then used to adjust the operating<br />
conditions to a loading of 0.1 Ib volatile solids (VS)/ft3 -day and a detention time of 12 days;<br />
this required 21 days (7). Digestion was then continued at the target operating conditions<br />
with hyacinth feed only.<br />
The experimental results obtained at steady state with Runs 1M-B, 2M-B and<br />
subsequent runs are shown in Table 7. Steady-state digestion was defined in this work as<br />
operation without significant change in gas production rate, g,as composition, and effluent<br />
characteristics. Usually, operation for two or three detention times established steady-state<br />
digestion.<br />
Mesophilic Runs 1M-4, 1M-7, 1M-8, and 1M-9 were each successively derived starting<br />
from the initial Run 1M-B. Run 1M-4 shows the effects of added nitrogen as an ammonium<br />
chloride solution. Run 1M-7 shows the effects of terminating caustic additions to maintain<br />
pH. Run 1M-8 was developed by replacing the Mississippi hyacinth in the feed slurry with<br />
Florida hyacinth. Run 1M-9 is a continuation of Run 1M-8 except caustic additions were<br />
made to control pH. Run 2M-3 was derived from Run 2M-B and was carried out with<br />
additions of the mixed nutrient solution.<br />
Thermophilic Run 1T-5 was developed from the effluents of mesophilic Runs 1M-B and<br />
2M-B. Successively, the effluents were collected and used as inoculum (16 days); the digester<br />
was operated at the conditions of Runs IM-B and 2M-B to stabilize the new digester<br />
(16 days); the temperature was increased to 55OC and the digester was kept in the batch<br />
mode (14 days); the semicontinuous mode of operation was started with gradual change of the<br />
detention time from 106 days to 16.7 days and of the loading from 0.01 to 0.15 Ib VS/ftLday<br />
222<br />
I
(27 days); and Run 1T-5 was continued. Runs 1T-8, 1T-10, and 1T-11 were each successively<br />
derived starting from Run 1T-5. Runs IT-8 and 1T-10 were operated at higher loading rates<br />
and lower detention times than Run IT-5; ammonium chloride solution was added to each of<br />
these runs. Run 1T-11 is identical to Run 1T-10 except that nitrogen additions were<br />
terminated.<br />
Dewatering Tests<br />
Gravity sedimentation tests were conducted by a modification of the AEEP Method (91<br />
in which a 400-ml sample of the effluent was examined in a 1- R graduated cylinder giving a<br />
fluid depth of 140 mm (7). Vacuum filtration tests were conducted by a modification of the<br />
AEEP Method (10) in which a 417-ml sample of effluent was filtered through a monofilament<br />
filter cloth (71.<br />
Feed Properties<br />
DISCUSSION<br />
The roots of water hyacinth had higher ash and lower volatile matter contents than<br />
other parts of the plant as shown by the data in Table 1. Harvesting and storage times as<br />
well as the source of the plant seemed to have little effect on the moisture, volatile matter,<br />
and ash contents of the plants as illustrated by the data in Table 3. Samples harvested many<br />
months apart in Mississippi had essentially the same volatile matter and ash contents. The<br />
sample harvested in Florida had slightly higher volatile matter and slightly lower ash<br />
contents than the Mississippi samples, but this might be expected in view of the different<br />
growth media from which the hyacinth harvests were taken. The Mississippi hyacinth was<br />
grown in a sewage-fed lagoon, and hyacinth is known to take up heavy metals from such<br />
media (1).<br />
The data on the chemical and physical properties of the Mississippi and Florida<br />
hyacinths used in this work (Table 4) indicate some interesting differences. The C/N and C/P<br />
weight ratios are each lower for the Mississippi hyacinth than the Florida hyacinth, but both<br />
sets of ratios appear to be somewhat high when compared with the corresponding ratios<br />
supplied by suitable feeds for anaerobic digestion such as giant brown kelp and sewage sludge<br />
(7). Although analytical data for the organic components in Florida hyacinth were not<br />
obtained, the relatively high hemicellulose content of the Mississippi hyacinth indicates<br />
potentially good digestibility (7). Interestingly, the theoretical methane yield derived from<br />
the empirical formula and stoichiometric conversion (7) of the Mississippi hyacinth has a<br />
maximum value about 14% higher than that of the Florida hyacinth.<br />
Comparison of the feed slurries (Table 5) also reveals some interesting differences.<br />
The slurry made with the Mississippi hyacinth had a lower pH and buffering capacity than the<br />
Florida hyacinth slurry and therefore needed more caustic for pH control. However, the<br />
ammonia nitrogen concentrations in each slurry appeared too low for good digestion when<br />
compared to the beneficial range for sewage digestion (1 1). Concentrations of calcium,<br />
potassium, sodium, and magnesium calculated from the data in Table 4 for the feed slurries,<br />
assuming each element is totally dissolved, were either in the stimulatory range or less than<br />
the inhibitory range (1 1). Addition of sodium hydroxide for pH control, although increasing<br />
the sodium ion concentration several-fold, was still estimated to be insufficient to raise the<br />
sodium ion concentration to the inhibitory range. Also, addition of lime for pH control (Run<br />
lM-9) at the level required raised the calcium ion concentration in the feed slurry but not<br />
enough to inhibit digestion based on sewage digestion and inhibition by metallic cations (11).<br />
Mes_ophilic Digestion<br />
Operation of replicate Runs 1M-B and 2M-B on Mississippi hyacinth without added<br />
nutrients showed good reproducibility and balanced digestion. Typical operating performance<br />
over a period of several detention times is shown in Figure 1. It was found that to maintain<br />
pH in the desired range, about 45-50 meq of sodium hydroxide per liter of feed had to be.<br />
added.<br />
223
To attempt to increase methane yields, pure and mixed nutrient solution additions<br />
were made in Runs 1M-4 and 2M-3, respectively, while controlling pH with added caustic.<br />
Little change was observed in digester performance; the gas production rates and yields were<br />
about the same as those observed without nutrient additions.<br />
Elimination of both pH control and nutrient additions in Run 1M-7 resulted in small<br />
decreases in pH, methane yield, and methane concentration in the product gas, but overall<br />
performance in terms of volatile solids reduction and energy recovery efficiency as methane<br />
were about the same as those of the runs with pH control and with or without nutrient<br />
additions.<br />
Conversion from Mississippi hyacinth to Florida hyacinth in Run 1M-8, which did not<br />
incorporate pH control or nutrient additions and which was identical to Run 1M-7 except for<br />
the feed source, showed significant reduction in most of the gas production parameters. Gas<br />
production rate and yield and methane yield decreased, but digester performance was still<br />
balanced as shown by low volatile acids in the digester effluent and the methane<br />
concentration in the product gas. From the elemental analyses and the theoretical methane<br />
yields (Table 4), the methane yield for Run 1M-8 would be expected to be about 14% less than<br />
that of Run 1M-7; it decreased by about 41%. Prolonged operation of Run 1M-8 for over six<br />
detention times did not result in any improvement; the run exhibited steady-state<br />
performance with no change in methane yield or gas production rate. Use of pH control<br />
(Run 1M-9) and continued operation reduced the methane yield even further. It was<br />
concluded from these experiments that the Florida hyacinth sample contained unknown<br />
inhibitors or that the Mississippi water hyacinth contained unknown stimulatory components.<br />
The latter possibility was considered more likely because the Mississippi hyacinth was grown<br />
in a sewage-fed lagoon, and it is well established that normal sewage has good digestion<br />
characteristics (11). Also, it is known that water hyacinth when grown in laboratory media<br />
enriched with nickel and cadmium, components often found in sewage, incorporates these<br />
metals and shows good digestion characteristics (4).<br />
Thermophilic Digestion<br />
Digestion of Mississippi water hyacinth was carried out at 55OC with and without<br />
nitrogen supplementation. Balanced digestion was achieved with all four runs, Runs IT-5,<br />
1T-8, IT-10, and 1T-11. The gas production rate increased with decreases in detention time<br />
and increases in loading rate as expected. Also, as expected, the gas production rate at 55OC<br />
was higher than that at 35OC, and again there was no apparent benefit of nitrogen additions.<br />
The methane yield ranged from 1.95 to 2.63 SCF/lb VS added over the detention time range<br />
studied, 6 to 16.7 days. At the same 12-day detention times, the methane yield at 55OC,<br />
2.42 SCF/lb VS added (Run IT-81, was lower than those observed for all of the mesophilic<br />
runs at 35OC with Mississippi hyacinth. However, comparison of the specific methane<br />
production rates [methane production rate t [loading x detention time)] in Table 7 shows that<br />
at the highest loading and shortest detention time studied in this work (Runs IT-10 and<br />
1T-ll), the rate of methane production per pound of volatile solids added is higher at 55OC<br />
than at 35OC even though the methane yields are lower.<br />
Carhon and Energy Balances<br />
The difficulty of calculating carbon and energy balances for digestion experiments in<br />
which additions of alkali and nutrients are made has been discussed before (7). These<br />
additives contribute to ash weights. The two methods used to circumvent this problem in<br />
previous work (7) were also used in this paper. They are described in the footnotes to<br />
Table 8, which presents sample calculations by each method for Runs 1M-B, 2M-E, and 1M-9.<br />
Run 1M-9 exhibited the largest deviation from the theoretical carbon and energy balances;<br />
both balances were quite low and only accounted for 81 to 87% of the feed carbon and 86 to<br />
92% of the feed energy. The major reason for this is probably the deviation in the<br />
experimental gas production measurements. Run 1M-9 had the largest coefficients of<br />
variation of all the runs for both gas production rate and yield (Table 7).<br />
224
-ties of Effluent a_n_d_Digested Solids<br />
A comparison of fresh feed slurries and effluents from Runs 1M-B, 1M-4, and 1M-8 is<br />
presented in Table 9. The addition of sodium hydroxide for pH control in Run 1M-B had the<br />
expected effects on total and bicarbonate alkalinities, pH, and conductivity. The effluent<br />
from Run 1M-4, which was subjected to both caustic and nitrogen additions, showed the same<br />
trends except that the ammonia nitrogen concentration also increased. Run 1M-8, which had<br />
neither caustic or nitrogen additions, showed a significant increase in alkalinities and a major<br />
reduction in volatile acids. The volatile acids present in the fresh feed slurry were expected<br />
to undergo a large decrease on balanced digestion. However, the conversion of non-ammonia<br />
nitrogen in the feed to ammonia nitrogen in the effluent is not apparent in these runs in<br />
contrast to the usual increase observed on digestion (7). Also, because of the moderate to<br />
low volatile solids reductions in these experiments, the chemical oxygen demands of the<br />
digester effluents are relatively high.<br />
A few experiments were carried out to examine the gravity sedimentation and<br />
filtration characteristics of digester effluent from Run 1M-B. The sedimentation results for<br />
unconditioned and conditioned effluent are shown in Figure 2. The settling characteristics<br />
were poor and the conditioning treatment improved settling only slightly. 4 more detailed<br />
study is necessary to optimize the conditioning method. Similarly, the filtration<br />
characteristics of the conditioned and unconditioned effluent shown in Table 10 were poor.<br />
The properties of the dry feeds and digested solids from Runs 1M-B, 2M-B, and 1M-9<br />
are listed in Table 11. Carbon content, volatile matter, and heating value of the total<br />
digested solids decreased on digestion as expected while ash content increased. The heating<br />
value per pound of contained carbon remained reasonably constant from dry feed to dry<br />
digested solids, but there appeared to be a significant reduction in the heating value of the<br />
volatile matter in the Florida hyacinth residual solids, while the heating value of the<br />
Mississippi hyacinth residual solids remained about the same as the feed. As indicated in<br />
previous work (7), this may be due to the difference in degradabilities of different organic<br />
components.<br />
Thermodynamic Estimates<br />
The maximum theoretical methane yields uncorrected for cellular biomass production<br />
for the Mississippi and Florida water hyacinth samples used for the digestion runs were<br />
estimated to be 9.36 and 8.20 SCF/lb VS reacted (Table 4). Assuming that 7% of the protein<br />
and 20% of the carbohydrate is converted to cells on one pass through the digester, the<br />
maximum theoretical yield of methane for Mississippi hyacinth is given by (7):<br />
SCF CH SCF CH4<br />
(1 lb VS added - 0.195 lb VS to cells) (9.36 Ib vs rea:ted) = 7.53 lb VS-pass<br />
If the same conversion factor is assumed to be valid for the Florida hyacinth sample, the<br />
corresponding yield is 6.60 SCF CHr/lb VS-pass. The highest experimental methane yields<br />
observed for the Mississippi and Florida hyacinth samples used in this work are 3.13 and<br />
1.66 SCF/lb VS added, or about 42% and 25% of these theoretical values.<br />
Com&son With Other Substrates<br />
- --<br />
The methane yields, volatile solids reductions, and energy recovery efficiencies as<br />
methane in the product gas from experiments carried out under similar high-rate conditions<br />
with other substrates are summarized in Table 12 (7) along with the results from Run 2M-B.<br />
The relatively narrow span of the yields and efficiencies when considered together suggest<br />
that standard high-rate conditions in the conventional range tend to afford about the same<br />
digestion performance with degradable substrates. The basic organic components groups in<br />
these substrates are similar. Usually, the largest fraction consists of mono and<br />
polysaccaharides and the smallest fraction is lignin, if present at all. The protein content is<br />
usually intermediate in concentration. Experimental data indicate that the hemicelluloses<br />
are generally more degradable than the cellulosics on digestion (7), and that the cellulosics<br />
and protein fraction are lower in degradability than the monosaccaharides (12). Thus, feeds<br />
225
high in hemicelluloses and monosaccaharides should exhibit high gasification rates, but the<br />
actual concentrations of these components in the feeds might be expected to govern gas<br />
yields. Further improvements in yields and energy recovery efficiencies are therefore more<br />
likely through post- or pretreating procedures that increase the degradabilities of the<br />
resistant organic components in biomass, or through longer residence times. For example,<br />
about 90% of the monosaccaharide glucose was converted to product gas on anaerobic<br />
digestion at an overall residence time of about 4.5 days in a two-phase system (131, while<br />
long-term digestion of cellulose indicates an ultimate anaerobic biodegradability of about<br />
75% (14). A mixed biomass-waste feed containing water hyacinth has been estimated to have<br />
an ultimate biodegradability of 66% (15).<br />
CONCLUSIONS<br />
Water hyacinth under conventional high-rate digestion conditions exhibited higher<br />
methane yields and energy recovery efficiencies when grown in sewage-fed lagoons as<br />
compared to the corresponding values obtained with water hyacinth grown in a fresh-water<br />
pond. Mesophilic digestion provided the highest feed energy recovered in the product gas as<br />
methane while thermophilic digestion, when operated at sufficiently high loading rates and<br />
reduced detention times, gave the highest specific methane production rates. Methane<br />
yields, volatile solids reduction, and energy recovery as methane for the sewage-grown water<br />
hyacinth were in the same range as those observed for other biomass substrates when<br />
digested under similar conditions.<br />
ACKNOWLEDGMENT<br />
This research was supported by United Gas Pipe Line Company, Houston, Texas. The<br />
project was performed under the management of UGPL and is currently managed by the Gas<br />
Research Institute. The assistance of Dr. B. C. Wolverton of NASA and Mr. E. S. Del Fosse<br />
of the Lee County Hyacinth Control District, Fort Myers, Florida in obtaining the hyacinth<br />
samples is gratefully appreciated. The authors also wish to thank Dr. Victor Edwards and<br />
Mr. Robert Christopher of United for the many valuable discussions and suggestions. We also<br />
acknowledge the efforts of Michael Henry, Janet Vorres, Alvin Iverson, Mona Singh, Frank<br />
Sedzielarz, Phek Hwee Yen, and Ramanurti Ravichandran in performing the experimental<br />
work.<br />
1.<br />
2.<br />
3.<br />
4.<br />
5.<br />
6.<br />
7.<br />
REFERENCES<br />
E. S. Del Fosse, "Water Hyacinth Biomass Yield Potentials," Symposium Papers, Clean<br />
Fuels From Biomass and Wastes, pp. 73-99. Sponsored by IGT, January 25-28, 1977,<br />
Orlando, Florida.<br />
D. L. Klass, "A Perpetual Methane Economy - Is It Possible," Chemtech 4_, 161-8 (1974)<br />
March.<br />
"Technology for the Conversion of Solar Energy to Fuel Gas," University of Pennsylvania,<br />
Annual Report NSF/RANN/SE/GI34991/PR/7314, Janauary 31,1974.<br />
B. C. Wolverton, R. C. McDonald, J. Gorden, "Bio-Conversion of Water Hyacinths Into<br />
Methane Gas: Part 1," National Space Technology Laboratories, Bay St. Louis,<br />
Mississippi, NASA Technical Memorandum TM-X2725, July 1975.<br />
K. K. Chin and T.N. Goh, "Bioconversion of Solar Energy: Methane Production Through<br />
Water Hyacinth," Symposium Papers, Clean Fuels from Biomass and Wastes, pp. 215-228,<br />
sponsored by IGT, August 14-18, 1978, Washington D.C.<br />
J. H. Ryther et., "Biomass Production by Marine and Freshwater Plants," 3rd Annual<br />
Biomass Energy Systems Conference Proceedings, the National Biomass Program, pp.13-<br />
23, Sponsored by U.S. Department of Energy, June 5-7, 1979, Golden, Colorado.<br />
D. L. Klass, and S. Ghosh, "Methane Production by Anaerobic Digestion of Bermuda<br />
Grass," ACS Div Pet. Chem. Prepr. 3 No. 2, 414-28 (1979) March.<br />
226
8. D L. Klass and S. Ghosh, "The Anaerobic Digestion of Macrocystis pyrifera Under<br />
Mesophilic Conditions," Symposium Papers, Clean Fuels From Biomass and Wastes, pp.<br />
323-51, Sponsored by IGT, January 25-28, 1977, Orlando, Florida.<br />
9.<br />
Association of Environmental Engineering Professors, "Environmental Engineering Unit<br />
Operations and Unit Processes Laboratory Manual," J. T. O'Connor, Ed., ILI-1-1 (1972)<br />
July.<br />
10. bid., V-2<br />
11. P. L McCarty, "Anaerobic Waste Treatment Fundamentals, Part m," Public Works 91-4<br />
(1964) November.<br />
12. D. L. Klass, S. Ghosh, and D. P. Chynoweth, "Methane Production From Aquatic Biomass<br />
by Anaerobic Digestion of Giant Brown Kelp," Process Biochem. 14, No.4, 18-22 (1979).<br />
13. A. Cohen et., "Anaerobic Digestion of Glucose With Separated Acid Production and<br />
Methane Formation," Water Res. E, 571-80 (1979).<br />
14. S. Ghosh etal., "A Comprehensive Gasification Process for Energy Recovery From<br />
Cellulose Wastes," Symposium on Bioconversion of Cellulosic Substances Into Energy,<br />
Chemicals and Protein, New Delhi, India, February 1977.<br />
15. S. Ghosh, M. P. Henry, and D. L. Klass, "Bioconversion of Water Hyacinth - Coastal<br />
Bermuda Grass - MSW - Sludge Blends to Methane," Biotech. and Bioeng. in press.<br />
Plant Part<br />
Root.<br />
Table 1. UOISTLIRE. VOLATILE HATTER. A m ASP COSTEST or<br />
MISSISSIPPI WATFR HYAC<strong>IN</strong>TH PLANT PARTS<br />
Harvested 6-3-77<br />
stem. sro1on<br />
Stern. Svbfloaf<br />
Stem. Float<br />
Leaf<br />
A"VerAge<br />
mole (Chopped, Frozen,<br />
Thawed, Ground)'<br />
mistYre volatile narrcr<br />
ut 2<br />
91.2 63.6 36.4<br />
90. 4 80.5 19.5<br />
90.9 81.2 18.8<br />
91.1 80.1 19.1<br />
87.5<br />
82.6<br />
17.4<br />
-<br />
-<br />
-<br />
90.2 77.7 22.3<br />
95.3 77.7 22.4<br />
a After shipment to laboratory. thawing. and grinding.<br />
227
Source<br />
Bay St. Louis,<br />
Mississippi<br />
Fort Myers, Florida<br />
Table 2. TYPICAL PARTICLE SIZE ANALYSIS <strong>OF</strong> GROUND WATER HYAC<strong>IN</strong>TH<br />
u. s. sieve sire, mm<br />
1.180<br />
0.600<br />
0.297<br />
0.250<br />
0.212<br />
0.180<br />
0.149<br />
0.105<br />
0.063<br />
Retained on Sieve. Wt 2<br />
0<br />
12.7<br />
34.5<br />
72.7<br />
78.2<br />
85.5<br />
89.1<br />
94.8<br />
98.2<br />
A80030702<br />
Table 3. EFFECT <strong>OF</strong> SOURCE, HARVEST TIME, AND STORAGE ON MOISTURE,<br />
VOLATILE MATTER, AND ASH CONTENT <strong>OF</strong> WATER HYAC<strong>IN</strong>TH^<br />
Harvest Date Storage Time, mth<br />
6-3-77 2.5<br />
2.8<br />
7.8<br />
6-21-78 0.2<br />
2.2<br />
7-19-78 2.8<br />
3-13-78 0.5<br />
5.0<br />
Moisture Volatile Matter Ash<br />
W t x<br />
95.3 77.5 22.5<br />
95.3 77.9 22.1<br />
95.0 76.9 23.1<br />
94.3 76.5 23.5<br />
94.3 75.2 24.8<br />
94.5 78.8 21.2<br />
94.7 79.9 20.1<br />
94.3 80.9 19.1<br />
a All samples ground with 0.030-in. cutting head of Urschel grinder, homogenized, stored at -20"F, and<br />
thawed before analysis in triplicate.<br />
A80030698<br />
228
ol<br />
wl<br />
E<br />
0<br />
2<br />
P<br />
229
Run<br />
Peed Source<br />
Operarini Condirion<br />
Tempernrure. 'c<br />
PHb<br />
cauericaoorage, oeq/P<br />
feed<br />
Loading Rare.<br />
Ib VS/ft'-day<br />
oerenrion Time. day<br />
Iorsl Solids in Feed<br />
Slurry, Yf z<br />
VDlafile Solids in<br />
Feed Slurry. rl 1<br />
Nutrients Addedb<br />
C<strong>IN</strong> Ratio in Feed<br />
Slurry<br />
ClP Patio in Feed<br />
Slvrry<br />
Detention Times<br />
Operated<br />
Gar ProductionC<br />
Gee Production ~afe,<br />
uolluol-day<br />
Cas Yield. SCF/lb<br />
YS added<br />
Methane Concenrraiion.<br />
mol 2<br />
Table 7.<br />
1"-8<br />
nie8.<br />
Methane Yield. SCFllb<br />
VS added<br />
Specific Hethane Production<br />
Rate. SCFllb VS<br />
added-day<br />
Efficiencies<br />
Yolarile Solida<br />
0.26 0.26 0.21<br />
Reduction. X<br />
Feed Energy Recovered<br />
28.8 29.8 28.5<br />
8s Methane. I<br />
Effluent Volatile Acids.<br />
31.2 35.1 33.9<br />
mg/1 as HOAe 21 26 26<br />
35<br />
1.01<br />
49<br />
o.ia<br />
12<br />
2.47<br />
1.92<br />
0<br />
21.0<br />
89.3<br />
5.1<br />
SUMMARY <strong>OF</strong> SELECTED STEADY-STATE DIGESTION DATA<br />
21-8 <strong>IN</strong>-4<br />
Hies. nio..<br />
31 35<br />
7.05 1.02<br />
45 41<br />
a.10 a.10<br />
12 12<br />
2.47 2.47<br />
1.92 1.92<br />
a N<br />
21.a 8.2<br />
89.3 89.3<br />
5.1 2.8<br />
2n-3<br />
HISS<br />
35<br />
6.99<br />
50<br />
0.10<br />
12<br />
2.41<br />
1.92<br />
nr:<br />
8.2<br />
11.2<br />
2.8<br />
in-7<br />
HISS.<br />
35<br />
6.72<br />
0<br />
0.10<br />
12<br />
2.47<br />
1.92<br />
0<br />
21.0<br />
R9.3<br />
2.7<br />
in-8<br />
F1;1.<br />
35<br />
6.57<br />
a<br />
0.10<br />
12<br />
2.41<br />
1.92<br />
0<br />
26.1<br />
103<br />
6.6<br />
In-9<br />
PI..<br />
35<br />
6.87<br />
31<br />
0.10<br />
12<br />
2.41<br />
1.92<br />
0<br />
26.1<br />
103<br />
3.5<br />
IT-5<br />
Hiss.<br />
51<br />
7.08<br />
21<br />
0.15<br />
16.7<br />
3.10<br />
2.87<br />
0<br />
21.0<br />
89.3<br />
1.0<br />
IT-8<br />
Hiss.<br />
55<br />
i.ao<br />
17<br />
0.21<br />
12<br />
5.19<br />
4.03<br />
N<br />
11.8<br />
89.3<br />
1.4<br />
1T-m<br />
MISS.<br />
55<br />
6.82<br />
4<br />
0.30<br />
6<br />
1.41<br />
1.76<br />
N<br />
15.1<br />
89.3<br />
3.0<br />
0.483(1) 0.488(15) 0.268(13) 0.179(21) O.b88(10) 0.861(11) 1.062(6)<br />
4.82(81 4.88(15) 2.69(12) 1.19(21) 4.58(8) 4.11(10) 3.15(5)<br />
60.6 17.4 61.8 66.2 51.1 58.7 57.9<br />
2.92 2.RO l.6h 1.19 2.63 2.42 2.06<br />
0.24 0.23 0.14 0.10 0.16 0.20 0.34<br />
28.9 29.2 17.0 11.1 27.4 24.6 21.3<br />
31.3 32.0 21.1 15.2 30.0 21.6 23.5<br />
SI 9 5 63 7 10 21<br />
a pH maintained as Indicarsd by addition of sodium hydroxide xalutlun. vxrrpl fur Hun lbl-9 *IIICTC 1 i m "1% wcd.<br />
made (01 Runs 1"-7 and 1M-8.<br />
Vu ciiiirtic additions were<br />
"0" denotes no OYtrientS added fo feed slurry.<br />
solution added ce feed slurry<br />
"1i.V" denutc.c nlred nurricnr solution addrd to fwd (.lurrv. "V" denotes ammonium rhlorlde<br />
lean values; the valves in parentheses are coefficients of varla~ion.<br />
2 30<br />
IT-11<br />
Hiss.<br />
5s<br />
6.80<br />
5<br />
0.30<br />
6<br />
7.41<br />
5.16<br />
0<br />
21.0<br />
89.3<br />
1.0'<br />
1.026(6)<br />
3.41(8)<br />
57.3<br />
1.95<br />
0.33<br />
20.4<br />
22.3<br />
16<br />
B8 003 07 04
I Run 1M-B<br />
Run 2M-B<br />
Accounted For<br />
Feed Carbon % Feed Energy, %<br />
99.5,a 10Zb 105,a 107b<br />
98.3,a 100b 104,a 106b<br />
Run 1M-9 80.8,a 87.0b 85.7,a 91.gb<br />
a Calculated from experimental determinations for moisture, volatile<br />
solids, ash, carbon, and heating values of feed and digested solids,<br />
and yield and composition of product gas. Volatile solids in digested<br />
solids calculated from percent volatile solids reduction.<br />
Calculated from parameters in footnote "a" except that ash in digested<br />
solids estimated by assuming original ash in feed is in digested solids,<br />
that NaOH used for pH control is converted to NaHC03 on ashing at 550°C<br />
and remains in ash, and that NHbC1, if added, is volatilized on ashing.<br />
Table 9. COMPARISON <strong>OF</strong> FEED AND DIGESTER EFFLUENT SLURRIES<br />
Mississippi Florida<br />
Hyacinth Hyacinth<br />
Reactor Slurry Run 1M-B Run 1M-4 Slurry Run 1M-8<br />
Total Alkalinity,<br />
mglR as CaC03 425 3,400 3,460 1,443 2,300<br />
PH<br />
Bicarbonate Alkalinity,<br />
5.01 7.05 7.02 6.10 6.57<br />
mg/R as CaC03 302 3,390 3,430 556 2,290<br />
Conductivity, umholcm 3,500 5,620 9,870 2,100 2,680<br />
Volatile Acids,<br />
mglR as HOAc 173 27 26 1,065 5<br />
Chemical Oxygen<br />
Demand, mgfR 15,860 12,020 -- 17,479 14,630<br />
Ammonia N, mg/R as N 28 27 640 9 2<br />
231<br />
A80030701
Table 10. VACUUM FIL~TION CHARACTWISTICS <strong>OF</strong> DIGESTION EF'FLUBNT<br />
(Run m-B)<br />
Effluent cake Yield'<br />
nry c0h. ~t~t~.tc.<br />
VEL* X of 1s Ts, wt I VS. Wt I of TI Ib/ft'-hr Ib/lb d n cake bndltlonedb<br />
1.63 60.7 11.5 82.1 1.15 136 m<br />
1.60 61.3 14.6 13.5 O.hhS 120 T*.<br />
Table 11. CCFIPARISON W DRY FEED AM) DIGESTED SOLIDS<br />
nun in-n RY" m-a<br />
Florid.<br />
Ry.Einrh<br />
41.1 31.1 31.3 h0,3<br />
5.29 3.82 3.18 h.60<br />
1.9b 1.98 1.98 1.11<br />
9S.l -- - 9P.S<br />
17.1 60.1 60.1 8O.b<br />
22.4 39.3 39.1 19.6<br />
(,US6 1.280 5.269 6,389<br />
8.862 8.69~ n.6~1 1.917<br />
16,lSb 16.656 16.710 15.851<br />
27.3<br />
3.30<br />
_-<br />
-<br />
69.4<br />
30.6<br />
1.391<br />
6,327<br />
16.08h<br />
Table 12. COWARISON <strong>OF</strong> STEADY-STATE METHANE YIELDS AND EFFICIENCIES UNDER STANDARD<br />
HIGH-RATE CONDITIONS'<br />
Methene Yield.<br />
SCF/lb VS added<br />
Volatile Solids<br />
Reduction, 2<br />
Energy Recovered aB<br />
Methane, X<br />
Coastal B rmuda Kentucky Giant Hiasissippi Primay<br />
Crass Bluegrass Brown Kelp Water Hyacinth' Bludge<br />
3.51 2.54 3.87 3.13 5.3<br />
37.5 25.1 41.7 29.8 41.5<br />
41.2 27.6 49.1 35.7 46.2<br />
a Loadings of about 0.1 lb VS/ft'-day. detention time If 12 days, 35.C.<br />
Supplemented with added nitrogen.<br />
Run zn-8.<br />
232<br />
A880030700
<strong>IN</strong>TRODUCTION<br />
<strong>GASIFICATION</strong> <strong>OF</strong> FEEDLOT MANURE <strong>IN</strong> A PLUIDIZED BED<br />
The Effects of Superficial Gas Velocity and Feed Size Fraction<br />
K. Pattabhi Raman, Walter P. Walawender and L. T. Fan<br />
Department of Chemical Engineering<br />
Kansas State University<br />
Manhattan, Kansas 66506<br />
The dwindling supplies of oil and impending shortages of natural gas have made<br />
it worthwhile to consider recovering energy from solid wastes. Agricultural wastes<br />
such as feedlot manure, are one class of materials that are being investigated for<br />
possible utilization. Feedlot manure is a low sulfur material that is renewable and<br />
available in significant amounts in certain areas. Manure can be converted into useful<br />
products by anaerobic digestion, atmospheric pressure gasification or liquefaction.<br />
Of these, atmospheric pressure gasification appears to be the most economically<br />
attractive [Engler et al., (l)]. Contacting devices, such as the fixed bed, the<br />
moving bed, the entrained bed and the fluidized bed can be used for gasifying manure.<br />
From the standpoint of gas production, fluidized beds are highly desirable because of<br />
their high heat transfer characteristics and their capabilities for maintaining isothermal<br />
conditions.<br />
A survey of the literature on the gasification of manure indicates that the available<br />
experimental data are somewhat limited. Most investigators have only examined the<br />
influence of temperature. Burton (2) carried out two experimental runs with dried cow<br />
manure in a fluidized bed reactor. The reactor used was 0.38 m (15") in diameter and<br />
employed inert matrix of sand as the bed material. Hot fluidizing gas for the reactor<br />
was generated by combusting methane OT propane. The reactor operating temperatures<br />
used for the two runs reported were 1041 K and 1022 K. Smith et al., (3) published<br />
partial oxidation data obtained in a moving bed reactor using manure as the feed<br />
material. The experiments were conducted in a 0.05 m (2") diameter reactor and used<br />
recycled product gas and air as the gas medium.<br />
range of 894 K to 950 K.<br />
Data were obtained for a temperahre<br />
Bench scale operating data were obtained by Halligan et al., (4) in a 0.05 m (2")<br />
diameter reactor, which was operated in a partial combustion mode using steam and air.<br />
The reactor was externally heated with electrical heaters and the data were obtained<br />
between 977 K and 1069 K. Mikesell et al., (5) reported limited data on the flash<br />
pyrolysis of steer manure in a multiple hearth reactor. The operating temperatures<br />
for these experiments were between 873 K and 1023 K. Recently, Beck et al., (6) presented<br />
partial oxidation data on manure obtained in a pilot plant reactor. Steam and<br />
air were used as the fluidizing medium in the 450 kg/day pilot plant. The reactor<br />
used was 0.15 m (6") in diameter and had an axial temperature variation of about 500 K.<br />
The data were presented for an average temperature of about 870 K in the reactor.<br />
Howard et al., (7) have recently completed a comparative study on the gasification of a<br />
variety of biomass materials (including manure) in a 0.5 m ID fluid bed pilot plant.<br />
They examined the influence of fluidization velocity and reactor loading and gasifier<br />
performance.<br />
To properly design a system for the gasification of manure or other biomass, it<br />
is necessary to develop systematic data base which includes the effect of operating<br />
temperature, feed size, superficial gas velocity and perhaps other variables on the<br />
gasification characteristics. These would be most useful if obtained on a pilot plant<br />
scale. The objectives of the present work were to conduct gasification experiments<br />
233
with manure in a fluidized bed reactor and to assess the influence of the feed size<br />
fraction and superficial gas velocity on the following: 1) produced gas composition;<br />
2) higher heating value of the produced gas; and 3) produced gas yield. The operating<br />
temperature was also varied in the experiments.<br />
EXPERIMENTAL<br />
Facilities<br />
The pilot plant facility used for the gasification of manure is shown schemati-<br />
cally in Figure 1. The pilot plant consisted of the following seven components: 1)<br />
the reactor, 2) a screwfeeder, 3) a cyclone separator, 4) a Venturi scrubber, 5) an<br />
afterburner, 6) a control and instrumentation panel and 7) a gas sampling train.<br />
The reactor was constructed from heat resistant stainless steel 310 alloy. The<br />
reactor proper had an I.D. of 0.23 m (9") with an expanded freeboard of 0.41 m (16")<br />
I.D. A burner with a duty of 47.5 W/hr (45,000 BTU/hr) located at the bottom of the<br />
reactor (plenum) generated the gas for fluidization by the combustion of propane under<br />
starving air conditions. Water was also injected into the plenum section as necessary<br />
to maintain the temperature below 1250 K and to supply additional gas for fluidization.<br />
A sampling port was provided at the plenum section to permit monitoring of the composition<br />
of the fluidizing gas. Supplemental heat (as needed) for operation was transferred<br />
across the walls of a radiant jacket surrounding the reactor. A burner with a<br />
duty of 105.5 M/hr (100,000 BTU/hr) supplied heat to the jacket using natural gas as<br />
the fuel. The distributor plate for the reactor was made from a 3 mm thick 316 stainless<br />
steel plate and had 844 holes of 1.5 m diameter. The reactor was well insulated<br />
with a minimum of 0.1 m of Kao Wool and had adequate temperature and pressure measuring<br />
elements located at various strategic points. An inert matrix composed primarily of<br />
silica sand was used as the bed material. Approximately 45 kg of sand with a mean<br />
particle size of 0.55 mm was used to give a static bed height of 0.6 m (24"). An overflow<br />
pipe for withdrawing solid samples from the bed was provided on the reactor as<br />
shown in Figure 1.<br />
The solids to be gasified were fed into the bed through a feed pipe of 0.075 m<br />
(3") diameter, which discharged the feed just above the expanded bed surface. The feed<br />
material was delivered to the feed pipe from a sealed hopper with a variable speed<br />
screw feeder. A purge stream of about 0.36 cubic meter/hr of helium was used to maintain<br />
a positive pressure on the feed hopper as well as the feed pipe so as to prevent<br />
the backflow of off-gas into the feeder and subsequent condensation in the feeder.<br />
The off-gas from the reactor was withdrawn from the top and passed through a cyclone<br />
separator for removing the entrained solid particles which were collected in a<br />
receiver located below the cyclone. The cyclone could remove particles up to a<br />
diameter of 5 micrometers. A gas sampling point was provided at the inlet of the<br />
cyclone for monitoring the composition of the reactor off-gas. The solids free gas<br />
from the cyclone was then sent into a Venturi scrubber, which served to quench the<br />
off-gas and remove condensibles. The scrubber waste water was discharged to the sewer<br />
and the scrubbed gases were sent to an afterburner. The afterburner served as a flare<br />
stack which permitted the gas to discharge to the atmosphere after incineration.<br />
All the temperature and flow measuring instruments and the temperature recorder<br />
for the pilot plant were mounted on a control panel. Control loops with alarms were<br />
provided to ensure safe operation. A twelve point strip chart recorder was used to<br />
monitor the temperatures at several locations, including the plenum section, the<br />
radiant section, the portion just above the distributor, the middle portion of the<br />
reactor, and the freeboard section.<br />
A sampling train was constructed to collect samples of the plenum gas as well as<br />
the reactor off-gas. The sample stream was passed through a series of glass condensers<br />
and condensate receivers permitting the separation of condensibles from the<br />
234<br />
I<br />
,
!<br />
sample bottle, and subsequently incinerated.<br />
Feed Material Preparation<br />
The manure used was collected from paved feedlots at Kansas State University’s<br />
Beef Research Center. The manure had a moisture content of about 80% and was subse-<br />
quently flash dried to reduce the moisture content to about 8%. The dry manure was<br />
sieved to obtain three size fractions, namely; -2 + 8 mesh (0.45 cm), -8 + 14 mesh<br />
(0.19 cm) and -14 + 40 mesh (0.09 cm). The ultimate analyses of the three sizes of<br />
manure are presented in Table 1.<br />
Procedure<br />
The reactor was initially heated to the desired operating temperature using both<br />
the plenum and radiant burners. The temperatures in various parts of the reactor were<br />
monitored to establish a stable starting condition. The propane used in the plenum<br />
burner was burnt under starving air conditions to ensure an oxygen deficient atmosphere<br />
in the reactor. Gas samples (2 or 3) were taken from the plenum section for<br />
analysis before a run was initiated. Over the course of the sampling period, condensate<br />
was collected for a measured volume of the burner gas (saturated at the metering<br />
conditions) to determine the water content of the fluidizing gas.<br />
Manure was introduced into the reactor at a continuous prespecified rate, and the<br />
temperature profile of the reactor was closely monitored. Samples of the reactor offgas<br />
were taken with the simultaneous collection of condensate. Run durations were 30<br />
minutes to one hour. Feeding was then terminated and the char collected in the<br />
cyclone was weighed. Samples of the cyclone char were reserved for analysis. After<br />
the completion of each run, the char retained in the reactor was burnt with excess air<br />
and the ash produced was elutriated from the bed and collected in the cyclone.<br />
sample of the ash generated was also reserved for analysis.<br />
A<br />
The flow rates of the propane, air and injection water were noted during each run.<br />
The solid feed rate was determined by the difference in weights of solids in the hopper<br />
before and after the experiment. For each of the runs, the gas samples were drawn<br />
after flushing the sample bottles for about five minutes. The volumetric flow of gas<br />
through the wet test meter and the pressure and the temperature of the wet test meter<br />
were noted. The condensates collected were measured volumetrically.<br />
Chemical Analysis<br />
Gas analysis was accomplished using a Packard Model 417 Becker Gas Chromatograph<br />
equipped with thermal conductivity detectors. The gas components of interest included<br />
Hg, CO, CO2, CH49 C H49 C2H6, C3Hg, C H H S N2 and 02. Column packings used were a<br />
5A molecular sieve ?or the separa ion30a’H2~ A2, N , CO, and CH4, while the remaining<br />
components were separated using a column of Porapaz Q with a short lead section of<br />
Porapak R to shift the retention of water. The chromatograph was operated isothermally<br />
at 80°C with helium as a carrier gas. The instrument was calibrated with purchased<br />
calibration mixtures. Solid materials were analyzed with respect to their elemental<br />
composition (C, H, N, 0) using a Perkin-Model 240 Elemental Analyzer. The ash<br />
analysis was performed according to the standard ASTM procedure in a muffle furnace<br />
and the moisture content was determined by drying the samples in an oven for 3 hours<br />
at 373 K. The compositions of the solids ani gases given in this study represent the<br />
average of at least two determinations.<br />
Operating Conditions<br />
Gasif:-cation experiments were conducted by varying the operating tenperature, the<br />
feed size fraction and the gas superficial velocity. The arithmetic average<br />
235
etween the bed temperature and the freeboard temperature was taken as the operating<br />
temperature of the reactor. In all the experiments, the freeboard temperature<br />
was less than the bed temperature. The maximum temuerature difference<br />
observed ir, this study was 120 K and the averaqp temperature difference was 89 K.<br />
A sumnary of the operatina conditions is uresented in Table 2.<br />
Data Analysis<br />
Mass balance calculations were first performed on the plenum burner using the<br />
analysis of the dry plenum gas, the condensate collected and the flow rates of propane,<br />
air and injection water. The flow rate of the dry burner gas entering the<br />
reactor was computed by performing a nitrogen balance around the burner. An overall<br />
nitrogen balance on the reactor was then used to evaluate the dry off-gas flow<br />
rate with the aid of the off-gas analysis. For computing the amount of gas produced<br />
from the manure, it was assumed that the burner gas did not significantly<br />
take part in the reactions. The yield and the composition of the dry produced gas<br />
were computed as the difference between the dry off-gas and the dry burner gas.<br />
From the condensate collected for a unit volume of the burner gas, the total<br />
water content of the burner gas was computed using the volumetric flow rate of the<br />
dry burner gas. Similarly, the condensate associated with the dry off-gas was<br />
computed from the volumetric flow rate of the dry off-gas and the condensate data<br />
obtained for a unit volume of the dry off-gas. The liquid produced during gasification<br />
was computed as the difference between the two after making appropriate<br />
corrections for the water of saturation of the metered gases.<br />
To complete the overall material balance around the reactor, it was<br />
necessary to know the total amount of char produced. Since a portion of the<br />
char was retained in the bed, it was necessary to establish a procedure for eval-<br />
uation of the total char generated. Attempts were made to estimate the char in<br />
the bed by performing an inert balance on the ash produced during combustion and<br />
the char. This method was not very satisfactory since substantial amounts of the<br />
ash were carried past the cyclone to the scrubber and drain. From experimental<br />
observations, it was found that for any run, the elemental analysis of the<br />
cyclone char and the char retained in the reactor agreed with each other closely.<br />
Hence, the char retained in the bed was assumed to have the same composition as<br />
that of the cyclone char. The total char produced was estimated using the ulti-<br />
mate analysis of char and feed coupled with an ash balance on the reactor. This<br />
procedure was subsequently checked with a pelletized feed material, whose char<br />
could be separated out from the inert solids in the bed. The check indicated<br />
that the inert balance was a satisfactory approach.<br />
RESULTS AND DISCUSSION<br />
Approximately 100 experiments were conducted, 45 each for the -8 + 14 mesh<br />
and -14 + 40 mesh fractions and the remainder for the -2 + 8 mesh fraction. For<br />
each run, material balance calculations were performed to evaluate the quantity<br />
and the composition of the produced gas. Material balance closure ranged from<br />
80-115% with most runs closing to better than 90%. The higher heating value of<br />
the produced gas was calculated from its composition and the heating values of<br />
the individual components. The effects of superficial gas velocity and the feed<br />
size fraction were assessed from the results obtained.<br />
- Product Gas Composition<br />
To examine the influence of gas superficial velocity on the concentrations<br />
of the individual components of the produced gas, data obtained at different<br />
superficial velocities were plotted against the operating temperature for a given<br />
236
feed size fraction. These plots, presented in Figures 2 and 3 (for the -8 + 14<br />
mesh and the -14 + 40 mesh sizes) showed a minimal scatter (+1%) indicating that<br />
for the range investigated, the gas superficial velocity did not have a discernible<br />
influence on the produced gas composition. In these two plots as well as in<br />
the subsequent ones, the actual data points are not shown for the sake of<br />
simplicity.<br />
The effect of the size fraction used on the composition of the produced gas<br />
can be assessed by comparing Figures 2 and 3. For a given operating temperature,<br />
comparison shows that the concentrations of C2H6and C H are very close to each<br />
other for the two feed size fractions. The concentrazi&x of CH4, C2H4 and C02<br />
show similar trends in both cases. Their numerical values are in good agreement<br />
with each other up to an operating temperature of about 950 K. Beyond this temperature,<br />
the differences are more pronounced. The concentrations of H and CO<br />
complement each other in the two plots. A higher value of H2 concentragion is<br />
offset by a lower value of CO concentration and vice versa. It can also be seen<br />
that the concentration of C02 goes through a minimum in the two figures with the<br />
numerical values for the two size fractions being distinctly different.<br />
Figure 2 shows that for the -8 + 14 mesh size fraction, the concentration of<br />
H2 in the produced gas varied between 19% and 35% and that of CO varied between<br />
20% and 25%. In Figure 3 it can be seen that for the -14 + 40 mesh size fraction,<br />
the concentration of H2 varied between 15% and 50% and that of CO between 25% and<br />
15%. These two figures suggest that there is a distinct difference in the concen-<br />
trations of CO, H2 and C02 from the two size fractions.<br />
Limited data for the -2<br />
+ 8 mesh size fraction did not show an appreciable difference from the results for<br />
the -8 + 14 mesh fraction.<br />
Heating Value<br />
In Figure 4 the higher heating value of the gas produced at different gas<br />
superficial velocities is plotted against the operating temperature. It can be<br />
seen that the heating values go through definite maxima and then diminish. As in<br />
the case of the produced gas composition, for a given feed size fraction, the gas<br />
superficial velocity did not have a si ificant influence on the heating values.<br />
The deviation observed was 5 0.8 MJ/Nm'(+ 25 BTU/SCF).<br />
By comparing the two curves in Figure 4, the effect of the size fraction on<br />
the heating value of the produced gas can be assessed. For the size fraction of -8<br />
+ 14 mesh, the heating value increases from 10.43 MJ Nm3 (280 BTU/SCF) to 19.75 MJ/<br />
Nm3 (530 BTU/SCF) and then diminishes to 13.41 MJ/Nm 4 (360 BTU/SCF) over the temperature<br />
range studied. In the case of -14 + 40 mesh fraction, the heating value<br />
increases from 13.04 MJ Nm3 (350 BTU/SCF) to 18.26 MJ/Nm3 (490 BTU/SCF) and then<br />
decreases to 12.3 MJ/Nm 4 (330 BTU/SCF). These data indicate that the feed size<br />
fraction may have a marginal influence on the heating value of the produced gas.<br />
This trend was confirmed when the data were compared with a limited number of data<br />
obtained for a -2 + 8 mesh fraction of manure as shown in Figure 4. A comparison<br />
of the heating value curves for the three size fractions indicates that the smaller<br />
the size, the lower the heating value of the produced gas at temperatures above 900 K<br />
?he peak of the heating value curve shows a shift to the right as the qize fraction<br />
becomes larger. Also, as size increases, the peaks become narrower.<br />
Produced Gas Yield<br />
Figure 5 presents plots of the yield of dry produced gas (on a dry ash free<br />
basis) versus temperature for the different size fractions. The data points for a<br />
given size fraction showed a fair amount of scatter. The scatter was such that bands<br />
of IO.25 Nm3/kg about the lines shown in Figure 5 were needed to contain the data for<br />
237
a given size fraction. There were no discernible trends in the data to suggest that<br />
superficial velocity variations were responsible for the scatter observed. The<br />
average yield of dry produced gas ranges from 0.13 Nm3/kg (2.1 SCF/lb) at 820 K to<br />
0.86 Nm3/kg (13.8 SCF/lb) at 1020 K for the -14 + 40 mesh fraction. For the -8 + 14<br />
fraction the average yield ranges from 0.04 Nm3/kg (0.6 SCF/lb) at 820 K to 0.72 Nm3/<br />
kg (11.5 SCF/lb) at 1020 K. A limited amount of data for the -2 + 8 size fraction are<br />
also presented in Figure 5. The comparison shows a definite tendency for higher gas<br />
yields with smaller feed size fraction.<br />
A simple conceptual model for the gasification of manure can be envisioned to<br />
consist of the following steps: 1) Devolatilization of the solid to form char and<br />
volatile matter; 2) Thermal cracking of heavy volatiles to produce light components<br />
and char (carbon deposition) and gas phase water-gas and steam-hydrocarbon reactions.<br />
The yield of total volatiles in the first step will dictate the level of gas yield<br />
that can be obtained from the solid feed. The extent of thermal cracking and other<br />
gas phase reactions of the volatiles is determined by their time-temperature history.<br />
These reactions will establish the final ratio of gas to liquid and the gas composition.<br />
Thermogravimetric studies on manure have indicated that the devolatilization step<br />
starts around 420 K and is complete around 770 K [Howell, (611. Statistical analysis<br />
of additional data taken in this laboratory indicate that the heating rate employed<br />
(40 K/min to 160 K/min) has no effect on the devolatilization characterististics.<br />
Antal's work (10) on manure indicates a slight dependence on heatine rate (5 I;/min to<br />
140 K/min) but this was not examined to determine if it was statistically significant.<br />
Anthony and Howard (91, in their work with coal, \ave argued that hiah heating rates<br />
(10,000 K/sec) give a greater extent of devolatilization than can be obtained with<br />
normal TGA heating rates.<br />
Since the rate of heat transfer is very high in the fluid bed (1000 K/sec) and<br />
normal operating temperatures are well above those for completion of devolatilization,<br />
it can be assumed that the devolatilization step takes place instantaneously. Further<br />
more, for the range of temperature employed, it is anticipated that the variation in<br />
operating temperature has little effect on the extent of devolatilization. In this<br />
work comparisons are made at a given operating temperature and even if a temperature<br />
dependence of the devolatilization did exist, the Dhenomenon would not be a variable<br />
that influenced the comparison. Consequently the devolatilization phenomenon can be<br />
ruled out as a cause for the observed variations in gas yield for a given feed size.<br />
Anta1 (10) conducted studies of the vapor phase cracking reactions with volatiles<br />
produced from cellulose under conditions where the devolatilization phenoma was held<br />
constant. He found that at a given temperature, the amount of each component in the<br />
produced gas was affected by the residence time. His results indicated that for<br />
residence times up to about 5 seconds, the yield of the components such as CH4, CIH6,<br />
C2H4 and C H increased dramatically and beyond five seconds the effect was much ess<br />
pronounced? 6He also found that the amount of each component increased with temperature<br />
and in the case of both C3H6 and C2H6 the amounts of each passed through maxima as<br />
temperature increased.<br />
In the present work, the residence time of the gas in the reactor was calculated<br />
to be approximately six seconds. The variation in this value over the experimental<br />
range was about % 1 second. Since this value is more than five seconds and the variation<br />
observed is not extensive, it can be expected that the gas residence time does<br />
not have a significant effect on the data. This is corroborated by the experimental<br />
observation that the superficial velocity of the gas, which is related to the residence<br />
time, did not have a significant influence on the gas composition and heating value for<br />
a given feed size fraction and a given gasification temperature. However, the yields<br />
obtained with a given feed size fraction and temperature showed a significant scatter<br />
I
which is far beyond the bounds of variations that can be expected on the basis of<br />
the variations in the time-temperature history that the produced gases experience.<br />
One plausible explanation for the observed behavior might lie in possible varia-<br />
tions in the feed make-up as a consequence of segregation effects between batches.<br />
This is supported by the observation made during the test program that the gas yield<br />
data for a given batch of manure were consistent but varied from batch to batch for a<br />
given feed size and operating temperature. An examination of the elemental analysis<br />
of the different feed batches did not indicate significant variations in elemental<br />
composition. Since manure consisted of a mixture of stalks, hulls and other plant<br />
materials, it was next decided to examine possible variations in the cellulose content<br />
of these components. Whistler and Smart (11) indicate that a considerable variation<br />
in cellulose content exists for different parts of a plant as well as between different<br />
types of vegetation. For example, leaves contain 10-20% cellulose, stalks, 40-50%,<br />
hulls, 35% and cobs, 40% cellulose. Consequently segregation phenomena between batches<br />
could give rise to feeds with different cellulose content.<br />
The influence of cellulose content on the devolatilization characteristics of<br />
biomass materials was then examined. Howard et al. (7) reported on the maximum oil<br />
yield obtainable from different biomass materials. The maximum oil yield can be<br />
related to the extent of devolatilization that will take place for a given material.<br />
In their work with paper, sawdust and mixtures of the two, it was observed that the<br />
maximum oil yield increased in the order sawdust, mixture, paper. The cellulose<br />
content increases in the same order. Their study does not relate this observation<br />
to the gas yield, unfortunately.<br />
In order to examine this dependence further, limited data on the cellulose con-<br />
tent, TGA analysis and gas yields for cellulose, paper hardwood, softwood, manure<br />
and coal were compared. Table 3 presents the summary of the TGA results obtained by<br />
Antal (10) for cellulose, paper and wood and by Howell (8) for manure and coal. The<br />
cellulose content as well as the relative gas yield for some of these materials are<br />
also presented for comparison. The relative gas yield is for 970 K with the result<br />
for cellulose from Antal (10) and the remaining values from this laboratory. As<br />
these limited data indicate, it appears that the TGA results, gas yields and cellu-<br />
lose content show the same trends implying that increasing cellulose content may<br />
correlate with increasing devolatilization. This possible correlation needs to be<br />
examined further.<br />
It is quite possible in this work, that between batches, the cellulose content<br />
of the manure feed could have been different due to segregation. This difference<br />
could very well be responsible for the scatter observed in the produced gas yield<br />
for a given feed size fraction. In view of this, caution should be exercised in<br />
interpreting the influence of particle size on the gasification characteristics of<br />
biomass.<br />
For the different feed size fractions, variations in the material make-up were<br />
evident. The -2 + 8 mesh size fraction consisted of hulls and undigested grain.<br />
The -8 + 14 mesh size fraction was spherical in shape and had a small amount of<br />
undigested grain, whereas the size fraction of -14 + 40 mesh was comprised of fine<br />
strands of stalks.<br />
The differences in heating value and yield observed for different size fractions<br />
could well be due to variations in material make-up alone but it cannot be ruled out<br />
that particle size may also have some influence. Maa and Bailey (12) in their study<br />
on cellulosic materials, theorized that for particle sizes less than 0.2 cm in diam-<br />
eter, pyrolysis is reaction controlled and the particle size has no influence. In<br />
the present study the size fraction -14 + 40 mesh (0.09 cm) falls below this value,<br />
the size fraction -8 + 14 mesh (0.19 cm) is marginally below, while the size fraction<br />
-2 + 8 mesh (0.45 cm) is above the 0.2 cm size stipulated by Maa and Bailey.<br />
239
Consequently for this study size effects should not be important for the smallest size<br />
fraction but may be intruding for the other two sizes, especially the largest size.<br />
CONCLUSIONS<br />
Gasification studies were conducted with different size fractions of manure<br />
particles in a fluidized bed reactor. The effects of gas superficial velocity and<br />
feed size fraction on the gasification were studied at different operating temperatures.<br />
Superficial gas velocity did not appear to have a significant influence on<br />
the composition and heating value of the produced gas. The feed size fraction did<br />
have a definite influence on the composition, heating value and yield of the produced<br />
gas. The observations indicate that the yield increases and the heating value<br />
decreases as the size fraction becomes smaller. In the conduct of the experiments<br />
considerable scatter was observed in the gas yield obtained with different batches of<br />
feed for a given operating condition. A possible explanation for this behavior is<br />
offered which suggests that segregation phenomenon between batches of feed and SUbSequent<br />
variations in the cellulose content of the batch may be primary factors influencing<br />
the observed scatter. The apparent correlation between the cellulose content<br />
and the gas yield needs further examination.<br />
ACKNOWLEDGEMENT<br />
This is Contribution No. , Department of Chemical Engineering, Kansas<br />
Agricultural Experiment Station, Kansas State University, Manhattan, Kansas 66506.<br />
LITERATURE CITED<br />
(1) Engler, C. R., Walawender, W. P., and Fan, L. T.,<br />
Manure," Enviro. Sci. Tech., 2, 1152, 1975.<br />
"Synthesis Gas from Feedlot<br />
(2) Burton, R. S., "Fluid Bed Gasification of Solid Waste Materials," M.S.<br />
University of West Virginia, 1972.<br />
Thesis,<br />
(3) Smith, G. L., Albus, C. J., and Parker, H. W.. "Products and Operating<br />
Characteristics of the TTU Report," paper presented at the 76th National<br />
AIChE Meeting, Tulsa, Oklahoma, March 1974.<br />
(4) Halligan, J. E., Herzog, K. L., and Parker, H. W., "Synthesis Gas from Bovine<br />
Wastes," Ind. Eng. Chem. Process Des. Develop., 14, 64, 1975.<br />
(5) Mikesell, R. D., Garrett, D. E., and Hoang, D. C., "Amermal Process for<br />
Energy Recovery from Agricultural Residues," presented at the ACS<br />
Symposium in Advanced Thermal Processes for Conversion of Solid Wastes<br />
(6)<br />
and Residues, Anaheim, Ca., March, 1978.<br />
Beck, S. R., Huffman, W. J., Landeene, B. L., and Halligan, J. E., "Pilot<br />
Plant Results of Partial Oxidation of Cattle Feedlot Manure," Ind. Eng.<br />
Chem. Process Des. Dev. 18, 328, 1979.<br />
(7) Howard, J. B., Stephens, R. H., Kosstrin, H. and Ahmed, S. M., "Pilot Scale<br />
Conversion of Mixed Wastes fo Fuel, Volume I," Project Report to EPA,<br />
W. W. Liberick, Project Officer, 197:.<br />
(8) Howell, 3. A., "Kansas Coal Gasification,<br />
1979.<br />
M.S. Thesis, Kansas State University,<br />
(9) Anthony, D. B. and J. B. Howard, "Coal Devolatilization and Hydrogasification,"<br />
AIChE Journal, 22, 625, 1976.<br />
(10) Antal, M. J., Friedman, H. L., and Rogers, F. E., "Kinetic Rates of Cellulose<br />
Pyrolysis in Nitrogen and Steam," Fall Meeting, Eastern section, the<br />
Combustion Institute, Hartford, Conn., November 1977.<br />
(11) Whistler, R. L. and C.<br />
York, 1963.<br />
L. Smart, Polysaccharide Chemistry, Academic Press, New<br />
(12) Maa, P. S. and Bailie, R. C., "Influence of Particle Sizes and Environmental<br />
Conditions 0.1 High Temperature Pyrolysis of Cellulosic Materials - I<br />
(Theoretical)", Comb. Sc. Tech., 5, 1-13, 1973.<br />
240<br />
I
He<br />
C<br />
H<br />
N<br />
0 (by difference)<br />
Moisture<br />
Ash<br />
&c3 Plenum<br />
Figure 1. Flow scheme of<br />
II Waste U<br />
the Pilot plant.<br />
Table 1. Elemental Analyses of the Feed<br />
-2 + 8 mesh -8 + 14 mesh<br />
(wt %) (wt %)<br />
43.1<br />
5.8<br />
38.9<br />
5.4<br />
3.0<br />
26.5<br />
3.1<br />
30.4<br />
4.8<br />
16.8<br />
9.4<br />
12.8<br />
241<br />
-14 + 40 mesh<br />
(wt %I.<br />
41.1<br />
5.2<br />
3.3<br />
30.0<br />
6.6<br />
13.8
Feed Size Fraction<br />
Table 2. Summary of Operating Conditions<br />
-2 + 8 Mesh -8 + 14 Mesh<br />
Feed Rate (kg/hr) 11.0 to 17.2 11.9 to 30.2<br />
Reactor Temperature (K)<br />
-14 + 40 Mesh<br />
5.1 to 31.8<br />
900 to 980 800 to 1040 800 to 1040<br />
Superficial Gas Velocity (m/sec) 0.31 to 0.37 0.33 to 0.45<br />
0.33 to 0.45<br />
Injection Water Rate (kg/hr) 2.0 to 2.5 2.0 to 3.5 2.0 to 3.5<br />
Materials<br />
Cellulose<br />
Paper<br />
Cherry<br />
(Hardwood)<br />
Pine<br />
(Softwood)<br />
Cane<br />
(Sorghum)<br />
Manure<br />
Coal<br />
Table 3. Devolatilization Characteristics of<br />
Different Materials<br />
Total Devolatilization<br />
(weight 56)<br />
90<br />
85<br />
80<br />
70<br />
55-60<br />
30<br />
Relative Cellulose<br />
gas yield cont ent<br />
(weight X)<br />
11<br />
-<br />
7<br />
5<br />
3<br />
100<br />
58<br />
35-50<br />
0<br />
242
50<br />
-<br />
800 900 1000 1100<br />
0, -<br />
TEMPERATURE (K )<br />
Figure 2. Produced gas composition versus temperature for -8 + 14 mesh size.<br />
50 -<br />
800 900 1000<br />
TEMPERATURE ( K )<br />
Figure 3. Produced gas composition versus temperature for -14 + 40 mesh size.<br />
243<br />
1100
:\ 16<br />
:i 4<br />
2<br />
800 900 Io00<br />
TEMPERATURE (K)<br />
Figure 4. Gas higher heating value versus temperature.<br />
01 I I<br />
800 900 1000<br />
TEMPERATURE (K)<br />
Figure 5. Gas yield versus temperature.<br />
244
<strong>IN</strong>TRODUCTION<br />
LANDFILL GAS RECOVERY AT <strong>THE</strong> ASCON DISPOSAL SITE<br />
Robert P. Stearns and Thomas D. Wright<br />
SCS Engineers, 4014 Long Beach Boulevard<br />
Long Beach, California 90807<br />
The rapid rise in the cost of energy has prompted increased interest<br />
in the recovery and utilization of landfill gas (LFG) at :ocations<br />
throughout the United States. The U.S. Department of Energy (DOE)<br />
has estimated that the nation's solid waste landfills generate 200<br />
billion cubic feet of methane gas annually. Except for a few loca-<br />
tions, this potential resource is being lost to the atmosphere.<br />
Further, approximately 0.5 million tons of solid waste are added<br />
daily to active sanitary landfills in the United States.<br />
The generation of methane gas during the anaerobic decomposition of<br />
landfilled solid waste is a well-known phenomenon. Landfill gas typ-<br />
ically contains 50-60 percent methane. The balance is composed of<br />
carbon dioxide and trace quantities of many other gases. The rate<br />
of gas generation w i l l generally be highest during the first few years<br />
after solid waste burial and w i l l tend to decrease with time. The<br />
exact details of this time variation are not well known for full size<br />
landfills. Small scale experiments do not appear to simulate what is<br />
found in the field. For lack of a better understanding, it is often<br />
assumed that the long term gas gen'eration rate, after the first few<br />
years, can be described by an exponential decay and associated half-<br />
life.<br />
Theoretically, the maximum amount of methane which can be produced<br />
during the life of a gas-generating landfill is about 4.5 cu ft of<br />
methane per lb of refuse. This amount would not, however, be gener-<br />
ated in a reasonable time. Moreover, actual recovery w i l l be less<br />
than 100 percent. A maximum recovery of 1 to 2 cu ft of methane per<br />
lb. of refuse is considered reasonable at this time.<br />
Initial efforts at LFG recovery occurred in Los Angeles County at the<br />
Palos Verdes Landfill operated by the Los Angeles County Sanitation<br />
Districts in the mid-1960s. From this modest beginning, LFG recovery<br />
technology has been successfully applied at five other landfills and<br />
is under active consideration at another 17 locations nationally.<br />
ASCON SITE DESCRIPTION<br />
The Ascon disposal site is located in the Wilmington area of Los<br />
Angeles, California. The site was a former borrow pit and occupies<br />
an area of approximately 38 acres. Household and commercial rubbish,<br />
tank bottoms from refining operations, and oil field drilling muds<br />
have been disposed at the site since 1960 to an average depth of about<br />
60 feet. Soil is scarce at the site, and auto shredder waste is used<br />
as daily cover material for the compacted wastes.<br />
A portion of the site was formerly used as a storage area for petro-<br />
leum coke. Large quantities of water were added to these storage<br />
piles and resulted i n perched water and high moisture conditions with-<br />
in the landfill. Filling operations are scheduled to cease in 1980.<br />
245
FEASIBILITY STUDY<br />
A field test program was conducted during 1976 at the Ascon site by<br />
SCS Engineers under contract to the site owner, Watson Energy Systems,<br />
Inc. This test program was designed to determine if methane gas could<br />
be technically and economically recovered from the site. Three test<br />
wells were installed and pumping tests performed over a 3-4 month<br />
period to determi ne:<br />
0 Gas composition as a function of withdrawal rates from the<br />
test we1 1 s.<br />
0 Gas flow rates as a function of pressure drop.<br />
0 Influence area of withdrawal wells.<br />
During the field test program, preliminary negotiations were being<br />
conducted with an adjacent Shell Oil refinery for gas sales. Require-<br />
ments for gas processing and delivery specifications were identified.<br />
Results of the feasibility study indicated that up to 1170 cu ft per<br />
minute of LFG containing 500 to 550 Btulcu ft could be recovered from<br />
the site. This withdrawal rate was estimated to be sustainable for<br />
at least 6 years. User requirements for the LFG were also found to<br />
be acceptable - compression to 70 psi and moisture removal at 40<strong>OF</strong>.<br />
System design and installation proceeded and was completed in mid-<br />
1978. The LFG extraction system as originally installed was comprised<br />
of 24 vertical wells drilled to an average depth of 50 ft with asso-<br />
ciated header pipe collection system. PVC piping was used through-<br />
out the collection system. Wells were perforated for the lower 15<br />
to 20 ft and sealed from the surface with concrete and bentonite clay.<br />
The LFG compressor and cooling equipment utilized rebuilt equipment.<br />
A schematic of the gas withdrawal and processing system is shown in<br />
Figure 1.<br />
During the placement of extraction wells, a number of unanticipated<br />
conditions were encountered. First, landfilled wastes were more com-<br />
pact and had a higher moisture content than indicated by the feasi-<br />
bility testing. Secondly, as a result of high moisture levels, wells<br />
would partially fill with water after drilling. Standing water levels<br />
were as high as 30 ft deep in some wells. This water could be pumped<br />
out, however replacement by seepage occurred with time. Injector<br />
pumps were installed in the deeper wells to remove excess moisture.<br />
System start-up occurred in August 1978. Great variation existed<br />
in gas production rates of wells. Some wells were free-flowing and<br />
produced large quantities of LFG, while others were without positive<br />
pressure and yielded little or no gas, (even when considerable vacuum<br />
was applied). During the ensuing months, additional wells (averaging<br />
35-40 ft deep) were installed to tap more productive areas of the<br />
site. Several none-producinq wells were aband ned. A total of 60<br />
wells are now located on the-site.<br />
The system has been operating essentially cont<br />
1979 and is currently capable of delivering up<br />
user. Deliveries are averaging about 800 scfm<br />
246<br />
nuously since early<br />
to 1050 scfm to the<br />
(1.2 mmcflday). No
I-<br />
a m<br />
w w<br />
~m<br />
m<br />
w 3<br />
m a<br />
3 v<br />
I - w<br />
n w<br />
z w<br />
a< a<br />
w a<br />
JJ I<br />
JJ v<br />
?YE2<br />
v w w n<br />
z<br />
N n ~ a ~<br />
W Q I ~<br />
I-zvz<br />
0 4-X-4<br />
z 3 u w u<br />
n - 00<br />
Y<br />
w<br />
0<br />
L<br />
U K<br />
J (Lo<br />
w m<br />
I-m<br />
~ ~~<br />
w<br />
a<br />
W<br />
0<br />
z<br />
4<br />
I<br />
VK<br />
xw<br />
wm<br />
m<br />
I-3<br />
<br />
l-m i-J >a<br />
3<br />
v w m u<br />
W N<br />
w><br />
xa<br />
oz<br />
<<br />
24 7<br />
w z m<br />
JU
major operating d<br />
However, supervis<br />
adjustments. The<br />
with an alarm sys<br />
ECONOMICS<br />
fficulties or maintenance problems have arisen.<br />
on (8 hr/day) was found to be necessary for system<br />
system is also monitored by computer and equipped<br />
em which shuts the system down if problems occur.<br />
Tables 1 and 2 summarize the capital and operating costs associated<br />
with the installed system, respectively. Annual operating costs,<br />
including amortization of capital, average 45 percent of total in-<br />
stalled cost.<br />
Table 3 presents the estimated annual income from the system. As can<br />
be seen, a favorable economic return exists. The sales agreement<br />
between Watson Energy Systems, Inc., and Shell O i l pegs the value of<br />
the LFG to 70 percent of the value of #6 fuel oil on an equivalent<br />
Btu basis. Entitlements are earned by Watson Energy Systems, Inc.,<br />
under the applicable DOE program.<br />
GAS QUALITY<br />
Gas quality at the Ascon landfill has been consistant with methane<br />
concentrations averaging in excess of 50 percent. Gas obtained from<br />
the Ascon landfill is routinely analyzed (bi-monthly) by an indepen-<br />
dent laboratory. A typical result is shown in Table 4.<br />
Extensive analyses of gas obtained from one Los Angeles area landfill<br />
has identified more than 65 trace constituents in LFG. Trace compon-<br />
ents of the gas obtained from Ascon have been identified also. A<br />
sample analyses is contained in Table 5.<br />
FUTURE FOR LFG RECOVERY<br />
Increases in energy costs have given LFG recovery a needed "shot in<br />
the arm". An additional impetus is on its way from the U.S. Environ-<br />
mental Protection Agency (EPA). The Resource Conservation and Re-<br />
covery Act (RCRA) requirements for controlling migration of LFG as<br />
dictated by EPA's sanitary landfill criteria require methane gas con-<br />
centrations at the disposal site property line to not exceed 5 per-<br />
cent by volume. Methane gas concentrations in facility structures<br />
cannot exceed 1-1/2 percent by volume. These requirements w i l l ne-<br />
cessitate installation of LFG control systems at most sites. The in-<br />
stalled LFG control system may include some of the same facilities<br />
(extraction wells, pumps, etc.) required for an LFG recovery system.<br />
If the LFG must be removed, many enterprising site owners will active-<br />
ly seek a profitable market for the gas.<br />
Finally. DOE has become increasingly interested in LFG recovery.<br />
DOE is supporting a number of projects aimed at improving LFG re-<br />
covery technology. A number of new projects are likely to be support-<br />
ed under provisions of P.L. 96-126. Legislation supporting LFG re-<br />
covery has also been introduced at the Federal level.<br />
Thus, we can expect more LFG recovery projects<br />
fully, the beneficial effects associated with L<br />
some of the negative public reaction to landfil<br />
wastes, while contributing to our national fuel<br />
248<br />
n future years. Hope-<br />
G recovery can dispel1<br />
ing of our solid<br />
supply inventory.
Compressor/Gas Chi1 1 er<br />
We1 1 s/Header<br />
Discharge pipe1 ine<br />
Site work<br />
Instrumentation/Controls<br />
El ec tr i cal service<br />
Engineering<br />
TABLE 1.<br />
SYSTEM CAPITAL COSTS (1978)<br />
$103,000<br />
376,000<br />
35,000<br />
10,000<br />
100,000<br />
20,000<br />
65,000<br />
Total Capital $709,000<br />
TABLE 2.<br />
ESTIMATED ANNUAL OPERAT<strong>IN</strong>G COSTS (i979)<br />
Electrical Power (150,000 KW/mo. @ 56) $ 90,OOC<br />
Coripressor Maintenance (5% of capital cost) 5,200<br />
Maintenance Labor (8 hr/day @ $15) 43,800<br />
Admin. & Testing ($2500/mo) 30,OCr<br />
Amortization (7 yr. @ 12%) 155,400<br />
Total Operating $324,400<br />
TABLE 3.<br />
ESTIMATED <strong>IN</strong>COME FROM GAS SALES (1Y79)<br />
Direct Sales*: $517,000<br />
Entitlements': 137,000<br />
$654,000<br />
*1.2 mmcf/day @ 535 Btu/cf @ $2.45 mm Btu @ 90% availability.<br />
+ Estimated based on 65Q/mm Btu<br />
249
Constituent<br />
Methane<br />
Carbon Dioxide<br />
Hydrogen<br />
Oxygen<br />
Nitrogen<br />
*Average of several samples<br />
Constituent<br />
Acetone<br />
Ethyl mercaptan<br />
2-methyl furan<br />
Methyl ethyl ketone<br />
Benzene<br />
Toluene<br />
Terpene<br />
Ethyl benzene<br />
Xylene<br />
Butyl alcohol<br />
A1 pha terpinene<br />
Limonene<br />
C3 substituted benzenes<br />
C4 substituted benzenes<br />
Dichlorobenzene<br />
2-ethyl -1-hexanol<br />
C4 - C14 hydrocarbons<br />
*Sample date: May 15, 1979<br />
TABLE 4.<br />
MAJOR CONSTITUENTS - ASCON LANDFILL GAS<br />
TABLE 5.<br />
% (Volume)*<br />
55<br />
42<br />
0.5<br />
0.2<br />
1.2<br />
TRACE CONSTITUENTS - ASCON LANDFILL GAS<br />
250<br />
Parts per Mi 11 ion*<br />
32.5<br />
21.1<br />
6.9<br />
5.2<br />
5.5<br />
20.4<br />
12.4<br />
21.4<br />
14.9<br />
5.2<br />
11.1<br />
26.2<br />
9.8<br />
7.6<br />
4.1<br />
6.2<br />
114.2
i<br />
USE <strong>OF</strong> CORN COBS FOR SEED DRY<strong>IN</strong>C THROUGH <strong>GASIFICATION</strong><br />
Stanley L. Bozdech<br />
DEKALB AgResearch, Inc., Sycamore Rd., DeKalb, Illinois, 60115<br />
coupled with discoveries of the earliest uses of corn in the western hemisphere<br />
are indications that very early the cob was in general use as fuel for cooking,<br />
and firing pottery and brick kilns. Later the early famers of the United States,<br />
especially those in the Plains where wood was scarce, found that cobs could cook<br />
their meals and heat their homes. The petroleum age came, harvest systems changed,<br />
the cob was left to rot in the field. Today I would like to talk about that old<br />
fuel which the seed industry is attempting to mate to an old technology.<br />
seed industry generates enough by-products (cobs) to satisfy these needs for<br />
fuel-for drying seed. Gasification promises to be the technology to efficiently<br />
convert cobs to clean, controllable, heat for that purpose.<br />
I have been introduced. But let me introduce, very briefly, one company which<br />
creates the favorable environment and provides the support for a gasifier<br />
project, and many other developing technologies.<br />
In 1936, with the marketing of DEKALB's first hybrid corn seed, came the winged-<br />
ear trademark, touting this new product as the mortgage lifter for the corn farm-<br />
ers. Genetic research is the soul of the business; the production and marketing<br />
of hybrids, its physical manifestation. Today the hybrids are not only corn,<br />
but sorghum, wheat, sunflower, chickens, hogs; - all of which are distributed<br />
world wide.<br />
In later years DEKALB has diversified into the manufacture of irrigation equipment<br />
and electronics, into petroleum production, copper mining, commodity brokerage;<br />
but DEWB has always kept close to its central theme of "Food and Energy."<br />
The hybrid seed corn industry is unique. It's objectives, and therefore the<br />
seed conditioning procedures, are in no way similar to the grain handling industry.<br />
Nowhere is this more apparent than in the harvesting and drying operations. Seed<br />
corn is harvested early and with high moisture content. It is also dried on<br />
the cob, in large batch bins. Temperature of the drying air must be maintained<br />
below 110 degrees Fahrenheit to preserve the vitality of the germ.<br />
As early as 1972 DEKALB recognized cobs as a natural fuel for its seed drying<br />
operations. It took a them to dry a bushel of seed, but the cobs from that<br />
bushel contained about 1.3 thems. Cobs are good fuel, and have been conditioned<br />
with the seed. The market value of the cobs, at that time, at the plant site,<br />
was about 72 cents a million Btu's. This since has gone d m to about 34 cents.<br />
Natural gas costs are ten times that amount; propane twenty times. That spread<br />
would provide the capital for a conversion system for cobs, although driers are<br />
used only five weeks a year, each consuming 7,000 mcf of natural gas during that<br />
time. Readily available, good, cheap fuel is definitely an advantage. But the<br />
short season with low annual fuel consumption puts constraints on capital costs.<br />
Marginal fuel supply dictated an equipment development plan which would make use<br />
of tanpered combustion gases as the drying medium. Without heat exchangers, which<br />
are wasteful, the drying stream had to be relatively free of particulate matter<br />
and toxic gases. The batch drying system itself is a good filter for particulate,<br />
and it is soon apparent how clean a system is.<br />
In 1973 because of the high price of fuel oil in Europe, DEKALB's French associate,<br />
urn, invested in an incineration system for cobs, and piped the ccmbustion gases<br />
251<br />
The
to the driers. Today it is still used but with tubular heat exchangers which<br />
must be cleaned weekly. Its high particulate output without the heat exchanger<br />
is shown in Table 2.<br />
DEKALB, in the U.S., felt that since the French had done so well with everything<br />
but particulate, surely sane American technique could readily solve that problem.<br />
Two direct combustion units were installed in seed plants in 1976: - one a sophisticated<br />
incinerator with after-burners, which performed poorly; the other a<br />
torroidal unit for burning fine material in suspension, which in addition to<br />
high grinding costs, threw particulate as fast as the other units. Additionally,<br />
both units slaggcd badly. Both were complex, expensive, difficult to operate.<br />
The advantage of the nadir is that the only way out is up.<br />
evaluate our needs.<br />
In addition to the financial incentive, fuel interruption, therefore drying<br />
interruption, would expose a seed crop to frost and wipe it out canpletely.<br />
The machinations of bureaucracy in releasing emergency stocks are no match to<br />
the speed of the weather. We had to go ahead.<br />
For some time, we had been following<br />
the work of Sweden with wood gasifiers.<br />
"YF'ICAL ELFMWML ANALYSIS<br />
Cobs Oak<br />
The elemental and physical similarity<br />
between wood and cobs to us became<br />
more apparent. During the spring of<br />
Carbon<br />
YIdrogen<br />
Nitrogen<br />
44.96%<br />
6.10%<br />
2.42%<br />
50.49%<br />
6.59%<br />
_-<br />
1977 I made a quick tour of Europe,<br />
including Sweden, visited with all<br />
Oxygen<br />
Chlorine<br />
44.77%<br />
0.29%<br />
42.77%<br />
_-<br />
of the gasifier people available, Ash 1.46% 0.15%<br />
including several people who had been<br />
practitioners of the art during the<br />
Second World War. Additionally DEKALB<br />
researched, heavily, technical libraries<br />
in the United States.<br />
It was time to re-<br />
0.55% Dry<br />
Btu/lb. 7,215 8,810<br />
Table 1<br />
The result is a system specifically designed to dry grain with cobs, as seen in<br />
figures 1 and 2. It meets the criteria we had established at the outset.<br />
Although it requires more management than methane or oil fired equipment, the<br />
technology is attractive enough to be widely acceptable:<br />
-- Continuous operation<br />
-- Automated output control<br />
-- Five to one turn down ratio<br />
It also meets economic tests:<br />
-- Low capital costs<br />
-- Reasonable operating costs<br />
-- Serviceability<br />
-- Complete heat release<br />
-- Simple and direct operating techniques<br />
-- Safe operation<br />
-- Clean, efficient, heat output<br />
-- Complete utilization of the heat<br />
-- No fuel preparation costs<br />
-- Favorable fuel prices<br />
DEKALB's gasifier system is an atmospheric, up-draft, negative-pressured, system,<br />
powered by a single fan which discharges regulated, heated, gases to ;I seed<br />
drier. Starting at the right, a valve at the discharge of the fan modulates<br />
the complete system starting with the production of the gas in the gasifier.<br />
Dry cobs, as they cane from the sheller, whole or in bits and pieces, are fed,<br />
on demand, into the system through alternating slide grates which keep the system<br />
sealed. At the reactive zone, with the reduction in cob size, channeling has a<br />
tendency to occur. The agitator, in an adjustable cycle, keeps the bed packed.<br />
The grates are perforated stainless steel, and in operation are generally protected<br />
252
PLAN VIEW<br />
253<br />
COD - FUELED<br />
GRA<strong>IN</strong> WY<strong>IN</strong>G SXTEM<br />
DEKALB A 6RESWkl Ihk.<br />
GGICALB ILL 3-28-80
y layer of ash. At 1,900<br />
degrees there is usually some<br />
indication of slagging which<br />
appears as soft clumps of ash<br />
and carbon. While slagging<br />
is not completely eliminated,<br />
the horizontal, rotary, parered,<br />
Suspension<br />
Burner<br />
ash removal system breaks up<br />
and removes most slagged Hearth<br />
materials. Incinerato<br />
;sg:rator<br />
h-oducer gas leaves the<br />
Gasifier<br />
system at 700 degrees, carrying,<br />
as a vapor, tars that often<br />
cause serious problems in updraft<br />
units. In some earlier tests, tars PARTICULATE IMISSIONS <strong>IN</strong> P(XMDS/MN <strong>OF</strong><br />
going through the burner as drop-<br />
FUEL CONSUMED<br />
lets were not totally consumed and<br />
Table 2<br />
left a sticky coating on fans and drying<br />
equipment. The tars are in the gas stream; - the challange is to burn them.<br />
On extremely cold days, primary air at the burner has a tendency to condense the<br />
tars in the burner head. This can be overcome by feed back from the combustion<br />
chamber to heat the ambient. The primary air adjustment is manual. Once set,<br />
it responds with the pressure variations in the system and maintains a constant<br />
ratio.<br />
The design of the canbustion chamber offers the gas dwell time in high temperature<br />
environment to promote complete combustion. We are striving for stoichimetric<br />
conditions. Additionally the combustion enclosure offers the first chance to<br />
blend ambient air with combustion gases. Final tempering to 400 degrees is<br />
accomplished by a modulating iralve controlled by a sensor at the fan inlet.<br />
This fan discharges to a mixing chamber at the intake of the fan that supplies<br />
drying air to the corn bins. A thermostat in this final air stream controls<br />
the damper in the discharge of the fan, in the sketch, to provide a constant,<br />
correct, amount of heat.<br />
After one thousand hours running time on a 1.6 nnn Btu pilot unit and many hours<br />
on a full size 6 nnn Btu unit, we have enough answers for a strong positive<br />
program.<br />
The particulate emissions are now controllable without a heat exchanger. That<br />
expense is eliminated. The cobs produced from the dried seed w ill now satisfy<br />
fuel needs for drying the seed.<br />
Gas quality is good and burns well.<br />
Gas samples are taken just ahead of<br />
the burner. Analyses of the gases<br />
from two typical runs show sane<br />
variations, but Btu content<br />
stays within a range of 122 to<br />
143, which provides satisfactory<br />
ignition and canbustion.<br />
Although the system satisfies, in<br />
m y aspects, the definition of<br />
attractive technology, it is not<br />
a push button unit. One man can<br />
operate two units, if close together.<br />
Fuel is bulky and cannot<br />
mODUCTION GAS CCBFOSITION<br />
PERCEWME BY VOLUME<br />
Tests<br />
1 2<br />
N2 56+ 54+<br />
02 1.61 0.66<br />
c02 8.00 7.40<br />
H2 7.50 8.00<br />
co 24.72 27.10<br />
CH4 1.99 2.80<br />
Cob<br />
Moisture 11%<br />
Btu's/SCF 122 to 143<br />
Table 3<br />
254
e piped from a tank.<br />
Special handling equipment is necessary.<br />
The system does utilize all the thermal potential of the cob; sensible heat frm<br />
the gasifying process, which in some systems can escape to the atmosphere, is<br />
captured by placing the unit in the inlet air stream to the drying fan. Mechanically,<br />
the gasifier is simple. Most of the annual maintenance problems will probably<br />
come from deterioration of refractory during the 47 weeks of down time.<br />
The fuel, as it comes from the seed dryer, requires no further drying, nor does<br />
it need clasification by size, or grinding. We expect cob prices to stay low<br />
since demand for cob products has been severly depressed by substitutes with<br />
lower collection and processing costs. Electrical power consumption is low.<br />
The final table is an indication of comparative costs of the gasifier system over<br />
a petroleum-fueled system already installed. Cob handling equipnent is included<br />
in capital outlay.<br />
SEED DRY<strong>IN</strong>G COSTS PER BUSHEL-ANNLJAL BASIS<br />
Capital<br />
Depreciation charge<br />
Operating days<br />
Operating labor<br />
Operation electrical<br />
Cobs ($0.34/m Btu's)<br />
Propane ($5.45/m Btu's)<br />
Methane ($3.50/m Btu's)<br />
Maintenance<br />
Wlshels dried<br />
$/Bushel<br />
Methane<br />
34<br />
960<br />
116<br />
24,500<br />
400<br />
70,000<br />
$0.371<br />
29.7%<br />
Table 4<br />
Propane Gasifier<br />
141,000<br />
11,280<br />
35 35<br />
960 3,200<br />
116 1,920<br />
2,500<br />
38,150<br />
400 1,100<br />
70,000 70,000<br />
$0.566 $0.286<br />
97.9%<br />
The additional cost of using petroleum fuels is high and will probably advance at<br />
a fast pace. On new installations, where the capital cost for propane storage and<br />
firing equipment, or for methane transportation and firing equipment, must be<br />
considered, the figures are much more favorable.<br />
Finally, gasifiers for cobs protect the seed industry from sudden interruptions of<br />
drying fuel supplies. These interruptions, if they occur at certain times,<br />
could wipe out a complete year's work.<br />
DEKALB intends to start equipping its seed corn plants with gasifiers. Our<br />
system is not perfect, but in actual use, development will come faster.<br />
This gasifier system is particularly adapted to retro-fitting grain driers.<br />
Purdue is developing a cob separator for a combine which may solve the mechanical<br />
problems, but the economics of collection and transportation of cobs must be<br />
tested. In the Midwest, on-farm drying of grain uses 20 gallons of propane per<br />
acre to dry the 140 bushels of corn from that acre.<br />
If cobs are an available fuel, the gasifier concept can be used to provide fuel<br />
for internal combustion engines. Gas clean-up and efficiency become a problem.<br />
Energy lost in tars must somehow be recaptured. There is a need for this energy.<br />
The average irrigation pump in this country uses the equivalent of 50 gallons of<br />
diesel per year per acre.<br />
In addition, with the right fuel, the gasifier is an excellent biomass Combustion<br />
255
system for heat exchangers. Properly designed, emissions stay below EPA levels;<br />
cost is competitive with other systems; couplings are simple.<br />
We are excited about gasifiers. It will help DEKALB and its customers control<br />
rising costs. It may provide, under the right conditions, energy conversion<br />
hardware to the agricultural community. Above all, conservation and the divorce<br />
from the dependency of petroleum must start at the energy consumer. By the<br />
wise use of biomass in agriculture, substantial amounts of petroleum fuels and<br />
their transportation costs can be dislocated for other uses.<br />
256
IVTRODUCT ION<br />
PROCESS DEVELOPMEIT FOR BIOMASS L1f)UEFACTION<br />
Douqlas C. Elliott<br />
Pacific Northwest Laboratory<br />
operated by BATTELLE I4enorial Institute<br />
P. 0. Box c99<br />
Richland, bIA 99352<br />
The I!.S. Department of Energy’s Biomass Liquefaction Experimental Facility at<br />
Albany, Oreqon, was constructed for the purpose of developing biomass to oil conversion<br />
processes. Facility equipment was sized to process 1-3 tons per day of<br />
wood chip equivalent. Process development work has been underway at Albany since<br />
the summer of 1977. A multitude of reactant and product handling difficulties<br />
have resulted in numerous facility and process modifications. Presently, there are<br />
two main versions of the CO-Steam process being tested at Albany. The original<br />
process, called the Bureau of Mines Process (B0!l) because it was developed by researchers<br />
at the former Bureau of Mines facility near Pittsburgh, involves dried<br />
and ground wood chips slurried in a heavy oil medium. The newer process is called<br />
the LBL process, since it was developed by staff memhers of the Lawrence Berkeley<br />
Laboratory. In the LSL process wood chips are broken down into a pumpable water<br />
slurry by acid hydrolysis. In either process the slurry is then pumped into a<br />
high temperature, high pressure reactor wherein the biomass oil is formed through<br />
the action of carbon monoxide and steam under the influence of a sodium carbonate<br />
catalyst. The role of the Pacific Northwest Laboratory (PNL) in the process<br />
development effort has been twofold, 1) provide bench scale process development<br />
experimental support and 2) provide analytical support as needed. The bench scale<br />
work has involved for most part batch autoclave tests and this work has been<br />
reported elsewhere. t1>y3’’ This paper provides the details of the latest analytical<br />
work completed on the biomass derived oil.<br />
PROCESS DESCRIPTIONS<br />
BOM Process -<br />
The Albany facility was oriqinally constructed to develop the process of<br />
biomass conversion to fuel oil in a recycling oil slurry mode. As shown diaqrammatically<br />
in Firjure 1. I*lood chips are dried, qround and mixed with oil at 20-30%<br />
solids to provide a pumpable slurry. Anthracene oil, a coal tar distillate<br />
is used as the start-up slurry oil. This slurry along with carbon monoxide and<br />
aqueous sodium carbonate are pumped at high pressure 2000-4000- psig through a<br />
scraped-surface preheater and into a stirred tank reactor. The average residence<br />
time in the reactor can be varied from 20 to 90 minutes at temperatures<br />
ranaing from ’300°C to 370°C. After leaving the reactor the product is cooled<br />
and the pressure is let down into a flash tank where fixed qases and most of<br />
the water is removed. A major change in the original process flow is the replace-<br />
ment of the centrifuge in the product cleanup stage with a vacuum still.<br />
After<br />
pressure let down the product is reheated and flashed in the still where a light<br />
product oil is drawn off; a middle fraction is recovered and a portion is re-<br />
cycled for slurry makeup; and heavy product, solids and catalyst residue are<br />
removed from the still bottom. This is the extent of the unit operations at<br />
Albany, however, the total process plan would have the still bottoms pumped to<br />
a qasifier for production of CO/H2 qas feed for the liquefaction process.<br />
Sodium could be leached from the gasifier ash and could be recycled to the process<br />
probably after reaction with carbon dioxide from the offgas and gasifier product<br />
gas.<br />
257
LBI. Process -<br />
There are several basic differences betiween this process and that for which<br />
the Albany facility was designed. However, throuqh plumbing modifications the<br />
plant was made to operate in this mode, and, in fact, the first large scale wood<br />
oil production was by this process. By the ILBL process (Figure 2) the wood chips<br />
are reduced directly to a pumpable aqueous sliirry throuqh an acid hydrolysis step<br />
vithout preliminary drying and grinding. By this hydrolysis step the wood to<br />
water ratio can be maintained at a level equivalent to the wood to oil ratio used<br />
in the BO14 process. The aqueous slurry must then be made basic by sodium carbonate<br />
addition and then passes through the plant in the same manner as in the 11011 process.<br />
After pressure letdown a gravity separation is made of oil from water and the prod-<br />
uct can then be distilled as a clean-up sten. I!o recycle oil is used in the LBL<br />
process as it is essentially a once through process for the biomass. The aqueous<br />
stream will likely have to be recycled to recover the catalyst reSidfJeS and other<br />
soluble organics.<br />
PRODUCT ANAL YSJS<br />
After approximately 15 months of operation of the Albany facility in various<br />
configurations by the BO14 process, no pure (or nearly pure) wood derived oil had<br />
yet been produced. This was due to various mechanical difficulties. The major<br />
difficulty was the inability to remove residual solids from the product stream<br />
because the product clean-up centrifuge would not operate effectively in this<br />
process. The build-up of residual materials in the system led to increases in<br />
viscosity over time and the eventual plugging and shut down of the test run be-<br />
fore the start-uo oil could be effectively purged from the system.<br />
of LBL process tests at Albany in the sprinfl of l?7? led to the first production<br />
of nearly pure wood oil in !jay and the first large scale production of catalytically<br />
converted wood oil in September of 1979. This oil is the basis for the analytical<br />
work reported here. Que to the differences in the processes, primarily the acid<br />
hydrolysis step, it is likely that there will be some differences between the LBL<br />
process oil described here and that produced by the 11014 process. It has been<br />
suggested, based on the amount of degradation of the wood, that the major effect<br />
of the hydrolysis is to break down the hemicellulose with minor effect on the<br />
cellulose and little or no effect on the lignin portion of the wood.<br />
Vacuum Distillation Procedure -<br />
The initiation<br />
A vacuum fractional distillation of wood oil was performed by the use of an<br />
AST!I-D1160 distillation apparatus with a modified receiver which allows fraction<br />
collection while continuing the distillation under vacuum. The fractions collected<br />
are described in Table 1. Fraction ,+1 includes both the water which was dissolved<br />
or emulsified in the wood oil as well as a liqht oil fraction which was immiscible<br />
with water and distilled in the same temperature range. The codistillation could<br />
be the result of similar boiling points or may also be the result of a steam<br />
distillation phenomenon. The atmospheric true boiling points were calculated<br />
based on the instructions included in the E1160 procedure. The distillation was<br />
discontinued at the point that decomposition of the product in the still pot became<br />
evident. The decomposition point is approximately lOPF below that experienced<br />
for petroleum crude oils.<br />
Analysis of Distillate Fractions -<br />
A summary of the analytical data derived from the wood oil and its distillate<br />
fractions is presented in Table 2. The elemental analyses show a trend of increasing<br />
carbon content from the liqhter to heavier fraction and a stronger reverse<br />
trend in hydrogen content. The hydrogen to carbon atomic ratio as a result shows<br />
a trend from nearly 2 in the liqhtest fraction to less than 1 in the still bottoms.
Fraction<br />
#1<br />
$2<br />
f3<br />
$4<br />
#5<br />
Residue<br />
Fraction<br />
tl<br />
(Oil Layer)<br />
#2<br />
83<br />
('4<br />
#5<br />
Residue<br />
TP.7-136<br />
(Including<br />
8% I4ater)<br />
TABLE 1. Vacuum Fractional Distillation of Mod Oil<br />
ASTF1-Dl160 For Sample TR7-136<br />
Actual<br />
Amount<br />
Re1 at ive<br />
Amount -- Color<br />
TB?<br />
- atm<br />
T8P<br />
1 Onm<br />
.8 ml Light O i l<br />
'23 ml I.later<br />
3%<br />
8%<br />
C1 ear To 280<strong>OF</strong><br />
To 50°F<br />
45 ml 18% C1 ear<br />
To Yellow<br />
2n0-51 O<strong>OF</strong> 50-270°F<br />
35 ml 14% Green<br />
To Oranqe<br />
51 0-600°F 270-330°F<br />
an ml 16% Orange 600-720'F 330470°F<br />
20 9 8% Oranqe<br />
To Brown<br />
720-81 O0F 470-51 0°F<br />
86.6 9 72% Dark Above 810°F Above 510°F<br />
Brown (Pot at 630'F<br />
Decomposition)<br />
TABLE 2. Analytical Data for Distillation Fractions<br />
C H<br />
79.8 12.0<br />
77.2 9.3<br />
77.1 8.9<br />
79.2 8.9<br />
79.4 7.9<br />
32.3 6.5<br />
72.3 8.6<br />
-_<br />
N O<br />
0.0 9.7<br />
0.0 13.3<br />
0.0 13.4<br />
0.5 12.1<br />
0.2 12.3<br />
0.0 10.4<br />
0.2 17.6<br />
Atomic<br />
H/C<br />
1.31<br />
1.52<br />
1.37<br />
1.33<br />
1.13<br />
0.94<br />
1.41<br />
Hc<br />
C13 NMR<br />
Ali/Aro C<br />
16,000 12<br />
15,200 1.1<br />
15,100 1.0<br />
15,800 1.2<br />
15,100 1.0<br />
14,000 ---<br />
14,500 0.53<br />
H1 NMR<br />
Ali/Aro H<br />
30<br />
10.0<br />
7.3<br />
6.6<br />
5.3<br />
--_<br />
--_<br />
The oxygen content is less patterned in that it is lowest in the light distillate,<br />
maintains a higher nearly constant level through most of the distillate range then<br />
drops to a lower level in the still bottoms. This data is mirrored in the heats<br />
of combustion results for the various oils. It is interesting to note that the<br />
nitroqen appears for the most part in two of the heavier distillate fractions but<br />
not in the still bottom Elemental sulfur analysis puts the content at 0.006%<br />
for the total wood oil;T4) similar . . analyses for the distillate fractions were not<br />
performed.<br />
The use of proton and C13 nuclear magnetic resonance spectrometry (NMR) and<br />
infrared spectrophotometry has provided some insights into the chemical structure<br />
of the wood oil components. The C13 FIMR data shows a fairly even balance between<br />
saturated and unsaturated carbon in the distillate oils. However, proton MIR shows<br />
a much larger amount of aliphatic hydrogen in proportion to aromatic hydrogen. There<br />
is essentially no olefinic hydrogen. Aromatic compounds, as a result of molecular<br />
bonding and structure have a lower hydrogen to carbon ratio than aliphatics, (one<br />
259
or less for aromatic, greater than 2 for aliphatic). The disproportionately large<br />
amount of aliphatic hydrogen is an indication of the large amount of aliphatic substitution<br />
on the aromatic ring structures. This data is an average of dozens of<br />
chemical compounds and as such shows a trend of decreasing amounts of aliphatic compounds<br />
and of a1 iphatic substitution on the aromatic rings through the distillation<br />
range. The proton NMR data also show the presence of other functional groups such<br />
as furans in fraction F2 and naphthalenic and aromatic acid and ester compounds in<br />
fractions #4 and #5. The methoxy aromatic structure is very prominent in fraction<br />
62 but is also evident in the heavier fractions. Long chain oxygen containing alkyl<br />
groups disappear from prominence after fraction $7, however, the ethyl ether<br />
functional group remains prominent throughout. The infrared spectra of these fractions<br />
do not provide nearly so definitive results as the NMR spectra, however, they generally<br />
confirm the above-stated conclusions.<br />
Ne have thus far been able to identify a significant number of the actual com-<br />
ponents of the distillate fractions of the wood oil through the use of Gas Chroma-<br />
tography Mass Spectrometry (GCFIS). The components in Table 3 were identified by<br />
analysis of computer matched data. Those compounds listed w-ith a question mark could<br />
not be matched due to the limitations of the computer search library, but were<br />
determined by analysis of the mass spectra. In addition, the acid functional qroups<br />
shown in fraction 4 and fraction 5 were identified in derivatized (trimethyl-<br />
silylation) samples of the wood oil fractions. llork continues in this area as those<br />
compounds identified are not nearly all the compounds present, and no quantification<br />
of this analysis has yet been done.<br />
TABLE 3. Chemical Components of Wood Oil Fractions by GCMS<br />
-___<br />
Fraction #l<br />
Cg Diene<br />
rletliyl Cyclopentene<br />
(Two Isomers)<br />
Ilethyl Hexadiene<br />
?-Pentanone<br />
Dimethyl Hexadiene<br />
2 -!'ethyl Cycl open ta no ne<br />
';ethyl Cyclopentadiene<br />
Ethyl Benzene<br />
Cyclo Octane<br />
Diaethyl Heptene<br />
C3 Benzene<br />
Indan<br />
Guaiacol<br />
Furfural<br />
Ycthyl Indan<br />
(Three Isomers)<br />
Dimethyl Indan<br />
(Five Isomers)<br />
Ethyl Styrene<br />
Fraction til<br />
Methyl Pentenal<br />
Formyl Di hydropyran<br />
Dimethyl Furan<br />
(Two Isomers)<br />
Trimethyl Furan<br />
Guaiacol<br />
Furfural<br />
Ethylstyrene<br />
Para Cresol<br />
4-Flethoxy P heno 1<br />
Methyl Indan<br />
Dimethyl Phenol<br />
Ethyl Phenol<br />
Dimethyl Indan<br />
!lethyl Ethyl Phenol<br />
(Two Isomers)<br />
Trimethyl Phenol<br />
Dimethyl Ethyl Phenol<br />
Fraction #3<br />
Propyl Guaiacol<br />
Dimethyl Methoxy Phenol?<br />
Trimethyl Methoxy Phenol?<br />
C4 Nethoxy Phenol?<br />
C7 Phenol?<br />
CR Phenol?<br />
Dime thy1 Naphthol<br />
Trimethyl Naphthol<br />
Fraction i'4<br />
Methyl Naphthol<br />
(Two Isomers)<br />
Dimethyl Naphthol<br />
(Seven Isomers)<br />
Tr ime t hyl Naphthol<br />
A1 kylated Hydroxy Phenyl Acids?<br />
(W 133-206)<br />
Dihydroxy Acetophenone<br />
See Butyl Phenol<br />
Fraction<br />
~-<br />
Propyl Guaiacol Alkylated Hydroxy Phenyl Acids?<br />
(MI< 132-224)<br />
Additional analytical resu from petroleum crude oil test methods have also<br />
been produced for the wood oil .@? These tests, performed at Southern Petroleum<br />
Laboratories, Inc., are indicative of the difference between LBL process wood-derived<br />
nil and crude petroleum. The numbers in Table show that the wood oil is a heavy<br />
non-aliphatic oil. The hiqh solids and salt content will likely be reduced to nearly<br />
zero by the vacuum distillation step of product clean-up. Neutralization numbers for<br />
the distillable fractions of the oil ranqed from 17.7 to 5.3 when exoressed in units<br />
260
of mq KOWgr. The existant qum ranged from 621 to 827 mq/100 nl sample of the<br />
same distillable fractions.<br />
ECONO#IC ANALYSIS<br />
TkBLE 4. Analysis of LBL Process llood-derived Oil<br />
API Gravity 0 60°F -4.93<br />
Specific Gravity @ GO<strong>OF</strong> 1.12<br />
Density 0 60°F lbs/gal 9.31<br />
Pentane Soluble, Volume Percent 3.25<br />
Salt, lbs/1000 hbls 79.a<br />
Total Solids, BS8H 8.0<br />
From Reference 4<br />
An economic evaluation of the two proce@fs under study at Albany was performed<br />
and the results presented earlier this year. This study was undertaken with very<br />
little continuous pilot scale data available and as such provides only a rough<br />
estimate of the projected economics. It does indicate that with the present technology<br />
the product oil will be expensive. Table 5 is a sumary of the relevant data.<br />
TABLE 5. Cost Data for !,lood-derived Oil<br />
Capital Cost<br />
- LBL Process BOM Process<br />
2009 Green tonlday<br />
Product Cost<br />
439.5 million $56.1 Million<br />
$/Nillion BTU<br />
100% equity<br />
$ 7.98 $ 5.56<br />
$/!li 11 ion BTU<br />
65/35 debt/equity<br />
$ 0.59 5 6.72<br />
$ / bar re1<br />
100% equity<br />
545.7 $42.7<br />
$/barrel<br />
65/35 debt/eouity<br />
:lid 1979 constant dollars<br />
$37.8 $34.0<br />
15% DCF ROR on equity<br />
Debt interest rate 9; long term, 10% short term<br />
Idood cost at 1.25/millinn BTU (.511/green ton)<br />
From Reference 5<br />
These calculations are for a commercial sized plant including many unit operations<br />
which have not yet been demonstrated at the Albany scale of operation and as such<br />
are based to a significant degree on engineering judgment. The conclusion from the<br />
economic analysis was that the processes appear to he viable technically and that<br />
siqnificant cost reductions may be Dossible through process improvement and optimization.<br />
There are many remaining questions relative to the Albany processes.<br />
Process development work at DOE'S Experimental Facility should provide answers to<br />
these questions. These answers will likely have a significant effect on process<br />
costs, however, it is not entirely clear whether the costs will increase or decrease.<br />
An additional area which will require analysis will be the use of the wood oil as a<br />
petroleum substitute in chemical production. The separation and use of various<br />
chemical fractions of the wood oil is presently under study at PNL.<br />
261
CONCLUSIO!IS<br />
Hhen considered for use as a substitute fuel oil, wood oil as produced at<br />
Albany by the LEL process appears qualitatively to fall somewhere between petroleum<br />
derived "6 Fuel Oil and the synthetic oil derived from the Occidental Flash Pyrolysis<br />
process as shown in Table 6. !k!ood oil falls nearly half way between the other two<br />
oils in nearly all categories except that wood oil is very low in sulfur content.<br />
TACLE 6. Comparison of Some Fuel Oils<br />
---__<br />
C H N 0<br />
klood Oil<br />
Dry Vlood O i l<br />
72.3<br />
80.2<br />
0.6<br />
3.5<br />
0.2<br />
0.2<br />
17.6<br />
11.1<br />
(by calculation)<br />
#h Fuel O i l 85.7 10.5 7.0 0-3.5<br />
Oyrolytic Oil 57.0 7.7 1.1 31.2<br />
* Leqal sulfur l i m i t determined by use site,<br />
HC Density<br />
2 && Yoisture BTU/lb g/ml<br />
O.om .075 3.5 14500 1.15<br />
0.006 .<strong>OF</strong>F, 0.0 15800 --<br />
0-3.5'' 0.05 0.20 13200 1.02<br />
0.: 0.5 14 10600 1.39<br />
e.g., 0.352 maximum in Los Angeles County<br />
This comparison is valid on a chemical basis, however, as stated earlier the use of<br />
wood oil purely as a substitute fuel is not currently economically attractive.<br />
Despite the large amount of resources already expended on research of this process,<br />
it remains in a developmental stage and new technology could have a significant<br />
impact on the process economics. The alternate use of wood oil as a chemical feed-<br />
stock is also being studied.<br />
ACKNOWLEDGEMENTS<br />
I wish to acknowledge the support provided by other staff members at PWL, but<br />
particularly J. A. Franz who operated the tlMR and R. E. Schirmer who operated the<br />
GCilS. Also, I wish to thank those staff members at the Department of Energy's<br />
Fiomass Energy Systems Division who have provided the financial support for this<br />
work.<br />
REFERENCES<br />
1.<br />
2.<br />
3.<br />
4.<br />
5.<br />
Elliott, D.C. and blalkup, P.C., "Bench Scale Research in Thermochemical<br />
Conversion of Biomass to Liquids in Support of the Albany, Oregon, Experimental<br />
Facility", Presented at the Thermochemical Conversion Systems Coordination<br />
Meeting at Ballston Spa, NY, 26 October 1977 (TID 28415).<br />
Elliott, D.C. and Giacoletto, G.M., "Bench Scale Research in Biomass Liquefaction<br />
in Support of the Albany, Oregon, Experimental Facility", 3rd Annual Biomass<br />
Energy Systems Conference Proceedings, 5-7 June, 1979, SERI, Golden, Colorado,<br />
PP 123-130 , SERI/TP-33-225.<br />
Elliott, D.C., "Bench Scale Research in Biomass Liquefaction by the CO-Steam<br />
Process", presented at the 29th Canadian Chemical Engineering Conference at<br />
Sarnia, Ontario, Canada, 30 September-3 October 1979.<br />
Winfrey, J.C., "A Laboratory Evaluation of Biomass Oil (TR7-136)", prepared for<br />
Rust Enqineering by Southern Petroleum Laboratories Inc., Lab Report P77782,<br />
December 1979.<br />
Kan, A.Y., "Hydrocarbon Liquids and Heavy O i l from Biomass: Technology and<br />
Economics", IGT Symposium Energy from Biomass and Hastes IV, 21-25 January 1990,<br />
Lake Buena Vista, Florida.<br />
262<br />
i
STILL<br />
BOlTOMS<br />
VACUUM<br />
WOOD cnws<br />
COLD<br />
MOIST HOT<br />
GASES GASES<br />
FIGURE 1<br />
BOM PROCESS DIAGRAM<br />
STILL<br />
PREHEATER<br />
PREHEATER<br />
FIGURE 2<br />
LBL PROCESS DIAGRAM<br />
ACIO<br />
PREHEATER SEPARATOR<br />
263
Starch Hydrolysis for Ethanol Production<br />
Gerald B. Borglum<br />
Miles Laboratories, Inc.<br />
Industrial Products Group<br />
P.O. Box 932<br />
Elkhart, Indiana 46515<br />
Ethanol and ethanol-gasoline mixtures have been considered for use as fuel<br />
since the early days of the automobile. The abundant and less expensive petro-<br />
leum supply precluded extensive use of ethanol as fuel and only in the last few<br />
years has the general public become aware of and concerned about the dwindling<br />
and increasingly expensive petroleum supplies. Interest in extending gasoline<br />
supplies with ethanol-gasoline mixtures has increased greatly.<br />
Mankind since early recorded history has produced ethanol from simple<br />
sugars by anaerobic yeast fermentation. I w ill discuss the enzymatic production<br />
of the simple sugar, glucose from starch for conversion by yeast into ethanol<br />
and the contribution of enzyme cost in producing ethanol.<br />
Referring to Figure 1, starch is a polymer of glucose. The glucose units<br />
are joined in hemiacetal bonds between carbon one and carbon four for nearly all<br />
the bonds and between carbon one and carbon six for a small number of bonds<br />
which are branch points in amylopectin, one of the two types of starch polymers.<br />
The hemiacetal bonds are all alpha configuration, that is, in the Haworth struc-<br />
ture shown the carbon one bond to another glucose unit is below the plane of the<br />
molecule. Cereal grain starch is normally a mixture of two types of polymers:<br />
amylose, a linear glucose polymer, and amylopectin, a branched polymer.<br />
The process steps in converting starch to dextrose are gelatinization,<br />
liquefaction and saccharification. Starch is found in nature as insoluble,<br />
non-dispersible granules resistant to enzymic breakdown. Starch-bearing grains<br />
such as corn, wheat, rye and sorghum must be ground to a fine meal, at least<br />
12-16 mesh, to expose the starch granules to the slurrying water. Gelatiniza-<br />
tion is the swelling of the starch granule in the presence of heat and water.<br />
The starch loses its crystallinity and becomes an amorphous gel that can be<br />
attacked by enzymes. At this point, the starch or ground grain slurry thickens<br />
considerably and would be difficult to process if an alpha-amylase were not<br />
added to partially hydrolyze the starch to dextrins. The dextrin solution is<br />
much more fluid; thus, we say the starch gel is liquefied. The alpha-amylase<br />
serves to reduce the viscosity of the solution and also to produce a lower<br />
molecular size substrate. This smaller substrate molecule is needed for the<br />
efficient action of glucoamylase which hydrolyzes the dextrins to glucose.<br />
As described above, the hydrolysis of starch to glucose requires two types<br />
of enzymes. The alpha-amylase is a bacterial thermostable endo-amylase. It hy-<br />
drolyzes w1,4 bonds at random points in the starch molecule to rapidly reduce<br />
the viscosity of gelatinized starch solutions. This enzyme is a metal ion-<br />
containing protein and requires a small amount of calcium ion during use for<br />
maximum activity and stability. The action of alpha-amylase on amylopectin is<br />
illustrated in Figure 2; the action on amylose is identical. The enzyme cannot<br />
hydrolyze w1,6 bonds but can by-pass these branch points in amylopectin. The<br />
product of the reaction is dextrins - short glucose chains, and small amounts of<br />
glucose and maltose.<br />
Glucoamylase, produced by fungi, is an exo-amylase. It hydrolyzes the<br />
maltose and dextrins from the non-reducing end of the molecule. Glucoamylase<br />
hydrolyzes both a-1,4 and w1,6 bonds to completely degrade the dextrins to<br />
glucose. The enzyme is optimally active at pH 3.5-4.5 so pH adjustment after<br />
264
I<br />
saccharification is not needed for the yeast fermentation. The yeast fermenta-<br />
tion takes place at pH 3.7 - 4.<br />
The most plentiful and most commonly used cereal grain as source of starch<br />
is corn. The composition of the corn kernel is given in Table 1; the moisture<br />
content can vary considerably. With 16% w/w moisture the starch is typically<br />
61% W/W of the corn kernel. On a dry basis the starch constitutes 72% w/w of<br />
the corn composition. There are three cooking procedures used for starch gela-<br />
tinization and 1 iquefaction: atmospheric batch, pressure batch and continuous<br />
liquefaction. The mash concentration to use depends on the substrate, process-<br />
ing conditions and equipment. This step requires high temperature and solids<br />
concentration should be as high as can be handled to minimize the energy cost.<br />
Typical mash concentrations are 20-30% w/w dry solids for ground whole corn and<br />
2535% W/W dry solids for corn starch as substrate.<br />
Moisture<br />
Starch<br />
Protein<br />
Oil (Fat)<br />
Fiber<br />
Pentosans<br />
Sugars<br />
Minerals (Ash)<br />
TABLE 1<br />
Approximate Composition of the Corn Kernel<br />
Percent, As-Is Percent, DSB<br />
16<br />
61<br />
9<br />
3.8<br />
2<br />
5.3<br />
1.6<br />
1.3<br />
The substrate slurry, under continuous agitation, is adjusted to pH 6-6.5<br />
with lime slurry and 0.02% - 0.15% w/w Taka-Therm on dry starch basis (DSB) is<br />
added to the slurry depending on the cooking process as indicated in Table 2. A<br />
6OoC hold period is recommended for ground whole corn to ensure thorough hydra-<br />
tion. Starch gelation begins at 66OC and maximum viscosity is reached at 72'C.<br />
In the atmospheric and pressure batch processes the temperature rise may need to<br />
be slowed or, if necessary, the temperature held to allow the enzyme time to<br />
attack the starch and reduce the viscosity for efficient stirring. In the<br />
atmospheric batch process (ABL) the substrate is held at 9OoC-95OC until lique-<br />
faction is complete. This typically requires 30-90 minutes. The substrate<br />
should have a dextrose equivalent (DE) of at least 10-14 and should not give a<br />
starch-iodine blue color. The substrate in the pressure batch process (PBL) is<br />
held at 140°C-1630C for 15 minutes and then flash cooled to 9Oo-95OC. An addi-<br />
tional 0.1% w/w, DSB, enzyme is added and liquefaction completed as with the<br />
atmospheric batch process. In the continuous cooking process (CL) the substrate<br />
slurry is jet-cooked to 140°-1630C, held for five minutes at this temperature<br />
and flash cooled to 90°-95'. At at point 0.13% w/w, DSB, enzyme is added and<br />
liquefaction completed as for the atmospheric batch process.<br />
ABL<br />
c<br />
Taka-TherM:<br />
0.15% w/w, DSB<br />
Heat to 9Oo-95OC<br />
TABLE 2<br />
S t a rc hLiquefac t i on<br />
- PEL<br />
Taka-Therm:<br />
0.05% w/w, DSB<br />
Heat to 140°-1630C<br />
265<br />
72<br />
11<br />
5<br />
2<br />
6<br />
2<br />
2<br />
- CL<br />
Ta ka-Therm:<br />
0.02% w/w, DSB<br />
Jet cook to 140°-1630C
Flash cool to 9Oo-95OC, Flash cool to 9Do-95OC,<br />
add 0. I% w/w, DSB add 0.13% w/w, DSB<br />
Taka-Therm@ Taka-Therm<br />
Hold at 9Oo-95'C, Hold at 9O-9S0C, Hold at 9Oo-95OC.<br />
30-90 minutes 30-90 minutes 30-90 minutes<br />
There are advantages and disadvantages for the three processes. The at-<br />
mospheric batch process does not require pressure equipment and high pressure<br />
steam which are cost advantages. On the other hand, complete gelatinization and<br />
solubilization of high corn starch concentrations is difficult to accomplish in<br />
a short processing time at the lower atmospheric batch process temperature.<br />
Incomplete liquefaction gives a lower ethanol yield per unit mass of substrate<br />
or will require a longer yeast fermentation time, which are cost disadvantages.<br />
Diazyme@ L-100, a glucoamylase, is used to hydrolyze the dextrins to dex-<br />
trose for the yeast fermentation. The saccharification can be completed before<br />
the yeast fermentation or a continuous saccharification during the yeast fermen-<br />
tation can be used (Table 3). The first method is essentially that used in<br />
dextrose production. The liquefied starch is cooled to 6OoC, titrated to pH<br />
4-4.5 and glucoamylase added at 0.22% v/w, DSB. The enzyme level used is 100<br />
DiazymeB units per pound of dry starch. The mixture is held at 6OoC until a<br />
reducing sugar level of 95 DE or greater is reached; this takes 36-72 hours.<br />
Insoluble materials such as protein, fiber and fat can be removed at this stage<br />
if desired by centrifugation or filtration. The syrup is diluted to 19% w/w<br />
solids with water and cooled to 3OoC. Yeast is added for the fermentation.<br />
TABLE 3<br />
Saccharification and Fermentation<br />
Liquefied Starch: 6OoC<br />
pH 4-4.5<br />
0.22% v/w, DSB, DiazymeB L-100<br />
Compl e te<br />
Hold to 95 + DE<br />
(36-72 hours)<br />
Dilute to 19% w/w solids<br />
Continuous<br />
Dilute to 19% w/w solids,<br />
Hold 1-2 hours<br />
Cool to 3OoC and ferment Cool to 3OoC and ferment<br />
In the concurrent or continuous saccharification process the liquefied<br />
starch i s cooled, titrated to pH 4-4.5 and enzyme added as in the complete<br />
saccharification process. The mixture is diluted and held at 6OoC for only one<br />
to two hours to produce enough dextrose for the start of the fermentation.<br />
Dextrin hydrolysis to 40 DE is sufficient to give the yeast an initial rapid<br />
fermentation rate. The syrup is cooled to 3OoC and yeast is added for the<br />
ethanol fermentation. The glucoamylase action is considerably slower at 3OoC<br />
but the enzyme activity is great enough to keep the yeast supplied with dex-<br />
trose. DiazymeB L-100 also contains an alpha-amylase which aids in hydrolyzing<br />
the dextrins and starch which may have survived the liquefaction step.<br />
To calculate the efficiency of the fermentation we need to calculate the<br />
theoretical ethanol yield from starch. Referring to Table 4, in the hydrolysis<br />
of starch a water molecule is added across each glycosidic bond so one gram<br />
starch completely hydrolyzed would give 1.11 g glucose. From Gay-Lussac's<br />
equation the 1.11 g glucose would theoretically yield 0.567 g ethanol. Using<br />
266<br />
1
the density of ethanol we calculate the production of one gallon 100% ethanol<br />
from 11.59 pounds starch. In terms of corn as substrate and taking the weight<br />
of a bushel of corn to be 56 pounds containing 6% w/w starch, a bushel of corn<br />
would Yield 2.95 gallons of ethanol.<br />
TABLE 4<br />
Theoret i c m n o l Yield<br />
1.11 g glucose<br />
1.0 g starch + H20 -<br />
C6H1206<br />
1.11 g<br />
Bushel corn -<br />
0.567 g<br />
2.95 gallons<br />
61% w/w starch Ethanol<br />
4 2 C2HsOH + 2 Cop<br />
This theoretical yield does not take into account ethanol loss due to<br />
carbohydrate used for yeast growth and to carbohydrate used in the formation of<br />
small amounts of non-ethanol products by the yeast. A simplified biosynthetic<br />
pathway from glucose to ethanol is shown in Table 5. This is the Embden-<br />
Meyerhof-Parnas scheme for glycolysis. Glycerol and lactic acid are formed in<br />
small amounts compared to ethanol synthesis but contribute to give a yield less<br />
than stoichiometric formation of ethanol from glucose. Allowing for the growth<br />
of yeast cells and the formation of fermentation by-products the maximum fermen-<br />
tation efficiency is about 95% of stoichmetric yield.<br />
TABLE 5<br />
Ethanol Biosynthesis<br />
G1 ucose<br />
J.<br />
J.<br />
Glyceraldehyde-3-P04++Glycerol<br />
J.<br />
J.<br />
Pyruvic Acid 3 Lactic Acid<br />
J.<br />
J.<br />
Ethanol<br />
A fermentation will typically yield 2.5 gallons ethanol per bushel corn, an<br />
85% fermentation efficiency. In calculating the enzyme cost in producing a<br />
gallon of ethanol, I used the prices for standard packages of our enzyme products,<br />
a 55 gallon drum for Taka-Therm and a 200 liter drum for Diazyrne@ L-100.<br />
(Table 6) Theoretical ethanol yield is one gallon from 11.59 pounds starch.<br />
The recommended enzyme use levels are 0.15% w/w, DSB for the a-amylase and 100<br />
Diazyme@ units or one milliliter Diazyme@ L-100 per pound dry starch. The cost<br />
for the theoretical yield is 5.4 cents per gallon. For a yield at 85% fermentation<br />
efficiency the enzyme cost is 6.4 cents per gallon. The enzyme cost can be<br />
reduced by using lesser amounts of enzyme. One must take into consideration<br />
that an a-amylase level that is too low will give incomplete starch solubilization<br />
and concomitant loss of ethanol yield. A glucoamylase level that is too<br />
low will extend the fermentation time for the concurrent saccharificationfermentation<br />
process because dextrose is not produced as rapidly as the yeast<br />
can convert it to ethanol.<br />
267
Ta ka-ThermB<br />
D i azymed L- 100<br />
TABLE 6<br />
Enzymest<br />
Standard Pkg.<br />
500 lb. drum<br />
200 liter drum<br />
One gallon ethanol from 11.59 lb. starch.<br />
$1.35/lb.<br />
$2.625/1 iter<br />
Ta ka-Therm:<br />
11.59 lb. x 0.15% x $1.35/lb.<br />
Diazymed L-100:<br />
enzyme $0.0235<br />
11.59 lb. x Ulb x $2.625/2, enzyme 0.0304<br />
Total $0.054<br />
Fermentation at 85% efficiency $0.064<br />
268
FIGURE 1<br />
STRUCTURE <strong>OF</strong> STARCH<br />
269
<strong>IN</strong>TRODUCTION<br />
The NYU Continuous Acid Hydrolysis Process - Hemicellulose Utilization<br />
Preliminary Data and Comparative Economics for Ethanol Production<br />
Barry Rugg<br />
Associate Professor of Applied Science<br />
New York University, Department of Applied Science<br />
26-36 Stuyvesant Street, New York, N. Y. 10003<br />
There has been a recent increased interest in the possible comnercial utilization of<br />
waste biomass for both material and energy recovery due to the steadily rising price<br />
of fossil fuels. Currently employed methods for dealing with these solid residxs<br />
are inadequate for the cost effective utilization of their latent energy values;<br />
waste cellulose conversion via acid hydrolysis to xylose and glucose followed by<br />
fermentation to ethanol offers an attractive alternative. Additionally, as is<br />
shown in Figures 1 and 2, the xylose and glucose from cellulosic wastes coyld be<br />
used as the basic raw material for the manufacture of many "petrochemicals , or<br />
more precisely volume chemicals which are presently obtained from petrochemical<br />
feedstocks.<br />
Ethanol production from biomass sources is proposed to increase due to various government<br />
incentives to meet projected "Gasahol" production levels by 1985. A reliable,<br />
high yield, energy efficient process based on waste cellulose would have many advantages<br />
as compared to the more conventional grain processing technology now being<br />
utilized. The economic viability of ethanol from cellulose does not exclusively<br />
depend on by-product values, as does ethanol from grain, but would be most sensitive<br />
to the cost of the waste cellulose feedstock.<br />
The NYU continuous acid hydrolysis process has been utilized in the past primarily<br />
for the conversion of crystalline a-cellulose to glucose. Under the rather severe<br />
conditions of high temperature required for this process, the amorphous hemicellulose<br />
fraction primarily composed of pentosans in hardwoods is converted beyond the sugars<br />
to furfural. It has been the objective of our recent experiments to show the fiasibility<br />
of performing a continuous two stage hydrolysis which would allow foi, a mwe<br />
complete utilization of carbohydrate content. Conceptually, the pr,ocess is shown in<br />
Figure 3. By using a mild prehydrolysis and extraction, it is possible to reclaim<br />
a major portion of the hemicellulose fraction as xylose. Subsequently it is proposed<br />
to hydrolyze continuously the remaining hexosan fraction to glucose by the<br />
usual process.<br />
HISTORICAL REV I EW<br />
Acid hydrolysis of cellulose has been extensively studied for the better part of a cen-<br />
tury,particularly in connection with the manufacture of ethanol fran wood wastes. (1,2,3)<br />
Attempts to commercialize this technology in Europe and the U.S. occurred only at war-<br />
time when petroleum was cut off. A significant effort has been ongoing in the USSR.<br />
270
Cellulose derived from forestry, agricultural or municipal residues has three main components;<br />
crystalline a-cellulose, amorphous hemicellulose and 1 ignin. The cellulose<br />
fractions in these residues react differently when exposed to acid hydrolysis conditions<br />
because of their relative degree of molecular order or accessibility. The amorphous<br />
hemicellulose reacts to form sugars at conditions much less severe than those<br />
required for the crystal line a-cellulose conversion to glucose. (4)<br />
to extract the maximum carbohydrate value from cellulose residues, studies to accomplish<br />
a two stage hydrolysis in which the hemicellulose fraction is prehydrolyzed and ex-<br />
tracted prior to a concentrated sulfuric acid a-cellulose hydrolysis have been reported<br />
by Dunning et. al. and by Sitton et. al. (5,6)<br />
There exist, both economic and technical factors which favor dilute acid hydrolysis<br />
Of a-cellulose to glucose to be conducted at high temperatures for short times so as to<br />
maximize the glucose yield. Numerous kinetic studies, initially by Saeman and later<br />
Porteous, Fagan, Converse and Grethlein have been useful in the characterization of<br />
heterogeneous hydrolysis of various cellulose feedstocks. Porteous predicted a maximum<br />
sugar yield of 55% with 0.4% acid at 230°C, the yields being based on percentage<br />
conversion of available a-cellulose to glucose. The Fagan experiments were carried<br />
out with rather small samples (0.5 gms) of ball mill Kraft paper and verified the<br />
Porteous predictions.<br />
ment of improved process designs and economic data of waste cellulose and/or ethyl al-<br />
cohol production facilities (2,7,8,9, 10).<br />
Grethlein has recently proposed and built a plug flow pipe reactor in which nearly<br />
isothermal conditions can be maintained. Verification of previously developed data<br />
based on a batch reactor is currently underway. The kinetic model indicates that high<br />
temperature, short time dilute acid hydrolysis reactions favor the production of glucose<br />
versus its degradation. Yields of 80-90% of the available glucose may theoretically<br />
be obtained under ideal conditions. (11,121<br />
Experimental investigations on the dilute acid hydrolysis of waste cellulose to glucose<br />
have been carried out at the Department of Applied Science of New York University<br />
over the past five years. The waste cellulose feedstock employed in the initial studies<br />
was newspaper pulp.<br />
Therefore, in order<br />
Such kinetic studies are of considerable value for the develop-<br />
This experimental work involved an evaluation of the cost effective-<br />
ness of various pretreatments for enhancing the accessibility of the cellulose and the<br />
determination of the optimum reaction conditions for maximizing the sugar yields.<br />
The hydrolysis experiments were initially carried out batchwise with two differently<br />
sized stirred stainless steel autoclave reactors. The optimum reaction conditions were<br />
determined to be temperatures around 22OoC-230"C and reaction times of less than 30<br />
seconds with about 1 wt% of sulfuric acid. (13) These results agree quite well with<br />
the results of the kinetic rate studies which were previously reported by Porteous and<br />
Fagan. (9)<br />
More recently, over the past three years, studies at NYU have resulted in the design,<br />
costing and construction of a continuous waste cellulose to glucose pilot plant with<br />
a nominal 1-2 tonlday capacity. This pilot plant is based on the concept of employ-<br />
ing an intensive screw mixerlconveyor for continuously reacting waste cellulose at<br />
suitably elevated temperatures in the presence of acid.<br />
The key to successful operation of a continuous acid hydrolysis process is the design<br />
of the hydrolysis reactor. This reactor must be capable of feeding, conveying and discharging<br />
hydrolyzable cellulosic materials continuously while maintaining appropriate<br />
temperatures and associated pressures in a reaction zone. Because this hydrolysis<br />
requires ,exposure of the reactor components to dilute acids at high temperatures and<br />
pressures, all materials of construction have to be resistant to corrosion especially<br />
in the reaction zone.<br />
271
A Werner & Pfleiderer ZDSK53 (53m) twin screw extruder (Werner & Pfleiderer Corporation,<br />
Ramsey, N. J.) was selected on account of its capacity for conveying, mixing<br />
and extruding the required amounts of cellulosic feedstock. This machine allows<br />
accurate control of temperature, pressure, residence time, etc., within the previously<br />
established acid hydrolysis operating conditions while continuously feeding and discharging<br />
material.<br />
This equipment was obtained and installed at the Antonio Ferri Laboratories of New<br />
York University (Westbury, Long Island, N.Y.) and considerable progress has been<br />
achieved in the development and characterization of reaction conditions. Conversions<br />
of 50-60% yield based on available a-cellulose have been reported. (14) Experiments<br />
have been run with diverse feedstocks such as paper pulp (10% solids) and hardwood<br />
sawdust (95% solids). It is anticipated that significant increases in yield<br />
will result with improved process control.<br />
CONT<strong>IN</strong>UOUS ACID HYDROLYSIS STUDIES-HEMICELLULOSE UTILIZATION<br />
In the course of recent experiments to improve the level of carbohydrate utilization for<br />
the continuous acid hydrolysis process, the feedstock used was a mixed hardwood sawdust;<br />
A representative analysis of this is shown in Table 1.<br />
Table 1: Analysis of Mixed Hardwood Sawdust. (4)<br />
a-cellulose (crystalline)<br />
hemicellulosic glucan<br />
gl ucomannan (acetate)<br />
arabiogalactan<br />
4-0-methyl-gl ucurono (arabino) xylan (acetate)<br />
lignin<br />
Total<br />
% by wt.<br />
45<br />
21<br />
25 i>.’<br />
Analytical procedures for this complex system are being developed using high pressure<br />
liquid chromatography (HPLC). Initial determinations of sugar yields from hemicellulose,<br />
however, utilized a dual-wavelength spectrophotometric technique with orcinol reagent<br />
(15); this and similar early methods are unfortunately, subject to significant interferences.<br />
Initial prehydrolysi s experiments for the hardwood sawdust were directed toward the determination<br />
of reaction conditions (acid concentration, temperature and residence time) for<br />
satisfactory utilization of the hemicellulose fraction. Preliminary findings are presented<br />
in Figure 4. Subsequently, it is proposed to hydrolyze the residual a-cellulose fraction<br />
by previously described methods (13, 14)<br />
YIELD ANALYSIS - SUGARS AND ETHANOL<br />
For the purpose o f a preliminary analysis to determine the impact on ethanol yield of hemi-<br />
cellulose prehydrolysis, the chemical composition for hardwood sawdust is given in Table 1.<br />
The data given in Table I1 assumes 80% conversion of the hemicellulose to sugar (glucose,<br />
mannose, or xylose) and 60% conversion of the a-cellulose to glucose. A 45% conversion of<br />
all sugars is assumed to ethanol. Based on these assumptions, one could expect a yield of<br />
72.2 gallons of anhydrous alcohol per ton of dry hardwood sawdust.<br />
272<br />
100
L<br />
\ ;<br />
I<br />
PRELIM<strong>IN</strong>ARY ECONOMIC ANALYSIS<br />
A preliminarycost analysis of a plant processing 2000 tonslday of sawdust producing 48MM<br />
gallons of fuel grade ethanol is presented in Figure 5. The total plant investment cost was<br />
estimated at $25M in 1980. The plant scheme assumes the energy saving advantages of contin-<br />
uous fermentation and energy efficient distillation. The ligno-cellulosic residue is<br />
TABLE (I: YIELD ANALYSIS; BASIS 100 LB HARDWOOD SAWDUST<br />
or<br />
or<br />
Hemicellulose fraction (assume EO?? Conversion to sugars)<br />
a)<br />
3 Ib glucon x (180/162) x .8 = 2.26 Ib glucose<br />
5 Ib glucomannan (Ratio of glucose/mannose = 1/4)<br />
I Ib glucan x (180/162)a) x .8 = 9.89 glucose<br />
4 Ib mannon x (180/162)a) x .8 = 3.55 Ib mannose<br />
25 Ib 4-0-methyl-glucurono (arabino) xylan (acetate)<br />
(approximately 70% of weight due to xylan)<br />
25 Ib x .7x (l50/132?) x .8 = 15.96 Ib xylose<br />
a- cellulose fraction (assume 6Oyo conversion to glucose)<br />
a)<br />
45 Ib x (180/162) x .6 = 30 Ib glucose<br />
Hydrolyris Summary<br />
Glucose = 33.55 Ib<br />
Xylose = 15.96 Ib<br />
total sugars ~53.06 Ib<br />
Fermentation Yield (assume 45% conversion of sugars to ethanol<br />
53.06 Ib x .45= 23.88 Ib ethano1/100 Ib sawdust<br />
23.88/661 = 3.61 gallon ethano1/100 Ib sawdust<br />
3.61 x 20 =72.2 gallons ethanol/ton sawdust<br />
''ratio of molecular weight of glucose/glucan = mannose/mannan<br />
"ratio of molecul ar weight of xylose/xylan<br />
273
utilized to generate high pressure steam for continuous acid hydrolysis while the total<br />
plant is assumed to operate at a 91% capacity factor. The results of the analysis are<br />
quite promising assuming a $30/ton feedstock sawdust cost; at the current market price<br />
of $1.77/ga1 for anhydrous ethanol the plant would earn B40.8MM the first year. IF an<br />
80/20 debt/equity ratio is assumed, a conservative payback for the plant would be 1.84<br />
years.<br />
CONCLUSION AND FUTURE WORK<br />
The development of the NYU continuous acid hydrolysis process has been most favorable.<br />
The characterization of preferred reaction conditions for both hemicellulose prehydro-<br />
lysis and extraction followed by a-cellulose hydrolysis is continuing. Potential alco-<br />
hol yield with hemicellulose utilization is estimated to increase 70% beyond that with-<br />
out prehydrolysis.<br />
A data base for the utilization of various waste cellulose feedstocks is being developed.<br />
Preliminary studies on the fermentation of waste cellulose acid hydrolyzates is underway.<br />
ACKNOWLEDGEMENT<br />
The author would like to thank Robert Stanton, Peter Armstrong, Kuan Ming Ang, Adam<br />
Dreiblatt, and Saqib Jafferey for their efforts in carrying out the experimental and<br />
analytical aspects of the study. We would also like to thank Mr. Charles Rogers of<br />
The U. S. Environmental Protection Agency for his support of these studies under EPA<br />
Grant No. R805239-030.<br />
REFERENCES<br />
')Faith, W.L., Ind. Eng. Chem., 1945, 37, 1<br />
')Saeman, J., Ind. Enq. Chem., 1945, 37, 43.<br />
3)Forest Products Lab Report R1475, March 1945.<br />
4)Rydholm, S.A., Pulping Processes,<br />
1965, Interscience, Chapter 4.<br />
5)Dunning, J.W. and E.C. Lathrop, Ind. Eng. Chem., 1945, 2, 1.<br />
6)Sitton, O.C., Foutch, G.L., Book, N.L. and Gaddy, J.L., E, December 1979.<br />
7)Converse, A.O., et al., "A Laboratory Study and Economic Analyses for the A:ia<br />
Hydrolysis of Cellulose in Refuse to Sugar and Its Fermentation to Alcohol, Final<br />
Report under PHS Grant No. UL-00597-02. Thayer Sc'hool of Engineering, Dartmouth<br />
College, Hanover, N.H., 1971.<br />
8)Fagan, R.D., Converse, A.O. and Grethlein, H.E., "The Economic Analysis of the Acid<br />
Hydrolysis of Refuse," Thayer School of Engineering, Dartmouth College, Hanover, N.H.,<br />
1970.<br />
"Fagan, R.D., Grethlein, H.E., Converse, A.O. and Porteous, A.. Env. Sci. and Tech.,<br />
1971, 5, 545<br />
")Grethlein, Hans, E., "Comparison of the Economics of Acid and Enzymatic Hydrolysis of<br />
Newsprint," Biotechnology and Bioengineering, 1978, a, pp. 503-525.<br />
274
'"Thanpson, D.R. and Grethlein, H.E., Ind. Ens. Chem. Prod. Res. Dev.. 1979,<br />
la, 3.<br />
-<br />
12)Personal discussions, Hans Grethlein, Thayer School of Engineering, Dartmouth<br />
College, Hanover, N.H., January 1980.<br />
13)Rugg, B.A. and Brenner, W., Proceedings of the 5th Annual Research Symposium;<br />
Municipal Solid Waste: Resource Recovery, EPA-600/9-79-0236, August 1979.<br />
14)Rugg, B.A. and Brenner, W., Proceedings of the 7th Energy Technology Conference<br />
and Exposition, 24-26 March 1980, Washington, D.C. (Sponsored by Government<br />
Institutes, Inc., Uashington, D.C.)<br />
15)Brown, A.H., Arch. Biochem. 1946, 11, 269.<br />
275
Cellulose<br />
I<br />
I a-c el I u I os e I hem i ce I I ulosd<br />
I I<br />
Acid or Enzyme<br />
Hydrolysis<br />
Food Mannose<br />
C he mica1<br />
Conversion<br />
/<br />
Chemical<br />
Raw<br />
Materials<br />
Microbial<br />
'Conve r s i on<br />
Fig. 1: Waste Cellulose Utilization Routes<br />
Fe rm en ta t io n<br />
\<br />
Single<br />
,Ethanol<br />
Fuel-Methane<br />
Cel I Solvents Acetone<br />
Protein Chemicals<br />
Enz ym es<br />
Antibiotics<br />
276
E 9<br />
2<br />
0 .- +<br />
P)<br />
f<br />
x<br />
-I<br />
t<br />
277<br />
f<br />
(I"<br />
53<br />
E<br />
'El<br />
t<br />
E<br />
a3<br />
c<br />
0<br />
0<br />
L<br />
CI<br />
-<br />
W<br />
P<br />
0<br />
v)<br />
W<br />
c,<br />
a<br />
0<br />
L<br />
W -<br />
U .-<br />
v)<br />
v)<br />
0<br />
a<br />
..<br />
cv
Feedstock<br />
St orage<br />
Acid Hemicellulose<br />
Steam ~<br />
Acid L<br />
Steam -<br />
Prehydrolysi<br />
Conveyor<br />
s<br />
a -Cellulose<br />
Convey or<br />
Hydrolysis I<br />
1 Glucose<br />
Rich<br />
Ef f I u ence<br />
Hydrolyzed<br />
. ,Hemicellulose ,<br />
Fig .3: Schemat ic of continuous acid hydrolysis with<br />
hem i cellulos e ut iliz a t ion<br />
i
-<br />
90<br />
85<br />
80<br />
75<br />
70<br />
65<br />
60<br />
55<br />
50<br />
x" 45<br />
.- 6<br />
e<br />
40<br />
6<br />
V<br />
8 35<br />
30<br />
25<br />
20<br />
15<br />
10<br />
PRELIM<strong>IN</strong>ARY DATA ON <strong>THE</strong> EFFECTS <strong>OF</strong> ACID CONCENTRATION AND TEMPERATURE<br />
ON <strong>THE</strong> CONVERSION <strong>OF</strong> HEMICELLULOSE TO XYLOSE <strong>IN</strong> HARDWOOD SAWDUST<br />
Fig. 4<br />
0. 5%(w/w)<br />
8 P a 0.25%(y+<br />
300 302 304 306 308 310 312 314 316 318 320 322 324 326 328<br />
Average Reaction Temperature,o F<br />
319<br />
4
CELLULOSE<br />
RESIDUE<br />
2.000 TON PER DAY PLANT<br />
Total plant cost (1980):<br />
Conversion of hemi-cellulose to xylose:<br />
Conversion of a-cellulose to glucose:<br />
Conversion of sugars to ethanol:<br />
NET PR<strong>OF</strong>IT:<br />
HYDROLYSI S<br />
FERMENTATION<br />
0.50-<br />
--I-<br />
72.2 GALLONS<br />
ANHYDROUS<br />
ETHANOL<br />
SOLD AT 11.77/GAL.<br />
$75 million<br />
80%<br />
60%<br />
45%<br />
$122,980 per day, $40.8 million per yeor @ 91% copacity factor<br />
1.40<br />
1.90 -<br />
ENERGY<br />
COST<br />
5.71 OPERAT<strong>IN</strong>G<br />
COST<br />
25.29 OVERHEAD<br />
-COST<br />
66.30 TOTAL COST<br />
127.79 GROSS PR<strong>OF</strong>IT<br />
61.49 NET PRO.FlT<br />
PER TON SAWDUST<br />
PRODUCTION: 48 million gallons anhydrous ethanol per year from 666,000 tons sawdust<br />
FIG. 5: PRELIM<strong>IN</strong>ARY ECONOMICS <strong>OF</strong> CONT<strong>IN</strong>UOUS PREHYDROLY SIS<br />
ACID HYDROLYSIS, FERMENTATION AND DISTILLATION<br />
280<br />
!<br />
I<br />
I
I I<br />
Fuel Alcohol Production from Whey and Grain Mixtures<br />
K. M. Shahani and B. A. Friend<br />
Department of Food Science and Technology<br />
University of Nebraska<br />
Lincoln, Nebraska 68583<br />
I In the United States, because of recent increases in cheese production<br />
to nearly 4 billion pounds yearly, more than 38 billion pounds<br />
of fluid whey are generated each year. Although considerable advances<br />
have been made recently in developing novel approaches for the utilization<br />
of surplus whey, more than half of the whey produced is thrown<br />
away or dumped into the sewer. For example, in Nebraska only 140 million<br />
of the 700 million pounds of whey produced annually are used,<br />
while 560 million pounds are wasted.<br />
Liquid whey contains approximately 5% lactose, 1% protein and 1%<br />
fat and salts. As such, dumping huge quantities of whey down the drain<br />
constitutes a significant loss of a potential energy source as well as<br />
imposing a large biochemical oxygen demand on our waste water treatment<br />
facilities. Fermentation of the lactose to ethanol for use in gasohol<br />
(10% alcohol/90% gasoline fuel blend) is an attractive alternative in<br />
light of today's current petroleum shortages and ever increasing costs.<br />
Preliminary studies revealed that lactose in sweet as well as acid<br />
whey can be fermented into alcohol. Whey obtained from the manufacture<br />
of Cheddar, Mozzarella, Swiss and other hard cheeses is sweet whey,<br />
whereas the Cottage cheese whey is called acid whey because of its high<br />
acid content. To optimize the economics of the process, the highly<br />
nutritious and relatively expensive whey proteins were recovered by<br />
ultrafiltration and the resulting permeate used for alcohol production.<br />
One hundred milliliter aliquots of permeate were inoculated with a<br />
trained lactose fermenting -Kluyveromyces yeast or a combination of E.<br />
fra ilis and the classical alcohol producer Saccharom ces cerevisiae.<br />
as :hewn in Table 1, there were no differences in the'utilization of<br />
lactose or the production of ethanol when either the E. fragilis or the<br />
mixed culture was used.<br />
Table 1. Fermentation efficiency of selected organisms in sweet whey<br />
permea t ea<br />
Culture<br />
K. fragilis<br />
% Residual lactose % Ethanol<br />
12h 24h 2 4h<br />
K. fragilis + S. cerevisiae 0.25 0.12 2.0<br />
aThe whey permeate contained 5.1% lactose initially.<br />
Theoretically, 180 grams of lactose would be expected to yield 92<br />
grams of ethanol and 88 grams of carbon dioxide. The 5.1% lactose in<br />
whey would yield approximately 2.5% ethanol assuming 100% efficiency.<br />
A more realistic estimate of 70-75% efficiency would result in the pro-<br />
duction of 70 million gallons of ethanol from the 23 billion pound<br />
annual whey surplus in the U.S. According to our estimates (Table 2)<br />
281
the cost would be $1.02 to $1.07 per gallon of ethanol. These figures,<br />
however, are based on dry whey powder and do not take into account the<br />
unfeasibility of distilling a dilute ferment of 2% alcohol. Low energy<br />
concentration would be required in order to make fermentation of liquid<br />
whey economically feasible.<br />
Table 2. Costs for producing ethanol from dried whey powder<br />
Whey costsa<br />
By-product credit<br />
Direct costs<br />
Conversion<br />
Loan interest<br />
Indirect costs<br />
b<br />
Depreciation<br />
Taxes<br />
20% return<br />
aBased on 20 lbs of dried whey @ $5.50/cwt.<br />
bFigures adapted from Scheller (1).<br />
13<br />
8<br />
8<br />
$ 1.07<br />
Additionally, another process involving fermentation of whey:grain<br />
mixtures has also been developed in our laboratory. As shown in Fig.<br />
1, the whey permeate replaces the water required in the preparation of<br />
the grain mash. The amount of corn which is otherwise required is reduced<br />
proportionately to the amount of whey sugar in the process and<br />
the residual whey solids are part of the distiller's dried grain. This<br />
process requires no equipment modification other than the addition of a<br />
whey handling facility at the alcohol plant.<br />
Figure 3 shows the course of fermentation by E. fragilis when mash<br />
was prepared with sweet whey permeate and 20% less corn than normal.<br />
There appeared to be adequate sugar for fermentation by the E. fragilis<br />
as indicated by the production of approximately 12% alcohol in 60<br />
hours.<br />
Substitution of whole sweet whey or whole acid whey for the<br />
water also appeared to have no adverse effect on the fermentation. As<br />
shown in Table 3, the production was slightly higher in the early<br />
stages when whole whey rather than permeate was used. By 60 hours,<br />
however, the sweet whey permeate, sweet whey and acid whey all produced<br />
12% ethanol.<br />
At the present time studies are underway to compare the fermenta-<br />
tion efficiency of the K. fra ilis and a mixed culture of 5. fra ilis<br />
and 2. cerevisiae on whzy:gra?n mixtures with reduced grain a h<br />
comparison, on standard water mashes. Preliminary results indicate<br />
that up to 24% of the grain requirement can be replaced with the whey<br />
with no apparent loss in fermentation efficiency.<br />
A feasibility study is currently underway to utilize the whey:<br />
grain fermentation process for a 21,000,000 gallon alcohol plant in<br />
Wisconsin. Such a plant would require about 7.5 million bushels of<br />
corn and 96 million gallons of whey based on a 15% reduction in the<br />
282
Table 3. Ethanol production by 5. fragilis with various types of whey<br />
in a 20% reduced grain system<br />
~~~ ~-<br />
Substrate<br />
% Ethanol<br />
12h 24h 36h 48h 60h<br />
Sweet whey permeatea 4.4 6.7 10.9 11.8 12.2<br />
Sweet whey<br />
b<br />
b<br />
Acid whey<br />
7.4 10.7 11.5 11.7 12.1<br />
7.6 10.3 11.8 12.2 12.0<br />
aData are an average of four separate trials with duplicate<br />
samples taken at each time interval.<br />
bData are an average of three separate trials with duplicate<br />
samples taken at each time interval.<br />
corn requirement. The substitution of whey would amount to a savings<br />
of more than a million bushels of corn per year amounting to a total of<br />
nearly 3 million dollars or 14 cents per gallon of alcohol.<br />
References:<br />
1. Scheller, W. A. 1977. The Use of Ethanol-Gasoline Mixtures for<br />
Automotive Fuel. Proc. Symp. Clean Fuels from Biomass and Wastes.<br />
Institute of Gas Technology, Orlando, Fla.<br />
283
'/a ALCOHOL (wV)
A.R. Moreira and J.C. Linden<br />
Department of Agricultural and Chemical Engineering<br />
Colorado State University<br />
Fort Coll i ns , Colorado 80523<br />
D.H. Smith<br />
Department of Agronomy<br />
Colorado State University<br />
Fort Col 1 ins , Col orado 80523<br />
R.H. Villet<br />
Solar Energy Research Institute<br />
Golden, Colorado 80401<br />
SUMMARY<br />
Lignocellulose is an immense potential resource for the production of ethanol and<br />
other fermentation chemicals and fuels. The recalcitrant nature, however, of this<br />
material due to the high cellulose crystallinity and the lignin barrier has tended<br />
to make the process economics unattractive. As an alternative to woody biomass,<br />
vegetative forage crops may be good substrates for ethanol fermentation due to<br />
their low lignin content.<br />
In this research project, we have tested vegetative alfalfa, vegetative sudan grass<br />
and vegetative, mature and ensiled sorghum species as possible feedstocks for ethanol<br />
production. Results are presented here for the yield of sugars via cellulose<br />
hydroly is of these materials and for the projected alcohol production costs for a<br />
25 x 10 2 gallon/year plant. These costs ranged from $1.68/gallon for vegetative<br />
sudan grass to $2.58/gallon for vegetative alfalfa. Substrate costs comprised the<br />
major fraction of the total cost. This leads to the conclusion that a viable process<br />
economics depends on options such as the following: use of unconventional<br />
crops; stillage protein credit; co-hydrolysis of starch in immature grain component<br />
and sharing of feedstock production cost with mature grain harvest.<br />
Ii4TRODUCTION<br />
Diminishing fossil fuel reserves and recent dramatic increases in crude oil prices<br />
have prompted the United States and other oil-importing nations to develop renewable<br />
sources of energy.<br />
Solar energy could well contribute a significant portion of the United States energy<br />
consumption within the next decade. The potential in developing solar biotechnology<br />
is immense (l), not only for liquid fuels, but also for the range of petrochemical<br />
substitutes which can be produced fermentatively.<br />
Ethanol has received considerable attention because it can be used as a clean-burn-<br />
ing gasoline extender and octane-number improver. Moreover, since it can be conver-<br />
ted to other chemicals, it is likely to become a key chemical feedstock for a renew-<br />
able resources chemicals industry.<br />
In the near term, since fermentation technology based on easily fermentable substrates<br />
(such as sugar and starch) is established, these materials are being used to produce<br />
ethanol for gasohol. But tho feedstock cost represents a large fraction (more than<br />
285
50%) of the cost of producing ethanol. If grain prices were to rise dramatically,<br />
the final product cost of ethanol would soar.<br />
An alternative and relatively cheap substrate is lignocellulose. The processing<br />
technology, however is not fully developed as yet. Lignocellulose is not readily<br />
converted because of the crystallinity in cellulose structure and also since lignin<br />
shields cellulose and hemi-cellulose frm attack by enzymes.<br />
The only biological process which has been operated successfully at greater than the<br />
bench scale is based on municipal solid waste. In the Emert process (2) ethanol<br />
(190 proof) has been produced at 75 gallons/day from about 1 metric ton/day of waste.<br />
The development of alternative processing technology using thermophilic anaerobes,<br />
for converting lig-ocellulose directly to ethanol is being pursued (3,4 for example).<br />
Most cost analyses predict an ethanol production cost well above $1.40/gallon (5,6).<br />
In herbaceous plant materials, cell walls are composed of cellulose, lignin, hemicellulose<br />
and minor amounts of gums, pectins and other compounds. The major barrier<br />
to efficient hydrolysis of cellulose, either by acid or with enzymes, are complexes<br />
of lignin and hemicellulose with cellulose. While covalent bonds between these coinponents<br />
have been demonstrated (7), limitation of hydrolysis is thought to be primarily<br />
due to sheathing of cellulose microfibrils with the lignin hemicellulose<br />
matrix (8). Access of the hydrolysis catalyst and reactants to the glucosyl link-<br />
ages is retarded until lignin is removed.<br />
Because of the high cost of reducing lig-<br />
nocellulosic complexes to hydrolyzable form, it would seem reasonable to utilize<br />
sources of cellulose with minimal lignin content. During the growth and development<br />
of plant cells, lignification occurs at a stage after cellulose biosynthesis<br />
(9). This fact suggests that vegetative parts of plants may be a source of low<br />
1 ignin cell ulose.<br />
The possibility of using sorghum fiber for biomass and for papermaking pulp has al-<br />
ready prompted numerous agronomic and chemical studies (10,11,12). Sweet sorghum<br />
is attracting interest in this respect in all agriculturally productive regions of<br />
the United States; high sucrose hybrids suitable even for the northern states are<br />
now available. Potential for utilizing the sucrose invert sugar, and starch con-<br />
tents as substrates for ethanolic fermentation and for utilizing the fiber as a<br />
source of fuel energy or, alternatively, of synthetic gas is promising but is ham-<br />
pered by the relatively poor storability of harvested cane (13).<br />
The practice of ensiling forage materials has interesting potential as a means of<br />
storage of the fiber feedstock for alcohol production schemes. During ensiling the<br />
organic acids produced from soluble sugars by the LactobamZZus and Streptococcus<br />
bacteria may cause hemicellulose-lignin sheathing to break down, As a result the<br />
accessibility of water to cellulose for hydration and of enzymes for hydrolysis is<br />
reportedly improved (14).<br />
In the present work experimental results were obtained for the enzymatic hydrolysis<br />
Of low-lignin forage materials (alfalfa, Sudan grass and several species of sorghum)<br />
and a preliminary economic assessment for the alcohol fermentation of such hydroly-<br />
zates was made.<br />
METHODOLOGY<br />
The experimental basis for this study was conducted to determine whether biomass at<br />
an early vegetative stage of development was more readily hydrolyzed by cellulolytic<br />
enzymes than at the mature stage of development, which is characterized by extensive<br />
lignification. Representative samples of forage crop materials, including alfalfa,<br />
Sudan grass and sorghum in vegetative and mature growth were assessed by the extent<br />
of enzymatic hydrolysis of lignocellulose to glucose as a function of cellulose and<br />
286
I'<br />
lignin content. Experimental materials and methods used to obtain quantitative in-<br />
formation about forage composition and enzymatic hydrolysis have been detailed ear-<br />
lier (15).<br />
Ethanol production costs were obtained for a process flow sheet similar to the<br />
Natick process (6). A simplified diagram of the processing operations is shown in<br />
Figure 1. The process consists of mechanical grinding of the biomass, cellulase<br />
production, enzymatic hydrolysis of the lignocellulosic materials, filtration of<br />
the undigested solids, and production of 95% ethanol using conventional yeast fer-<br />
mentation and distillation technology. Enzyme hydrolysis is assumed to occur over<br />
a 48-hour period at an enzyme load of 10 IU/gram of substrate and without enzyme<br />
recycle.<br />
While the laboratory hydrolysis data reported in this paper was obtained at an en-<br />
zyme load of 86.7 IU/gram of substrate, it was found that hydrolysis performed at<br />
an enzyme load of 8.7 IU/gram of substrate over a period of 48 hours gave 95% of<br />
the original values. It is thus felt that the hydrolysis conditions used for the<br />
plant design will be representative of the laboratory data.<br />
Forage biomass culturing and harvesting costs were charged according to Saterson<br />
et a]. (16) at the following levels:<br />
--<br />
Alfalfa -___ $26.78/MT<br />
Sudan Grass --_- $1 7.75/MT<br />
Sorghum (any species) ---- $22.71/MT<br />
where the sudan grass cost was estimated assuming an average forage yield of 22.15<br />
MT/ha (16) and the same harvesting costs as for sorghum.<br />
A preliminary economic evaluation (f 25%) was then performed using the Natick information<br />
(6). Since the sole experimental data available was the 24-hour sugar yield<br />
from the enzymatic hydrolysis of the forage material it was felt that a complete<br />
plant design would be unreliable and somewhat premature at this time. The evaluation<br />
was then based on the assumption that the cost of producing 1 gallon of 95%<br />
ethanol (without charge for the cellulosic substrate) would be a constant and inde-<br />
pendent of the substrate.<br />
This assumption essentially means that, as long as the<br />
sugars are in the soluble form, the cost of producing ethanol is the same no matter<br />
what the sugar source is.<br />
The cost of ethanol production was $1.32/gallon accordinq to the ilatick report (6).<br />
at 1978 prices and with no substrate cost included.<br />
an01 production costs for our analysis, the Marshal<br />
update the equipment costs to the third quarter of<br />
1978 and of 606.4 for the third quarter of 1979 was<br />
increased at a rate of 7%/year over the Natick data<br />
culated on the same basis as in the Natick analysis<br />
In order to generate the ethl-<br />
b Stevens index was used to<br />
979. An index of 545.3 for<br />
used (17). Labor costs were<br />
The remaining items were cal-<br />
depreciation - l0l/year of total fixed investment<br />
plant on-stream factor - 330 days/year<br />
plant overhead - 80% of total labor cost<br />
taxes and insurance - E%/vear of total fixed investment<br />
This analysis generated an ethanol production cost of $l.ll/gallon. This cost does<br />
not reflect any pretreatment charges since there is no need for pretreatment steps<br />
when using vegetative forage crop materials. To obtain the total production cost<br />
a substrate charge was added to this cost. This substrate charge was calculated<br />
according to the following formula:<br />
Substrate charge =<br />
($/qallon 95% EtOH)<br />
(Glucos<br />
287
The main limitation of this economic analysis lies in the fact that a 10% glucose<br />
syrup after hydrolysis as assumed in the Natick study may not be possible for all<br />
the forage materials included in this work using an enzyme load of 10 IU/gram of<br />
substrate. This would make a concentration step necessary in some cases; however,<br />
since no data was available on the maximum substrate charge possible on the hydro-<br />
lyzer, no calculations were made in this study for this purpose.<br />
(Experimental)<br />
RESULTS AND DISCUSSION<br />
Lignin content is related directly to plant maturity. The conversion of the cellu-<br />
lose component of forage crops to glucose by enzymatic hydrolysis is related in-<br />
versely to the lignin content. Generally, hydrolysis of cellulose from young plant<br />
tissues is superior to that from mature tissues. In Tables 1 and 2 and in the fol-<br />
lowing paragraphs are presented examples of these findings from studies on alfalfa,<br />
Sudan grass, sorghum silage, and brown-midrib sorghum mutants.<br />
Mature alfalfa tissue contains proportionally more lignin than does younger tissue.<br />
The percent conversion of cellulose proportionally varies from 41 percent for the<br />
most mature tissue to 84 percent for the youngest parts of the plant. Fermentable<br />
sugar yields from the most easily hydrolyzed top segment of the plants are however,<br />
less than those from the mature bottom segment because of the higher cellulose content<br />
of the bottom fraction.<br />
Studies on whole plant samples of half-grown and mature sorghum supported the stated<br />
relationships between maturity, lignin content and cellulose hydrolysis. As<br />
an example, mature sorghum with 6.5 percent lignin gave 31 percent of theoretical<br />
conversion of cellulose while vegetative material with 3.1 percent lignin gave 47<br />
percent conversion. Mature sorghum, but not vegetative sorghum, contains consider-<br />
able fermentable sugars which are extractable from leaves and stalks.<br />
ences were compensating and resulted in similar glucose yields after cellulolytic<br />
hydrolysis of mature and of vegetative sorghums.<br />
Ensiling would provide a means of storage of vegetative feedstock and a biological<br />
process to improve the conversion of constituent cellulose. The hydrolysis of the<br />
silage of the same sorghum variety described above resulted in 71 percent theoretical<br />
cellulose conversion as compared to that from the mature sorghum equal to 31<br />
percent.<br />
The differ-<br />
Since the lignin content of the silage was equal to that of the mature<br />
material, changes in the fiber structure resulting from ensiling apparently improve<br />
accessibility of enzymes to the fibers. Hydrolysis of the cellulose in silage may<br />
be enhanced by the action of organic acids (pH 4) on the lignocellulosic structures<br />
over time. During enzymatic hydrolysis, the loss of the glucose product to the<br />
acid-forming LactobaciZZus and Streptococcus bacteria was prevented by addition of<br />
0.01% (w/v) of agricultural grade tetracycline hydrochloride. This level of anti-<br />
biotic did not inhibit the fetmentation of the hydrolyzed sugars by Saccharomyces<br />
cerevisiae.<br />
Unlike sorchum, Sudan grass in vegetative growth contained considerable amounts of<br />
sugars which were extractable from leaves and stalks. Cellulolytic hydrolysis<br />
added to the extractable 6.4 percent glucose and yielded a total of 20.4 percent<br />
fermentable sugar on a dry weight basis. This material contained 3.1 percent lignin,<br />
and the cellulose was converted to 56 percent of theoretical<br />
Conversions of cellulose averaging 75 percent of theoretical were obtained from<br />
brown mid-rib sorghum mutant lines. The average lignin content of these materials<br />
was 2.6 percent. The literature described mature bmr-mutants as having lignin content<br />
61 percent lower than isogenic lines (19). These mutants in vegetative growth<br />
contained 7.4 percent extractable glucose and upon hydrolysis yielded a total of<br />
288
23.7 percent glucose on a dry weight basis.<br />
(Economics)<br />
The results obtained by a detailed analysis of the bioconversion process of the<br />
various forage materials are shown in Tables 3 through 8. Observation of Table 3<br />
shows that the total fixed investment for a 25 x 106 gallonslyear ethanol plant<br />
is estimated at about 57 million dollars, or about $2/gallon of installed capacity<br />
which is considered a reasonable figure by most of the researchers working in this<br />
area. Start-up and working capital estimates bring the total capital investment<br />
to about 71 million dollars.<br />
Table 4 presents a breakdown of the ethanol production costs from the forage crops,<br />
without a substrate charge. :.lo pretreatment costs were included in this table<br />
since these materials do not require such pretreatment. As a consequence, the<br />
processing costs are estimated at $l.ll/gallon, well below the $1.30-$1:75/gallon<br />
range reported by other researchers (5,6). Enzyme production is the major factor<br />
in the ethanol cost (53% of the total), followed by fermentation and distillation<br />
(30%) and hydrolysis (171). This finding stresses once more the need for strong<br />
research efforts in the area of cellulase production.<br />
Estimates for the ethanol yield from the forage crops included in this study are<br />
shown in Table 5. These estimates are based on a 45% ethanol yield from glucose<br />
during anaerobic fermentation. As expected, sudan grass and the brown midrib mutants<br />
of sorghum show the highest potential with respectively 276 and 250 gallons<br />
of EtOH/acre-year. The ensiled sorghum materials show the second best possibility<br />
with an ethonol yield close to 220 gallons/acre-year.<br />
Vegetative Frontier 214 sor-<br />
ghum and vegetative alfalfa rank at the bottom with respectively 109 and 97 gal/<br />
a cre-yea r .<br />
The estimated total production costs are shown in Table 6. These costs show that<br />
vegetative sudan grass and brown midrib mutants of sorghum are the most promising<br />
substrates with the ensiled sorghum crops being the second best. Total ethanol<br />
production costs are now at least $l.G8/gallon, with alfalfa and Frontier 214<br />
sorghum reaching $2.58/gallon of 95% EtOH.<br />
A breakdown of the total production costs presented in Table 6 can be seen in Table<br />
7. It can be observed that substrate costs represent the major fraction of the to-<br />
tal cost, ranging from a minimum of 34% t o a maximum of 57%. Enzyme costs rank<br />
second, ranging from 23 to 352, followed by fermentation and distillation costs<br />
which vary from 13 to 20% of the total. Hydrolysis costs represent the minor frac-<br />
tion, varying from 7 to 11% o f the total production costs.<br />
Table 8 shows the estimated total ethanol production costs for a fermentation yield<br />
of 50% (weight of ethanol/weight of glucose). As expected, a decrease in the production<br />
costs relative to those in Table 6 is observed, reflecting the smaller quantity<br />
of forage raw materials required for the same ethanol production rate. The decrease<br />
averages about lO&/gallon and reflects the high cost of the raw materials and<br />
the need for an efficient substrate conversion at all stages of the process.<br />
COdCLUSIONS<br />
The production of ethanol by fermentation of the glucose obtained via enzymatic<br />
hydrolysis of the vegetative forage crops considered in this study requires further<br />
research and development before economic feasibility can be attained. The total<br />
production costs ranged from $l.G8/gallon for vegetative sudan grass to $2.58/ga1.<br />
for vegetative alfalfa. These high costs are not totally unexpected since the forage<br />
crops considered here have a high cash value. It should be noted that the costs<br />
obtained in this study do not account for the use of reducing sugars other than<br />
289
glucose and do not include any byproducts credit; if proper account of these credits<br />
were observed, the costs reported in this study could be lowered by as much as 54t/<br />
gallon. Since no pretreatment is required for the vegetative forage materials, pro-<br />
cessing costs are about 30% lower than other published processing costs (6).<br />
represents a considerable advantage of vegetative forage crops over other 1 ignocel-<br />
lulosic materials.<br />
Substrate costs constituted, in most instances, the major fraction of the total pro-<br />
duction costs, varying from 34% to 57%. In view of this, an efficeint substrate<br />
conversion must be obtained at all stages of the process. Enzyme production costs<br />
were also very important, ranging from 23 to 35% of the total cost; this indicates<br />
the need for continued research on cellulase production technology.<br />
The total capital investment for a 25 million gallonslyear ethanol plant was found<br />
to be about 71 million dollars. This represents a fixed capital investment of about<br />
$2/gallon Et0l-l capacity.<br />
In order to reduce substrate costs, one might either look for less expensive means<br />
of culturing and harvesting the crops or to coupling to other operations whereby the<br />
lignocellulosics obtain a discounted value. Examples could be coupling alfalfa<br />
hydrolysis to a soluble protein extraction operation or harvesting sorghum grain and<br />
stalks simultaneously but separately.<br />
whose culture is indigenous to a growing area. Such unconventional plants may have<br />
the same processing costs, yet may be obtained for zero to ten cents/gallon of eth-<br />
anol product.<br />
These studies were definitive in showing how hydrolysis and endogenous sugar levels<br />
influence the yield of fermentable sugar. This yield is also proportional to the<br />
biomass yield. Saterson et al. (16) in work supported under a D.O.E. contract to<br />
A.D. Little Corporation and Jackson (20) at Battelle Columbus Laboratories screened<br />
herbaceous plants for potential biomass production in ten regions of the contiguous<br />
United States.<br />
Some were unconventional as food and forage crops, but were good candidates in terms<br />
of their projected biomass production potential. Crops appropriate for the Great<br />
Plains included 14 species of grasses and legumes and 9 species of unconventional<br />
crops and/or weeds. The comparative analysis of Heichel of cultural energy require-<br />
ments placed such crops high with respect to total energy yield (21). Sweet sorghum<br />
rated highest in that study, but in terms of practical ener y recovery, cane storage,<br />
and juice expression present major difficulties at present q22).<br />
Future crops for alcohol fermentation may include other traditional food crops, certain<br />
weeds, syrup sorghum, Jerusalem artichoke, and the forage grasses. The latter<br />
are adapted to a wider range of growing conditions than other crops and are the more<br />
productive under adverse conditions. Since they are grown primarily for plant material<br />
they are more likely to produce significant yields of biomass than othercrops.<br />
They possess the more efficient photosynthesis route, permit multiple cuttings which<br />
maintain the plant at a high rate of photosynthesis for a large part of the growing<br />
season, have low water requirements, and their culture requires less energy than<br />
other crops. The use of such crops as raw materials may bring the cost of fermentation<br />
ethanol down to the economically viable range.<br />
The high cost of feedstock is a major barrier to the conversionof biomass to alcohol<br />
fuels (4). In order to reduce substrate costs, one must optimize the efficiency of<br />
either production or conversion. Production costs are reduced when yields are increased,<br />
when means of culturing and harvesting are the most energy efficient in<br />
terms of cultivation, irrigation and fertilization, and when the harvesting costs<br />
can be discounted, as with the simultaneous collection of grain and straw. Conversion<br />
costs are relatively reduced when the biomass requires no pretreatment in order<br />
to obtain high percentage of cellulose hydrolysis, when a significant proportion of<br />
This<br />
Alternatively, one may obtain other substrates<br />
Many were plants whose culture was indigenous to a growing area.<br />
290
the plant dry matter is soluble fermentable sugar, and when the fermentation system<br />
can utilize both cellulose and hemicellulose hydrolysis products.<br />
For these reasons, it is important to study simultaneously the agronomic and bio-<br />
chemical aspects of a potential biological conversion feedstock as a production-<br />
conversion system (1). An advantage gained by the production of great quantities<br />
per unit area of biomass is offset if the cellulose is resistant to hydrolysis.<br />
On the other hand, materials containing relatively little lignin can be hydrolyzed<br />
very efficiently and would be very attractive as feedstock if biomass yields were<br />
reasonable. The balance between the potential for production and conversion must<br />
be known in a controlled comparative experimental setting.<br />
1. Villet, R.H. 1979.<br />
REFERENCES<br />
Biotechnology for Producing Fuels and Chemicals from Biomass:<br />
Recommendations for R&D.<br />
Energy Research Institute.<br />
Vol. I. SERI/TR-332-360. Golden, CO: Solar<br />
2. Emert, G.H. and R. Katzen, (1979). Chemicals from Biomass by Improved Enzyme<br />
Technology. ACS/CSJ Joint Chem. Congr. Hawaii.<br />
3. Wang, D.I.C., I. Biocic, I., H.-Y. Fang and S.-D. Wang. 1979. Direct Microbiological<br />
Conversion of Cellulosic Biomass to Ethanol.<br />
Biom. Energy Syst. Conf. p. 61.<br />
Proc. DOE 3rd Ann.<br />
4. Pye, E.K. and A.E. Humphrey. 1979. Production of Liquid Fuels from Cellulosic<br />
Biomass. Paper presented at the Third Annual Bimiass Energy Systems Conference<br />
DOE meeting, Golden, CO. June 5-7, p. 69.<br />
5. Wilke, C.R., R.D. Yang, A.F. Scianianna and R.P. Freitas. 1978. Raw 1-laterials<br />
Evaluation and Process Development Studies for Conversion of Biomass to Sugars<br />
and Ethanol. Paper presented at the Second Annual Symposium on Fuels from<br />
Biomass. D.O.R. meeting, Troy, i’lew York. June 20-22.<br />
6. Spano, L., A. Allen, T. Tassinari, 14. Mandels and D.Y. Ruy. 1978. Reassessment<br />
of Economics of Cellulase Process Technology: For Production of Ethanol<br />
from Cellulose. Paper presented at the Second Annual Symposium on Fuels from<br />
Biomass. DOE meeting, Troy, New York. June 28-22.<br />
7. I.lorrison, 1.14. 1974. Strucutral Investigations on the Lignin-Carbohydrate<br />
complexes of LoZiwn perenne. Biochem. J. 139, 197-204.<br />
8. Polein, J. and 8. Bezhck. 1977. Investigation of enzymatic hydrolysis of lignified<br />
Cellulosic Materials. Wood Sci. Technol. 11 :275-290.<br />
9. Esau, K. 1953. Plant Anatomy, 2nd ed. John Wiley and Sons, N.Y<br />
10. White, G.A., T.F. Clark, J.P. Craigmiles, R.L. I-titchell, R.G. Robinson, E.L.<br />
Whiteley and K.H. Lessman. 1974. Agronomic and Chemical Evaluation of Selected<br />
Sorghums as Sources of Pulp. Economic Botany. 28:136-144.<br />
11. Crookston, R.K., C.A. Fox, D.S. Hill and D.N. Moss. 1978. Agronomic Cropping<br />
for Maximum Biomass Production. Agronomy Journal. 70:899-902.<br />
12. Schmidt, A.R., R.D. Goodrich, R.M. Jordan, G.C. Marten and J.C. Meiske. 1976.<br />
Relationships Among Agronomic Characteristics of Corn and Sorghum Cultivars and<br />
Silage Quality. Agronomy Journal. 68:403-406.<br />
13. Lipinsky, E.S., S. Kresovitch, T.A. McClure and W.T. Lawhon. 1978. Fuels from<br />
Sugar Crops. Third Quarterly Report to U.S. DOE. TID-28191.<br />
14. Leatherwood, J.M., R.E. Mochrie, E.J. Stone and W.E. Thomas. 1963. Cellulose<br />
Degradation by Enzymes Added to Ensiles Forages. J. Dairy Sci. 46:124-127.<br />
291
15.<br />
16.<br />
17.<br />
18.<br />
19.<br />
20.<br />
21.<br />
22.<br />
Linden, J.C., W.S. Hedrick, A.R. Bloreira, D.H. Smith and R.H. Villet. 1979.<br />
Enzymatic Hydrolysis of the Lignocellulosic Component from Vegetative Forage<br />
Crops. in 3iotechnol.and Bioeng. Symposium No. 9. (in press)<br />
Saterson, K.A. and M.K. Luppold. 1979. Herbaceous Species Screening Program -<br />
Phase I. DOE Contract ET-78-C-02-5035-AOOO.<br />
Marshall & Stevens Equipment Cost Index. 1979. Chemical Engineering, 8&(24),<br />
p. 7 November 5.<br />
Goering, H.K. and P.S. Van Soest. 1970. Handbook No. 379. ARS-USDA. Wash-<br />
ington, D.C.<br />
Fritz, J.O., R.P. Cantrell, V.L. Lechtenberg, J.C. Axtel and J.M. Hertel. 1979.<br />
Fiber Composition and IVDMD of Three bmr Mutants in Grain and Grass Type Sor-<br />
ghums. Abstracts of Crop Science Society of America Annual Meetings. p. 128.<br />
Jackson, D.R. 1979. Common Weeds and Grasses May Prove to be Valuable Sources<br />
of Energy. Biomass Digest 1 (no. 11):2.<br />
Heichel, G.H. 1975. Energetics of Producing Agricultural Sources of Cellulose.<br />
Biotechnol. Bioeng. Symp. No. 5:43-47.<br />
Lipinski, E.S., S. Kresovitch, T.S. McClure and W.T. Lawhon. 1978. Fuels<br />
from Sugar Crops. DOE Quarterly Report TIC-28191.<br />
Grinding<br />
Production<br />
Hydrolysis<br />
fi1 tration Solids to<br />
Pwer and<br />
Steam<br />
Genera tion<br />
Yeast.<br />
P<br />
Distil lation<br />
95% Ethanol<br />
Figure 1. Sinipllfied process flow diagram for ethanol production from<br />
vegetative forage crops.<br />
292<br />
Spent Yeast
e<br />
N<br />
293
n<br />
(Y<br />
c<br />
-<br />
-<br />
c<br />
-<br />
c<br />
a<br />
-<br />
n<br />
Y<br />
0<br />
I-<br />
=<br />
N.<br />
Y)<br />
m<br />
I?<br />
L<br />
0<br />
-I<br />
c<br />
u<br />
L<br />
0<br />
n<br />
-<br />
-<br />
Y<br />
c<br />
a<br />
Ln<br />
0<br />
4<br />
e<br />
e<br />
VI<br />
u<br />
..a<br />
"<br />
e<br />
CI<br />
m<br />
Y<br />
0<br />
I-<br />
-<br />
I<br />
-<br />
h<br />
In<br />
N<br />
m.<br />
0<br />
t<br />
Y<br />
m<br />
.a<br />
e<br />
c<br />
-<br />
x<br />
-<br />
D<br />
Y<br />
Y<br />
Y)<br />
a<br />
Y<br />
n<br />
u<br />
e<br />
Y<br />
u<br />
a<br />
Y<br />
294
mul<br />
02<br />
(Oh<br />
CN -- Oh<br />
*IC)<br />
hf. ..<br />
r-<br />
oul -- Oh<br />
295
6<br />
ne --<br />
em<br />
no<br />
NO<br />
e- m-<br />
I<br />
m<br />
L0 n -<br />
Co O m I<br />
2<br />
h<br />
0 N<br />
h v)<br />
-<br />
-<br />
0<br />
m<br />
L<br />
><br />
m<br />
0<br />
c<br />
Y m<br />
296
<strong>IN</strong>TRODUCTION<br />
PILOT SCALE CONVERSION <strong>OF</strong> CELLULOSE TO ETHANOL<br />
Dana K. Becker, Paul J. Blotkamp, George H. Emert<br />
Biomass Research Center<br />
University of Arkansas<br />
415 Administration Building<br />
Fayetteville, Arkansas<br />
Interest in cellulose as a renewable source of alcohol fuels and other<br />
chemicals has increased as the price of petroleum products continues to rise.<br />
Extensive research has been conducted in the area of cellulose utilization<br />
for a number of years (1, 2, 3, 4, 5). However, with the exception of The<br />
U. S. Army Natick Research Command which has operated a prepilot program for<br />
the enzymatic conversion of cellulose to glucose since 1976 (6, 7), these<br />
investigations have been confined to the laboratory.<br />
The importance of piloting a complete process for the conversion of<br />
cellulose to ethanol was recognized by this laboratory in 1974. The complexity<br />
of combining the material handling of bulky slurries such as air classified<br />
municipal solid waste (MSW) and pulp mill waste (PMW) with the aseptic operation<br />
of an enzyme production facility posed a unique set of problems which<br />
could not adequately be addressed on a laboratory scale. In order to address<br />
these problems, it was believed that the design of a pilot plant should include<br />
the flexibility of handling feedstocks of widely varying composition<br />
and moisture content. Operation of a pilot plant would allow the identification<br />
and testing of equipment for the preparation and transfer of slurries, sterilization,<br />
and liquid/solid separation.<br />
The economic feasibility of a capital intensive process such as the cellulose<br />
to ethanol process requires that the use of highly specialized exotic equipment<br />
be kept to a minimum. As a result of this, low cost chemical reactors would<br />
be evaluated as fermentation vessels. The vessels first tested as "off the<br />
shelf items" could then be modified as necessary to accommodate the individual<br />
requirements of each set of fermentation conditions. In this way parameters<br />
such as agitation, aeration, temperature and pH control, and sterility could be<br />
evaluated and adjusted as needed.<br />
Using these criteria the biochemical conversion<br />
of cellulose to ethanol was scaled-up approximately 100 fold from 1OL laboratory<br />
fermenters to lOOOL vessels in a pilot facility capable of processing 1 ton per<br />
day of cellulosic feedstock.<br />
METHODS AND MATERIALS<br />
Three strains of yeast were used during the pilot investigations of simultaneous<br />
saccharification fermentation (SSF). (8, 9). These were Saccharomyces cereuisiae<br />
ATCC 4132, obtained from the American Type Culture Collection, Rockville, Maryland;<br />
candida brassicae IF0 1664, obtained from the Institute for Fermentation, Osaka,<br />
Japan (2); and a strain of Saccharomyces obtained from Budweiser, Joplin, Missouri.<br />
297
Stock cultures were stored on Oifco YM agar slants at 4OC. Seed cultures of<br />
each yeast were prepared by the addition of a portion of a stock culture into<br />
a shake flask containing a medium shown in Table 1.' Shake flasks were inculated<br />
at 28oC for 18 hours. The shake flask culture was used to inoculate a<br />
130L fermenter made by Fermentation Design, Inc., containin lOOL of the medium<br />
in Table 11. This culture was incubated for 18 hours at 30 ? C, pH 5.0, with an<br />
agitation speed of 120 RPM. The yeast seed culture was harvested into sterilized<br />
15 gallon aluminum barrels prior to use in SSF. If the yeast was not<br />
used immediately the barrels were stored in a cold room at 4OC for no longer<br />
than 48 hours.<br />
The mold Trichoderma reesei QM 9414 was obtained from ATCC. This organism<br />
was grown on potato dextrose agar at 29OC until sporulation occurred. The spore<br />
plates were stored at 4oC until use. 2'. reesei seed cultures were prepared by<br />
inoculating shake flasks with a portion of a spore plate. The culture medium<br />
used in the shake flasks is shown in Table 111. The 1 liter shake flasks were<br />
scaled-up to 100 liter fermenters. Physical parameters controlled in the fermenters<br />
were aeration at 0.5 v/v/m and agitation speed at 300 RPM (1OOL fermenter).<br />
The seed cultures were incubated for 24 hours and then harvested aseptically<br />
into 15 gallon aluminum barrels to be transported to the pilot facility where<br />
it was used as inoculum for enzyme production.<br />
A 10% v/v inoculum was used for initiation of cellulase induction stage in<br />
both batch and continuous phases of enzyme production. The medium used in<br />
enzyme production is described in Table IV. Avicel PH 105, comparable to MSW<br />
in inducing cellulase enzymes, was chosen as a model substrate because of its<br />
ease of handling and uniformity. Avicel PH 105 was obtained from American<br />
Viscose Co., Division of FMC, Marcus Hook, Pennsylvania. The length of incubation<br />
of the culture depended on the mode of enzyme production being used.<br />
production lasted 96 to 120 hours whereas continuous enzyme production had a<br />
residence time of 50 hours (D=.02). Batch SSFs were run for 24 hours unless<br />
experimental design dictated otherwise. Semi-continuous SSFs were run for 96 to<br />
120 hours with the residence time varying from 24 hours to 48 hours. Three<br />
major types of feedstocks were used, 1) purified cellulose (Solka floc.), 2) PMW<br />
(digester rejects, primary sludges, and digester fines), 3) MSW.<br />
Batch enzyme<br />
None of the<br />
feedstocks received any type of pretreatment before use in the SSFs. However,<br />
MSW was at times pasteurized depending on experimental conditions. The MSW used<br />
in the SSFs had been shredded so that it would pass a 4" screen and then air<br />
classified prior to arrival at the pilot plant.<br />
Assays for measurement of enzyme activity and protein concentration were<br />
conducted as described by Blotkamp, et a1 (9). Glucose measurements were made<br />
with the use of a Yellow Springs Instrument Company Model 23A glucose analyzer.<br />
Total reducing sugars were measured by the dinitrosalicylic acid method (10).<br />
Ethanol was analyzed using a Perkin-Elmer Model 3920 B gas chromatograph or<br />
a Hewlett-Packard Model 5730 A gas chromatograph equipped with flame ionization<br />
Chemicals used in media formulations were mostly technical or reagent grade,<br />
however in the past year many of the compounds used were either fertilizer or<br />
food grade.<br />
298
detectors, an electronic inte rator, and a 6 ft. column of Porapak Q. Isothermal<br />
analysis was performed at 150 % C.<br />
Yeast populations were monitored by using dilution plating. Cellulose<br />
concentration of samples used in SSF was determined by using a modified<br />
version of the Van Soest procedures (11, 12). Moisture determinations were<br />
performed on an Ohaus moisture balance.<br />
EQUIPMENT<br />
The vessels used for enzyme production and SSF were 330 gal (1250 liter)<br />
capacity manufactured by Pfaudler (L/D=.78). Four of the five vessels were<br />
capable of aseptic operation. The vessels were constructed of stainless steel<br />
with carbon steel jackets. The vessels were fully jacketed for adequate<br />
temperature control and sterilization.<br />
All process piping was stainless steel with welded connections except<br />
where piping entered the vessel. Flanged fittings with teflon gaskets were<br />
used at these points. No pumps were used as a precaution against contamination,<br />
the liquids and slurries were moved with pressure (sterile air or steam) or<br />
gravity. The agitator shafts were equipped with double mechanical seals filled<br />
with oil. Enzyme production vessels used two flat blade impellers, each having<br />
four blades (Di/Dt=.456). Agitation speed was 120 RPM, aeration was 0.5 V/V/m<br />
at which the kLa was 84 hr-''vs 330 hr-I on a lab scale (with water).<br />
The baffle tray stripping column was constructed from 9" (I.D.) glass pipe<br />
with trays made of monel to resist corrosion. Associated process lines on the<br />
stripper were stainless steel. Pumps were used on the beer feed lines on the<br />
stripping column and recirculation loops to maintain solids in suspension.<br />
A brief process flow diagram is presented in Fig. 1. After the enzyme<br />
production vessels were filled with nutrients and sterilized, the seed inoculum<br />
was transferred aseptically from the aluminum barrels to the vessels using<br />
nitrogen to pressurize the barrels. From this point the enzyme production could<br />
be run in either a batch or continuous mode. When enzyme was ready to be harvested<br />
a portion of the whole culture enzyme broth was transferred to the SSF<br />
vessel into which the cellulosic feedstock (PMW or MSW) would be added, along<br />
with the yeast.<br />
The SSF could be run in either batch or semi-continuous modes<br />
in which one half of material was transferred out every one half residence time.<br />
As the SSF was harvested the resulting beer slurry was moved to the beer storage<br />
tank where it could be pumped into the stripper column for ethanol recovery.<br />
RESULTS<br />
Enzyme Production<br />
Performance of batch enzyme productions can be typified by the data presented<br />
in Figures 2 and 3. Relatively high levels of protein and ~-gZucosidase<br />
are present in the culture broth. These results compare favorably with those<br />
obtained in laboratory studies.<br />
The pilot plant was modified to produce enzyme continuously in order to<br />
demonstrate feasibility on a large scale. The economical advantages of a<br />
299
continuous process lie in reduced capital investment due to increased efficiency<br />
of vessel use. Results from continuous enzyme productions are shown in Figs. 4<br />
and 5. From these graphs can be seen that the B-gZucosidase i s somewhat lower<br />
but the protein and FPRS remain almost as high as in batch culture. Use of the<br />
enzyme from batch as well as continuous enzyme production in small scale flask<br />
saccharification and SSFs indicate only small differences between the two<br />
enzyme preparations under the same conditions.<br />
SIMULTANEOUS SACCHARIFICATION FERMENTATION<br />
Batch SSFs were performed using a variety of substrates. Typical results<br />
for Solka floc. and pulp mill wastes are illustrated in Fig. 6 and Fig. 7<br />
respectively. In both cases over 50% of the theoretical yield from cellulose<br />
to ethanol was achieved. Batch SSFs were run with cellulose concentrations<br />
ranging from 5 to 15%.<br />
Semi-continuous SSFs utilized pulp mill wastes and municipal solid waste<br />
as primary feedstocks. Ethanol production can be seen in Fig. 8. Both MSW<br />
and PMW showed the same trend (Fig. 9) concerning ethanol yield, base utilization<br />
for pH control, and bacterial contaminant population. The presence of<br />
contaminants and increased base usage indicates the production of other acidic<br />
products. Lab scale continuous SSF operation has proved to be significantly<br />
better than batch SSF per unit time.<br />
STRIPP<strong>IN</strong>G OPERATIONS<br />
After the SSFs were completed the resultant beer slurry was pressured<br />
to the beer storage tank (Fig. 1). From the beer storage tank the slurry was<br />
pumped to the top of the baffle tray column (13) while steam was injected<br />
into the bottom of the column. As the beer slurry cascaded down the column<br />
the hot vapor from below contacted the descending liquid and effected the<br />
stripping of the ethanol from the beer feed. The column was designed to<br />
handle beer slurries with solids content as high as 10% and deliver a product<br />
stream of approximately 25% w/v ethanol from a feed containing 2.0 to 3.5%<br />
ethanol. The still bottoms ethanol concentration remained as low as 0.04%.<br />
In a large-scale plant the product from the slurry stripper will be rectified<br />
further to yield 95-100% industrial or motor grade ethanol as necessary.<br />
DISCUSSION AND CONCLUSION<br />
Many pieces of equipment used for materials handling were tested in the<br />
pilot plant. An example is a 750 gallon pulper which worked with some wood<br />
products but not very well with MSW because of the plastics and metal cans in<br />
the material. A rotary vacuum filter was used for dewatering some slurries<br />
but for the majority of feedstocks it was not acceptable. For these reasons<br />
the feedstocks used at the pilot plant, as outlined in this paper, received no<br />
pretreatment and were used in the process just as they were received.<br />
The operation of the pilot plant in both a batch and continuous mode using<br />
potential industrial feedstocks demonstrated the enzymatic cellulose to ethanol<br />
technology on a substantially larger scale than had previously been reported.<br />
The size of the plant enabled the use of bulky materials, such as MSW, which<br />
was difficult on a laboratory scale. The results from the pilot plant enzyme<br />
300<br />
I<br />
1<br />
1
I<br />
I<br />
L<br />
\<br />
I<br />
I<br />
t<br />
,<br />
\<br />
production compared very favorably with the laboratory results, however in the<br />
case of the SSFs the data from the pilot plant and the laboratory are only comparable<br />
for approximately the first 24 hours after which the pilot plant results<br />
lagged behind. For example, on batch SSFs that ran longer than 24 hours at the<br />
pilot plant the percent conversion to ethanol did not continue to rise as in<br />
the laboratory. With pulp mill wastes in laboratory studies, SSFs of 85 to<br />
90% Of theoretical conversion to ethanol was achieved in 48 hours compared to<br />
55 to 60% conversion at the pilot plant.<br />
The reasons for the difference in<br />
results can be explained in part by the lack of adequate environmental controls<br />
such as temperature and pH due to poor heat and mass transfer in the high solids<br />
slurry of the SSFs. Contamination was also a problem in SSFs that ran for<br />
extended periods as evidenced by the increase in base utilization for pH control<br />
and the concomitant decrease in ethanol yields (Figs. 8, 9).<br />
The data gathered from the operation of the pilot plant was used for extensive<br />
economic analysis of the cellulose to ethanol technology (14). The results<br />
of this analysis along with the problem areas mentioned above indicate further<br />
scale-up of the process from the 1 ton/day to a 50 tonlday facility should be<br />
carried out in order to identify specific equipment to be used on a commercial<br />
scale and execute process modifications toward enhancing the economic viability<br />
of the technology.<br />
NOMENCLATURE<br />
a<br />
D<br />
Di<br />
Dv<br />
I.D.<br />
kL<br />
L<br />
m<br />
V<br />
area<br />
dilution rate<br />
impeller diameter<br />
vessel diameter<br />
internal diameter<br />
mass transfer coefficient<br />
vessel length<br />
minute<br />
volume<br />
301
(1) Dhawn, S. and J. K. Gupta "Enzymic Hydrolysis of Comon Cellulosic<br />
Wastes by Cellulase." Journal of General and Applied Microbioloqy,<br />
23, 155-161 (1977).<br />
(2) Karube, I., et. al., "Hydrolysis of Cellulose in a Cellulase Bead<br />
Fluidized Bed Reactor" Biotechnoloqy and Bioenqineering Vol . XIX Pages 1183-1191 (1977).<br />
(3) Ladisch, M., C. M. Ladisch, and George T. Tsao. "Cellulose to Sugars:<br />
New Path Gives Quantitative Yield."<br />
745. August 1978.<br />
Science Vol. 201, 23 pp. 743-<br />
(4) Wilke, C. R., U. V. Stockar, and R. D. Yana, "Process Design Basis<br />
For Enzymatic Hydrolysis of Newsprint", AIChE Symposium Series<br />
Vol. 72, 158 pp. 104-114.<br />
(5) Spand, L. A., J. Medeiros, and M. Mandels, "Enzymatic Hydrolysis of<br />
Cellulosic Wastes to Glucose" Resource Recovery and Conservation,<br />
1 (1976) pp. 279-294, Elsevier Scientific Publishing Company,<br />
Amsterdam.<br />
(6) Nystrom, J. M. and R. K. Andren, "Pilot Plant Conversion of Cellulose<br />
to Glucose", Process Biochemistry, December 1976.<br />
(7) Nystrom, J. M. and Alfred L. Allen, "Pilot Scale Investigations and<br />
Economics of Cellulase Production," Biotechnology and Bioengineering<br />
Symp. No. 6, 55-74 (1976). John Wiley and Sons, Inc.<br />
(8) Takagi, M., S. Suzuki, and W. F. Gauss, "Manufacture of Alcohol from<br />
Cellulosic Materials Using Plural Ferments", United States Patent<br />
No. 3,990,944. (November 9, 1976).<br />
(9) Blotkamp, P. J., M. Takagi, M. S. Pemberton, and G. H. Emert, "Enzymatic<br />
Hydrolysis of Cellulose and Simultaneous Fermentation to Alcohol .I'<br />
AIChE Symposium Series, p. 85-90 (181), Vol. 74, 1978.<br />
(10) Miller, G. L., "Use of Dinitrosalicylic Acid Reagent for Determination of<br />
of Reducing Sugars," Analytical, 31 (3), March, 1959.<br />
(11) Von Soest, P. J., and R. H. Wine, Journal of Association of Official<br />
Aqricultural Chemists, 51 (4) 780-85 (1968).<br />
(12) Updergraff, D. M., Analytical Biochemistry, 32, 420-24 (1969).<br />
(13) Katzen, R., V. B. Diebold, G. D. Moon, Jr., W. A. Rogers, and K. A.<br />
LeMesurier, "A Self-Descaling Distillation Tower", Chemical Engineering<br />
Process, Vol . 64, (1) January 1968.<br />
(14) Emert, G. H. and Raphael Katzen, "Chemicals From Biomass by Improved<br />
Enzyme Technology", ACS/CSJ Joint Chemical Congress, Honolulu, Hawaii,<br />
April 1-6, 1979.<br />
302
Table I<br />
Yeast growth medium (flask)<br />
0 -glucose<br />
yeast extract<br />
malt extract<br />
bacto-peptone<br />
Table I1<br />
Yeast growth medium (fermenter)<br />
0 -glucose<br />
(NH4)2 so4<br />
MgSOb.7HpO<br />
CaCl<br />
Cornsteep Liquor<br />
Table 111<br />
Table I V<br />
2'. reesei growth medium<br />
g/l<br />
20.0<br />
5.0<br />
5.0<br />
5.0<br />
g/l<br />
20.5<br />
1.5<br />
0.11<br />
0.06<br />
7.5<br />
g/l<br />
20.0<br />
2.0<br />
1.23<br />
1 .o<br />
3.0<br />
0.05<br />
0.014<br />
0.016<br />
0.04<br />
2.62<br />
1.7<br />
7.5<br />
2'. reesei enzyme production medium<br />
Cellulose (Avicel 105)<br />
g/l<br />
20.0<br />
KH2P04 2.0<br />
(NH4)2HP04<br />
MgSO, *7H,O<br />
1.23<br />
1 .o<br />
CaC1,<br />
FeSO,<br />
3.0<br />
0.05<br />
ZnSO, 0.014<br />
MnSO, 0.016<br />
COCl 0.04<br />
( NH4L SO,<br />
(NH2 ),CO<br />
Cornsteep Liquor<br />
Tween 80<br />
2.62<br />
1.72<br />
7.5<br />
0.2%<br />
303
304<br />
'c<br />
0<br />
a L<br />
r<br />
I
X<br />
- ! I 120<br />
:1<br />
30<br />
L<br />
10<br />
Figure 2. Batch Enzyme Production FPRS Activity<br />
and Protein Concentration<br />
70<br />
hours<br />
80 90<br />
L<br />
100<br />
Figure 3. Batch enzyme produc tion 6-glucosidase<br />
Ac ti vi ty<br />
,/<br />
311.
ao-<br />
70<br />
F 4ot<br />
.<br />
batch<br />
I<br />
I<br />
I<br />
I<br />
I<br />
continuous<br />
I<br />
I<br />
I - 0<br />
-4<br />
-3<br />
a<br />
-2 .E<br />
4)<br />
*<br />
9<br />
- 1u -1 k<br />
c<br />
- X<br />
.- w<br />
0<br />
3<br />
I .<br />
20 40 60 a0 100 120 140 160 iao 200 220 240<br />
hours<br />
Figure 5. Continuous Enzyme Production 6-gZucosidase<br />
Ac ti vi ty<br />
mfi
32<br />
28-<br />
24-<br />
20<br />
-<br />
16.<br />
0<br />
y12.<br />
00 -<br />
f 8-<br />
r CI<br />
0 4-<br />
32<br />
28-<br />
24<br />
20<br />
16-<br />
0<br />
- a 12-<br />
-<br />
ro 8-<br />
m<br />
c<br />
w<br />
Q) 4.<br />
batch SSF (solka floc)<br />
- 40 -<br />
0<br />
C<br />
- m<br />
-<br />
-<br />
-<br />
;<br />
2 4 6 8 10 12 14 16 18 20 22 24<br />
hours<br />
Figure 6. Batch SSF Using Solka Floc. Ethanol Production<br />
and % Conversion to Ethanol (6% Cellulose)<br />
batch SSF (PMW)<br />
A<br />
C<br />
- 20 2<br />
c<br />
P<br />
C<br />
0<br />
-10<br />
x<br />
batch SSF (PMW) - 50<br />
I .I<br />
2 4 6 8 10 12 14 16 18 20 22 24<br />
hours<br />
Figure 7. Batch SSF Using Pulp Mill Wastes, Ethanol Production<br />
and % Conversion to Ethanol (7% Cellulose)<br />
- 40<br />
0<br />
C<br />
m<br />
c<br />
- 30%<br />
0<br />
c<br />
C<br />
- 20.5<br />
L<br />
P<br />
C<br />
-10 8<br />
x<br />
337
20-<br />
15<br />
batch semi-continuous<br />
Municipal Solid Waste, Ethanol Production (8% Cellulose)<br />
I<br />
batch I semi-continuous<br />
I<br />
I<br />
I<br />
0<br />
- ,,y-<br />
-5<br />
-4<br />
-3<br />
L<br />
3<br />
0<br />
c<br />
-2 1<br />
f<br />
s<br />
-1 3<br />
8
LOW ENERGY DISTILLATION SYSTEMS<br />
! R. Katzen, W.R. Ackley, G.D. Moon, Jr., J.R. Messick, B.F. Brush, K.F. Kaupisch<br />
Raphael Katzen Associates International, Inc.<br />
1050 Delta Avenue, Cincinnati, Ohio 45208<br />
ABSTRACT<br />
Much work, aimed at improvements in the manufacture and recovery<br />
Of ethyl alcohol, is currently being conducted in connection with the<br />
production of substitute liquid fuels; e..g., Gasohol. A primary consider-<br />
ation in all schemes for producing substitute liquid fuels lies in the energy<br />
consumed to produce the fuels. By energy re-use, pressure cascading<br />
and waste heat recovery, the expenditure of energy in distillation (alcohol<br />
recovery) can be greatly reduced. Such energy savings have been indus-<br />
trially demonstrated in three systems described in this paper. For high<br />
grade industrial ethanol production, a steam consumption of 3.0-4.2 Kg/<br />
liter (25-35 Ib/U.S. gallon) of looo G.L. alcohol is realized. For motor<br />
fuel grade anhydrous alcohol, the steam consumption is 1.8 to 2.5 Kg/liter<br />
(15-20 Ib/U.S. gallon) of 99.5' G.L. alcohol, and for hydrous motor fuel<br />
grade alcohol, the steam consumption is 1.2 to 1.4 Kg/liter (10-12 Ib/U.S.<br />
gallon) of 96O G.L. alcohol.<br />
ALCOHOL DISTILLATION<br />
Over the past two decades, Raphael Katzen Associates International,<br />
Inc. has developed a series of highly efficient alcohol distillation systems<br />
for recovery of various grades of ethyl alcohol from synthetic and fermen-<br />
tation feedstocks. For each of these systems, the prime goal is minimi-<br />
zation of energy consumption.<br />
The RKAll distillation system for production of high quality spirits or<br />
industrial grade alcohol, uses a four tower distillation train. The product<br />
is first quality neutral spirits at 96O G.L. (192O U.S. proof) ethanol.<br />
When the crude ethanol feed is obtained by the synthetic process, e.g.,<br />
direct hydration of ethylene, only 3 towers are required. For motor fuel<br />
grade alcohol, where a high quality product is not necessary, simpler<br />
abbreviated systems are used to reduce investment and operating costs.<br />
PRODUCTION <strong>OF</strong> 96' G.L. HYDROUS <strong>IN</strong>DUSTRIAL ALCOHOL<br />
The distillation system is shown in Figure 1 (I, 2). The process has<br />
been successfully operated commercially with four different fermentation<br />
feedstocks, namely, molasses, grain (corn or milo), corn wet milling<br />
middlings, and sulfite waste liquor. In addition, it has been operated<br />
with an ethylene-based synthetic crude.<br />
309
Beer from the fermenters, containing approximately 6-8 wt % alcohol<br />
and %IO% total solids (suspended and dissolved) is preheated to near<br />
saturation temperature and fed to the beer still. An overhead condensed<br />
product, at 75-85O G.L. (150'-170° U.S. proof) is taken to the high wines<br />
drum, and the bottoms liquid (stillage), containing not more than 0.02<br />
wt % alcohol, is treated further for animal feed production.<br />
The high wines distillate from the beer still is mixed with recycled<br />
alcohol from the concentrating tower and the combined stream is fed to the<br />
extractive distillation tower.<br />
The extractive tower is designed to separate substantially all impurities;<br />
aldehydes, esters, and higher alcohols from the ethanol. The extraction<br />
technique relies on the volatility inversion of the higher alcohols with<br />
respect to ethanol in solutions containing high concentrations of water.<br />
The net result is that a substantially pure ethanol/water mixture is removed<br />
from the bottom of the extractive tower while the impurities are<br />
taken overhead.<br />
Dilute alcohol from the base of the extractive tower is stripped and<br />
concentrated to product strength in the rectifying tower. A heads purge<br />
is taken from the overhead condensate. Product ethanol at 96O G.L. (192'<br />
U.S. proof) is withdrawn near the top of the rectifying tower, and a<br />
water stream, containing trace amounts of alcohol, is discharged from the<br />
base. Heads and side draw fusel oil purges are fed to the concentrating<br />
tower to prevent any buildup of impurities in the rectifying tower. The<br />
overhead stream from the extractive tower also is fed to the concentrating<br />
tower. Heads and fusel oil are concentrated in this tower and removed<br />
from the system, with the recovered alcohol being recycled to the extrac-<br />
tive tower.<br />
Steam economy is achieved by multi-stage preheating of beer feed,<br />
and by operating the extractive and concentrating towers at higher pres-<br />
sures. The overheads from these pressure towers supply thermal energy<br />
to the reboilers of the rectifying tower. Such pressure cascading results<br />
in a 30 to 50% reduction in virgin steam..<br />
are:<br />
The key features of the RKAll high quality alcohol distillation system<br />
1. Extractive distillation accomplishes a higher degree of impurity<br />
removal than is possible in more conventional systems. Product 1<br />
ethanol contains only 20-30 ppm of total impurities.<br />
2. The use of pressure cascading permits substantial heat recovery<br />
and re-use. In the system described above and in figure 1, the<br />
extraction tower and concentrating tower are operated at a pres-<br />
sure higher than the rectifying tower. The overhead vapors
from these pressure towers supply thermal energy to the rectify-<br />
ing tower reboilers. By operating in this manner, the steam<br />
usage is kept to a minimum. Commercial facilities using this<br />
pressure cascading technique, show steam usages of only 3.0 to<br />
4.2 Kg of steam per liter (25 to 35 Ib/gal) of 96O G.L. (192O<br />
U.S. proof) ethanol compared to 6.0 Kg/liter in earlier conven-<br />
tional systems.<br />
3. Substantially all (95 to 98%) of the ethanol in the crude feed is<br />
recovered as first grade product.<br />
4. Design of highly efficient tower trays permits high turndown<br />
capability. These trays are designed to be self-descaling in the<br />
stripping section of the beer towers.<br />
5. A highly advanced control system, developed through years of<br />
experience, provides for sustained stable operation, with only<br />
part-time attention of an operation required. Product quality is<br />
maintained with less than 30 parts per million of total impurities.<br />
Permanganate time is in excess of 60 minutes.<br />
PRODUCTION <strong>OF</strong> ANHYDROUS (99.5'-99.98' G. L.) ALCOHOL<br />
Anhydrous alcohol is produced by azeotropic distillation. A high<br />
grade product of 99.98O G.L. (199.96O U.S. proof) concentration is pro-<br />
duced for use in food and pharmaceutical aerosol preparations. A pro-<br />
duct of 99.5O G.L. (199O U.S. proof) concentration is produced for blend-<br />
ing with gasoline for motor fuel.<br />
The Katzen two-tower dehydrating system design (see Figure 2) has<br />
been installed and successfully operated in seven different alcohol plants<br />
in North America and the Carribean.<br />
The 96' G.L. (192O U.S. proof) product is withdrawn from the side<br />
of the rectifier in the hydrous distillation process. The hydrous alcohol is<br />
fed to an atmospheric dehydrating tower. Removal of water from the feed<br />
is achieved by the use of benzene, heptane, cyclohexane, or other suitable<br />
entraining agent. A ternary azeotrope is taken overhead from the dehy-<br />
drating tower. The overhead vapors are condensed and the-two liquid<br />
phases are separated in a decanter.<br />
The entrainer-rich phase is refluxed to the dehydrating tower. A<br />
reboiler is used to supply vapor to this tower with heat supplied by either<br />
low pressure steam, recovered flash vapor, or hot effluent and condensate<br />
streams from the hydrous alcohol unit.<br />
31 1
The aqueous phase from the decanter is fed to a stripper. The<br />
entraining agent is recovered, along with alcohol, in the overhead vapor.<br />
Water is removed from the bottom of the stripper. Direct steam may be<br />
used in this stripper.<br />
The bottoms stream from the azeotropic dehydrating tower is the<br />
anhydrous alcohol product.<br />
Design know-how consists of optimizing the balance between capital<br />
costs and utility consumption, with stable control. Specific features which<br />
contribute to overall process efficiency and reliability ot the RKAll anhy-<br />
drous alcohol distillation system are:<br />
1. Use of a common condenser and decanter for the dehydration and<br />
stripping towers to reduce capital costs.<br />
2. Design of highly efficient tower trays for high turndown capa-<br />
bility.<br />
3. Low consumption of entraining agent (less than 0.1 Kg per 1,000<br />
liters of anhydrous alcohoi).<br />
4. Low consumption of steam (1 to 1.5 Kg/liter or 8.3 to 12.5<br />
Ib/gallon of anhydrous alcohol), or equivalent hot condensate or<br />
. waste streams.<br />
PRODUCTION <strong>OF</strong> ANHYDROUS MOTOR FUEL GRADE ALCOHOL<br />
For motor fuel grade alcohol, the beer feed is preheated in a multi-<br />
stage heat exchange sequence. A pressure stripper-rectifier (see Figure<br />
3) is used to separate the beer feed into an overhead fraction of about 95'<br />
G.L. (190' U.S. proof) alcohol and a bottoms stream containing less than<br />
0.02 wt % alcohol. Side draws are made to remove fusel oils. These oils<br />
are recovered by water washing, and reblended as a component of the<br />
motor fuel grade alcohol. In addition, a pasteurizing section is used to<br />
concentrate low boiling impurities. These are removed by taking a small<br />
heads draw which is burned in the piant reboiler. Dehydration of the<br />
hydrous product is accomplished in two additional towers. Energy is<br />
supplied to the reboilers of the two towers in the dehydration step by<br />
condensing the overhead vapors from the pressure stripper-rectifier. By<br />
operating the beer stripper-rectifier at a higher pressure (3) than the<br />
two-tower dehydration system, very low total steam consumption can be<br />
achieved. The steam usage is 1.8 to 2.4 Kg/liter (15 to 20 Ib/gallon) of<br />
99S0 G.L. (199' U.S. proof) motor fuel grade alcohol product (5).<br />
31 2
I<br />
I<br />
PRODUCTION <strong>OF</strong> HYDROUS MOTOR FUEL GRADE ALCOHOL<br />
For a product to be utilized in NEAT alcohol engines (no gasoline in<br />
the blend), further steam economy can be achieved when only 85-95' G.L.<br />
(170'-190' U.S. proof) alcohol product is desired. This is accomplished<br />
by splitting the stripping-rectifying duties between two towers (see Figure<br />
4, Ref. 4). The first stripper-rectifier tower is operated at a pressure<br />
higher than the second tower and receives 50 to 60% of the beer feed.<br />
The overhead vapors from the first tower are used to boil up vapor in the<br />
second tower.<br />
The steam usage is 1.2 to 1.5 Kg/liter (IO to 12 Ib/gallon) of 85'-96'<br />
G.L. (170°-1920 U.S. proof) motor fuel grade alcohol (on a 100% ethanol<br />
basis). Along with steam economy, cooling water requirements are reduced<br />
proportionately.<br />
SUMMARY<br />
A summary of investment for typical low energy distillation systems<br />
(shown in -Figures 1 through 4) for production of 190 MM liter/year (50 MM<br />
USGPY) alcohols is given in Table 1. Also, shown are the steam, cooling<br />
water and electric energy requirements for each system.<br />
REFERENCES<br />
1.<br />
2.<br />
3.<br />
4.<br />
5.<br />
U.S. Patent 3,445,345, Extractive Distillation of C-I to C-3 Alcohols<br />
and Subsequent Distillation of Purge Streams, May 20, 1969.<br />
U .S. Patent 3,990,952, Improvement in Alcohol Distillation Process,<br />
November 9, 1976.<br />
U.S. Patent Application No. 958,533, Distillation Method and Appar-<br />
atus for Making Motor Fuel Grade Anhydrous Alcohol, November 7,<br />
1978.<br />
U .S. Patent Application, Novel Energy Efficient Process for Produc-<br />
tion of 170 to 190' Proof Alcohol.<br />
Raphael Katzen Associates, Grain Motor Fuel Alcohol, Technical and<br />
Economic Assessment Study, U .S. DOE Contract No. EJ-78-C-6639,<br />
June, 1979.<br />
31 3
Figure<br />
Alcohol Product,<br />
U.S. Proof<br />
D i st i I I at ion U nit<br />
Investment<br />
$MM U.S.<br />
Steam Usage<br />
Kg/liter<br />
(Ib/gallon)<br />
Cooling Water<br />
MT/hr<br />
Electric Power<br />
kw<br />
TABLE 1<br />
LOW ENERGY D I ST I LLAT ION SYSTEMS<br />
SUMMARY <strong>OF</strong> <strong>IN</strong>VESTMENT AND UTILITIES<br />
190 MM liters/yr (50 MM gallons/yr)<br />
High Grade<br />
(96' G.L.)<br />
Anhydrous<br />
(looo G.L.)<br />
Anhydrous<br />
(99.5O G.L.)<br />
Hydrous<br />
Motor Fuel<br />
1<br />
/<br />
Industrial<br />
Alcohol<br />
Industrial<br />
A I co hol<br />
Motor Fuel<br />
Alcohol<br />
Grade<br />
A I coho1<br />
1<br />
1 2 3 4<br />
190 200 199 190<br />
7.3 2.8 6.1 3.4<br />
4.1 1.4 2.2 1.2<br />
(34) (11.7) (18) (10)<br />
1866 934 1311 182<br />
289 31 133 177<br />
31 4
cc W I-<br />
s<br />
W<br />
I- v)<br />
L<br />
f I<br />
31 5
31 6
t<br />
U 3 \<br />
n 0 a<br />
%<br />
W<br />
31 7<br />
I 'M<br />
W m
31 8
CHEMICAL FEEDSTOCKS FROM WOOD: AQUEOUS ORGANIC ALCOHOL TREATMENT<br />
S. M. Hansen and G. C. April<br />
The University of Alabama<br />
Chemical and Metallurgical Engineering<br />
P. 0. Box G<br />
University, Alabama 35486<br />
<strong>IN</strong>TRODUCTION<br />
The current world petroleum crisis has caused renewed interest in alternative<br />
and renewable sources of fuel and feedstock chemicals. One such alternative receiv-<br />
ing attention involves the separation of wood into its components, cellulose, hemi-<br />
cellulose and lignin, followed by conversion to feedstock chemicals. Treatment of<br />
wood with an aqueous organic solvent has been found to be effective in removing<br />
lignin and hemicellulose from the cellulose fibers.<br />
Early work by Aronovsky and Gortner (1) studied the use of aqueous solutions of<br />
organic alcohols to remove lignin and produce wood pulp. They determined that<br />
aqueous n-butanol was the most effective solvent for producing a well pulped residue<br />
and for the removal of lignin.<br />
Kleinert (2,3) found that organosolve bulk delignification occurred in two<br />
distinct psuedo-first order stages. Delignification was found to be considerably<br />
faster during the first part of the batch cook.<br />
More recently, Katzen et al. (4) showed that a continuous alcohol pulping pro-<br />
cess using aqueous ethanol is economically feasible if the by-products (lignin and<br />
hemicellulose hydrolysis products) can be upgraded and sold. A pay out time of 3.2<br />
years with a 22% return on investment was calculated.<br />
This paper reviews the recent work with aqueous organic solvents conducted at<br />
The University of Alabama. Emphasis on the rate of lignin removal and the extent of<br />
pulp recovery is included. The use of the data to make preliminary process calcula-<br />
tions regarding technical and economic feasibility is also addressed with compari-<br />
sons to recent work reported in the literature.<br />
BATCH DELIGNIFICATION STUDIES<br />
A majority of the work reported in the literature was accomplished using batch<br />
equipment. Initial screening studies at The University of Alabama likewise followed<br />
this mode of investigation. A summary of the various conditions investigated is<br />
shown in Table 1.<br />
Table 1 - Summary of Experimental Conditions<br />
Wood Type - Southern Yellow Pine, Sweet Gum<br />
Wood Size - Meal (-10 +70)<br />
Solvent Type - Ethanol, Butanol, Phenol<br />
Solvent /Water - 50/50 by Volume<br />
Solvent/Wood - 15 ml Solvent/l g Wood<br />
Temperature 175-205OC<br />
-<br />
Pressure - 1140-2180kPa<br />
Catalysts - Alum, A1C13, Anthraquinone<br />
31 9
A summary of the results of the batch experiments is shown in Table 2.<br />
Table 2 - Summary of Batch Results<br />
Southern Yellow Pine<br />
Conditions - Time % Residual Pulp % Lignin Removed<br />
Solvent: nBuOH 0.0 85.3 15 .O<br />
Temp: 175°C 0.5 74.1 36.0<br />
Pressure: 1140 kPa 1.0 71.8 36.0<br />
4.0 67.5 22.0<br />
Solvent : nBuOH 0.0 65.3 27.2<br />
Temp: 205OC 2.0 60.7 36.0<br />
Pressure: 2170 kPa 4.0 56.0 35.0<br />
Solvent: Phenol 0.0 58.0 35.9<br />
Temp: 205'C 0.5 43.0 83.1<br />
Pressure: 1490 kPa 1.0 41.1 84.7<br />
1.5 39.5 87 .O<br />
2.0 38.0 89.3<br />
4.0 36.2 89.7<br />
Conditions ~<br />
Time % Residual Pulp % Lignin Removed<br />
Solvent: nBuOH 0.00 90.8 17.2<br />
Temp: 175OC 0.67 69.1 45.3<br />
Pressure: 1140 kPa<br />
Solvent: nBuOH 0.0 69.2<br />
Temp: 205OC 0.5 56.5<br />
Pressure: 2170 kPa 1.0 50.4<br />
1.5 47.8<br />
2.0 45.7<br />
42.2<br />
60.9<br />
78.6<br />
83.6<br />
88.8<br />
4.0 43.1 85.7<br />
These data are graphically illustrated in Figures 1 & 2 in which the fractional<br />
residual pulp versus time-at-temperature is plotted on rectangular and semi-log<br />
paper, respectively. A rapid decrease in the residual pulp during the early stages<br />
of the cook is observed.<br />
Figure 2 shows the characteristic, two stage process that has been described by<br />
Kleinert and others (5,6) by a two step, first order expression. For the systems<br />
investigated in this study the rate constants for each step were calculated to be<br />
between 5.0 x and 2.0 x rnin-l for the rapid initial step and between<br />
4.0 x and 4.0 x 10⁻³ min-1 for the subsequent slower rate.<br />
Figures 3 and 4 show the lignin removed versus time and the log of lignin<br />
removed versus time. The percent lignin removed reaches a maximum level in the<br />
batch studies (see Figure 3) and then decreases. This decrease in the amount of<br />
lignin removed is due to repolymerization and precipitation of removed lignin,<br />
320
and/or to the decrease in solubility of lignin in the solvent as it cools to room<br />
temperature. Figure 4 shows that the removal of lignin occurs in several first<br />
order stages paralleling the results noted for residual pulp (Figure 2). Corresponding<br />
rate constants for lignin are in good agreement with those values reported for<br />
residual pulp (2 x 10⁻² to 6.0 x min-1 and 3.0 x 10⁻⁴ to 1 x 10⁻³) indicating<br />
a common mechanism during initial stages of hydrolysis. Kleinert (2 3) reported<br />
values for the rate constants between 1.5 x and 3.0 x min-i for times<br />
correspnding to the initial first order removal presented here.<br />
SEMI-BATCH DELIGNIFICATION STUDIES<br />
In order to eliminate problems of solubility and repolymerization/redeposition<br />
of lignin, and, to simulate more closely commercial delignification processing, a<br />
series of data have been collected using a semi-batch apparatus. In this scheme,<br />
the solvent phase is continuously passed over a fixed bed of wood chips. The<br />
results obtained from these runs are summarized in Table 3.<br />
Table 3 - Semi-Batch Results<br />
% Residual % Lignin<br />
Solvent Wood Temp,"C Time hrs Flow cclmin Pulp Removed Catalyst*<br />
----<br />
EtOH<br />
EtOH<br />
EtOH<br />
EtOH<br />
EtOH<br />
EtOH<br />
EtOH<br />
BuOH<br />
BuOH<br />
BuOH<br />
BuOH<br />
BuOH<br />
BuOH<br />
BuOH<br />
SYP<br />
SG<br />
SG<br />
SG<br />
SY P<br />
SYP<br />
SYP<br />
SG<br />
SG<br />
SG<br />
SG<br />
SG<br />
SYP<br />
SYP<br />
175 2.50<br />
175 0.67<br />
175 0.67<br />
175 0.67<br />
205 1.33<br />
205 2.50<br />
205 4.00<br />
175 0.67<br />
175 0.67<br />
175 0.67<br />
175 0.67<br />
200 0.67<br />
205 4.00<br />
205 4.00<br />
*Catalyst concentration is 0.005 % wt<br />
7.20<br />
7.20<br />
7.20<br />
7.20<br />
3.20<br />
7.20<br />
7.20<br />
7.20<br />
7.20<br />
7.20<br />
7.20<br />
7.20<br />
5.43<br />
6.30<br />
91.1<br />
74.0<br />
73.2<br />
30.6<br />
52.1<br />
65.4<br />
47.0<br />
95.5<br />
96.8<br />
43.2<br />
74.6<br />
67.8<br />
65 .O<br />
69.3<br />
3.7<br />
47.3<br />
48.9 Anthraquinone<br />
97.9 AlC13<br />
59.4 -<br />
38.9<br />
62.2<br />
20.0 -<br />
15.3 Alum<br />
87.2 AlC13<br />
37.9 Anthraquinone<br />
45.2 -<br />
43.7<br />
43.6<br />
These values show that for delignification to proceed at an appreciable rate<br />
with Southern Yellow Pine, the temperature must be above 175OC. It is also seen<br />
that more lignin is removed using aqueous ethanol as a solvent (over n-BuOH) but the<br />
amount of residual pulp decreases due to increased hydrolysis of the carbohydrates.<br />
The results show that anthraquinone has no catalytic affect in aqueous ethanol<br />
at 175OC. The use of AlC13 as a catalyst causes a severe loss of the carbohydrates.<br />
The high loss of carbohydrates makes AlC13 an undesirable catalyst for the production<br />
of wood pulp.<br />
In aqueous nBuOH solvent at 175°C Alum has no catalytic effect. The use of<br />
anthraquinone catalyst cause the percent lignin removal to increase from 20.0% to<br />
37.9% with a corresponding decrease in residual pulp from 95.5% to 74.6%. The use<br />
of AlCl3 again leads to high lignin removals with rapid hydrolysis of the carbo-<br />
hydrates.<br />
321
Recovery data from a four hour semi-batch extraction of Southern Yellow Pine<br />
with aqueous ethanol at 205*C are shown in Figure 5. This data was collected by<br />
sampling the effluent at 100 ml intervals. These samples were stripped of solvent<br />
using a rotary evaporator followed by analysis of the residue for lignin content.<br />
The corresponding rate of removal of the lignin was described by a first order model<br />
producing a rate constant of 1.5 x 10⁻² min-1; well within the rate of values calculated<br />
for batch treatment.<br />
Using the above information and data on the physical properties of the solvents,<br />
a preliminary engineering analysis can be made evaluating commercial application of<br />
the treatment method.<br />
Commercial applications various process schemes have been proposed for organic<br />
solvent delignification including the more recent one by Katzen (4) for aqueous<br />
ethanol extraction. Figure 6 shows a form of that process modified for n-butanolwater<br />
treatment. This process is comprised of four sections: Extraction, Solvent<br />
Separation, Solvent Recovery and Product Recovery. A fifth, pretreatment of the<br />
wood may also be included as a major section of hemicellulose recovery is con-<br />
sidered as an option.<br />
The values shown tabulated are based on the recovery data and<br />
extraction efficiencies generated in the experimental investigation for n-butanol-<br />
water treatment.<br />
In general, 1000 kg of wood is needed to produce 650 kg of pulp ( 25% lignin),<br />
150 kg of dry extracted lignin and 200 kg of hemicellulose hydrolysis products. The<br />
pulp could be further processed for use as a paper stock or could be acid hydrolyzed<br />
to glucose. There are existing processes for converting glucose to ethanol or<br />
n-butanol, making either solvent process totally independent of petroleum sources.<br />
Approximately 1% of the solvent would be held up by the pulp and 1% would be<br />
removed with the lignin slurry. Approximately 80-90% of this could be easily<br />
removed by steam stripping giving an overall alcohol loss of 25 kg of nBuOH per 1000<br />
kg of wood processed. It is also estimated that 275 kcal/kg of wood processed/<br />
extractor would be required assuming 20% energy loss. This compares quite favorably<br />
with the value of 268 kcal/kg wood given.by Katzen (4) using a battery of nine<br />
extractors.<br />
1.<br />
2.<br />
3.<br />
4.<br />
5.<br />
6.<br />
REFERENCES<br />
Aronovsky, S. J., and Gortner, R. A., I&EC 28 (11): 1270 (1936).<br />
Kleinert, T. N., TAPPI 57 (8): 99 (1974).<br />
Kleinert, T. N., TAPPI 58 (8): 170 (1975).<br />
Katzen, R., Frederickson, R., and Brush, B.F., CEP 76 (2): 62 (1980).<br />
Springer, E. L., Harris, J. F., and Neill, W. K., TAPPI 46 (9): 551 (1963).<br />
April, G. C. Kamal, M. M., Reddy, J. A., Bowers, G. H. and Hansen, S. M.,<br />
- 62 (5): 83 (1979).<br />
ACKNOWLEDGEMENT<br />
The authors would like to thank the National Science Foundation (Contract No.<br />
AER-78-02651) and the School of Mines and Energy Development, The University of<br />
Alabama (Project 102) for their support of this research effort.<br />
322
..-<br />
323
Y .“Y Y Y<br />
n n n o n<br />
5 2:: : :<br />
324<br />
i , P
I<br />
2.0<br />
1.0<br />
0.0<br />
I 0<br />
The. mi".<br />
TOC.1<br />
- . - . . -. - . -<br />
Carbohydrates<br />
Figure 5. Cunulative Weight of Wood Components Recovered vs. Contact Time in a Semi-<br />
Batch System using Aqueous Ethanol as the Delignification Agent at 205OC.<br />
325
Extraction -Solvent Seperatk- Solvent Recovery Praduc t Recovery<br />
I I I 1<br />
1w<br />
Solvent<br />
seperator I<br />
Aqueous<br />
Evaporator<br />
I<br />
stream I 1 2 3 4 5 6<br />
nBuOH (kg)<br />
H20 (kg)<br />
I<br />
- 10840 10140 90 9990 150<br />
- 13470 13170 110 2720 10640<br />
Cellulose (kp) 400 - - 400 -<br />
Hemicellulose (kg)<br />
Lignin (kg)<br />
1 I<br />
1 I<br />
100<br />
300<br />
1 I<br />
-<br />
-<br />
I 200<br />
I 150<br />
1 100<br />
I<br />
1 150<br />
1 I<br />
-<br />
150<br />
1 I<br />
1<br />
200<br />
-<br />
T:<br />
~ ~ t Has5 a i (kg) 1000 24110 24400 850 12860 11590<br />
Temp (‘0<br />
9<br />
kcal x lo6<br />
I 25<br />
205 205 205<br />
40 40<br />
I<<br />
@<br />
c<br />
Organic<br />
Solvent<br />
Steam<br />
Lignin<br />
Hemicellulose<br />
- syrup<br />
9 10<br />
150 -<br />
10450 200<br />
.-<br />
200<br />
11200 400<br />
100 100<br />
1.411 0.00s<br />
7.144 0.014<br />
Figure 6. Process Schematic for the Aqueous n-Butanol Delignification of<br />
Southern Yellow Pine.<br />
326
K. P. Ananth," M. A. Golembiewski," H. M. Freeman'<br />
I "Midwest Research Institute, 425 Volker Boulevard, Kansas City, Mo. 64110<br />
Introduction<br />
'Industrial Environmental Research Laboratory, U.S. EPA<br />
Cincinnati, Ohio 45268<br />
Increased emphasis on energy and material recovery and the need<br />
for alternatives to solid waste disposal in landfills have generated growing<br />
interest in waste-as-fuel processes. The processes include, on a generic<br />
basis, waterwall incinerators, pyrolysis systems, combined fuel-fired systems<br />
(coal plus refuse derived fuel [RDF], RDF plus municipal sewage sludge, coal<br />
plus wood waste, and biochemical conversion of waste to methane.<br />
The Fuels Technology Branch of EPA's Industrial Environmental Research<br />
Laboratory in Cincinnati is sponsoring a program at Midwest Research<br />
Institute (MRI) to conduct environmental assessments of some of the above<br />
waste-to-energy conversion processes. The overall objective of this program<br />
is to evaluate the potential multi-media environmental impacts resulting<br />
from using combustible wastes as an energy source and thereby identify con-<br />
trol technology needs.<br />
extensive sampling and analysis efforts at the following waste conversion<br />
facilities.<br />
.<br />
'<br />
As part of this program, MRI has undertaken fairly<br />
A 200 ton/day refuse pyrolysis system<br />
A 120 ton/day municipal incinerator fired with<br />
Municipal Solid Waste (MSW)<br />
. A 10 MW power plant boiler fired with wood<br />
waste and No. 2 oil<br />
.<br />
A 70,000 lb/hr steam boiler fired with coal<br />
and densified refuse-derived fuel (d-RDF)<br />
. A 20 MW power plant boiler fired with RDF<br />
A description of the facility, the sampling and analysis methods<br />
used, and the results obtained are individually presented below for each of<br />
the above facilities tested.<br />
Refuse Pyrolysis System<br />
The Union Carbide refuse pyrolysis system (PlJROX) at South Charleston,<br />
West Virginia, was designed to pyrolyze 200 tons/day of refuse-derived fuel.<br />
The refuse fuel was produced by shredding MSW to a 3 in. size and then re-<br />
moving magnetic materials from the shredded waste. The PUROX system is a<br />
partial oxidation process that uses oxygen to convert solid wastes into a<br />
gas having a higher heating value (HHV) of about 370 Btu/scf.<br />
327<br />
\
Figure 1 is a schematic illustration of the Purox process. Raw<br />
refuse is received by truck in the plant's storage building. It is moved<br />
and stacked in the storage area by a front end loader. The same loader picks<br />
up the stored waste, weighs it on a platform, and dumps it on a conveyor<br />
leading to the shredder, where it is shredded to a 3-in. size.<br />
material is removed by a magnetic recovery system.<br />
Ferrous<br />
The refuse fuel is fed into the top of the reactor, the principal<br />
unit on the process, by two hydraulic rams. There are three general zones<br />
of reaction within the reactor (drying, pyrolysis, and combustion). The<br />
reactor is maintained essentially full of refuse, which slowly descends by<br />
gravity from the drying zone through the pyrolysis zone into the combination<br />
zone. A counterflow of hot gases, rising from the combustion zone at the<br />
bottom, dries the incoming, moist refuse. As the material progresses down-<br />
ward it is pyrolyzed to form fuel gas, char, and organic liquids.<br />
Oxygen is injected into the bottom hearth section at a ratio of<br />
about 20% by weight of incoming refuse. The oxygen reacts with char formed<br />
from the refuse to generate temperatures of 1370 to 165OOC in the lower zone,<br />
which converts the noncombustibles into a molten residue. This residue is<br />
discharged into a water quench tank where it forms a slag.<br />
The hot gases from the hearth section are cooled as they rise<br />
through the zones of the reactor. After leaving the reactor, the gases are<br />
passed through a recirculating water scrubber. Entrained solids are sepa-<br />
rated from the scrubber water in a solid-liquid separator, and recycled to<br />
the reactor for disposal. The water product discharged from the separator<br />
system is sent to a plant treatment system. The gas leaving the scrubber<br />
is further cleaned in an electrostatic precipitator (ESP) and then cooled<br />
in a heat exchanger prior to combustion in a flare combustor. During the<br />
tests the gas was burned in a package boiler transported to the site for<br />
these tests. The fuel gas consisted of about 40% CO by volume, 23% C02, S%<br />
CH4, 26XH2, and the rest being NO, C2H4, etc.<br />
Sampling at the Purox facility was directed to the three effluent<br />
streams; slag, scrubber effluent, and gaseous emissions from a boiler when<br />
fired with Purox gas and when fired with natural gas. An overview of the<br />
sampling and analysis scheme is shown in Figure 2. As can be seen in this<br />
figure, sampling and analysis of each stream was rather complex, being directed<br />
to conventional pollutants but including, among others, priority pollutants<br />
in water samples and sampling of both liquid and gaseous emissions<br />
for most of the analyses prescribed under EPA's Level 1 environmental assessment<br />
protocol. Particulate emission sampling in the boiler stack was<br />
conducted according to EPA Method 5, but using a High Volume Sampling System<br />
(HVSS) because of the expected low particulate loading. Boiler stack sampling<br />
also included use of the Level 1 SASS': train.<br />
Water samples also underwent analysis for priority pollutants,<br />
but the data are too lengthy for inclusion in this paper. The results of<br />
these analyses showed that a few of these pollutants were present at detectable<br />
levels in the scrubber effluent, but that the Unox system did effectively<br />
reduce their concentrations.<br />
5; Source Assessment Sampling System.<br />
328<br />
I<br />
I
Results of the testing effort showed that, of the criteria pollutants,<br />
only NO and particulate emissions increased when burning Purox gas<br />
as compared to'natural gas. NO and particulate levels were of the order<br />
of 350-400 ppm and 0.002-0.005 $r/scf respectively. SO2 emissions averaged<br />
70-100 ppm. Particulate and SO2 emissions were below present standards,<br />
whereas NO will require further reduction. Also, analysis for metals and<br />
other pollEtants indicate that these should not present any problems.<br />
Because of the difficulty involved in interpreting much of the<br />
data collected in this test, especially the Level 1 analysis results, the<br />
environmental assessment work was extended to include application of the<br />
methodology known as the Source Analysis Model (SAM/lA) developed by EPA.<br />
Basically, this model compares the measured concentrations of pollutants<br />
with approximate emission concentration guidelines known as MATE values<br />
(minimum acute toxicity effluents).<br />
These MATE values have tabulated for<br />
several compounds or classes and there is a specific MATE concentration for<br />
each compound and for each type of effluent stream (solid, liquid, or gaseous).<br />
The MATE values are used to compute the ratio of the measured concentration<br />
to the MATE concentration, and this ratio is termed the "degree of hazard."<br />
The "degree of hazard" for each pollutant is then summed to provide the<br />
"degree of hazard" for the effluent stream under consideration. This value,<br />
when multiplied by the effluent flowrate, in specific units (e.g., liters<br />
per second), establishes the "toxic unit dj-scharge rate" (TUDR) for the<br />
stream.<br />
The SAM/lA methodology, as described above, was utilized to analyze<br />
the data obtained for each of the three primary effluent streams from<br />
the Purox process (slag, scrubber effluent, and boiler stack gas). Based<br />
on the SAM/lA methodology, the scrubber effluent had the highest "degree of<br />
hazard," being considerably greater than the "degree of hazard" for the input<br />
river water. However, the slag stream had the highest "toxic unit discharge<br />
rate."<br />
The boiler flue gas effluent had the lowest "degree of hazard" and<br />
the lowest "toxic unit discharge rate." Both of these values were comparable<br />
to the baseline values computed for boiler flue gas when burning natural<br />
gas.<br />
Municipal Incinerator Fired With MSW<br />
The Braintree municipal incinerator (Braintree, Massachusetts) is<br />
a mass-burn facility consisting of twin water-wall combustion units, each<br />
with a design capacity of 120 tons of MSW for 24-hr period. A portion of<br />
the steam produced (20-35%) is supplied to neighboring manufacturers and<br />
the remainder is condensed. Each furnace is equipped with an ESP and both<br />
ESP's exhaust to a common stack.<br />
The Riley Stoker boilers are of the single pass design, each having<br />
a rated capacity of 30,000 lb of steam/hr at 400'F and 250 psig. The ESP<br />
units are single field, 12 passage precipitators with a specific collection<br />
area of 125 ft2/1000 acfm; each has a design collection efficiency of 93%.<br />
Environmental assessment of the incinerator facility was conducted<br />
using EPA approved sampling and analysis procedures similar to these identified<br />
in Figure 2. Results and conclusions of the testing effort are summarized<br />
below.<br />
329
Of the criteria pollutants, S02, NO , and hydrocarbon emissions<br />
were low. However, CO levels were high and cguld not be explained considering<br />
the large quantities of excess air that were used. The average particulate<br />
concentration was 0.24 gr/dscf, corrected to 12% C02. This level exceeded<br />
the federal and state regulations. However, subsequent tests for compliance<br />
had an outlet particulate loading of 0.074 gr/dscf, which shows compliance.<br />
Elemental analysis of the glass-and metal-free bottom ash revealed<br />
an overall increase in the elemental concentrations when compared to the<br />
refuse feed. The collected fly ash contained levels of chlorides, sulfates<br />
and some trace metals which may be of concern. PCB's were not detected in<br />
the collected fly ash; 4 PAH compounds were identified.<br />
Levels of BOD, COD, oil and grease, TSS and TDS in the bottom ash<br />
quench water do not appear to be of concern. The phenolic content was found<br />
to be < 0.1 mg/liter in all samples.<br />
Levels of gaseous chlorides and other halides were low. Presence<br />
of PCB's was confirmed only in the SASS train XAD-2 resin at a concentration<br />
of 3.6 pg/m3.<br />
Results of the SAM/lA environmental assessment procedure showed<br />
the incinerator stack emissions to have the highest apparent degree of health<br />
hazard. Further analysis is needed to determine the exact composition of<br />
the organic components of the stack emissions to better ascertain the hazard<br />
potential. SAM/lA also showed that the bottom ash effluent had the largest<br />
toxic unit discharge rate due primarily to the abundance of phosphorus and<br />
metals in this stream.<br />
Power Plant Boiler Fired With Woodwaste and Fuel Oil<br />
The No. 1 unit at the Burlington Electric Plant (Burlington, Vermont)<br />
was originally a coal-fired boiler which has since been modified to fire<br />
wood chips with supplementary No. 2 fuel oil. Because of the high moisture<br />
content of the chips, the boiler cannot provide the desired steam output on<br />
wood alone. Therefore, No. 2 fuel oil is used. Steam production is rated<br />
at 100,000 lb/hr, which powers a 10 MW turbine generator. Residual ash from<br />
the boiler is discharged at the end of the grate into a hopper and is then<br />
pneumatically transported to an emission control system consisting of two,<br />
high efficiency mechanical collectors in series. For a flue gas flow rate<br />
of 60,000 acfm at 330°F, the collectors were designed for an overall pressure<br />
drop of 6.5 in. H20 and a collection efficiency of 97.75%.<br />
Sampling and analysis was based on the matrix shown in Figure 3.<br />
Major results and conclusions of the tests are as follows:<br />
On a heat input basis, wood accounted for 80% of the boiler fuel,<br />
and oil the remainder. The heat of combustion of wood was 5870 Btu/lb (as<br />
received) and for oil, the heat of combustion was 19,500 Btu/lb.<br />
330<br />
1
Bottom ash analysis indicated that most elements were more concentrated<br />
in the ash relative to the input fuels. No PCB's were detected<br />
in bottom ash but one PAH compound, phenanthrene, was present at a concentration<br />
of 0.89 pg/g. Primary and secondary collector ash contained no PCB's<br />
but several PAH compounds were identified in the secondary ash, with one<br />
sample containing 10 pg/g of phenanthrene.<br />
Particle sizing at the collector inlet and outlet, could not be<br />
established due to constant plugging of the optical counters dilution system.<br />
Stack concentration of particulates averaged 0.08 gr/dscf and the collector<br />
had a particulate efficiency of 94.2%. NO and SO2 concentrations averaged<br />
66 and 138 ppm respectively. CO averaged $13 ppm and hydrocarbons 9 ppm.<br />
Analysis of Method 5 particulate indicated concentrations approaching 100<br />
pg/dscm for Pb, Ba, Sr, Fe and Ti in the stack gases.<br />
the stack gases were negative.<br />
PCB and PAH tests of<br />
EPA's SAM-1A analysis indicated that the secondary collector ash<br />
contained the highest degree of hazard although all three ash streams were<br />
similar in the magnitude of their hazard values. Stack emissions showed a<br />
low degree of hazard. The primary collector ash had the highest toxic unit<br />
discharge rate.<br />
Steam Boiler Fired With Coal and Densified Refuse-Derived Fuel (d-RDF)<br />
Emission tests were conducted on the GSA/Pentagon facility's No.<br />
4 boiler in Arlington, Virginia during a test burn program coordinated by<br />
the General Services Administration (GSA) and the National Center for Resource<br />
Recovery (NCRR). The No. 4 unit is an underfeed-retort stoker boiler with<br />
a rated steam capacity of 70,000 lb/hr at 125 psig and 350'F. During the<br />
tests, the boiler was equipped with a multiclone collector for removal of<br />
particulates from the exhaust gases.<br />
The test burn program included three fuel firing modes: 100% coal<br />
(baseline conditions), 20% d-RDF + 80% coal, and 40% d-RDF + 60% coal. Samples<br />
of coal, d-RDF, and the coal/d-RDF mixtures were collected hourly by NCRR<br />
and analyzed for moisture, ash, heating value, and chemical composition.<br />
Several daily samples of bottom ash were also collected by NCRR and anlyzed<br />
for loss-on-ignition and chemical composition. MRI conducted sampling and<br />
analysis of the stack effluent. Parameters measured included particulate<br />
concentration, gaseous criteria pollutants (SO2, NO , CO and total hydrocarbons),<br />
and chlorides. The particulate samples wfre further and analyzed<br />
for lead content.<br />
Results of the emission tests showed that:<br />
;'k Particulate emissions were reduced from 22 to 38% when d-RDF<br />
was blended with the original coal fuel. Filterable particulate<br />
emissions were lowest when using the 20% d-RDF blend and rose<br />
again when the proportion of d-RDF was raised to 60%. This<br />
finding may not be conclusive, however, since the boiler load<br />
was held steady during the 20% RDF firing but not during the<br />
60% mode.<br />
331
Q The amount of particulate lead emitted when burning d-RDF with<br />
coal is substantially higher than that from combustion of coal<br />
alone (an average of 1000 pg/m3 with 20% d-RDF, and 2,260 pg/m3<br />
with 60% d-RDF, versus 330 pg/m3 with coal only).<br />
* Chloride emissions showed no definite trend which could be<br />
used to correlate chloride emissions with RDF modes, though<br />
slightly higher concentrations of HC1 were observed in two<br />
of the samples collected during combustion of the 60% d-RDF<br />
blend.<br />
:'? Concentrations of sulfur dioxide, nitrogen oxides and carbon<br />
monoxide all appeared to decrease slightly when the RDF was<br />
used with coal. Because of the very low sulfur content of<br />
d-RDF, SO2 emissions were reduced progressively as the propor-<br />
tion of d-RDF with coal was increased. However, the reduction<br />
in NO and CO levels, may or may not have been the direct re-<br />
sult zf burning d-RDF since they are highly dependent on boiler<br />
combustion conditions.<br />
Power Boiler Fired With RDF<br />
The Hempstead Resource Recovery Plant (Long Island, New York)<br />
receives municipal solid waste, produces a refuse-derived fuel and converts<br />
the fuel to electrical power. The facility consists of two distinct seg-<br />
ments: a refuse processing operation, utilizing the Black Clawson Hydra-<br />
sposal system; and a power house, which contains two steam boilers and two,<br />
20 MW electrical turbine generators, plus the associated control equipment.<br />
Tests were conducted by MRI on the No. 2 unit of the power house,<br />
which is an air-swept spreader stoker, waterwall boiler with a nominal ca-<br />
pacity of 200,000 lbs/hr of steam at 625 psig and 750'F. The bailer was<br />
fired with 100% refuse-derived fuel (RDF), although auxiliary oil burners<br />
are used for start-up and during fuel feed interruptions. Air pollution<br />
controls for the boiler consist of a hank of 12 mechanical cyclones<br />
followed by an electrostatic precipitator.<br />
The purpose of the assessment was primarily to investigate organic<br />
constituents of the stack gases and to quantify odorous components. However,<br />
other tests were also included. Emission streams evaluated included the<br />
boiler bottom ash, cyclone ash, ESP ash and the stack effluent gases. Samples<br />
of the RDF were also collected and analyzed for moisture plus chemical<br />
and elemental composition. The three ash streams were analyzed for elemental<br />
composition. Stack emissions were continuously monitored for SOP, NOx,,CO<br />
02 and total hydrocarbon concentrations, and were also tested to determine<br />
levels of vaporous mercury and aldehydes. In addition, a sample was collected<br />
using the EPA Source Assessment Sampling System (SASS) for analysis<br />
under EPA's Level 1 protocol.<br />
Results of the test program did not indicate any pollutant emis-<br />
sions of major concern. Stack gases contained relatively low concentrations<br />
of S02, NO , and hydrocarbons. Carbon monoxide levels were slightly greater<br />
than anticlpated.<br />
332
t<br />
Emissions of carbonyl compounds (aldehydes) were detected at a<br />
maximum level of 7 pprn (6.5 lb/hr).<br />
Mercury vapor concentrations in the stack effluent were very low<br />
(< 0.12 mg/m3), and it appears that mercury levels are greatest in the fly<br />
ash collected by the electrostatic precipitator. The concentration of mercury<br />
in samples of the RDF was constant at about 3 pg/g.<br />
scjera: L_^^^ ."^+-.l<br />
,.LaLC rllcL6L1~ werc dctccted in the stack gases at relatively<br />
high concentrations. Of these, lead, antimony, chromium, and arsenic were<br />
most notable. Their respective concentrations in the SASS sample were 580,<br />
460, 640, and 560 pg/m3.<br />
Elemental analysis of the bottom ash, cyclone ash,<br />
and ESP ash streams also indicated that many of the more volatile elements<br />
were associated with the smaller sized particles.<br />
Organic analysis of the SASS sample, using EPA Level 1 and addi-<br />
tional GC/MS analytical techniques, showed a variety of organic constituents.<br />
No single compound group appeared to predominate, although several polynuclear<br />
aromatic hydrocarbons were detected. All organic results were qualitative.<br />
Compounds consistently observed in all SASS component extracts<br />
included naphthalene, fluoranthene, acenaphthylene, pyrene, phenanthrene/<br />
anthracene, bis(2ethylhexyl) phthalate, and diphenylamine. The majority of<br />
additional compounds were found in the XAD-2 resin extract and included two<br />
chlorobenzenes, hexachlorobenzene, fluorene, and di-butylphthalate.<br />
333
334
2<br />
0 -<br />
.<br />
m 0<br />
336<br />
V<br />
Ll<br />
w<br />
I<br />
rl<br />
d<br />
0
ENVIRONMENTAL AND HEALTH ASPECTS <strong>OF</strong> BIOMASS ENERGY SYSTEMS*<br />
H. M. Braunstein and F. C. Kornegay<br />
Energy Division, Oak Ridge National Laboratory,<br />
Post Office Box X, Oak Ridge, TN 37830<br />
In a recent study (1) undertaken to ensure the early incorporation of environmental<br />
considerations in decisions concerning biomass-to-energy systems, a number<br />
of issues emerged indicating the need for early attention to environmental, socioeconomic<br />
and health concerns. Both production of biomass as well as conversion<br />
can lead to environmental impact, and although most impacts will be site-specific,<br />
some generic effects can be identified.<br />
The most important potential impacts<br />
arise first, from the need for large-scale commitment of resources for production,<br />
and second, from uncontrolled widespread small-scale utilization.<br />
Because biomass-related impacts cover a very broad spectrum of materials,<br />
processes, end products, and effects, the discussion presented here, except for<br />
an overview of generic effects and comment on production impacts, will be directed<br />
primarily to those resulting from residential wood combustion.<br />
Table I summarizes the potential negative impacts associated with biomass<br />
energy systems. Small scale refers to on-farm, residential or small commercial<br />
facilities and large-scale implies industrial size. It is assumed that implemen-<br />
tation of completely effective environmental control for either biomass production<br />
and harvesting or small-scale conversion will be difficult to attain whereas<br />
industrial installations will be subject to existing or future regulation on air,<br />
water, and solid waste emissions. This accounts in some cases for a greater<br />
severity of impacts projected for small-scale application compared to industrial-<br />
scale deployment of the same technology. A note of caution is essential in<br />
interpreting the data in Table I. Because biomass systems are not yet well defined<br />
and because many of the issues are complex and far-reaching, assessment of the<br />
severity of environmental impact at this time must be considered only as an<br />
indicator of potential for negative effect and definitely not as a prediction<br />
of unavoidable impact. This is especially applicable to the as-yet-unripe<br />
technologies involving energy cultivation, such as silviculture, agriculture,<br />
and mariculture (marine farming).<br />
Potential impacts of biomass production, which can be summarized in<br />
terms of:<br />
0 Land use (and abuse)<br />
0 Water use (and abuse)<br />
0 Erosion and sedimentation<br />
0 Agricultural and forest runoff<br />
and 0 Disturbance of ecosystems,<br />
can be attributed directly to the necessary properties of an energy farm:<br />
0 Intensive species management<br />
0 Fast growing and regenerative species (monocultural)<br />
0 Short rotation time<br />
0 Weed and pest control<br />
0 Large land tracts<br />
and 0 Use of presently underutilized land.<br />
* Research sponsored by the U.S. Department of Ener9.y under contract W-7405-eng-26<br />
with the Union Carbide Corporation.<br />
337
-1<br />
-<br />
-1<br />
><br />
338<br />
ssewokq<br />
JaleMqsaJj<br />
x<br />
al<br />
m ?<br />
u?o<br />
.r aJL c,<br />
+e<br />
.r -v 0<br />
.r<br />
V.mm<br />
%U<br />
c<br />
w w<br />
-E<br />
m e<br />
vo VIL<br />
.?<br />
L ><br />
aJc<br />
I 5<br />
I<br />
c,<br />
01<br />
h<br />
c,.<br />
om c .<br />
01 3<br />
LaJ<br />
m c<br />
VI c,<br />
LaJ .r E<br />
n<br />
naJ<br />
3--<br />
Lnv<br />
m-<br />
u??<br />
xm '7 aJ v<br />
0 5 E<br />
z m w
Because biomass energy production systems are projected as operating on a very large<br />
scale, the projected environmental impacts tend to be an exaggeration of well-defined<br />
effects which are now controlled or mitigated in existing production and harvest<br />
schemes. For example, land use impacts of energy production arise from the need<br />
for a large commitment of land (it requires 38 million acres to produce one quad Of<br />
energy). Land is unavailable except either in competition with food, fiber, or live-<br />
stock production, or by using underutilized land.<br />
Land is only underutilized when<br />
it is of low quality and unsuitable for cultivation because of problems such as<br />
wetness, dryness, or high erosion potential. Potential environmental impacts of<br />
intensive monoculture cultivation of low quality, marginal, or uncultivated lands<br />
have been well documented (1). In addition to possible water and soil nutrient<br />
depletion, and air and water pollution, conversion of such areas to biomass<br />
plantations could result in destruction of the last remnants of once-extensive<br />
wild1 ife habitats.<br />
In order to effect the release of the energy in biomass materials, they must<br />
be converted either directly, by combustion, or indirectly, by thermochemical or<br />
biochemical conversion. This involves a wide variety of technoloqies, many<br />
different processes, and various-sizP operations. Of the resulting array<br />
of biomass-to-energy options, one of the most familiar and readily available<br />
is residential wood combustion. Unfortunately, few definitive environmental<br />
impact data exist for this use. Because wood burninq is relatively free of some<br />
of the most serious environmental problems associated with coal combustion<br />
such as solid waste disposal and sulfur dioxide emission, and because environmental<br />
control is difficult to implement at the home-owner level, little attention has been<br />
focused on environmental management of this biomass apolication. However, home<br />
wood burning, which is becoming increasingly more popular and widespread, produces<br />
air emissions which, if uncontrolled, can pose a threat not only to the environment<br />
but also to human health. The important thermal decomposition products of wood are<br />
smoke (a mixture of solid particles and condensed liquid particulates), volatile<br />
hydrocarbons, and carbon monoxide. Significantly, even when wood burninq Droduces<br />
low concentrations of smoke, larqe quantities of carbon monoxide may be oroduced (2).<br />
Additionally, the conditions that promote abundant emission of both smoke and carbon<br />
monoxide are exactly those prevalent in the conventional residential wood stove or<br />
fireplace (1).<br />
Unfortunately, attempts to estimate the air quality impacts of small-scale<br />
residential combustion are hindered by the lack of standard techniaues such as exist<br />
for assessing the emissions associated with large centralized sources. The latter<br />
commonly employ sophisticated emission abatement devices, uniform fuels, and<br />
carefully designed, operated, and maintained combustion devices. Wone of these<br />
assumptions apply to the residential wood stove. Nonetheless, the rapid Dace<br />
with which wood stoves are replacing more conventional heatinq sources and the<br />
consequent potential for environmental impact, demands an evaluation.<br />
Available predictive techniques were utilized to predict qround-level concentrations<br />
of pollutants from wood combustion devices. These techniques (3) assume<br />
Gaussian distributions of pollutants, and are most applicable in flat to gently<br />
rolling terrain. Concentrations can be calculated for a variety of pollutant<br />
emission rates, wind speeds, and wind directions. Usinq this tyoical Gaussian<br />
dispersion approach, the values in Tables I1 and 111 were obtained. The time<br />
and distance dependence were determined for groundlevel concentrations of emissions<br />
from one wood combustion device burning 3 kg of wood per hour under the following<br />
typical meteorological conditions:<br />
wind speed 2m/sec<br />
effective emission heiaht 10 m<br />
atmospheric stabi 1 i ty stable, class E.<br />
339
Table 11 - Maximum One-hour Ground Level Concentrations Of Emissions<br />
3<br />
From One Wood-burning Device (pq/m )<br />
Downwind Distance SAove (oak) Stove (pine)b Fireplace<br />
(m) Particulates Hydrocarbonsd COe Particulates ParticulatesC<br />
10<br />
25<br />
50<br />
75<br />
100<br />
150<br />
200<br />
250<br />
300<br />
f<br />
Time (hrs)<br />
1.5 1 - 32 114<br />
4.6 3 - 98 354<br />
4.2 3 - 87 320<br />
3.3 2 - 70 254<br />
2.1 1 - 45 161<br />
1.5 1 - 31 111<br />
1.1 0.7 - 23 82<br />
0.8 0.5 - 17 62<br />
3<br />
Table I11 - Peak Concentrations (tiq/m<br />
8.8<br />
27.2<br />
24.6<br />
19.5<br />
12.4<br />
8.5<br />
6.3<br />
4.8<br />
1 4.? 3 - 99 356 27.4<br />
3 3.2 2 - 67 242 18.6<br />
24 1.5 1 - 32 116 8.9<br />
Table IV - Short-term Worst-case Estimates From A Study Areag (vg/m3)<br />
10<br />
25 53 31 - 1071 4017<br />
50 52 30 - 1070 3991<br />
100 51 30 - 1050 3939<br />
150 51 30 - 1040 3900<br />
200 50 29 - 1029 3809<br />
250 49 29 - io09 3718<br />
300 48 28 - 988 3666<br />
ref. (5). Emissions: 1.7 g/kg wood<br />
ref. (5). Emissions: 10.0 g/kg wood<br />
ref. (6). Emissions: 15.0 g/kg wood<br />
ref. (7). Emissions: range 1 g/kg to 35 g/kg wood<br />
4)<br />
ref. (8). Emissions: 130 g/kg wood<br />
Time scaling factors from ref. (3)<br />
Study area:<br />
309<br />
307<br />
303<br />
300<br />
293<br />
286<br />
282<br />
Size<br />
1/2km x 1/’2km<br />
Housing density<br />
4 units/acre = 247 dwellings<br />
Wood use<br />
3 kg/hr/house<br />
Emissions rates same as in Table I1<br />
340<br />
13.2<br />
40.7<br />
36.8<br />
29.2<br />
18.6<br />
12.8<br />
9.4<br />
7.2<br />
41.1<br />
28.0<br />
13.3<br />
463<br />
459<br />
453<br />
445<br />
439<br />
428<br />
422
I<br />
In the Clean Air Act Amendments of 1977 (PL 95-95), the EPA defined that amount<br />
of adverse effect on air quality allowed in the prevention of significant deterior-<br />
I<br />
1 ation (PSD) regulations. Presently, only large facilities such as industrial sources<br />
and power plants are reviewed for PSD compliance. However, the allowable deterioration<br />
represents reasonable levels of air quality degradation deemed acceptable. PSD<br />
increments for particulates (none exist for carbon monoxide or hydrocarbons) are given<br />
for clay I & I1 areas (4). For presently pristine (Class I) areas incremenjs are<br />
10 ug/m maximum for a 24 hour period with an overall mean maximum of 5 ug/m ; for<br />
typical (Class 11) areas, patjticulate concentration2 are limited to a 24 hour<br />
maximum increment of 37 Ug/m and a mean of 19 ug/m . Clearly, values in Table I1<br />
show that of several woodburning stoves located within 100 meters of each other<br />
would exceed allowable increased in pristing areas and would consume much of the<br />
allowable increases in typical areas.<br />
Were a community of houses to convert to wood heat, under adverse meteorological<br />
conditions (inversion with a 15 meter stable layer), the air quality impact would<br />
be far more severe, as indicated in Table IV. The study area in Table IV represents<br />
a typical small community, and the dispersion conditions are representative of small<br />
Appalachian region. The assumed adverse conditions represent a real istic worst case<br />
situation that could be expected to occur nightly in some locations in the<br />
southeastern U.S. and in New England occasionally lastinq for UP to 24 hours.<br />
all 247 houses in the community heat with wood for four months the total particulate<br />
emissions from a 1000 MWe coal-fired power plant serving the needs of approximately<br />
500,000 people using a state-of-the-art particulate removal system (99.5% efficient)<br />
would emit approximately 13 tons of particulate during the same time period (10).<br />
In addition, although little is known about the potential health effects of long-<br />
term exposure to wood combustion particulates, many of the identified hydrocarbons<br />
are known carcinogens (1). Additionally, preliminary studies indicate the potential<br />
for adsorption of polycyclec aromatic hydrocarbons onto the surface of respirablesize<br />
wood ash particles (11).<br />
The level of carbon monoxide downwind of the smalj community is within the<br />
currqnt ambient 8 hour maximum standard of 10,000 uq/m (4). However, the 4,000<br />
pg/m should perhaps not be considered inconsequential. Animal studies indicate<br />
that exposure to low levels of carbon monoxide for periods as short as four hours<br />
converts the myocardium from aerodic to anaerobic metabolism leading to ultrastructural<br />
heart damage (12).<br />
Biomass-to-enerqy systems, by utilizing a revewable resource, can make an<br />
important contribution to our overall energy needs. However, insurance of environmental<br />
acceptability will require close attention to the possible impacts of<br />
rapid, impulsive, and uncontrolled implementation.<br />
dispersed, small-scale environmental alterations and to consider local effects as<br />
insignificant relative to the large centralized source. Implicit in this accomo-<br />
dation is the doctrine that environmental dilution is equivalent to environmental<br />
dissipation. But because a renewable technology is a lonq-term technoloqy, an<br />
in-depth evaluation will require knowledge about low-level, long-term effects.<br />
Unfortunately, this is an area that we know little about. Thus, until this<br />
information is available, it may be difficult to assess long-term effects of<br />
the large number of relatively small, dispersed disturbances that can arise from<br />
this broad-based techno1 ogy.<br />
341<br />
If<br />
Our habit has been to accomodate
1.<br />
5.<br />
6.<br />
7.<br />
8.<br />
9.<br />
10.<br />
11.<br />
12.<br />
References<br />
H. Braunstein, R. D. Roop, F. E. Sharples, J. Tatum, P. Kanciruk, T. Pearson and<br />
K. Oakes, 1980. Biomass Energy Systems, An Environmental Assessment, Oak Ridge<br />
National Laboratory, Oak Ridge, TN. In review.<br />
T. Y. King, 1975. Smoke and Carbon Monoxide Formation from Materials Tested in<br />
the Smoke Density Chamber, National Bureau of Standards, Wash. D.C.<br />
Recommended Guide for the Prediction of the Dispersion of Airborne Effluents 1973.<br />
The American Society of Mechanical Engineers, New York, N.Y.<br />
National Primary and Secondary Ambient Air Quality Standards, EPA. Federal<br />
Register Vol. 36 No. 84, Friday, April 30, 1971 pp. 8186-8187. Clean Air Act<br />
Amendments.of 1977 (PL 95-95) 91 Stat. 731, Part C.<br />
S. S. Butcher and 0. I. Buckley 1977. A Preliminary Study of Particulate<br />
Emissions from Small Wood Stoves, JAPCA 27(4): 346-8.<br />
M. Feldstein 1971. In Combustion-Generated Air Pollution, ed. E.S. Starkman,<br />
Plenum Press New York, pp. 291-318.<br />
U.S. EPA 1977. Compilations of Air Pollutant Emission Factors, 3rd ed., EPA<br />
Rep. AP-42 Research Triangle Park, N.C.<br />
J. E. Milliken 1979. Airborne Emissions from Wood Combustion, presented to<br />
the Wood Energy Institute Wood Heating Seminar IV, March 22-24, Portland, Oregon.<br />
T. L. Montgomery and J. H. Coleman 1975. Empirical Relationships Between Time-<br />
Averaged SO2 Concentrations, Environ. Science Tech. 9(11): 953-7.<br />
A. S. Dvorak et a1 1977. The Environmental Effects of Using Coal for Generating<br />
Electricity NUREG-0252, Argonne National Laboratory, Chicago, IL.<br />
M. Golembiewski 1979. Environmental Assessment of a Waste-to-Energy Process<br />
Wood and Oil-Fired Power Boiler, Midwest Research Institute, Kansas City, MO.<br />
National Academy of Sciences, 1977. Carbon Monoxide, Washington, D. C.<br />
342<br />
1


