AnnuAl RepoRt 2010/2011 - Heiler Software AG
AnnuAl RepoRt 2010/2011 - Heiler Software AG
AnnuAl RepoRt 2010/2011 - Heiler Software AG
Create successful ePaper yourself
Turn your PDF publications into a flip-book with our unique Google optimized e-Paper software.
tuRninG DAtA into BuSineSS<br />
<strong>AnnuAl</strong> <strong>RepoRt</strong> <strong>2010</strong>/<strong>2011</strong> (ShoRt VeRSion - Key FActS)
1<br />
tuRninG DAtA into BuSineSS<br />
heileR SoFtWARe <strong>AG</strong> At A GlAnce<br />
heiler <strong>Software</strong> <strong>AG</strong> (iSin: De 0005429906, German Sin: 542 990), founded in 1987, with its main location in Stuttgart, a branch office<br />
in Australia and a subsidiary in the uS, is a specialist for electronic procurement and product information management (piM). the advanced<br />
solutions support buyers, retailers and manufacturers with the administration and publication of product information. Broad services<br />
round up the range of products. heiler <strong>Software</strong> serves well-known major enterprises in europe, north America and Asia-pacific.<br />
Key Figures (IFRS)<br />
(in teuR) 2006/07<br />
Sales revenues<br />
EBITDA<br />
eBitDA in % of sales revenues<br />
EBIT<br />
eBit in % of sales revenues<br />
EBT<br />
eBt in % of sales revenues<br />
Net income<br />
net income in % of sales revenues<br />
Earnings per share (EpS in EUR)<br />
Shareholders‘ equity<br />
Equity ratio<br />
Liquidity<br />
Average number of employees<br />
220%<br />
200% 120%<br />
180%<br />
100%<br />
160%<br />
140%<br />
80%<br />
120%<br />
100%<br />
60%<br />
80%<br />
60%<br />
40%<br />
<strong>2010</strong> <strong>2011</strong><br />
oct Okt nov Nov Dec Dez Jan Feb Mar Mär Apr May Mai Jun Jul Jul Aug Sep<br />
<strong>Heiler</strong> <strong>Software</strong> <strong>AG</strong><br />
Dax 30<br />
10,227<br />
60<br />
1%<br />
-168<br />
-2%<br />
516<br />
5%<br />
783<br />
8%<br />
0.07<br />
19,263<br />
87%<br />
14,436<br />
84<br />
Technology-All-Share<br />
120% 2.80<br />
100%<br />
2.40<br />
80%<br />
2.00<br />
60%<br />
40%<br />
2007/08 2008/09 2009/10<br />
12,499<br />
609<br />
5%<br />
317<br />
3%<br />
747<br />
6%<br />
1,630<br />
13%<br />
0.14<br />
21,078<br />
87%<br />
15,716<br />
84<br />
<strong>2010</strong> <strong>2011</strong><br />
oct Okt nov Nov Dec Dez Jan Feb Mar Mär Apr May Mai Jun Jul Aug Sep Sep<br />
<strong>Heiler</strong> <strong>Software</strong> <strong>AG</strong><br />
11,773<br />
-453<br />
-4%<br />
-724<br />
-6%<br />
-346<br />
-3%<br />
-742<br />
-6%<br />
-0.06<br />
20,248<br />
87%<br />
14,955<br />
97<br />
Development of the <strong>Heiler</strong>-share (indexed) Development of the <strong>Heiler</strong>-share (in EUR)<br />
3.00<br />
2.60<br />
2.20<br />
1.80<br />
1.60<br />
1.40<br />
Dax 30<br />
11,791<br />
-527<br />
-4%<br />
-760<br />
-6%<br />
-507<br />
-4%<br />
-456<br />
-4%<br />
-0.04<br />
19,826<br />
87%<br />
15,521<br />
99<br />
<strong>2010</strong>/11<br />
Technology-All-Share<br />
17,414<br />
1,107<br />
6%<br />
894<br />
5%<br />
1,047<br />
6%<br />
1,451<br />
8%<br />
0.13<br />
20,863<br />
82%<br />
15,798<br />
120
letteR to the ShAReholDeRS<br />
Dear shareholders, business partners and customers,<br />
tuRninG DAtA into BuSineSS<br />
in the last fiscal year <strong>2010</strong>/11 we were able to reach new records for sales revenues and profits and were able to further expand our<br />
market position.<br />
Highly profitable growth in all areas<br />
the growth in sales revenues pertaining to all regions was driven by the high demand for our innovative software products. total sales<br />
revenues increased from euR 11.79 million to euR 17.41 million euR (48% increase). high growth in the strong-margin software license<br />
business was especially positive; which with euR 4.42 million more than doubled when compared to the prior year and therefore contributed<br />
considerably to the strong improvement of earnings before interest and taxes by euR 1.65 million to euR 0.89 million.<br />
Customers decide to use <strong>Heiler</strong><br />
the high number of new well-known customers in the last fiscal year provens the attractiveness of our software solutions. large enterprises,<br />
like Abus, Ashford, Bestseller, Bürkert, cancom, Deutscher Sparkassenverlag, edeka, einhell, Frankonia, harman international industries,<br />
hisco, intersport, lawson products, narbonne Accessoires, panduit, princess Auto, Sartorius, Schülke, Siblik, Viega, Werner ladder or<br />
Zürcher Kantonalbank opted in <strong>2010</strong>/11 to use our innovative software solutions.<br />
<strong>Heiler</strong> ranked TOP 10 world-wide<br />
Within a few years we advanced in the area of company-wide electronic product information management to one of the top 10 piMleaders.<br />
in fiscal year <strong>2010</strong>/11 we were named as one of the top 10 piM-leaders for the fifth time in a row by the uS-American market<br />
research institute Gartner. thereby we stand in line with companies like SAp, iBM or oracle.<br />
Focus on internationalization<br />
in order to benefit from our market potential and react quickly to international growth opportunities we have continuously focused on<br />
expanding our sales organization and amongst other things opened a branch office in Sydney, Australia.<br />
effective July 1st, <strong>2011</strong>, Dirk häußermann was appointed as a Member of the Management Board, responsible for Marketing and Sales<br />
Asia-pacific. this position was newly created. these increasing investments in sales are part of our strategy to expand our world-wide<br />
position in the areas of product information management and electronic procurement systems in order to become a leader in the international<br />
market.<br />
Large investments in innovative products<br />
our innovative software solutions enable large retailers and manufacturers to realize new business models in the area of ecommerce.<br />
they will be able to realize more sales revenues, higher profits and gain new customers. in the last fiscal year we have consequently<br />
developed our product portfolio further. We will continue to invest in product development and product innovation at a high level.<br />
High liquidity, high shareholders’ equity, rock solid balance sheet<br />
As in the prior years, heiler <strong>Software</strong> does not have any bank liabilities and with an equity ratio of 82% and a liquidity of euR 15.8 million;<br />
this shows an unchanged solid balance sheet structure. the good levels of liquidity and shareholders’ equity continue to provide us with<br />
the financial independency, which we need in order to take advantage of investment- and growth opportunities on a flexible basis.<br />
<strong>Heiler</strong>-share in an upward trend<br />
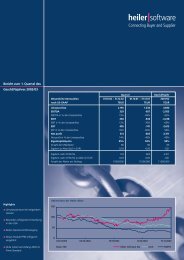
the positive business development is also reflected in the development of the heiler-share. Despite a difficult stock market environment<br />
the heiler-share continued its positive trend and was able to gain a strong improvement in stock price of more than 60% during fiscal<br />
year <strong>2010</strong>/11. untouched from the crisis on the financial markets the heiler-share was therefore able to develop significantly better than<br />
all comparable indices.<br />
Shareholders’ Meeting with high consent<br />
At February 24, <strong>2011</strong>, the 12th ordinary Shareholders’ Meeting was held in Stuttgart. Besides yearly recurring topics, one topic at this<br />
Shareholders’ Meeting was the empowerment to purchase treasury shares for up to 10% of the share capital. Shareholders as well as<br />
members of banks and small shareholders’ representatives showed vested interest in the Shareholders’ Meeting. the positive feedback<br />
1
2<br />
tuRninG DAtA into BuSineSS<br />
Rolf J. <strong>Heiler</strong><br />
Chairman of the<br />
Management Board<br />
Dr. Wolfgang A. Köstler<br />
Member of the<br />
Management Board<br />
Frank Schmidt<br />
Member of the<br />
Management Board<br />
Dirk Häußermann<br />
Member of the<br />
Management Board<br />
of the participants was reflected by the overwhelming majority in which the proposals made by the administration were agreed upon by<br />
the shareholders, similar to prior years.<br />
Positive outlook<br />
For fiscal years <strong>2011</strong>/12 and 2012/13, assuming a stable economic environment, we expect a continuation of our dynamic growth with<br />
yearly increases in sales revenues by more than 20% and continuous improvements in profits.<br />
We see high economic opportunities in the increased internationalization of business activities through further expansion of the in-house<br />
sales organization and the intensified co-operation with integration and sales partners. this strategy has been proven to be successful in<br />
fiscal year <strong>2010</strong>/11 and will be consequently continued in the upcoming fiscal years. the growing customer base, customer satisfaction,<br />
innovative products and a solid balance sheet structure make up the basis in order for us to continue to follow our plans for growth.<br />
Thank You<br />
the Management Board would like to extend thanks to all customers, business partners and employees for successfully working<br />
together. We extend our thanks to all shareholders for the considerable trust you have given heiler <strong>Software</strong> during the <strong>2010</strong>/11 fiscal<br />
year.<br />
December <strong>2011</strong><br />
the Management Board<br />
Rolf J. heiler Dr. Wolfgang A. Köstler Frank Schmidt Dirk häußermann<br />
(chairman of the<br />
Management Board)<br />
(Member of the<br />
Management Board)<br />
(Member of the<br />
Management Board)<br />
(Member of the<br />
Management Board)
conSoliDAteD FinAnciAl StAteMentS<br />
heileR SoFtWARe <strong>AG</strong>, StuttGARt<br />
conSoliDAteD StAteMent oF FinAnciAl poSition At<br />
SepteMBeR 30, <strong>2011</strong><br />
(in euR)<br />
ASSETS<br />
Non-current assets<br />
intangible assets<br />
property, plant & equipment<br />
Financial assets<br />
trade receivables<br />
income tax receivables<br />
prepaid expenses<br />
Deferred tax assets<br />
Current assets<br />
trade receivables<br />
other receivables and assets<br />
income tax receivables<br />
prepaid expenses<br />
cash and cash equivalents<br />
Total assets<br />
LIABILITIES AND SHAREHOLDERS‘ EQUITY<br />
Shareholders‘ equity<br />
Share capital<br />
capital reserves<br />
profit reserves<br />
currency translation<br />
Retained earnings<br />
treasury shares<br />
Long-term liabilities<br />
Finance debt<br />
other liabilities<br />
pension provisions and similar obligations<br />
Deferred income<br />
Deferred tax liabilities<br />
Short-term liabilities<br />
provisions<br />
Finance debt<br />
trade payables<br />
other liabilities<br />
income tax liabilities<br />
Deferred income<br />
Total liabilities and shareholders‘ equity<br />
September 30<br />
<strong>2011</strong><br />
2,412,162<br />
424,401<br />
11,162<br />
8,864<br />
7,495<br />
15,212<br />
2,274,368<br />
5,153,664<br />
4,113,311<br />
92,836<br />
42,857<br />
250,645<br />
15,798,245<br />
20,297,894<br />
25,451,558<br />
11,812,780<br />
8,482,085<br />
7,287<br />
-59,817<br />
1,450,583<br />
-829,999<br />
20,862,919<br />
6,982<br />
10,841<br />
198,793<br />
0<br />
42,329<br />
258,945<br />
112,100<br />
3,458<br />
824,854<br />
2,327,469<br />
12,704<br />
1,049,109<br />
4,329,694<br />
25,451,558<br />
September 30<br />
<strong>2010</strong><br />
2,422,375<br />
326,154<br />
11,162<br />
83,702<br />
8,801<br />
0<br />
1,863,526<br />
4,715,720<br />
2,344,085<br />
11,743<br />
46,560<br />
172,704<br />
15,520,853<br />
18,095,945<br />
22,811,665<br />
11,617,896<br />
8,252,905<br />
7,287<br />
-51,795<br />
0<br />
0<br />
19,826,293<br />
9,212<br />
10,841<br />
170,640<br />
115<br />
47,742<br />
238,550<br />
202,752<br />
3,384<br />
295,608<br />
1,320,518<br />
0<br />
924,560<br />
2,746,822<br />
22,811,665<br />
3
4<br />
conSoliDAteD FinAnciAl StAteMentS<br />
heileR SoFtWARe <strong>AG</strong>, StuttGARt<br />
conSoliDAteD incoMe StAteMent<br />
FoR the peRioD octoBeR 1, <strong>2010</strong> to SepteMBeR 30, <strong>2011</strong><br />
(in euR)<br />
Sales revenues<br />
cost of goods sold<br />
Gross profit<br />
operating expenses:<br />
Research and development expenses<br />
Selling and marketing expenses<br />
General and administrative expenses<br />
other income<br />
Earnings before interest and taxes (EBIT)<br />
interest expenses<br />
interest income<br />
exchange rate losses (-) / gains<br />
Earnings before taxes<br />
income taxes<br />
Net income<br />
earnings per share - undiluted<br />
earnings per share - diluted<br />
(in euR)<br />
Net income<br />
currency translation<br />
Comprehensive income<br />
Fiscal Year<br />
<strong>2010</strong>/11<br />
17,413,742<br />
-8,259,016<br />
9,154,726<br />
-3,198,825<br />
-3,712,382<br />
-1,456,506<br />
-8,367,713<br />
107,367<br />
894,380<br />
-357<br />
172,540<br />
-19,257<br />
1,047,306<br />
403,277<br />
1,450,583<br />
0.13<br />
0.12<br />
Fiscal Year<br />
<strong>2010</strong>/11<br />
Fiscal year<br />
2009/10<br />
11,791,122<br />
-5,728,185<br />
6,062,937<br />
-2,761,258<br />
-2,793,731<br />
-1,329,741<br />
-6,884,730<br />
61,805<br />
-759,988<br />
-373<br />
138,950<br />
114,073<br />
-507,338<br />
51,346<br />
-455,992<br />
heileR SoFtWARe <strong>AG</strong>, StuttGARt<br />
conSoliDAteD StAteMent oF coMpRehenSiVe incoMe<br />
FoR the peRioD octoBeR 1, <strong>2010</strong> to SepteMBeR 30, <strong>2011</strong><br />
1,450,583<br />
-8,022<br />
1,442,561<br />
-0.04<br />
-0.04<br />
Fiscal year<br />
2009/10<br />
-455,992<br />
-14,481<br />
-470,473
conSoliDAteD FinAnciAl StAteMentS<br />
heileR SoFtWARe <strong>AG</strong>, StuttGARt<br />
conSoliDAteD StAteMent oF cASh FloWS<br />
FoR the peRioD octoBeR 1, <strong>2010</strong> to SepteMBeR 30, <strong>2011</strong><br />
(in euR)<br />
Cash flows from operating activities<br />
net income<br />
Adjustments to reconcile net income to cash flows from<br />
operating activities:<br />
Depreciation of property, plant and equipment and amortization of intangible assets<br />
loss on sale of property, plant & equipment<br />
Stock option plans<br />
change in pension provisions and similar obligations<br />
Deferred tax assets / liabilities<br />
other non-cash positions<br />
changes in assets and liabilities:<br />
trade receivables, net of allowance<br />
other receivables and assets<br />
prepaid expenses<br />
trade payables<br />
other liabilities<br />
provisions<br />
Deferred income<br />
Net cash provided in operating activities<br />
Cash flows from investing activities<br />
purchase of intangible assets<br />
purchase of property, plant and equipment<br />
Net cash used in investing activities<br />
Cash flows from financing activities<br />
proceeds from exercising of stock options<br />
purchase of treasury shares<br />
payments for finance lease<br />
Net cash used in financing activities<br />
net increase in cash and cash equivalents<br />
cash and cash equivalents at beginning of the fiscal year<br />
Cash and cash equivalents at end of the fiscal year<br />
Supplemental disclosure of cash flow information:<br />
income taxes paid<br />
interest income received<br />
income taxes received<br />
Fiscal Year<br />
<strong>2010</strong>/11<br />
1,450,583<br />
212,779<br />
360<br />
42,561<br />
28,153<br />
-416,255<br />
-12,393<br />
-1,694,388<br />
-76,084<br />
-93,153<br />
529,246<br />
1,019,655<br />
-90,652<br />
124,434<br />
1,024,846<br />
-49,596<br />
-250,965<br />
-300,561<br />
385,262<br />
-829,999<br />
-2,156<br />
-446,893<br />
277,392<br />
15,520,853<br />
15,798,245<br />
41,290<br />
115,589<br />
35,994<br />
Fiscal year<br />
2009/10<br />
-455,992<br />
233,186<br />
5,136<br />
49,016<br />
15,686<br />
-9,692<br />
-17,369<br />
989,523<br />
114,102<br />
-85,797<br />
-75,721<br />
36,861<br />
-25,543<br />
-24,227<br />
749,169<br />
-29,302<br />
-151,527<br />
-180,829<br />
0<br />
0<br />
-2,550<br />
-2,550<br />
565,790<br />
14,955,063<br />
15,520,853<br />
39,921<br />
96,127<br />
130,706<br />
5
6<br />
conSoliDAteD FinAnciAl StAteMentS<br />
heileR SoFtWARe <strong>AG</strong>, StuttGARt<br />
conSoliDAteD StAteMent oF chAnGeS in<br />
ShAReholDeRS’ eQuity<br />
FoR the peRioD octoBeR 1, <strong>2010</strong> to SepteMBeR 30, <strong>2011</strong><br />
(in euR)<br />
Statement of financial position<br />
at September 30, 2009<br />
comprehensive income<br />
(10/01/2009 - 09/30/<strong>2010</strong>)<br />
option costs allocated<br />
to capital reserves<br />
Withdrawal from<br />
capital reserves<br />
Statement of financial position<br />
at September 30, <strong>2010</strong><br />
comprehensive income<br />
(10/01/<strong>2010</strong> - 09/30/<strong>2011</strong>)<br />
option costs allocated<br />
to capital reserves<br />
exercising of<br />
stock options<br />
purchase of<br />
treasury shares<br />
Statement of financial position<br />
at September 30, <strong>2011</strong><br />
Share<br />
capital<br />
11,617,896<br />
0<br />
0<br />
0<br />
11,617,896<br />
0<br />
0<br />
194,884<br />
0<br />
11,812,780<br />
capital<br />
reserves<br />
26,006,173<br />
0<br />
49,016<br />
-17,802,284<br />
8,252,905<br />
0<br />
42,561<br />
190,378<br />
-3,759<br />
8,482,085<br />
profit<br />
reserves<br />
7,287<br />
0<br />
0<br />
0<br />
7,287<br />
0<br />
0<br />
0<br />
0<br />
7,287<br />
currency<br />
translation<br />
-37,314<br />
-14,481<br />
0<br />
0<br />
-51,795<br />
-8,022<br />
0<br />
0<br />
0<br />
-59,817<br />
Accumulated<br />
deficit /<br />
Retained<br />
earnings<br />
treasury<br />
shares Total<br />
-17,346,292<br />
-455,992<br />
0<br />
17,802,284<br />
0<br />
1,450,583<br />
0<br />
0<br />
0<br />
1,450,583<br />
0<br />
0<br />
0<br />
0<br />
0<br />
0<br />
0<br />
0<br />
-829,999<br />
-829,999<br />
20,247,750<br />
-470,473<br />
49,016<br />
0<br />
19,826,293<br />
1,442,561<br />
42,561<br />
385,262<br />
-833,758<br />
20,862,919
FinAnciAl cAlenDAR <strong>2011</strong>/12<br />
Financial Reports <strong>2011</strong>/12<br />
02/15/2012<br />
05/15/2012<br />
08/15/2012<br />
other financial dates<br />
03/07/2012<br />
Annual Report <strong>2011</strong>/12<br />
12/19/2012<br />
heileR-ShARe FActS<br />
iSin / Securities identification number<br />
Stock market code<br />
trading segment<br />
Designated sponsor<br />
First quoted on<br />
Share capital / number of shares<br />
category<br />
Stock price at start / end of fiscal year <strong>2010</strong>/11<br />
change in fiscal year <strong>2010</strong>/11 (absolute / relative)<br />
Maximum / minimum price (Xetra closing price)<br />
Market capitalization at September 30, <strong>2011</strong><br />
tuRninG DAtA into BuSineSS<br />
Release of interim Report 1 st Quarter <strong>2011</strong>/12<br />
Release of half-year Financial Report <strong>2011</strong>/12<br />
Release of interim Report 3 rd Quarter <strong>2011</strong>/12<br />
ordinary Shareholders‘ Meeting<br />
Release of Annual Report <strong>2011</strong>/12<br />
De0005429906 / 542 990<br />
hlR.FSe<br />
Frankfurt Stock exchange (General Standard)<br />
BankM<br />
11/07/2000<br />
11,812,780 euR / 11,812,780<br />
ordinary bearer shares<br />
1.58 euR / 2.55 euR<br />
+0.97 euR / +61.39%<br />
2.90 euR / 1.53 euR<br />
30,122,589 euR<br />
7
tuRninG DAtA into BuSineSS<br />
Stuttgart<br />
heiler <strong>Software</strong> <strong>AG</strong><br />
Mittlerer pfad 5<br />
D-70499 Stuttgart<br />
tel.: +49-711-13 98 4-0<br />
Fax: +49-711-86 66 301<br />
e-Mail: info@heiler.com<br />
www.heiler.de<br />
Detroit, USA<br />
heiler <strong>Software</strong> corporation<br />
penoBScot BuilDinG<br />
645 Griswold, Suite 1888<br />
Detroit, Michigan 48226<br />
tel.: +1-313-483-7100<br />
e-Mail: info@heiler.com<br />
www.heiler.com<br />
Toronto, Canada<br />
heiler <strong>Software</strong> corporation<br />
3 Dayspring circle, Suite 202<br />
toronto, on<br />
l6p1B7, canada<br />
tel.: +1-313-334-3730<br />
e-Mail: info@heiler.com<br />
www.heiler.com<br />
Sydney, Australia<br />
heiler <strong>Software</strong> Australia<br />
Suite 405<br />
460 pacific highway<br />
St. leonards nSW 2065<br />
tel.: +61-414-714-817<br />
e-Mail: info@heiler.com<br />
www.heiler.com


