Spreading-rate dependence of melt extraction at mid-ocean ridges ...
Spreading-rate dependence of melt extraction at mid-ocean ridges ...
Spreading-rate dependence of melt extraction at mid-ocean ridges ...

You also want an ePaper? Increase the reach of your titles
YUMPU automatically turns print PDFs into web optimized ePapers that Google loves.
letters to n<strong>at</strong>ure<br />
..............................................................<br />
<strong>Spreading</strong>-<strong>r<strong>at</strong>e</strong> <strong>dependence</strong> <strong>of</strong> <strong>melt</strong><br />
<strong>extraction</strong> <strong>at</strong> <strong>mid</strong>-<strong>ocean</strong> <strong>ridges</strong> from<br />
mantle seismic refraction d<strong>at</strong>a<br />
Daniel Lizarralde 1 , James B. Gaherty 2 , John A. Collins 3 , Greg Hirth 3<br />
& Sangmyung D. Kim 1<br />
1 School <strong>of</strong> Earth and Atmospheric Sciences, Georgia Institute <strong>of</strong> Technology,<br />
Atlanta, Georgia 30332, USA<br />
2 Lamont-Doherty Earth Observ<strong>at</strong>ory <strong>of</strong> Columbia University, Palisades, New York<br />
10964, USA<br />
3 Department <strong>of</strong> Marine Geology and Geophysics, Woods Hole Oceanographic<br />
Institution, Woods Hole, Massachusetts 02543, USA<br />
.............................................................................................................................................................................<br />
A variety <strong>of</strong> observ<strong>at</strong>ions indic<strong>at</strong>e th<strong>at</strong> <strong>mid</strong>-<strong>ocean</strong> <strong>ridges</strong> produce<br />
less crust <strong>at</strong> spreading <strong>r<strong>at</strong>e</strong>s below 20 mm yr 21 (refs 1–3), reflecting<br />
changes in fundamental ridge processes with decreasing<br />
spreading <strong>r<strong>at</strong>e</strong>. The n<strong>at</strong>ure <strong>of</strong> these changes, however, remains<br />
uncertain, with end-member explan<strong>at</strong>ions being decreasing<br />
shallow <strong>melt</strong>ing 3 or incomplete <strong>melt</strong> <strong>extraction</strong> 2 , each due to<br />
the influence <strong>of</strong> a thicker thermal lid. Here we present results <strong>of</strong> a<br />
seismic refraction experiment designed to study <strong>mid</strong>-<strong>ocean</strong> ridge<br />
processes by imaging residual mantle structure. Our results<br />
reveal an abrupt l<strong>at</strong>eral change in bulk mantle seismic properties<br />
associ<strong>at</strong>ed with a change from slow to ultraslow palaeo-spreading<br />
<strong>r<strong>at</strong>e</strong>. Changes in mantle velocity gradient, basement topography<br />
and crustal thickness all correl<strong>at</strong>e with this spreading-<strong>r<strong>at</strong>e</strong><br />
change. These observ<strong>at</strong>ions can be explained by vari<strong>at</strong>ions in<br />
<strong>melt</strong> <strong>extraction</strong> <strong>at</strong> the ridge, with a gabbroic phase preferentially<br />
retained in the mantle <strong>at</strong> slower spreading <strong>r<strong>at</strong>e</strong>s. The estim<strong>at</strong>ed<br />
volume <strong>of</strong> retained <strong>melt</strong> balances the ,1.5-km difference in<br />
crustal thickness, suggesting th<strong>at</strong> changes in spreading <strong>r<strong>at</strong>e</strong> affect<br />
<strong>melt</strong>-<strong>extraction</strong> processes r<strong>at</strong>her than total <strong>melt</strong>ing.<br />
The processes <strong>of</strong> lithospheric form<strong>at</strong>ion <strong>at</strong> <strong>mid</strong>-<strong>ocean</strong> <strong>ridges</strong><br />
(MORs)—mantle upwelling and corner flow, decompression <strong>melt</strong>ing,<br />
<strong>melt</strong> <strong>extraction</strong>, crustal accretion—are central to our understanding<br />
<strong>of</strong> mantle dynamics. The shallow upper mantle preserves<br />
structure inherited from and diagnostic <strong>of</strong> these processes, such as<br />
the p<strong>at</strong>terns <strong>of</strong> <strong>melt</strong> depletion 4 and shear deform<strong>at</strong>ion 5 . These<br />
characteristics affect the mantle’s seismic structure (for example,<br />
velocity and anisotropy). Imaging this structure can thus provide<br />
us with knowledge <strong>of</strong> the processes th<strong>at</strong> have formed <strong>ocean</strong>ic<br />
lithosphere <strong>at</strong> different times and under a variety <strong>of</strong> conditions.<br />
The main FAIM (far-<strong>of</strong>fset active-source imaging <strong>of</strong> the mantle)<br />
experiment transect, line 1, extends 800 km along a pl<strong>at</strong>e-kinem<strong>at</strong>ic<br />
flow line in the western <strong>mid</strong>-Atlantic, within a single spreading<br />
segment across lithosphere ranging in age from 108 to 157 million<br />
years (Myr) ago (ref. 6) (Fig. 1). Slow palaeo-spreading <strong>r<strong>at</strong>e</strong>s here<br />
enable us to investig<strong>at</strong>e upper-mantle structure over a 35-Myr age<br />
span, and vari<strong>at</strong>ions in palaeo-spreading <strong>r<strong>at</strong>e</strong>s during this time<br />
provide a means <strong>of</strong> evalu<strong>at</strong>ing the <strong>r<strong>at</strong>e</strong> <strong>dependence</strong> <strong>of</strong> MOR<br />
processes. Eight pairs <strong>of</strong> vertical-component, 2-Hz <strong>ocean</strong>-bottom<br />
seismometers (OBSs) were deployed along line 1, spaced 80–120 km<br />
apart, and two OBSs were deployed <strong>at</strong> the ends <strong>of</strong> the orthogonal<br />
line 2, 150 km apart.<br />
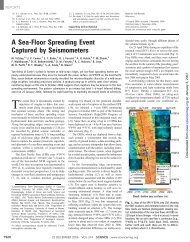
A primary result <strong>of</strong> the FAIM experiment is th<strong>at</strong> mantle refractions<br />
sourced by airguns can be recorded <strong>at</strong> very far <strong>of</strong>fsets (Fig. 2).<br />
On line 1, strong mantle refractions are observed to maximum<br />
<strong>of</strong>fsets <strong>of</strong> 375 km by instruments on the eastern half <strong>of</strong> the transect.<br />
This phase is also observed to the maximum <strong>of</strong>fset by both<br />
instruments on line 2. However, mantle refractions are not observed<br />
by instruments loc<strong>at</strong>ed on the western half <strong>of</strong> line 1. The lack <strong>of</strong><br />
observed mantle refractions in the west most probably reflects a<br />
change in the propag<strong>at</strong>ion properties <strong>of</strong> the mantle, because noise<br />
744<br />
© 2004 N<strong>at</strong>ure Publishing Group<br />
characteristics and instrument performance are the same in the east<br />
and west, and crustal phases are well recorded on all instruments.<br />
The transition from propag<strong>at</strong>ion to non-propag<strong>at</strong>ion <strong>of</strong> mantle<br />
refractions occurs near kilometre (km) 300 (eastward from the<br />
westernmost instrument), and it is abrupt, as evidenced by<br />
the coincident trunc<strong>at</strong>ion <strong>at</strong> this loc<strong>at</strong>ion <strong>of</strong> refractions recorded<br />
by the instruments east <strong>of</strong> km 300 (Fig. 2). Primary mantle refractions<br />
from shots fired west <strong>of</strong> km 300 do not propag<strong>at</strong>e back to the<br />
sea floor with recognizable energy. The simplest explan<strong>at</strong>ion for this<br />
energy dissip<strong>at</strong>ion is th<strong>at</strong> the vertical velocity gradient west <strong>of</strong><br />
km 300 is near zero or neg<strong>at</strong>ive, consistent with conclusions from<br />
an explosive-source seismic study in the same region 7 (Fig. 1).<br />
Mantle refraction travel times for lines 1 and 2 are well fitted with<br />
a mantle velocity structure th<strong>at</strong> is approxim<strong>at</strong>ely one-dimensional<br />
(Fig. 3). Velocity models for both lines require substantial vertical<br />
gradients (0.014 and 0.024 km s 21 km 21 ), with the difference in<br />
average velocity indic<strong>at</strong>ing ,3% seismic anisotropy 8 . The velocity<br />
pr<strong>of</strong>ile to 20-km depth is constrained by multiple instruments, but<br />
the deeper structure is constrained only by the far-<strong>of</strong>fset Tec<strong>at</strong>e<br />
travel times. These travel times are well fitted with a single linear<br />
gradient extending to a depth <strong>of</strong> 39 km, or by a model including a<br />
small velocity step near a depth <strong>of</strong> 30 km with a smaller gradient<br />
bene<strong>at</strong>h. We prefer the velocity-step model because preliminary<br />
amplitude analysis indic<strong>at</strong>es a weak preference for this model<br />
(Supplementary Fig. S7), and the deepest velocity in the singlegradient<br />
model is high (8.63 km s 21 ) rel<strong>at</strong>ive to expect<strong>at</strong>ions for<br />
anisotropic, depleted peridotite <strong>at</strong> this depth 9 .<br />
The steep positive velocity gradient in the east is not easily<br />
explained by MOR processes involving passive upwelling and<br />
efficient <strong>melt</strong> <strong>extraction</strong>. It is not explained by the predicted vertical<br />
vari<strong>at</strong>ion in the extent <strong>of</strong> <strong>melt</strong>ing and associ<strong>at</strong>ed depletion <strong>of</strong> a<br />
basaltic component. Seismic velocity increases with increasing<br />
depletion as mantle rock becomes more olivine- and magnesiumrich<br />
10 , but the velocity change is small (,1%) and would produce a<br />
neg<strong>at</strong>ive gradient in most models <strong>of</strong> decompression <strong>melt</strong>ing 4 .A<br />
Figure 1 FAIM experiment loc<strong>at</strong>ion and instrument layout. Line 1 lies along a pl<strong>at</strong>ekinem<strong>at</strong>ic<br />
flow line. The experiment loc<strong>at</strong>ion <strong>of</strong> ref. 7 is indic<strong>at</strong>ed, and the LADLE 19<br />
experiment loc<strong>at</strong>ion and lithospheric isochrons are indic<strong>at</strong>ed in the inset. LADLE, Lesser<br />
Antilles Deep Lithosphere Experiment.<br />
NATURE | VOL 432 | 9 DECEMBER 2004 | www.n<strong>at</strong>ure.com/n<strong>at</strong>ure
vertical vari<strong>at</strong>ion in anisotropy caused by the strain-induced crystal<br />
preferred orient<strong>at</strong>ion <strong>of</strong> olivine may yield a positive velocity<br />
gradient in one direction, but the gradient in the orthogonal<br />
direction should then be nearly fl<strong>at</strong>, or even neg<strong>at</strong>ive. The gradient<br />
is also not explained by the effects <strong>of</strong> increasing pressure and<br />
temper<strong>at</strong>ure with depth on elasticity. These effects are small and<br />
opposite in sign (Fig. 3), and they should be uniform throughout<br />
the region and thus unable to account for l<strong>at</strong>eral transitions in<br />
vertical gradient. It is possible th<strong>at</strong> the rougher basement east <strong>of</strong><br />
km 425 (Fig. 4) indic<strong>at</strong>es a more tectonic mode <strong>of</strong> extension here,<br />
with a more-fractured upper mantle. The closure <strong>of</strong> cracks with<br />
depth can produce important positive velocity gradients, but the<br />
predicted effect is too small and shallow to explain the observed<br />
gradients (Fig. 3). In the crust, the effect <strong>of</strong> tectonic cracks on<br />
seismic velocity is anisotropic, with a larger effect directed in the<br />
palaeo-spreading direction 11,12 . We would expect a similar anisotropic<br />
effect in the mantle, with a strong vertical gradient observed<br />
on line 1 and little or no gradient on line 2, but this p<strong>at</strong>tern is not<br />
observed.<br />
Our preferred explan<strong>at</strong>ion for the observed mantle velocity<br />
gradients is motiv<strong>at</strong>ed by the rough correl<strong>at</strong>ion between the<br />
apparent velocity-gradient transition near km 300 and changes in<br />
basement morphology, crustal thickness and palaeo-spreading <strong>r<strong>at</strong>e</strong><br />
(Fig. 4). The half-spreading <strong>r<strong>at</strong>e</strong> decreases from 14 to 13 mm yr 21 <strong>at</strong><br />
140 Myr ago (km 325), to 8 mm yr 21 <strong>at</strong> 132 Myr ago (km 425), and<br />
then increases to ,10 mm yr 21 <strong>at</strong> ,125 Myr ago 6 . (The spreading<br />
<strong>r<strong>at</strong>e</strong> after chron M-0 <strong>at</strong> km 550 is largely unconstrained. The value in<br />
Fig. 4 is an average <strong>r<strong>at</strong>e</strong> for the entire Cretaceous quiet period,<br />
beginning 120 Myr ago.) The large decrease in spreading <strong>r<strong>at</strong>e</strong> <strong>at</strong><br />
Figure 2 Pr<strong>of</strong>iles from FAIM line 1 plotted <strong>at</strong> reduced travel time T (in seconds), using a<br />
reduction velocity V <strong>of</strong> 8.4 km s 21 . Predicted travel times are overlain (black, sea floor<br />
and sediments; blue, crustal refractions; red, mantle refractions). The mantle-refraction<br />
phase termin<strong>at</strong>es <strong>at</strong> a distinct loc<strong>at</strong>ion near model km 300. Mantle refractions do not<br />
propag<strong>at</strong>e from west <strong>of</strong> km 300, as seen on instrument 420.<br />
letters to n<strong>at</strong>ure<br />
132 Myr ago is clearly correl<strong>at</strong>ed with roughening <strong>of</strong> basement<br />
topography, suggesting a shift to a more tectonic, less magm<strong>at</strong>ic<br />
mode <strong>of</strong> extension. The crustal thickness measurements indic<strong>at</strong>e<br />
th<strong>at</strong> this slower-spreading crust is demonstrably thinner. Melt<br />
retained in the mantle <strong>at</strong> the spreading centre, now present as<br />
gabbroic inclusions, thus provides a possible explan<strong>at</strong>ion for the<br />
change to positive velocity gradients. In this scenario, <strong>melt</strong> <strong>extraction</strong><br />
<strong>at</strong> very slow spreading <strong>r<strong>at</strong>e</strong>s becomes less efficient, owing to the<br />
increased effect <strong>of</strong> conductive cooling. Melt crystallized within the<br />
mantle, with the quantity <strong>of</strong> retained m<strong>at</strong>erial increasing with<br />
decreasing depth, would system<strong>at</strong>ically decrease velocities in<br />
proportion with the amount <strong>of</strong> retained <strong>melt</strong>. We evalu<strong>at</strong>e this<br />
hypothesis with a simple mass-balance calcul<strong>at</strong>ion. The crust east <strong>of</strong><br />
km 425 is, on average, 1.4 km thinner than the crust west <strong>of</strong> km 300.<br />
The line-1 velocity gradient to a depth <strong>of</strong> 30 km can be explained by<br />
adding the equivalent <strong>of</strong> 1.5 km <strong>of</strong> gabbro (7 km s 21 ) to mantle rock<br />
with an intrinsic velocity <strong>of</strong> 8.5 km s 21 . This simple calcul<strong>at</strong>ion<br />
suggests th<strong>at</strong> a <strong>melt</strong>-retention explan<strong>at</strong>ion for the change in velocity<br />
gradient along line 1 is plausible. This suggestion is supported by the<br />
fact th<strong>at</strong> the observed gravity anomaly along line 1 is best explained<br />
by a lithosphere in isost<strong>at</strong>ic equilibrium with the equivalent <strong>of</strong><br />
,1.5 km <strong>of</strong> crustal-density m<strong>at</strong>erial distributed within the upper<br />
20–40 km <strong>of</strong> the mantle (Supplementary Figs S1–S5). The sp<strong>at</strong>ial<br />
<strong>of</strong>fset (,125 km) between the change in mantle velocity gradient<br />
and the change in spreading <strong>r<strong>at</strong>e</strong> is consistent with the expected <strong>of</strong>faxis<br />
extent <strong>of</strong> the mantle–<strong>melt</strong> zone 13 , which also tends to support a<br />
<strong>melt</strong>-retention explan<strong>at</strong>ion (Supplementary Fig. S6).<br />
A variety <strong>of</strong> observ<strong>at</strong>ions suggest th<strong>at</strong> the retention and crystalliz<strong>at</strong>ion<br />
<strong>of</strong> <strong>melt</strong> in the mantle is common in slow-spreading<br />
environments. The composition <strong>of</strong> basalts emplaced <strong>at</strong> slowspreading<br />
<strong>ridges</strong> suggests th<strong>at</strong> fractional crystalliz<strong>at</strong>ion occurs<br />
within the upper mantle to depths <strong>of</strong> 18 km below the sea floor 14 .<br />
The composition <strong>of</strong> dredged plagioclase peridotites 15 is consistent<br />
with this notion. Recent drilling along the <strong>mid</strong>-Atlantic ridge on<br />
Ocean Drilling Program Leg 209 recovered gabbroic rocks, found as<br />
intrusions and impregn<strong>at</strong>ions in residual peridotite, which crystal-<br />
Figure 3 Velocity depth pr<strong>of</strong>iles <strong>at</strong> the line 1/line 2 crossing based on isotropic ray tracing<br />
<strong>of</strong> FAIM travel times. The two line 1 models, A and B, fit the travel-time d<strong>at</strong>a equally well,<br />
but amplitude analysis favours model B somewh<strong>at</strong>. The velocity pr<strong>of</strong>ile based on the<br />
LADLE 19 transect, <strong>at</strong> an azimuth <strong>of</strong> ,08 (,608 <strong>of</strong>f the flow line), lies between the line 1<br />
and line 2 results. Predicted pressure <strong>dependence</strong> (based on labor<strong>at</strong>ory measurements on<br />
dunite 28 and a model <strong>of</strong> the pressure <strong>dependence</strong> <strong>of</strong> P-wave velocity, V p(P), which<br />
isol<strong>at</strong>es the effects <strong>of</strong> microcracks 10 ) and temper<strong>at</strong>ure 30 <strong>dependence</strong>, V p(T), are also<br />
indic<strong>at</strong>ed; the combined effects nearly cancel but predict a slightly neg<strong>at</strong>ive gradient<br />
below ,22 km depth.<br />
NATURE | VOL 432 | 9 DECEMBER 2004 | www.n<strong>at</strong>ure.com/n<strong>at</strong>ure<br />
© 2004 N<strong>at</strong>ure<br />
745<br />
Publishing Group
letters to n<strong>at</strong>ure<br />
lized <strong>at</strong> depths <strong>of</strong> up to 17 km bene<strong>at</strong>h the sea floor and are believed<br />
to comprise 20–40% <strong>of</strong> the upper mantle <strong>at</strong> this loc<strong>at</strong>ion 16 .<br />
Our interpret<strong>at</strong>ion <strong>of</strong> the FAIM results suggests th<strong>at</strong>, for slowspreading<br />
systems, spreading <strong>r<strong>at</strong>e</strong> has a gre<strong>at</strong>er effect on <strong>melt</strong><br />
<strong>extraction</strong> than on total <strong>melt</strong> production. This conclusion differs<br />
from an interpret<strong>at</strong>ion <strong>of</strong> d<strong>at</strong>a from the ultraslow-spreading (half<strong>r<strong>at</strong>e</strong><br />
3–6.5 mm yr 21 ) Gakkel Ridge, where anomalously thin crust<br />
(1.9–3.3 km thick) was taken as evidence for reduced <strong>melt</strong><br />
production 17 . The Gakkel experiment placed some constraints on<br />
the uppermost mantle structure, where slow velocities (V P < 7.5–<br />
7.8 km s 21 ) just below the Moho were interpreted as serpentinized<br />
peridotite. An altern<strong>at</strong>ive interpret<strong>at</strong>ion is th<strong>at</strong> the slow uppermantle<br />
velocities bene<strong>at</strong>h Gakkel are due in part to gabbroic<br />
inclusions present in gre<strong>at</strong>er proportion to balance the thin crust.<br />
Similarly, the system<strong>at</strong>ically enriched rare-earth-element (REE)<br />
concentr<strong>at</strong>ions observed in basalts from very-slow-spreading <strong>ridges</strong><br />
have been interpreted to indic<strong>at</strong>e deeper <strong>melt</strong>ing with nearly<br />
complete <strong>melt</strong> <strong>extraction</strong> <strong>at</strong> these <strong>ridges</strong> 3 . Numerical models suggest<br />
th<strong>at</strong> this REE enrichment might also be expected in a passively<br />
driven system where the <strong>of</strong>f-axis portion <strong>of</strong> the distributed <strong>melt</strong><br />
network remains largely trapped, and the crust-forming <strong>melt</strong>s are<br />
predominantly extracted from the mantle upwelling directly<br />
bene<strong>at</strong>h the ridge axis 13 , the hottest portion <strong>of</strong> the system (Supplementary<br />
Fig. S6).<br />
The presence <strong>of</strong> a mantle gabbroic component may also provide<br />
an explan<strong>at</strong>ion for a possible discontinuity near a depth <strong>of</strong> 30 km,<br />
which is similar (,35 km) to the depth where the transform<strong>at</strong>ion <strong>of</strong><br />
olivine tholeiite to eclogite begins, <strong>at</strong> ,1 GPa (ref. 18). The<br />
requirement <strong>of</strong> this velocity discontinuity is tent<strong>at</strong>ive, and further<br />
analyses are needed to constrain its existence better. Nevertheless,<br />
similar discontinuities have been inferred from other very large<br />
<strong>of</strong>fset refraction experiments 19–22 , with a gabbro-to-eclogite transform<strong>at</strong>ion<br />
suggested as an explan<strong>at</strong>ion. If this explan<strong>at</strong>ion is correct,<br />
then the apparent common occurrence <strong>of</strong> such a boundary suggests<br />
Figure 4 Basement depth, spreading <strong>r<strong>at</strong>e</strong> and crustal thickness. a, FAIM line 1 sea floor<br />
and basement depths from multi-beam and multi-channel seismic constraints, and<br />
spreading <strong>r<strong>at</strong>e</strong> 6 . The increase indic<strong>at</strong>ed <strong>at</strong> 120 Myr is a jump to the average value for the<br />
Cretaceous quiet zone. Note strong correl<strong>at</strong>ion between basement morphology and<br />
spreading <strong>r<strong>at</strong>e</strong>. Yellow triangles indic<strong>at</strong>e instrument loc<strong>at</strong>ions. b, Sediment unloaded<br />
basement depth, depth predicted from pl<strong>at</strong>e cooling (blue line), and crustal thickness<br />
estim<strong>at</strong>es for the indic<strong>at</strong>ed st<strong>at</strong>ions.<br />
746<br />
2<br />
3<br />
5<br />
6<br />
7<br />
th<strong>at</strong> significant quantities <strong>of</strong> <strong>melt</strong> may routinely be retained in the<br />
mantle under a variety <strong>of</strong> conditions. A<br />
Methods<br />
© 2004 N<strong>at</strong>ure Publishing Group<br />
Experiment design<br />
Detailed seismic imaging <strong>of</strong> the uppermost <strong>ocean</strong>ic mantle, to depths comparable to the<br />
onset <strong>of</strong> <strong>melt</strong>ing <strong>at</strong> 60–90 km, can be achieved with active-source techniques employing<br />
very large source-to-receiver <strong>of</strong>fsets. A small number <strong>of</strong> such studies have been carried out<br />
in the <strong>ocean</strong>s using explosive sources 19–22 . These experiments identified large velocity<br />
gradients and velocity discontinuities in the upper 50 km <strong>of</strong> the mantle interpreted as<br />
compositional layering. Other than these studies, detailed knowledge <strong>of</strong> upper-mantle<br />
seismic structure away from a ridge is surprisingly poor. This is due in large part to the cost<br />
and inherent safety risks <strong>of</strong> explosive sources. Our experiment was designed to acquire<br />
large-<strong>of</strong>fset marine refraction d<strong>at</strong>a using airguns r<strong>at</strong>her than explosives. Mantle phases<br />
from airgun sources are commonly recorded <strong>at</strong> 200–300 km <strong>of</strong>fsets by land-based<br />
seismometers 23,24 . Similar observ<strong>at</strong>ions in the <strong>ocean</strong>s had not been made before the FAIM<br />
experiment, however, largely owing to the presence <strong>of</strong> w<strong>at</strong>er-borne ‘previous shot’ noise<br />
(PSN) 25 endemic <strong>at</strong> large <strong>of</strong>fsets during airgun shooting with typical shot intervals <strong>of</strong> 90 s<br />
or less. The rel<strong>at</strong>ionship between shot interval, Dt, and the <strong>of</strong>fset, X PSN, <strong>at</strong> which a mantle<br />
refraction from a particular shot and w<strong>at</strong>er-borne energy from the previous shot arrive<br />
simultaneously is Dt ¼ X PSN(1/V W 2 1/V M), where V Wand V M are the w<strong>at</strong>er and mantle<br />
propag<strong>at</strong>ion velocities. To record mantle phases <strong>at</strong> 600-km <strong>of</strong>fset, for example, without the<br />
interference <strong>of</strong> high-energy PSN, a shot interval <strong>of</strong> ,6 min is required. The two principal<br />
elements <strong>of</strong> the shooting st<strong>r<strong>at</strong>e</strong>gy were thus long shot intervals and repetition <strong>of</strong> shots in<br />
the same (or nearly the same) loc<strong>at</strong>ion to enable signal-to-noise enhancement through<br />
stacking. The source for the experiment was a ,150-litre, 20-element airgun array. Two<br />
modes <strong>of</strong> shooting were tested, ‘circle’ shots and ‘on-distance’ shooting. The circleshooting<br />
mode was tested on the eastern 150 km and western 36 km <strong>of</strong> line 1. Circle<br />
shooting involved shooting <strong>at</strong> a prescribed shot interval while steaming in a circle with<br />
radius 1 km, the tightest possible with the towed source array. This is a time-efficient<br />
means <strong>of</strong> gener<strong>at</strong>ing many shots near a single loc<strong>at</strong>ion. Between 17 and 36 shots were fired<br />
along each circle. St<strong>at</strong>ic corrections were applied to the traces from each circle, and the<br />
traces were stacked. We found th<strong>at</strong> substantial basement roughness and the azimuthal<br />
<strong>dependence</strong> <strong>of</strong> the source-array sign<strong>at</strong>ure rendered this mode <strong>of</strong> shooting problem<strong>at</strong>ic.<br />
On-distance shooting, where the source is triggered <strong>at</strong> predefined points by the navig<strong>at</strong>ion<br />
system, is the simplest and most effective <strong>of</strong> these two modes; it was used during most <strong>of</strong><br />
the experiment. A source-point separ<strong>at</strong>ion <strong>of</strong> 1 km was used, giving a shot interval <strong>of</strong><br />
,6 min. On line 1, these source-points were revisited on multiple transits <strong>of</strong> portions <strong>of</strong><br />
the line, with one to seven shots fired <strong>at</strong> each point. Stacking <strong>of</strong> these co-loc<strong>at</strong>ed shots<br />
clearly improves the signal-to-noise r<strong>at</strong>io <strong>of</strong> the d<strong>at</strong>a, but we found th<strong>at</strong> pr<strong>of</strong>iles consisting<br />
<strong>of</strong> unstacked single shots are <strong>of</strong> sufficient quality to enable accu<strong>r<strong>at</strong>e</strong> identific<strong>at</strong>ion and<br />
picking <strong>of</strong> refraction travel times, even <strong>at</strong> the largest <strong>of</strong>fsets. This result suggests th<strong>at</strong> a very<br />
simple shooting st<strong>r<strong>at</strong>e</strong>gy may suffice for other experiments <strong>of</strong> this type.<br />
Velocity modelling<br />
Mantle velocities were determined for line 1 (east <strong>of</strong> km 300) and line 2 by twodimensional,<br />
ray-trace modelling 26 <strong>of</strong> first-arrival travel times. Sediment thickness and<br />
basement topography were constrained using multi-channel seismic d<strong>at</strong>a from the<br />
IPOD/USGS transect 27 , which is coincident with the FAIM transect. Crustal thickness and<br />
velocity were constrained <strong>at</strong> the instrument loc<strong>at</strong>ions using observed crustal phases<br />
(Fig. 3). These constraints were used to form the two-dimensional ray-tracing model<br />
within which the mantle velocity structure is nearly one-dimensional. The requirement <strong>of</strong><br />
substantial vertical mantle velocity gradients is indic<strong>at</strong>ed by the continuously increasing<br />
apparent velocity with <strong>of</strong>fset observed on the Tec<strong>at</strong>e pr<strong>of</strong>ile, for example, on which the<br />
largest-<strong>of</strong>fset first arrivals are observed (Fig. 2).<br />
Received 24 June; accepted 29 October 2004; doi:10.1038/n<strong>at</strong>ure03140.<br />
1. Chen, Y. J. Oceanic crustal thickness versus spreading <strong>r<strong>at</strong>e</strong>. Geophys. Res. Lett. 19, 753–756 (1992).<br />
2. Cann<strong>at</strong>, M. How thick is the magm<strong>at</strong>ic crust <strong>at</strong> slow spreading <strong>ocean</strong>ic <strong>ridges</strong>? J. Geophys. Res. 101,<br />
2847–2857 (1996).<br />
3. White, R. S., Minshull, T. A., Bickle, M. J. & Robinson, C. J. Melt gener<strong>at</strong>ion <strong>at</strong> very slow-spreading<br />
<strong>ocean</strong>ic <strong>ridges</strong>: Constraints from geochemical and geophysical d<strong>at</strong>a. J. Petrol. 42, 1171–1196 (2001).<br />
4. Langmuir, C. H., Klein, E. M. & Plank, T. in Mantle Flow and Melt Gener<strong>at</strong>ion <strong>at</strong> Mid-Ocean Ridges<br />
(eds Morgan, J. P., Blackman, D. K. & Sinton, J. M.) 183–281 (Geophysical Monograph 71, American<br />
Geophysical Union, Washington DC, 1993).<br />
5. Blackman, D. K. & Kendall, J.-M. Seismic anisotropy in the upper mantle. 2. Predictions for current<br />
pl<strong>at</strong>e boundary flow models. Geochem. Geophys. Geosyst. 3, doi:10.1029/ 2001GC000247 (2002).<br />
6. Müller, R. D., Walter, W. R., Royer, J.-Y., Gahagan, L. M. & Scl<strong>at</strong>er, J. G. Digital isochrones <strong>of</strong> the<br />
world’s <strong>ocean</strong> floor. J. Geophys. Res. 102, 3211–3214 (1997).<br />
7. Purdy, G. M. The seismic structure <strong>of</strong> 140 Myr old crust in the western central Atlantic Ocean.<br />
Geophys. J. R. Astron. Soc. 72, 115–137 (1983).<br />
8. Gaherty, J. B., Lizarralde, D., Collins, J. A., Hirth, G. & Kim, S. D. Mantle deform<strong>at</strong>ion during slow<br />
seafloor spreading constrained by observ<strong>at</strong>ions <strong>of</strong> seismic anisotropy in the western Atlantic. Earth<br />
Planet. Sci. Lett. (in the press).<br />
9. Ben Ismail, W. & Mainprice, D. An olivine fabric d<strong>at</strong>abase: an overview <strong>of</strong> upper mantle fabrics and<br />
seismic anisotropy. Tectonophysics 296, 145–157 (1998).<br />
10. Jordan, T. H. in The Mantle Sample: Inclusions in Kimberlites and Other Volcanics (eds Boyd, F. R. &<br />
Meyer, H. O. A.) 1–14 (American Geophysical Union, Washington DC, 1979).<br />
11. Stephen, R. A. Seismic anisotropy in the upper <strong>ocean</strong>ic crust. J. Geophys. Res. 90, 11383–11396 (1985).<br />
12. Detrick, R. S., Toomey, D. R. & Collins, J. A. Three-dimensional upper crustal heterogeneity and<br />
anisotropy around Hole 504B from seismic tomography. J. Geophys. Res. 103, 30485–30504 (1998).<br />
13. Spiegelman, M. & Reynolds, J. R. Combined dynamic and geochemical evidence for convergent <strong>melt</strong><br />
NATURE | VOL 432 | 9 DECEMBER 2004 | www.n<strong>at</strong>ure.com/n<strong>at</strong>ure
flow bene<strong>at</strong>h the East Pacific Rise. N<strong>at</strong>ure 402, 282–285 (1999).<br />
14. Grove, T. L., Kinzler, R. J. & Bryan, W. B. in Mantle Flow and Melt Gener<strong>at</strong>ion <strong>at</strong> Mid-Ocean Ridges (eds<br />
Morgan, J. P., Blackman, D. K. & Sinton, J. M.) 281–310 (Geophysical Monograph 71, American<br />
Geophysical Union, Washington DC, 1993).<br />
15. Dick, H. J. B. in Magm<strong>at</strong>ism in the Ocean Basins (eds Sounders, A. D. & Norry, M. J.) 71–105 (Geol.<br />
Soc. Spec. Publ. No. 42, B<strong>at</strong>h, 1989).<br />
16. Kelemen, P. B., Kikawa, E., Miller, D. J. & The Leg 209 Scientific Party. ODP Leg 209 drills into mantle<br />
peridotite along the <strong>mid</strong>-Atlantic ridge from 148N to168N. JOIDES J. 30, 14–19 (2004).<br />
17. Jok<strong>at</strong>, W. et al. Geophysical evidence for reduced <strong>melt</strong> production on the Arctic ultraslow Gakkel <strong>mid</strong><strong>ocean</strong><br />
ridge. N<strong>at</strong>ure 423, 962–965 (2003).<br />
18. Green, D. H. & Ringwood, A. E. An experimental investig<strong>at</strong>ion <strong>of</strong> gabbro to eclogite transform<strong>at</strong>ion<br />
and its petrological applic<strong>at</strong>ions. Geochim. Cosmochim. Acta 31, 767–833 (1967).<br />
19. LADLE Study Group. A lithospheric seismic refraction pr<strong>of</strong>ile in the western North Atlantic Ocean.<br />
Geophys. J. R. Astron. Soc. 75, 23–69 (1983).<br />
20. Asada, T. & Shimimura, H. Long-range refraction experiments in deep <strong>ocean</strong>. Tectonophysics 56,<br />
67–82 (1979).<br />
21. Zverev, S. M. & Yaroshevskay, G. A. in Composition, Structure, and Dynamics <strong>of</strong> Lithosphere-<br />
Asthenosphere System (eds Fuchs, K. & Froidevaux, C.) 273–290 (Geodyn. Ser. 16, American<br />
Geophysical Union, 1987).<br />
22. Goodman, D. & Bibee, L. D. Measurements and modelling <strong>of</strong> possible mantle constituents from a longline<br />
seismic refraction experiment in the West Philippine Basin. Geophys. J. Int. 106, 667–675 (1991).<br />
23. Chian, D., Hall, J. & Marillier, F. Lithospheric wide-angle seismic pr<strong>of</strong>iles using stacked airgun shots.<br />
Geophys. Res. Lett. 23, 2077–2080 (1996).<br />
24. Lizarralde, D. & Holbrook, W. S. US <strong>mid</strong>-Atlantic margin structure and early thermal evolution.<br />
J. Geophys. Res. 102, 22855–22875 (1997).<br />
25. Nakamura, Y., Donoho, P. L., Roper, P. H. & McPherson, P. M. Large-<strong>of</strong>fset seismic surveying using<br />
<strong>ocean</strong>-bottom seismographs and air guns: Instrument<strong>at</strong>ion and field technique. Geophysics 52,<br />
1601–1611 (1987).<br />
26. Zelt, C. A. & Smith, R. B. Seismic traveltime inversion for 2-D crustal velocity structure. Geophys. J. Int.<br />
108, 16–34 (1992).<br />
27. Grow, J. A. & Markl, R. G. IPOD-USGS multichannel seismic reflection pr<strong>of</strong>ile from Cape H<strong>at</strong>teras to<br />
the Mid-Atlantic ridge. Geology 5, 625–630 (1977).<br />
28. Christensen, N. I. Compressional wave velocities in possible mantle rocks to pressures <strong>of</strong> 30 kilobars.<br />
J. Geophys. Res. 79, 407–412 (1974).<br />
29. Greenfield, R. J. & Graham, E. K. Applic<strong>at</strong>ion <strong>of</strong> a simple rel<strong>at</strong>ion for describing wave velocity as a<br />
function <strong>of</strong> pressure in rocks containing microcracks. J. Geophys. Res. 101, 5643–5652 (1996).<br />
30. Goes, S. & Govers, R. Shallow mantle temper<strong>at</strong>ures under Europe from P and S wave tomography.<br />
J. Geophys. Res. 105, 11153–11169 (2000).<br />
Supplementary Inform<strong>at</strong>ion accompanies the paper on www.n<strong>at</strong>ure.com/n<strong>at</strong>ure.<br />
Acknowledgements We thank the Lamont Marine Office and the captain and crew <strong>of</strong> the RV<br />
Maurice Ewing for their efforts during cruise EW-0106. The efforts <strong>of</strong> J. DiBernardo, J. Stennet<br />
and J. Diebold are appreci<strong>at</strong>ed. This work was supported by the US N<strong>at</strong>ional Science Found<strong>at</strong>ion.<br />
Competing interests st<strong>at</strong>ement The authors declare th<strong>at</strong> they have no competing financial<br />
interests.<br />
Correspondence and requests for m<strong>at</strong>erials should be addressed to D.L. (danl@eas.g<strong>at</strong>ech.edu).<br />
..............................................................<br />
Sp<strong>at</strong>ial scaling <strong>of</strong> microbial<br />
eukaryote diversity<br />
Jessica L. Green 1 *, Andrew J. Holmes 2 , Mark Westoby 1 , Ian Oliver 3 ,<br />
David Briscoe 1 , Mark Dangerfield 1 , Michael Gillings 1 & Andrew J. Be<strong>at</strong>tie 1<br />
1<br />
Key Centre for Biodiversity and Bioresources, Department <strong>of</strong> Biological Sciences,<br />
Macquarie University, New South Wales 2109, Australia<br />
2<br />
School <strong>of</strong> Molecular and Microbial Biosciences, The University <strong>of</strong> Sydney,<br />
New South Wales 2006, Australia<br />
3<br />
New South Wales Department <strong>of</strong> Infrastructure, Planning and N<strong>at</strong>ural<br />
Resources, P.O. Box U245, University <strong>of</strong> New England, Ar<strong>mid</strong>ale, New South<br />
Wales 2351, Australia<br />
* Present address: School <strong>of</strong> N<strong>at</strong>ural Sciences, University <strong>of</strong> California, Merced, P.O. Box 2039, Merced,<br />
California 95344, USA<br />
.............................................................................................................................................................................<br />
P<strong>at</strong>terns in the sp<strong>at</strong>ial distribution <strong>of</strong> organisms provide important<br />
inform<strong>at</strong>ion about mechanisms th<strong>at</strong> regul<strong>at</strong>e the diversity<br />
<strong>of</strong> life and the complexity <strong>of</strong> ecosystems 1,2 . Although microorganisms<br />
may comprise much <strong>of</strong> the Earth’s biodiversity 3,4 and<br />
have critical roles in biogeochemistry and ecosystem functioning<br />
5–7 , little is known about their sp<strong>at</strong>ial diversific<strong>at</strong>ion. Here we<br />
letters to n<strong>at</strong>ure<br />
present quantit<strong>at</strong>ive estim<strong>at</strong>es <strong>of</strong> microbial community turnover<br />
<strong>at</strong> local and regional scales using the largest sp<strong>at</strong>ially explicit<br />
microbial diversity d<strong>at</strong>a set available (>10 6 sample pairs). Turnover<br />
<strong>r<strong>at</strong>e</strong>s were small across large geographical distances, <strong>of</strong><br />
similar magnitude when measured within distinct habit<strong>at</strong>s, and<br />
did not increase going from one veget<strong>at</strong>ion type to another. The<br />
taxa–area rel<strong>at</strong>ionship <strong>of</strong> these terrestrial microbial eukaryotes<br />
was rel<strong>at</strong>ively fl<strong>at</strong> (slope z 5 0.074) and consistent with those<br />
reported in aqu<strong>at</strong>ic habit<strong>at</strong>s 8,9 . This suggests th<strong>at</strong> despite high<br />
local diversity, microorganisms may have only mode<strong>r<strong>at</strong>e</strong> regional<br />
diversity. We show how turnover p<strong>at</strong>terns can be used to project<br />
taxa–area rel<strong>at</strong>ionships up to whole continents. Taxa dissimilarities<br />
across continents and between them would strengthen<br />
these projections. Such d<strong>at</strong>a do not yet exist, but would be<br />
feasible to collect.<br />
Ecologists studying macroorganisms have long recognized th<strong>at</strong><br />
beta-diversity (how community composition changes across a<br />
landscape) is central to understanding the forces responsible for<br />
the magnitude and variability <strong>of</strong> biodiversity. P<strong>at</strong>terns <strong>of</strong> betadiversity<br />
can <strong>of</strong>fer valuable clues to the rel<strong>at</strong>ive influence <strong>of</strong> dispersal<br />
limit<strong>at</strong>ion, environmental heterogeneity, and environmental and<br />
evolutionary change in shaping the structure <strong>of</strong> ecological communities<br />
10–14 . Despite an increasing awareness th<strong>at</strong> sp<strong>at</strong>ial p<strong>at</strong>terning<br />
<strong>of</strong> soil microbiota can have important aboveground consequences<br />
in regard to plant community structure and ecosystem functioning<br />
5,6,15,16 , microbial beta-diversity p<strong>at</strong>terns are largely unknown.<br />
Inadequ<strong>at</strong>e sampling has been a major limit<strong>at</strong>ion and scientists are<br />
only now beginning to explore emergent p<strong>at</strong>terns and principles<br />
th<strong>at</strong> may be common to microbes, plants and animals 17,18 . Thus,<br />
whereas it is widely accepted th<strong>at</strong> the similarity in plant and animal<br />
community composition decays with increasing distance between<br />
samples 11,13,19 , p<strong>at</strong>terns <strong>of</strong> microbial turnover in terrestrial environments<br />
remain unstudied. Here, we test whether similarity in<br />
microbial eukaryote community composition decays with geographical<br />
distance as observed in macroorganisms. We also explore<br />
how these biodiversity turnover p<strong>at</strong>terns are influenced by strong<br />
habit<strong>at</strong>-rel<strong>at</strong>ed environmental discontinuities. Finally, we apply<br />
sp<strong>at</strong>ial scaling theory to these turnover p<strong>at</strong>terns to predict how<br />
microbial biodiversity might increase with sampling area from local<br />
to continental scales in Australia.<br />
A total <strong>of</strong> 1,536 soil samples were collected in arid Australia using<br />
a sp<strong>at</strong>ially explicit nested design. The design resulted in 1,117,880<br />
pairwise sample comparisons, with distances ranging from 1 m to<br />
,100 km represented by multiple replic<strong>at</strong>e sample pairs. Samples<br />
were taken from four distinct land systems th<strong>at</strong> varied substantially<br />
in geology, topography and n<strong>at</strong>ive veget<strong>at</strong>ion (see Supplementary<br />
Inform<strong>at</strong>ion). We measured the similarity between any two samples<br />
using the Sørensen index, defined as the number <strong>of</strong> taxa in common<br />
divided by the average number <strong>of</strong> taxa in the two samples 20 . The <strong>r<strong>at</strong>e</strong><br />
<strong>at</strong> which Sørensen similarity decays with increasing distance<br />
between samples (the distance–decay rel<strong>at</strong>ionship) can be directly<br />
rel<strong>at</strong>ed to the species–area rel<strong>at</strong>ionship 21 . Other measures <strong>of</strong> similarity<br />
based on presence/absence <strong>of</strong> d<strong>at</strong>a yielded qualit<strong>at</strong>ively similar<br />
results to those reported here.<br />
We characterized the beta-diversity <strong>of</strong> ascomycete fungi by<br />
autom<strong>at</strong>ed ribosomal RNA intergenic spacer analysis (ARISA), a<br />
commonly used DNA-based community fingerprinting method 22–<br />
24 . ARISA is a high-resolution, highly reproducible technique for<br />
detecting differences between complex fungal communities 22 .We<br />
chose ARISA over DNA sequencing because it allowed assessment <strong>of</strong><br />
microbial community turnover <strong>at</strong> an unparalleled sample size and<br />
sp<strong>at</strong>ial scale. ARISA exploits variability in the length <strong>of</strong> the intervening<br />
transcribed spacer regions <strong>of</strong> rRNA genes (ITS) to sort<br />
samples rapidly into oper<strong>at</strong>ional taxonomic units (OTUs). Members<br />
<strong>of</strong> different species may share the same ITS fragment size 22 .<br />
Although ARISA assays a different taxonomic resolution than<br />
species, it is a consistent measure <strong>of</strong> community composition<br />
NATURE | VOL 432 | 9 DECEMBER 2004 | www.n<strong>at</strong>ure.com/n<strong>at</strong>ure<br />
© 2004 N<strong>at</strong>ure<br />
747<br />
Publishing Group