Create successful ePaper yourself
Turn your PDF publications into a flip-book with our unique Google optimized e-Paper software.
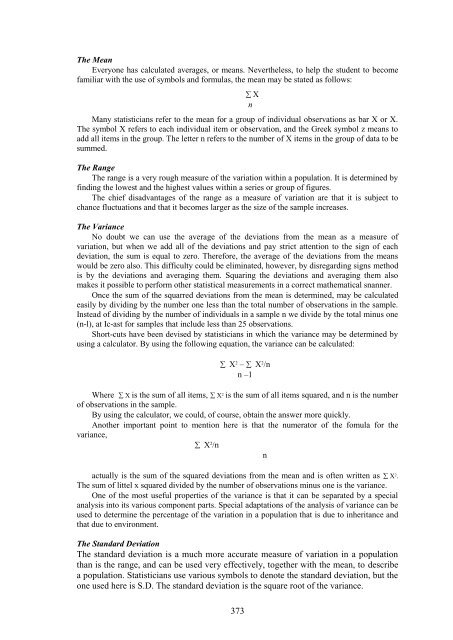
The Mean<br />
Everyone has calculated averages, or means. Nevertheless, to help the student to become<br />
familiar with the use of symbols and formulas, the mean may be stated as follows:<br />
Many statisticians refer to the mean for a group of individual observations as bar X or X.<br />
The symbol X refers to each individual item or observation, and the Greek symbol z means to<br />
add all items in the group. The letter n refers to the number of X items in the group of data to be<br />
summed.<br />
The Range<br />
The range is a very rough measure of the variation within a population. It is determined by<br />
finding the lowest and the highest values within a series or group of figures.<br />
The chief disadvantages of the range as a measure of variation are that it is subject to<br />
chance fluctuations and that it becomes larger as the size of the sample increases.<br />
The Variance<br />
No doubt we can use the average of the deviations from the mean as a measure of<br />
variation, but when we add all of the deviations and pay strict attention to the sign of each<br />
deviation, the sum is equal to zero. Therefore, the average of the deviations from the means<br />
would be zero also. This difficulty could be eliminated, however, by disregarding signs method<br />
is by the deviations and averaging them. Squaring the deviations and averaging them also<br />
makes it possible to perform other statistical measurements in a correct mathematical snanner.<br />
Once the sum of the squarred deviations from the mean is determined, may be calculated<br />
easily by dividing by the number one less than the total number of observations in the sample.<br />
Instead of dividing by the number of individuals in a sample n we divide by the total minus one<br />
(n-l), at Ic-ast for samples that include less than 25 observations.<br />
Short-cuts have been devised by statisticians in which the variance may be determined by<br />
using a calculator. By using the following equation, the variance can be calculated:<br />
373<br />
X<br />
n<br />
X 2 – X 2 /n<br />
n –1<br />
Where Xis the sum of all items, X 2 is the sum of all items squared, and n is the number<br />
of observations in the sample.<br />
By using the calculator, we could, of course, obtain the answer more quickly.<br />
Another important point to mention here is that the numerator of the fomula for the<br />
variance,<br />
X 2 /n<br />
n<br />
actually is the sum of the squared deviations from the mean and is often written as X 2 .<br />
The sum of littel x squared divided by the number of observations minus one is the variance.<br />
One of the most useful properties of the variance is that it can be separated by a special<br />
analysis into its various component parts. Special adaptations of the analysis of variance can be<br />
used to determine the percentage of the variation in a population that is due to inheritance and<br />
that due to environment.<br />
The Standard Deviation<br />
The standard deviation is a much more accurate measure of variation in a population<br />
than is the range, and can be used very effectively, together with the mean, to describe<br />
a population. Statisticians use various symbols to denote the standard deviation, but the<br />
one used here is S.D. The standard deviation is the square root of the variance.


