Measuring Social Value Orientation - Judgment and Decision Making
Measuring Social Value Orientation - Judgment and Decision Making
Measuring Social Value Orientation - Judgment and Decision Making

You also want an ePaper? Increase the reach of your titles
YUMPU automatically turns print PDFs into web optimized ePapers that Google loves.
<strong>Measuring</strong> <strong>Social</strong> <strong>Value</strong> <strong>Orientation</strong><br />
Ryan O. Murphy 1<br />
Kurt A. Ackermann 1<br />
Michel J. J. H<strong>and</strong>graaf 2<br />
Tuesday 21 st September, 2010<br />
1 ETH Zürich<br />
Chair of <strong>Decision</strong> Theory <strong>and</strong> Behavioral Game Theory<br />
Clausiusstrasse 50, 8092 Zürich<br />
Switzerl<strong>and</strong><br />
2 University of Amsterdam<br />
Faculty of <strong>Social</strong> <strong>and</strong> Behavioural Sciences<br />
Roetersstraat 15, 1018 WB Amsterdam<br />
The Netherl<strong>and</strong>s<br />
rmurphy@ethz.ch<br />
kurt.ackermann@gess.ethz.ch<br />
h<strong>and</strong>graaf@uva.nl<br />
This is version 1.00. This draft is currently under review.<br />
Please do not quote or cite this draft without an author’s permission.<br />
This research has been supported by United States<br />
National Science Foundation grant SES-0637151.<br />
Additional thanks to Mike Kuhlman, Jeff Joireman, Michael Schulte-Mecklenbeck, <strong>and</strong> Miguel Fonseca for<br />
their constructive feedback on early versions of this paper.
Contents<br />
1 Introduction 1<br />
2 <strong>Social</strong> <strong>Value</strong> <strong>Orientation</strong> Framework 3<br />
3 Existing Measurements of SVO 6<br />
3.1 The Altruism Scale . . . . . . . . . . . . . . . . . . . . . . . . . . . . . . . . . . . . . . . . . 6<br />
3.1.1 The Altruism Scale described . . . . . . . . . . . . . . . . . . . . . . . . . . . . . . . 6<br />
3.1.2 Discussion of the Altruism Scale . . . . . . . . . . . . . . . . . . . . . . . . . . . . . 7<br />
3.2 The 9-item Triple-Dominance Scale . . . . . . . . . . . . . . . . . . . . . . . . . . . . . . . 9<br />
3.2.1 The 9-item Triple-Dominance Scale described . . . . . . . . . . . . . . . . . . . . . 10<br />
3.2.2 Discussion of the 9-item Triple-Dominance Scale . . . . . . . . . . . . . . . . . . . 11<br />
3.2.3 Rank correlation technique: Another application of decomposed games . . . . . 14<br />
3.3 Utility measurement . . . . . . . . . . . . . . . . . . . . . . . . . . . . . . . . . . . . . . . . 14<br />
3.3.1 Utility measurement described . . . . . . . . . . . . . . . . . . . . . . . . . . . . . . 15<br />
3.3.2 Discussion of utility measurements . . . . . . . . . . . . . . . . . . . . . . . . . . . 17<br />
3.3.3 Indifference curves: A graphical approach to measuring SVO . . . . . . . . . . . . 18<br />
3.4 The <strong>Social</strong> Behavior Scale . . . . . . . . . . . . . . . . . . . . . . . . . . . . . . . . . . . . . 20<br />
3.4.1 The <strong>Social</strong> Behavior Scale described . . . . . . . . . . . . . . . . . . . . . . . . . . . 20<br />
3.4.2 Discussion of the <strong>Social</strong> Behavior Scale . . . . . . . . . . . . . . . . . . . . . . . . . 21<br />
3.5 The Ring Measure . . . . . . . . . . . . . . . . . . . . . . . . . . . . . . . . . . . . . . . . . . 21<br />
3.5.1 The Ring Measure described . . . . . . . . . . . . . . . . . . . . . . . . . . . . . . . 22<br />
3.5.2 Discussion of the Ring Measure . . . . . . . . . . . . . . . . . . . . . . . . . . . . . 23<br />
3.5.3 Circle-test: A one-item version of the Ring Measure . . . . . . . . . . . . . . . . . . 24<br />
3.6 Regression <strong>and</strong> clustering approach . . . . . . . . . . . . . . . . . . . . . . . . . . . . . . . 25<br />
3.6.1 Regression <strong>and</strong> clustering approach described . . . . . . . . . . . . . . . . . . . . . 25<br />
3.6.2 Discussion of regression <strong>and</strong> clustering approaches . . . . . . . . . . . . . . . . . 26<br />
3.7 Schulz <strong>and</strong> May’s Sphere Measure . . . . . . . . . . . . . . . . . . . . . . . . . . . . . . . . 26<br />
3.7.1 The Sphere Measure described . . . . . . . . . . . . . . . . . . . . . . . . . . . . . . 26<br />
3.7.2 Discussion of the Sphere Measure . . . . . . . . . . . . . . . . . . . . . . . . . . . . 27<br />
4 The SVO Slider Measure 28<br />
4.1 Primary SVO Slider items . . . . . . . . . . . . . . . . . . . . . . . . . . . . . . . . . . . . . 28<br />
4.2 Secondary SVO Slider items . . . . . . . . . . . . . . . . . . . . . . . . . . . . . . . . . . . . 31<br />
4.3 Web-based SVO Slider Measure . . . . . . . . . . . . . . . . . . . . . . . . . . . . . . . . . . 31<br />
5 Psychometric properties of SVO measures 33<br />
5.1 Slider Measure validation procedure . . . . . . . . . . . . . . . . . . . . . . . . . . . . . . . 33<br />
5.2 Results . . . . . . . . . . . . . . . . . . . . . . . . . . . . . . . . . . . . . . . . . . . . . . . . 34<br />
5.3 Reliability . . . . . . . . . . . . . . . . . . . . . . . . . . . . . . . . . . . . . . . . . . . . . . . 35<br />
5.3.1 Triple-Dominance Measure test-retest reliability . . . . . . . . . . . . . . . . . . . 35<br />
5.3.2 Ring Measure test-retest reliability . . . . . . . . . . . . . . . . . . . . . . . . . . . . 35<br />
5.3.3 Slider Measure test-retest reliability . . . . . . . . . . . . . . . . . . . . . . . . . . . 36<br />
5.4 Convergent validity . . . . . . . . . . . . . . . . . . . . . . . . . . . . . . . . . . . . . . . . . 36<br />
5.4.1 Categorical agreement . . . . . . . . . . . . . . . . . . . . . . . . . . . . . . . . . . . 36<br />
5.4.2 Correlational agreement . . . . . . . . . . . . . . . . . . . . . . . . . . . . . . . . . . 37<br />
5.5 Additional results . . . . . . . . . . . . . . . . . . . . . . . . . . . . . . . . . . . . . . . . . . 37
5.6 Separating joint maximization <strong>and</strong> inequality aversion . . . . . . . . . . . . . . . . . . . . 39<br />
6 Discussion 40<br />
3
5<br />
10<br />
15<br />
20<br />
25<br />
Murphy, Ackermann & H<strong>and</strong>graaf (2010) DRAFT v0.6 <strong>Measuring</strong> SVO<br />
No man is an isl<strong>and</strong>, entire of itself; every man is a piece of the continent, a part of the<br />
main. If a clod be washed away by the sea, Europe is the less, as well as if a promontory<br />
were, as well as if a manor of thy friend’s or of thine own were.<br />
1 Introduction<br />
–John Donne<br />
Devotions Upon Emergent Occasions, Meditation XVII<br />
The assumption of narrow self-interest is fundamental to rational choice theory. The assump-<br />
tion postulates that decision makers (DMs) are concerned about maximizing their own material gain,<br />
indifferent to the payoffs of other DMs around them. This is a simplifying assumption that yields a<br />
powerful apparatus to predict <strong>and</strong> explain human behavior across a wide variety of domains. How-<br />
ever there are reliable counterexamples demonstrating that DMs’ elicited preferences <strong>and</strong> choices are<br />
influenced in part by the payoffs of other DMs thus challenging what some have termed the selfish-<br />
ness axiom (Henrich et al. 2005). Furthermore, evidence for prosociality, helping behavior, <strong>and</strong> results<br />
from the endeavor of uncovering its underlying motivational bases is well documented (e.g. Batson<br />
1995, Sell et al. 2009). In addition to behavioral evidence, specific neurological correlates related to<br />
concern for other’s outcomes have been identified (e.g. Haruno & Frith 2009, van den Bos, van Dijk,<br />
Westenberg, Rombouts, & Crone 2009, Tricomi, Rangel, Camerer, & O’Doherty 2010). Other regard-<br />
ing preferences have even been demonstrated in non-human primates (e.g. de Waal, Leimgruber, &<br />
Greenberg 2008).<br />
To illustrate the notion of interdependent interests, consider the following choice between two<br />
options. In each case the DM is choosing between certain distributions of money, one portion to<br />
herself, <strong>and</strong> some portion to be given to another person, who is unknown to her. The DM <strong>and</strong> the<br />
other person will remain mutually anonymous while <strong>and</strong> after the decision is made. Hence this is<br />
not a strategic decision (i.e., not within the purview of Game Theory as only one DM influences the<br />
payoffs of both people, hence there are not strategic concerns) but rather is a one-shot individual<br />
decision. Anonymity removes the potential influence of fear of reprisal, reciprocity, reputation, etc.<br />
so that the utility of outcomes defined by the DM (see Kelley & Thibaut 1978) solely reflects the DM’s<br />
social value (Dehue, McClintock, & Liebr<strong>and</strong> 1993, p.274)<br />
1
5<br />
10<br />
15<br />
20<br />
Murphy, Ackermann & H<strong>and</strong>graaf (2010) DRAFT v0.6 <strong>Measuring</strong> SVO<br />
Table 1: A simple binary choice<br />
Option 1 Option 2<br />
$85 to the DM $100 to the DM<br />
$85 to another person $50 to another person<br />
The “rational” solution to this choice is trivial; a rational DM (Homo Economicus) would select<br />
option 2 as it results in a larger individual payoff. That, by choosing option 2 over option 1, an extra<br />
$15 is gained at a “cost” of $35 from another person is immaterial from the normative vantage point:<br />
the only pertinent consideration is the DM’s individual payoff, irrespective of the payoffs to others. In<br />
this instance, the normative account diverges from actual behavior. We find that incentivized DMs,<br />
in an anonymous one-shot decision context, choose option 1 about 40% of the time, a finding that<br />
is consistent with other research results (Van Lange, Otten, De Bruin, & Joireman 1997, Au & Kwong<br />
2004, Bogaert, Boone, & Declerck 2008, Balliet, Parks, & Joireman 2009). 1<br />
Studies on the motivations that underlie interdependent decision behavior have a long history <strong>and</strong><br />
these motivations have been referred to by a variety of names, including: social preferences, social<br />
motives, other regarding preferences, welfare tradeoff ratios, <strong>and</strong> social value orientation (SVO). For<br />
consistency, we refer to this construct as SVO for the remainder of this paper. It is worth noting that<br />
the assumption of narrow self interest is a special case of SVO, <strong>and</strong> that SVO is not a challenge to<br />
rational choice theory per se, but rather the extension of a postulate in an effort to increase the theory’s<br />
psychological realism <strong>and</strong> descriptive accuracy.<br />
In the present paper, we provide an overview of existing methods that measure variations in SVOs<br />
across individuals <strong>and</strong> highlight some limitations with these existent measures. We then introduce a<br />
new measure of SVO that has several advantages over other methods. The new measure is referred<br />
to as the SVO Slider measure <strong>and</strong> can be administered online or as a one-page paper based choice<br />
task (see the Appendix, Section §6). A detailed discussion of the new measure is provided, along with<br />
norming data <strong>and</strong> evidence of the new measure’s convergent validity with existing methods. We con-<br />
clude with a discussion of the research streams that would benefit from a more sensitive <strong>and</strong> higher<br />
1 Au & Kwong (2004, p.74) report 49.7% cooperators over several studies <strong>and</strong> Van Lange et al. (1997) report about 60%<br />
cooperators across different western countries. Van Lange et al. (2007) summarized the latter results by stating that the<br />
ratio between cooperators, individualists <strong>and</strong> competitors in Western countries is roughly 4:2:1.<br />
2
5<br />
10<br />
Murphy, Ackermann & H<strong>and</strong>graaf (2010) DRAFT v0.6 <strong>Measuring</strong> SVO<br />
resolution measure of SVO <strong>and</strong> extend an invitation to others to use this new measure.<br />
2 <strong>Social</strong> <strong>Value</strong> <strong>Orientation</strong> Framework<br />
SVO provides a framework for characterizing how decision makers (DMs) value joint outcomes<br />
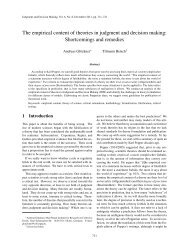
(Messick & McClintock 1968, Griesinger & Livingston 1973, Liebr<strong>and</strong> 1984). A graphical representation<br />
of the full framework, highly similar to the one provided by (Liebr<strong>and</strong> 1984, p. 246) is provided in<br />
Figure 1 <strong>and</strong> shows different motivations associated with different joint outcomes.<br />
Payoff to other<br />
Figure 1: A graphical representation of the SVO framework<br />
100<br />
75<br />
50<br />
25<br />
0<br />
50<br />
Martyr<br />
15<br />
85<br />
Masochistic<br />
15<br />
15<br />
Sadomasochistic<br />
Sadistic<br />
Altruistic<br />
50<br />
100<br />
50<br />
0<br />
Payoff to self<br />
Prosocial<br />
85<br />
85<br />
Individualistic<br />
Competitive<br />
0 25<br />
50 75 100<br />
A point in the Cartesian plane corresponds to a specific joint outcome. The x-axis corresponds<br />
to the value of the DM’s individual payoff. The y-axis corresponds to the other person’s payoff. Al-<br />
though there are an infinite number of possible joint outcomes, those along the ring, intersecting one<br />
of the eight cardinal directions, provide clear exemplars of different joint outcomes that correspond<br />
to particular preferences. For example, the point on the ring that maximizes individual earnings is at<br />
3<br />
85<br />
15<br />
100<br />
50
5<br />
10<br />
15<br />
Murphy, Ackermann & H<strong>and</strong>graaf (2010) DRAFT v0.6 <strong>Measuring</strong> SVO<br />
x = 100 <strong>and</strong> y = 50 (i.e. Individualistic); the point on the ring that maximizes joint earnings is at x = 85<br />
<strong>and</strong> y = 85 (i.e. Prosocial). These points <strong>and</strong> their respective archetypical motivations are listed in<br />
Table 2, along with other respective motivations. The values presented in Table 2 are consistent with<br />
Figure 1 <strong>and</strong> correspond to different motivations. 2<br />
Table 2: Archetypal SVO outcomes<br />
Self Other <strong>Orientation</strong> Inferred Motivation<br />
85 85 Prosocial Maximize joint payoff or minimize difference between payoffs<br />
100 50 Individualistic Maximize payoff to self<br />
85 15 Competitive Maximize positive difference between self <strong>and</strong> other’s payoff<br />
50 0 Sadistic Minimize other’s payoff<br />
15 15 Sadomasochistic Minimize joint payoff or minimize difference between payoffs<br />
0 50 Masochistic Minimize payoff to self<br />
15 85 Martyr Maximize negative difference between other’s <strong>and</strong> self payoff<br />
50 100 Altruistic Maximize other’s payoff<br />
One way to determine an individual’s preferences across different joint distributions is to present a<br />
DM with a series of allocation decisions <strong>and</strong> ask her to select her most preferred apportionments (e.g.<br />
the choice presented in Table 1). These resource allocation decisions are sometimes referred to as<br />
decomposed games (Pruitt 1967, Messick & McClintock 1968). The term decomposed games emerged<br />
from seminal work that used simple two-player binary option games (e.g. the Prisoner’s Dilemma) to<br />
study choice behavior. One problem with using a game to study intrinsic preferences is that a game<br />
is by definition a strategic interaction. Games require DMs to choose not only according to their pref-<br />
erences, but with those preferences conditioned on their beliefs of what they think other players will<br />
choose, knowing that the other players are likely thinking the same thing, <strong>and</strong> so on. These decisions<br />
are complex in that they draw upon both preferences <strong>and</strong> beliefs about others’ preferences, <strong>and</strong> beliefs<br />
about others’ beliefs, etc. As a method to measure preferences alone, it is muddled <strong>and</strong> confounded<br />
by the strategic nature of the interaction. A solution to this measurement problem is to decouple<br />
preference considerations from strategic considerations. This simplified choice task is called a de-<br />
composed game. Although it is technically not a game, it does give an unconfounded measure of an<br />
2 One thing that is worth noting is that in the economics literature, the term altruistic encompasses any positive other<br />
regarding preference, whereas in the psychology literature there is a distinction made between prosocial <strong>and</strong> altruistic<br />
orientations. For this paper we too will maintain the distinction between these two motivations, using altruistic to refer to<br />
the particular motivation of maximizing another’s payoff, indifferent to one’s own.<br />
4
5<br />
10<br />
15<br />
20<br />
Murphy, Ackermann & H<strong>and</strong>graaf (2010) DRAFT v0.6 <strong>Measuring</strong> SVO<br />
individual’s preferences for joint outcomes. For example, if a DM chooses Option 2 from the alloca-<br />
tion choice presented in Table 1, we would infer that her motivation to maximize her own earnings is<br />
stronger than her motivation to maximize joint earnings; we would say she has a revealed preference<br />
consistent with an individualistic social value orientation.<br />
Any individual choice task where a DM makes a selection from among different allocations of<br />
resources to himself <strong>and</strong> others is a decomposed game. Decomposed games have been used exten-<br />
sively to study SVO (e.g. Messick & McClintock 1968, McClintock, Messick, Kuhlman, & Campos 1973,<br />
Kuhlman & Marshello 1975a,b, Van Lange, Otten, De Bruin, & Joireman 1997). The dictator game 3<br />
happens to be a decomposed game too. For clarity, we refer to non-game contexts as allocation deci-<br />
sions in order to emphasize the non-strategic nature of the relevant choice tasks.<br />
The framework presented in Figure 1 <strong>and</strong> Table 2 provides a taxonomy (Liebr<strong>and</strong> 1984) of revealed<br />
social preferences but has several unusual categories that are rarely consistent with real DMs’ choices.<br />
Thus researchers have focused their attention on a subset of items in a particular region of the ring.<br />
According to McClintock & Messick (1965), a person can fulfill one of three different orientations. A<br />
person may be motivated to secure maximal resources for himself, indifferent to how much the other<br />
receives (i.e. maximizing own gain). Or a person may prefer to maximize the sum of the outcomes for<br />
both self <strong>and</strong> other (i.e. maximizing joint gain). Or a person may prefer to maximize the difference be-<br />
tween his own outcome <strong>and</strong> the other’s outcome (maximizing relative gain). These three motivational<br />
orientations have longst<strong>and</strong>ing labels in the psychology literature as individualistic, cooperative (i.e.<br />
prosocial), <strong>and</strong> competitive, respectively Deutsch (1960). The most common current measure of SVO,<br />
a 9-item triple dominance scale (see Van Lange et al. 1997), uses the same three categories. There<br />
are a variety of other approaches to the measure of SVO which range from distinguishing simply be-<br />
tween two categories (individualistic <strong>and</strong> prosocial) to differentiating among up to ten categories as<br />
proposed by MacCrimmon & Messick (1976).<br />
3 This is an unfortunate name as it is technically not a game either, as only one DM can influence the joint payoffs.<br />
5
5<br />
10<br />
15<br />
20<br />
25<br />
Murphy, Ackermann & H<strong>and</strong>graaf (2010) DRAFT v0.6 <strong>Measuring</strong> SVO<br />
3 Existing Measurements of SVO<br />
In this section, existing approaches to the measurement of SVO are described <strong>and</strong> discussed in ap-<br />
proximate chronological order of publication. This provides a general overview of the history of SVO<br />
measurements <strong>and</strong> offers insight into how methods have changed <strong>and</strong> developed over time. Figure<br />
14 shows a diagram of the measurement techniques over time. In discussing different approaches to<br />
SVO measurement, the current paper focuses on methods that assess people’s preferences for certain<br />
allocations of resources. These preferences are revealed by eliciting people’s judgments or choice be-<br />
havior when they are presented with options containing different distributions of outcomes for the<br />
self <strong>and</strong> for some other person. Questionnaire methods regarding altruistic or prosocial attitudes (e.g.<br />
Rushton et al. 1981, Cr<strong>and</strong>all 1975) are excluded from the present paper.<br />
3.1 The Altruism Scale<br />
Sawyer (1966) devised a method for assessing the degree of concern a DM has for the outcomes<br />
for himself <strong>and</strong> others. He called this method the Altruism Scale. However it should be noted that<br />
Sawyer’s method can assess a range of different orientations including prosocial, individualistic, <strong>and</strong><br />
competitive motivations, <strong>and</strong> it would be more accurate to call it the <strong>Social</strong> Preference Scale. Within<br />
Sawyer’s theoretical framework, the subjective attractiveness of a joint outcome was conceptualized<br />
as the linear combination P + (w · O) where P is the payoff for the self <strong>and</strong> O is the payoff for another<br />
person. The coefficient w represents how much weight a DM gives to the outcome for another, relative<br />
to his own outcome. If a person is individualistic <strong>and</strong> therefore only interested in only his own welfare,<br />
the coefficient w would be zero. If a person is cooperative <strong>and</strong> cares about both his own, <strong>and</strong> the<br />
other person’s welfare, w would be greater than zero. Conversely, if a person is competitive <strong>and</strong> tries<br />
to maximize the difference between the own <strong>and</strong> the other’s payoff, w will be less than zero.<br />
3.1.1 The Altruism Scale described<br />
Sawyer’s method uses a conjoint measurement technique to estimate an individual’s weighting<br />
of outcomes for others (w). An index of altruism is computed based on the desirability rankings of<br />
own/other outcome combinations. Specifically, subjects (college students in this case) were asked to<br />
6
5<br />
10<br />
15<br />
20<br />
Murphy, Ackermann & H<strong>and</strong>graaf (2010) DRAFT v0.6 <strong>Measuring</strong> SVO<br />
imagine that they would take a seminar with only one other fellow student <strong>and</strong> that each would re-<br />
ceive a grade of A, B or C at the end of the seminar. Subjects were then asked to rank their preferences<br />
for the allocations of these grade combinations. After all 9 of the rankings are made by a DM, the<br />
altruism index a can be calculated as follows:<br />
a =<br />
(sum of ranks in row C) − (sum of ranks in row A)<br />
(sum of ranks in column C) − (sum of ranks in column A)<br />
The index a is a manifest variable <strong>and</strong> serves as a proxy for the latent variable w. The numerator in<br />
computing a corresponds to how much a person cares about the outcome for the other person. If, for<br />
example, a person cares about the other’s welfare, the DM will assign high ranks to the options where<br />
the other person receives A grades <strong>and</strong> low ranks to the outcomes where the other person receives<br />
C grades. In this case, the numerator is positive, indicating positive altruism. Conversely, a negative<br />
result indicates negative altruism (i.e. competitiveness). If the result is zero, it implies that the person<br />
is indifferent to the other student’s grade. 4<br />
According to Sawyer, w ranges continuously from −1 to +1, i.e. from perfectly competitive (w =<br />
−1) to perfectly cooperative (w = +1), with narrow self interest (w = 0) at the midpoint. It is worth<br />
noting that a can take on values outside of this range given atypical motivations (e.g. masochistic). It<br />
is also worth noting that for Sawyer’s Altruism scale, a is undefined if a DM provides purely altruistic<br />
ranking (ranks that are consistent with maximizing the grade of the other student <strong>and</strong> indifferent to<br />
the DM’s own grade).<br />
3.1.2 Discussion of the Altruism Scale<br />
The Altruism scale was an early innovation but as a means to measure social preferences it has<br />
limitations. First, the metric space of academic grades is not straightforward <strong>and</strong> is obviously not<br />
amendable to incentive compatible research. This particular choice context may force DMs to take<br />
4 Sawyer used a second method to directly assess a by asking the DM to choose 1 out of 21 scale values, which corresponded<br />
to values of a ranging from −1 to +1 in increments of 0.1. The scale is anchored by statements at the values −1,<br />
−0.5, 0, +0.5 <strong>and</strong> +1. For example, the statement reflecting an a value of +1 indicates agreement with the following statement:<br />
“I am equally interested in how good his grade is <strong>and</strong> in how good my grade is,” whereas the statement reflecting an<br />
a value of 0 indicates agreement with: “I am only interested in how good my grade is; how good or poor his grade is makes<br />
no difference to me.”<br />
7<br />
(1)
5<br />
Murphy, Ackermann & H<strong>and</strong>graaf (2010) DRAFT v0.6 <strong>Measuring</strong> SVO<br />
Sawyer’s altruism index (a )<br />
Other<br />
1<br />
0.8<br />
0.6<br />
0.4<br />
0.2<br />
0<br />
-0.2<br />
-0.4<br />
-0.6<br />
-0.8<br />
-1<br />
Competitive<br />
A 5 4 3<br />
B 4 3 2<br />
C 3 2 1<br />
C B<br />
Self<br />
A<br />
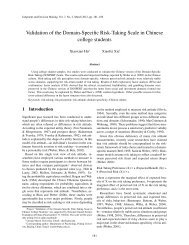
Figure 2: Sawyer’s Altruism Scale - Preference rankings <strong>and</strong> the a index<br />
Other<br />
A 9 7 4<br />
B 8 5 2<br />
C 6 3 1<br />
C B<br />
Self<br />
A<br />
Other<br />
A 7 5 3<br />
B 6 4 2<br />
C 5 3 1<br />
C B<br />
Self<br />
A<br />
Other<br />
A 9 6 3<br />
B 8 5 2<br />
C 7 4 1<br />
C B<br />
Self<br />
A<br />
Other<br />
Individualistic<br />
A 3 2 1<br />
B 3 2 1<br />
C 3 2 1<br />
C B<br />
Self<br />
A<br />
-1 -0.8 -0.6 -0.4 -0.2 0 0.2 0.4 0.6 0.8 1<br />
Coeficient (w): The weight for another’s outcome<br />
Other<br />
A 7 4 1<br />
B 8 5 2<br />
C 9 6 3<br />
C B<br />
Self<br />
A<br />
Other<br />
A 5 3 1<br />
B 6 4 2<br />
C 7 5 3<br />
C B<br />
Self<br />
A<br />
A 6 3 1<br />
B 8 5 2<br />
C 9 7 4<br />
C B<br />
Self<br />
A<br />
Other<br />
Prosocial<br />
A 3 2 1<br />
B 4 3 2<br />
C 5 4 3<br />
C B<br />
Self<br />
A<br />
Figure 3: Examples of different preference rankings (the 3 × 3 matrixes at the top of the figure) are<br />
displayed here. Further, the relationship of these rankings to the underlying utility weight (w, shown<br />
on the x-axis) for another’s outcome, <strong>and</strong> Sawyer’s altruism index a are shown. The ranking of 1<br />
indicates that this allocation of grades is the DMs most preferred joint outcome. As can be seen, ties<br />
in ranking outcomes are allowed. Particular rankings are consistent with underlying utility weights,<br />
<strong>and</strong> further each ranking matrix corresponds to an a index. Although w is continuous, the resulting<br />
altruism index a is a step function that can take on only one of nine values given w between -1 <strong>and</strong><br />
1 inclusive. Some rankings correspond to a single point of w, whereas other rankings are consistent<br />
with a range of w values.<br />
a zero-sum mentality if they are accustomed to curved grading systems or are concerned with their<br />
overall class ranking.<br />
Second, a procedure for rank ordering preferences that presents subjects with all stimuli at the<br />
same time runs the risk of yielding unreliable data because people usually are not very skilled at re-<br />
liably ranking multiple items simultaneously (Saaty 1980). Hence, as proposed by Sawyer himself, it<br />
would probably be beneficial to let subjects make sequential pairwise comparisons in order to reduce<br />
complexity of the judgment task <strong>and</strong> therefore yield more accurate rank orders. How one would elicit<br />
global rankings based on sequential pairwise rankings is not an issue Sawyer addresses nor does it<br />
8<br />
Other<br />
1.000<br />
0.625<br />
0.500<br />
0.333<br />
0.000<br />
-0.333<br />
-0.500<br />
-0.625<br />
-1.000
5<br />
10<br />
15<br />
20<br />
25<br />
Murphy, Ackermann & H<strong>and</strong>graaf (2010) DRAFT v0.6 <strong>Measuring</strong> SVO<br />
have an obvious solution.<br />
Third, the altruism scale cannot differentiate between prosocial motivations <strong>and</strong> inequality aver-<br />
sion. It also yields an undefined a index for a DM with an altruistic motivational orientation.<br />
Fourth, the process of reducing a set of rank orderings into a single index may be problematic.<br />
Each a value at one of the three anchors (-1, 0, +1) has a clear interpretation, whereas values in be-<br />
tween are not readily interpretable. Further, the index a is an ordinal variable at best (Stevens 1946,<br />
1950) <strong>and</strong> is limited to 9 particular values. Moreover, the mapping from underling utility w to the<br />
index a has a “many-to-one” structure which necessarily results in the loss of information.<br />
With respect to psychometric properties of his measure, Sawyer reported only moderate validity<br />
<strong>and</strong> reliability. For example, the correlation between values obtained by the direct scale estimation<br />
measure <strong>and</strong> the values obtained by the ranking method was only r = 0.32, hence challenging the<br />
measure’s convergent validity. Sawyer reasoned that the discrepancy between the two measures was<br />
probably due to differences in task complexity <strong>and</strong> to multidimensionality in the rankings (i.e., the di-<br />
rect estimation measure promotes unidimensional judgments whereas the conjoint method allowes<br />
for more complex preferences to manifest themselves).<br />
3.2 The 9-item Triple-Dominance Scale<br />
Decomposed games have their roots in two-option two-player games (e.g. the Prisoner’s dilemma)<br />
that have been the “fruit flies” of social decision research. Messick & McClintock (1968) <strong>and</strong> Pruitt<br />
(1967) independently devised what have been termed decomposed games by deconstructing binary<br />
social dilemmas into individual decision problems. The reason for this simplification is to disentangle<br />
intrinsic motivations from strategic concerns. Allocation choices can be constructed that differenti-<br />
ate between archetypal motivations; Messick & McClintock (1968) concerned themselves with three<br />
common SVOs, namely prosocial, individualistic, <strong>and</strong> competitive, ignoring other less common mo-<br />
tivations.<br />
For example, the allocation decision presented in Table 1 is designed to differentiate between<br />
prosocial <strong>and</strong> individualistic motivations. A prosocial person would choose Option A <strong>and</strong> an indi-<br />
vidualist would choose Option B. This type of item is referred to as a double-dominance item as it can<br />
9
5<br />
10<br />
15<br />
20<br />
25<br />
Murphy, Ackermann & H<strong>and</strong>graaf (2010) DRAFT v0.6 <strong>Measuring</strong> SVO<br />
discriminate between two of the three most common SVOs. However, a competitive type would also<br />
select option B, as it has a greater relative difference between the payoffs. So with this particular allo-<br />
cation decision it is not possible to differentiate between individualists <strong>and</strong> competitors as both types<br />
would make the same choice.<br />
There are two methods which solve this problem <strong>and</strong> distinguish between the three most common<br />
SVOs. First, a researcher can examine the complete set of choices made in a series of two-option,<br />
double dominance allocation decisions. The set of choices that pits each of the common SVOs against<br />
each of the other common SVO types is necessarily exhaustive <strong>and</strong> can isolate a DM’s primary social<br />
motivation. This method would also identify an individual’s least preferred social outcome. A second<br />
method to differentiate between the three most common SVOs uses a single allocation decision that<br />
has three options (as proposed by McClintock, Messick, Kuhlman, & Campos 1973) such that each<br />
option dominates both the other two options with respect to a particular motivational orientation.<br />
These types of items have the property of triple dominance, as they can differentiate between three<br />
social orientations. These types of items were adopted by Kuhlman & Marshello (1975a) who also<br />
used other decomposed game classes (double-dominance <strong>and</strong> single-dominance) for assessing SVO.<br />
Building on this work, the 9-item triple-dominance measure of SVO (see Van Lange et al. 1997) has<br />
evolved <strong>and</strong> has become a widely-used measurement method (e.g. applied by Joireman, Van Lange, &<br />
Van Vugt 2004, Utz 2004, Utz, Ouwerkerk, & Van Lange 2004, van Dijk, De Cremer, & H<strong>and</strong>graaf 2004,<br />
Stouten, De Cremer, & Van Dijk 2005, de Kwaadsteniet, van Dijk, Wit, & de Cremer 2006, Van Lange,<br />
Bekkers, Schuyt, & Van Vugt 2007, Declerck & Bogaert 2008, van Prooijen, De Cremer, van Beest, Ståhl,<br />
van Dijke, & Van Lange 2008, van den Bos, van Dijk, Westenberg, Rombouts, & Crone 2009, Haruno &<br />
Frith 2009), in part due to its straight forward structure <strong>and</strong> ease of use (Van Lange, De Cremer, van<br />
Dijk, & Van Vugt 2007).<br />
3.2.1 The 9-item Triple-Dominance Scale described<br />
The triple dominance SVO items can be seen in Table 3. For each item there is one allocation<br />
option that is prosocial, individualistic, <strong>and</strong> competitive. The scoring rule for this scale is to count<br />
the number of selfish, prosocial, <strong>and</strong> competitive options a DM selects. If a DM chooses six or more<br />
10
5<br />
10<br />
15<br />
Murphy, Ackermann & H<strong>and</strong>graaf (2010) DRAFT v0.6 <strong>Measuring</strong> SVO<br />
Prosocial Individualistic Competitive<br />
Item Self Other Self Other Self Other<br />
1 80 80 92 40 80 0<br />
2 84 84 96 44 84 4<br />
3 88 88 100 48 88 4<br />
4 82 82 96 44 84 4<br />
5 84 84 96 44 82 2<br />
6 84 84 98 44 84 4<br />
7 86 86 96 44 86 6<br />
8 84 84 94 44 84 4<br />
9 82 82 92 44 80 4<br />
Table 3: Simple trichotomous choices of distributions. Note: These values have been st<strong>and</strong>ardized<br />
to range between 0 <strong>and</strong> 100 in order to facilitate comparison with the other measures presented in<br />
this paper. The original items ranged between 80 <strong>and</strong> 580 <strong>and</strong> were presented in the units of points<br />
(examples of the original form are shown in Van Lange et al. 1997, 2007).<br />
options from a particular category, then the DM is categorized as being that type. If a DM does not<br />
choose at least six options from one category, then she is not categorized (e.g. McClintock & Allison<br />
1989, Platow, McClintock, & Liebr<strong>and</strong> 1990, Van Lange & Kuhlman 1994). In other variants of the<br />
Triple-Dominance scale, only six items are used <strong>and</strong> subjects are classified when at least five of the six<br />
choices are consistent with one of the three social value orientations (e.g. Van Lange 1999). However,<br />
the method of counting choices made in several decomposed games <strong>and</strong> classifying subjects into<br />
respective SVO categories according to their choice pattern with respect to a particular consistency<br />
criterion is exemplary for the general evaluation procedure used in decomposed game measures. This<br />
holds for the 9-item Triple-Dominance SVO scale as well as for other variants using mixed dominance<br />
classes (e.g. Kuhlman & Marshello 1975a,b).<br />
3.2.2 Discussion of the 9-item Triple-Dominance Scale<br />
Although the 9-item Triple-Dominance SVO scale is the most commonly used measure of SVO<br />
to date, it has some shortcomings. First, it can classify individuals to only one of three categories:<br />
prosocial, individualistic, or competitive, <strong>and</strong> provides no information beyond this categorization.<br />
This result is only at the nominal level (Stevens 1946, 1950), the lowest level of measurement. However<br />
social motivations are a continuous construct <strong>and</strong> one practical result of forced categorization is low<br />
11
5<br />
10<br />
15<br />
Murphy, Ackermann & H<strong>and</strong>graaf (2010) DRAFT v0.6 <strong>Measuring</strong> SVO<br />
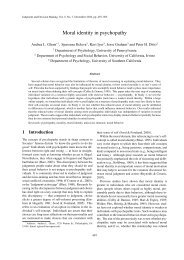
Figure 4: The 9-item Triple-Dominance scale. Each item is represented in the self/other allocation<br />
plane as three points connected by two lines. Notice the high degree of similarity among the items. It<br />
may be more accurate to say this is a scale with one item repeated nine times.<br />
statistical power.<br />
Payoff to other<br />
100<br />
80<br />
60<br />
40<br />
20<br />
0<br />
0 20 40 60 80 100<br />
Payoff to self<br />
Second, it cannot discriminate between joint payoff maximization <strong>and</strong> inequality aversion. Al-<br />
though these preferences may be related, they are not the same. For example, there is evidence that<br />
persons classified as prosocial are concerned with both the maximization of joint gain <strong>and</strong> equality in<br />
outcomes (Van Lange 1999). Further there are choice contexts where these motivations would lead to<br />
substantially different behavior.<br />
Third, the 9-item Triple-Dominance measure can only establish a DM’s first preference, not her<br />
lesser preferences. Take for example an individual who has a rank order of preferences as individ-<br />
ualistic, prosocial, <strong>and</strong> competitive. Contrast this individual to someone who ranked preferences<br />
of individualistic, competitive, <strong>and</strong> then prosocial. These individuals may approach the world very<br />
differently than each other. Furthermore, knowing what an individual’s least preferred allocation is<br />
would be informative, as an avoidant personality or prevention focus (Higgins 1997) can serve as a<br />
motivational foundation. People who are strongly motivated to avoid their least preferred option,<br />
rather than focusing on their most favored option, would make different choices depending on the<br />
full ranking of their preferences. It is thus important to know not just a DM’s most preferred outcome,<br />
but also the entire rank ordering of her social preferences.<br />
12
5<br />
10<br />
15<br />
20<br />
25<br />
Murphy, Ackermann & H<strong>and</strong>graaf (2010) DRAFT v0.6 <strong>Measuring</strong> SVO<br />
Fourth, three-option choice sets are more complicated than binary choices. The simplest choice<br />
is between two options <strong>and</strong> only requires the DM to make one comparison in the process of making<br />
a decision. Increasing to three options requires the DM to make three comparisons. The inclusion<br />
of one particularly unattractive option has been shown to have an effect on revealed preferences (Si-<br />
monson 1989) in unanticipated ways.<br />
Fifth, it seems to have become quite common practice that the two categories of individualistic<br />
<strong>and</strong> competitive orientations are being merged to form one group which is then compared to indi-<br />
viduals in the prosocial category (see for example Joireman et al. 2004, Utz 2004, Stouten et al. 2005,<br />
de Kwaadsteniet et al. 2006, Cornelissen et al. 2007, van Prooijen et al. 2008, van den Bos et al. 2009).<br />
Obviously such procrusteanism sacrifices information. This collapsing across categories is not an<br />
intrinsic limitation of the Triple-Dominance SVO measure, but rather a regrettable convention that<br />
has evolved with it when the number of subjects per category is considered to be too low (see e.g.<br />
Van Lange & Liebr<strong>and</strong> 1991).<br />
Sixth, offering the nearly identical choice nine times may induce subjects to vary their responses<br />
in unexpected ways. In some cases, this variation may be reflective of their honest preferences. For<br />
example we had one subject in pretesting explain that he answered about half of the items selfishly<br />
<strong>and</strong> the other half cooperatively. His goal he explained was to be nice, but not too nice. This subject<br />
treated the scale holistically <strong>and</strong> made a set of answers that, when considered in total were sensible,<br />
but would have resulted in an uncategorizable result using the st<strong>and</strong>ard scoring rule. In other cases,<br />
subjects may become bored or suspicious of answering the same item repeatedly <strong>and</strong> thus vary their<br />
answers. Ironically, this high degree of redundancy in triple dominance scales may undermine its<br />
ability to classify subjects. For example, in the study conducted by Kuhlman & Marshello (1975a), the<br />
percentage of unclassifiable subjects was 25% (42 out of 167), Kuhlman et al. (1992) report 29.3% (41<br />
out of 140) unclassifiable subjects, <strong>and</strong> Sheldon (1999), who made use of the Kuhlman <strong>and</strong> Teta mea-<br />
sure, even applied an alternative scoring method after having lost 27% (25 out of 90) of the subjects<br />
for analysis because they were not classifiable.<br />
13
5<br />
10<br />
15<br />
20<br />
25<br />
Murphy, Ackermann & H<strong>and</strong>graaf (2010) DRAFT v0.6 <strong>Measuring</strong> SVO<br />
3.2.3 Rank correlation technique: Another application of decomposed games<br />
Another measurement technique that makes use of decomposed games for assessing SVO was<br />
introduced by Iedema & Poppe (1994a,b, 1995). Iedema & Poppe presented subjects with pairwise<br />
comparisons of eight different own/other payoff allocations, resulting in a total of 28 allocation de-<br />
cisions. Then, ranks were assigned to the eight payoff allocations for each subject according to how<br />
often each of these eight alternatives had been selected. Prior to this assessment, Iedema & Poppe<br />
had compiled ideal rank orders of the eight alternatives with respect to six different social orienta-<br />
tions (individualism, altruism, equality, cooperation, competition <strong>and</strong> maximin). The assessed rank<br />
orders were then correlated (Spearman’s rank order correlation) with each of the six ideal rank orders<br />
for each subject, yielding six correlation coefficients per subject, each of which was indicative of the<br />
relation between the subject’s rank order <strong>and</strong> the corresponding ideal rank orders of the six social ori-<br />
entations. These coefficients were then transformed into Fisher Z -scores ranging from −3 to +3 <strong>and</strong><br />
subjects were classified to a particular SVO category matching their highest Z -score, provided that<br />
this score was greater than a predetermined threshold. In one instance a threshold of .55 (which cor-<br />
responds to a correlation coefficient of .5) (Iedema & Poppe 1994a,b) was used. In another instance,<br />
a threshold of .881 (corresponding to a correlation of .707, reflecting the threshold of 50% explained<br />
variance) (Iedema & Poppe 1995) was required.<br />
3.3 Utility measurement<br />
Utility measurement in general refers to the systematic estimation <strong>and</strong> mapping of how subjec-<br />
tively valuable goods or outcomes are to a DM. Utility is an abstract construct that is inferred from<br />
the revealed preferences of DMs as they make choices among available alternatives. These alterna-<br />
tives can include “bundled outcomes,” sets of discrete goods that are considered <strong>and</strong> evaluated as a<br />
whole set. Obviously, the utility of these bundled outcomes results from the constituent parts therein.<br />
However, the way a DM integrates information about the items <strong>and</strong> makes tradeoffs between them<br />
may not be so obvious. Early studies of these kinds of choices by Thurstone (1931) involved subjects<br />
making paired comparisons between sets of goods (2 hats, 4 pairs of shoes) vs. (4 hats, X pairs of<br />
shoes) where X was varied systematically by the experimenter. This approach yielded an estimated<br />
14
5<br />
10<br />
15<br />
20<br />
25<br />
Murphy, Ackermann & H<strong>and</strong>graaf (2010) DRAFT v0.6 <strong>Measuring</strong> SVO<br />
value of X where a DM was indifferent between the sets. Given this indifference point, the relative<br />
contribution of the discrete items to the bundle’s overall utility could be inferred.<br />
With respect to SVO, joint allocations are viewed as “bundled outcomes” that have at least two dis-<br />
tinct potential sources of utility for a DM– the payoff for the self <strong>and</strong> the payoff for another. Individual<br />
differences emerge because different people place different subjective values upon these sources of<br />
utility <strong>and</strong> make different subjective tradeoffs when evaluating the bundle as a whole. Although the<br />
notion of utility is most closely associated with economics, this framework is consistent with func-<br />
tional measurement (Anderson 1970), specifically in the context of information integration theory<br />
(Anderson 1968).<br />
3.3.1 Utility measurement described<br />
The approach of using utility measurement in the context of own-other-outcome is not a new<br />
idea. Edgeworth (1881) assumed that between pure selfishness <strong>and</strong> pure prosociality (or in h is words<br />
- Pure Universalistic) there are a wide range of middle orientations. He wrote:<br />
For between the two extremes Pure Egoistic <strong>and</strong> Pure Universalistic there may be an indefinite<br />
number of impure methods; wherein the happiness of others as compared by the<br />
agent (in a calm moment) with his own, neither counts for nothing, nor yet “counts for<br />
one,” but counts for a fraction. (Edgeworth 1881, p.16)<br />
From this, one can readily see that the idea of utility in social contexts as being affected not only by<br />
one’s own welfare, but also by the welfare of others, is not new. Edgeworth assumed that the welfare<br />
of others does not have the same impact on one’s happiness as one’s own welfare, but instead has<br />
a fraction of that impact. Hence the magnitude of such a fraction can be considered an index of<br />
prosociality. The coefficients or weights attached to the outcomes of others as specified in utility<br />
functions is what Edgeworth meant when using the term fraction in this context.<br />
The framework of using joint utility evaluations was chosen by Wyer (1969) who used it to suc-<br />
cessfully predict choice behavior in particular classes of strategic games. His approach transformed<br />
preferences for outcome allocations into utilities. Wyer, as well as Griesinger & Livingston (1973),<br />
modeled the utility of joint allocations as a linear combination of the weighted outcomes for the self<br />
15
5<br />
10<br />
15<br />
20<br />
25<br />
Murphy, Ackermann & H<strong>and</strong>graaf (2010) DRAFT v0.6 <strong>Measuring</strong> SVO<br />
<strong>and</strong> for another. Wyer used a utility function with the form<br />
U = (w1RS) + ((1 − ) w2RS) + (w3RO) (2)<br />
where RS represents the outcome for self, RO represents the outcome for other, w1,2,3 represent weights<br />
reflecting the values attached to the respective outcomes <strong>and</strong> is an indicator function which yields<br />
the value of 1 if RS > 0 <strong>and</strong> 0 if RS ≤ 0. In his experiment, Wyer used a 21-point rating scale to assess<br />
the desirability of allocation outcomes. Subjects were asked how much they would like, for example, a<br />
distribution of 2 points for themselves <strong>and</strong> −3 points for another. The scale ranged from between −10<br />
<strong>and</strong> +10 in interval steps. These desirability ratings were then inserted into the above formula as an<br />
estimated utility value, conditional on that particular allocation (in this example RS = 2 <strong>and</strong> RO = −3).<br />
After a series of ratings were obtained from a research subject, the weights w1,2,3 were estimated by<br />
ordinary least-squares fitting.<br />
Different sets of weights indicate different social orientations. Considering instances of positive<br />
outcomes, a person with an individualistic orientation would have a high positive w1 weighting <strong>and</strong><br />
a w3 weighting close to zero. Prosocial individuals would have positive values for both w1 <strong>and</strong> w3<br />
that are similar in magnitude. Wyer showed that the competitive orientation would be reflected by a<br />
positive w1 <strong>and</strong> a negative w3.<br />
More complex utility models have been posited. For example, second order polynomials have<br />
been used to account for joint utilities. Radzicki (1976), used a conjoint measurement technique to<br />
identify a best fitting utility function. Subjects were asked to make rankings of 25 outcome alloca-<br />
tions from the most preferred to the least preferred distributions. These rankings were then analyzed<br />
<strong>and</strong> linear programming methods were used to determine the form of the utility function that fit the<br />
particular rankings best. This method yielded a particular utility function, along with weighting co-<br />
efficients, for each of the subjects. Radzicki found that linear functions fit 41% of the participants’<br />
rankings best, whereas for 8% of the participants’ rankings, none of the considered functions fit the<br />
data sufficiently. In many cases though, non-linear functions exhibited a significantly better fit to<br />
the data than simple linear models. For example, for people who were concerned with equality in<br />
16
5<br />
10<br />
15<br />
20<br />
25<br />
Murphy, Ackermann & H<strong>and</strong>graaf (2010) DRAFT v0.6 <strong>Measuring</strong> SVO<br />
outcomes, the function which best fit the particular rankings was of the form<br />
u(x, y) = ax + by + cx 2 + d y 2 + e(| x − y | q ) (3)<br />
where q < 1. Although the simplicity of linear models is convenient <strong>and</strong> in many cases sufficient to<br />
describe choice behavior with respect to joint allocations, non-linear models allow for more sophis-<br />
ticated descriptions of choice behavior <strong>and</strong> are able to account for more complex patterns in data.<br />
Non-linear approaches are suggested by MacCrimmon & Messick (1976) <strong>and</strong>, Wyer (1969) himself<br />
noted that non-linear relations between given outcomes <strong>and</strong> their utilities could well be possible, if<br />
not probable, when payoff amounts exceed a certain range of values under consideration. For exam-<br />
ple, the increase of a payoff amount from one dollar to two dollars is probably not equally valued as<br />
an increase from 500 dollars to 501 dollars with respect to utility. From this point of view, non-linear<br />
models are justifiable when the values of outcomes presented to decision makers vary widely in the<br />
amounts under consideration.<br />
3.3.2 Discussion of utility measurements<br />
As McClintock & Van Avermaet (1982) noted, the approach of using utility functions for the evalu-<br />
ation of social value orientations as performed by Wyer (1969, 1971) or Radzicki (1976) is focused on<br />
revealing a mode of measurement that adequately describes the combinatory rules underlying prefer-<br />
ence choices within the framework of own-other-outcome allocations <strong>and</strong> theoretically allows for an<br />
infinite number of possible social value orientation. Therefore, these models do not state particular<br />
SVOs a priori, but rather let SVOs be inferred from or interpreted by specific combinatory rules <strong>and</strong><br />
weight values provided by the respective utility functions. By contrast, methods following the line of<br />
Messick & McClintock (1968) –such as the trichotomous measure or decomposed games in general as<br />
well as the ring measure– are more concerned with the “substantive nature” (McClintock & Van Aver-<br />
maet 1982, p.59) of SVO. That is, the existence of a number of predefined SVOs is assumed a priori <strong>and</strong><br />
the emphasis is placed upon measuring them directly by letting people decide between two or more<br />
outcome allocations that are indicative of particular archetypical social orientations.<br />
Nevertheless, there are certain problems with the use of utility measurement for assessing SVO.<br />
17
5<br />
10<br />
15<br />
20<br />
25<br />
Murphy, Ackermann & H<strong>and</strong>graaf (2010) DRAFT v0.6 <strong>Measuring</strong> SVO<br />
First, when SVOs for different persons are expressed using different functional forms, each represen-<br />
tation potentially containing a different number of parameters, it is difficult to compare or aggregate<br />
results. For example Radzicki’s method is likely too flexible to be useful <strong>and</strong> certainly over-fits ratings<br />
data that are at least in some part measurement error.<br />
Second, DMs are not making choices in these utility estimation methods, but rather judging the at-<br />
tractiveness of different hypothetical allocations. This rating procedure makes strong linear assump-<br />
tions of the response scale which are likely not met, especially given the scale’s structure (a 21-point<br />
rating scale!). Eliciting judgments rather than choices introduces a level of abstraction that does not<br />
offer clear benefits. Moreover, inducing participants to honestly report their preferences by incentive<br />
compatible methods is not easily accommodated with judgment tasks like the ones suggested above.<br />
3.3.3 Indifference curves: A graphical approach to measuring SVO<br />
In addition to utility functions as representations of different SVOs, indifference curves too can be<br />
used as a representation of preferences for different joint outcomes. Consider a set of curves plotted<br />
on a two-dimensional plane defined by the payoff to self on the x-axis <strong>and</strong> payoff to another on the<br />
y-axis. Radzicki (1976) depicted indifference curves resulting from a utility function corresponding to<br />
the best fit of subjects’ rating data.<br />
Another approach along these lines was developed by Harrison (1998) who conducted what he<br />
termed an “indifference curve experiment” based on a procedure described by MacCrimmon & Toda<br />
(1969) <strong>and</strong> similar to the approach by Thurstone (1931). Harrison requested subjects make several<br />
pairwise choices between various joint allocations of money. For example, subjects chose between<br />
an allocation of $10 to themselves <strong>and</strong> $8 to another, or say $17 for themselves <strong>and</strong> $15 to another.<br />
The first optional distribution was referred to as the “reference allocation” <strong>and</strong> for a set of choices<br />
was always the same. After multiple choices are made, one can infer an indifference curve running<br />
through the reference point <strong>and</strong> the boundary between those allocations that were preferred over the<br />
reference allocation <strong>and</strong> those allocations which were not preferred over the reference allocation (see<br />
Figure 5).<br />
By repeating this procedure <strong>and</strong> using a different reference allocation point, an arbitrary number<br />
18
5<br />
10<br />
15<br />
Murphy, Ackermann & H<strong>and</strong>graaf (2010) DRAFT v0.6 <strong>Measuring</strong> SVO<br />
Figure 5: An example of the indifference curve method. The left panel shows 18 pairs of potential allocation<br />
choices that a subject would consider. Each of them has in common the Reference Allocation.<br />
Each of the Optional Allocations is either chosen over the Reference Allocation or not. The resulting<br />
pattern of preferred options can be used to identify an indifference curve which necessarily intersects<br />
the Reference Allocation point.<br />
payoff to<br />
other<br />
30<br />
20<br />
10<br />
10, 8<br />
Reference allocation<br />
Optional allocation<br />
17, 15<br />
10 20 30<br />
payoff to<br />
self<br />
payoff to<br />
other<br />
30<br />
20<br />
10<br />
10 20 30<br />
Reference allocation<br />
Selected allocation<br />
Non-selected allocation<br />
of indifference curves can be discerned, resulting in a contour map consistent with a DM’s SVO. This<br />
measurement procedure can be done to an arbitrary level of precision depending on the number of<br />
choice sets presented to a DM. The example shown in Figure 5 shows how one indifference curve can<br />
be inferred from 18 distinct pairwise choices; these are actual stimuli from Harrison (1998).<br />
It is worth noting that such a procedure has some advantages. First, subjects are presented with<br />
pairwise comparisons rather than multiple comparisons or abstract rating scales. Furthermore, no a<br />
priori assumption about the existence of a number of predefined social value orientations is needed,<br />
while the indifference curve patterns resulting from the procedure allow for interpretations regarding<br />
the extent to which they are consistent of respective SVOs. This method can also quickly identify<br />
intransitive choice sets or r<strong>and</strong>om responding from particular subjects, as no indifference curve can<br />
be inferred from their allocation decisions. It can also readily accommodate incentive compatible<br />
choices.<br />
This approach however has some limitations. First the resulting indifference curves are identified<br />
heuristically <strong>and</strong> not analytically. This means that a curve is “eye-balled” into place in order to di-<br />
vide the chosen points from the non-chosen points. An infinite number of bivariate functions could<br />
yield a curve that separates the chosen options from the non-chosen options while intersecting the<br />
reference allocation. Identifying the “best” fitting curve is impossible given the low resolution of the<br />
19<br />
payoff to<br />
self
5<br />
10<br />
15<br />
20<br />
25<br />
Murphy, Ackermann & H<strong>and</strong>graaf (2010) DRAFT v0.6 <strong>Measuring</strong> SVO<br />
choice data <strong>and</strong> the heuristic method of curve fitting does not lend itself to parameterization. In order<br />
to address this issue, a researcher could specify a number of forms for the joint utility function (similar<br />
to Radzicki (1976)), <strong>and</strong> then roughly estimate an underlying utility function with general parameters<br />
that are consistent with the choices. Although this would quantify the heuristic indifference curve to<br />
some degree, the resulting joint utility function <strong>and</strong> parameters are not easily comparable between<br />
subjects given the variety of functional forms that may emerge as being consistent with the under-<br />
lying set of binary choices. Another shortcoming with this approach, is the relatively large number<br />
of choices a DM is required to make in order to infer one indifference curve. In the example shown,<br />
which is based on stimuli from Harrison (1998), 18 binary choices were used to approximate just one<br />
indifference curve.<br />
3.4 The <strong>Social</strong> Behavior Scale<br />
The <strong>Social</strong> Behavior Scale was devised as a measure that controls for individualism by keeping<br />
the outcome distributable to self constant <strong>and</strong> letting only the outcome distributable to the other<br />
vary over the choice alternatives. Consequently, decision makers are not given the opportunity to<br />
maximize their own gain by choosing a particular alternative, but only have control over the outcome<br />
for another.<br />
3.4.1 The <strong>Social</strong> Behavior Scale described<br />
The social behavior scale is a choice task with four alternatives as shown in Figure 6. The alterna-<br />
tives are: Rivalry & superiority; superiority; equality; <strong>and</strong> altruism & group enhancement. Outcomes<br />
for self <strong>and</strong> other are depicted as small squares <strong>and</strong> labeled as “chips.” This measure was devised by<br />
Knight & Kagan (1977) in effort to study the social behavior of young children from different ethnic<br />
groups. In their experimental study, children were told that the more chips they acquired, the more<br />
toys they would receive. This “currency” is easily comprehensible <strong>and</strong> can be presented without nu-<br />
merical abstraction, ideal for use with children, especially when there may be differences with respect<br />
to their formal educational experience. Subjects were asked to choose one out of the four alternatives<br />
according to their preferences.<br />
20
5<br />
10<br />
15<br />
20<br />
Murphy, Ackermann & H<strong>and</strong>graaf (2010) DRAFT v0.6 <strong>Measuring</strong> SVO<br />
Other<br />
outcome<br />
Self<br />
outcome<br />
Figure 6: <strong>Social</strong> behavior scale<br />
Rivalry Altruism<br />
Rivalry &<br />
superiority<br />
3.4.2 Discussion of the <strong>Social</strong> Behavior Scale<br />
Superiority Equality<br />
Altruism & group<br />
enhancement<br />
As a result of its properties, especially with regard to assessing individualistic orientations, the<br />
social behavior scale is too restricted to be an appropriate measure for SVO in general. Of course, one<br />
can readily imagine an alternative form of the <strong>Social</strong> Behavior Scale, where individualism is not strictly<br />
controlled. Such an alternative form would present allocation decisions across a range of different<br />
outcomes with simplified stimuli. Such a method could be advantageous when conducting studies<br />
with children or populations not accustomed to quantified information.<br />
3.5 The Ring Measure<br />
The ring measure is a method for assessing SVO that uses a series of dichotomous allocation de-<br />
cisions <strong>and</strong> derives an SVO score from the combined results of the choices made by a subject. The<br />
method is based on the notion that joint payoffs can be represented on a Cartesian coordinate system<br />
where payoffs to the DM are represented on the x-axis <strong>and</strong> payoffs to another person are represented<br />
on the y-axis (see Figure 1). This idea is consistent with the geometrical model which was devised<br />
by Griesinger & Livingston (1973) <strong>and</strong> Wyer (1969, 1971). Griesinger & Livingston stated that a per-<br />
son’s SVO can be conceptualized as a vector with a certain direction <strong>and</strong> magnitude in the joint payoff<br />
plane. The utility of a particular payoff allocation can then be expressed as the scalar product of<br />
the motivational vector with the vector of the given choice, or in other words, the projection of the<br />
given choice vector on the motivational vector. Consequently, a person will always choose the pay-<br />
off allocation with the greatest projection on his or her motivational vector. Further, the angle of the<br />
motivational vector is indicative of a respective SVO. For example, a motivational vector at the angle<br />
21
5<br />
10<br />
15<br />
20<br />
25<br />
Murphy, Ackermann & H<strong>and</strong>graaf (2010) DRAFT v0.6 <strong>Measuring</strong> SVO<br />
of θM = 45 ◦ represents a prosocial orentation, whereas an individualistic motivation is represented by<br />
a vector at θM = 0 ◦ (see Figure 1). Following this conceptualization, Liebr<strong>and</strong> (1984) developed <strong>and</strong><br />
established the Ring Measure as a novel method for assessing SVO.<br />
3.5.1 The Ring Measure described<br />
The ring measure presents subjects with a set of N dichotomous allocation decisions that are de-<br />
fined by N points on a circle centered at the Cartesian origin (x = 0, y = 0). Each pair of adjacent points<br />
(defining a chord on the circle) serve as the two distribution options, <strong>and</strong> the subject makes a series<br />
of choices over these different allocations. Researchers have set the value of N at both 24 (Liebr<strong>and</strong> &<br />
McClintock 1988) <strong>and</strong> 16 (Liebr<strong>and</strong> 1984). 5<br />
After a research participant has made her N allocation choices, a vector is computed by adding<br />
her chosen options together, thus yielding two numbers (the sum of money the subject allocated to<br />
herself, <strong>and</strong> the sum of money the subject allocated to the other person). The resulting point can be<br />
interpreted as a vector (using the center point of the ring as its origin). The angle of this vector cor-<br />
responds to a person’s SVO <strong>and</strong> can be computed by θ = arctan( y<br />
x ), where y is the sum of allocations<br />
to the other <strong>and</strong> x is the sum of allocations to the self. The length of the vector indicates the internal<br />
consistency of the subject’s allocation decisions. If a person makes inconsistent choices, the result is<br />
necessarly a shorter vector. Perfectly consistent choice sets have the property of having one option<br />
being chosen twice (the most preferred distribution in the whole set), one option never being chosen<br />
(the least preferred allocation), <strong>and</strong> the remaining allocations being chosen exactly once. The vector<br />
resulting from a perfectly consistent set of choices will have a length equal to twice the radius of the<br />
circle used to generate the items, given that the center of the circle is fixed at the Cartesian origin. Be-<br />
cause of the structure of items in a Ring Measure, the more rigorous property of preference transitivity<br />
cannot be evaluated for a subject’s set of choices, only the weaker condition of consistency with an<br />
underlying vector.<br />
To date, the ring measure has been implemented with a defining center point at (0,0), yielding<br />
both positive <strong>and</strong> negative allocation values. However, to facilitate comparison with other measure-<br />
5 Liebr<strong>and</strong> (1984) employed 16 equally spaced pairs of outcomes on each of two circles (A <strong>and</strong> B) with radii of $7.00<br />
(circle A) <strong>and</strong> $8.50 (circle B), resulting in a total of 32 outcome pairs as choice allocations.<br />
22
5<br />
10<br />
15<br />
20<br />
25<br />
Murphy, Ackermann & H<strong>and</strong>graaf (2010) DRAFT v0.6 <strong>Measuring</strong> SVO<br />
ment methods presented in this paper, the values in Table 10 have been st<strong>and</strong>ardized to range be-<br />
tween 0 <strong>and</strong> 100. This is equivalent to defining a ring with a center at (50,50) <strong>and</strong> a radius of 50 units.<br />
In order to prevent invalid classifications, DMs were typically only classified if the consistency of<br />
their choices was at least 60%. However, there is some variety regarding the st<strong>and</strong>ards for establish-<br />
ing a classification. For example, some classifications are made with a 50% consistency level (e.g.<br />
Van Lange 1999) or, in other cases, only if a vector is not shorter than a quarter (e.g. McClintock &<br />
Liebr<strong>and</strong> 1988) or even a fifth (e.g. Dehue et al. 1993) of the maximum possible vector length.<br />
3.5.2 Discussion of the Ring Measure<br />
At first blush the Ring Measure’s agnostic method of defining items evenly over the complete circle<br />
may appear to be a sensible approach. However there is overwhelming evidence demonstrating that<br />
SVOs are not uniformly distributed among people <strong>and</strong> that the vast majority of DMs have motivations<br />
consistent with one of three categories. Therefore using items from the whole space of possible SVOs<br />
is necessarily inefficient. The structure of the Ring Measure assigns equal value to the following two<br />
items: (1) Is a person more prosocial or more individualistic? (2) Is a person more a martyr or more<br />
masochistic? Clearly the first question is more useful in trying to underst<strong>and</strong> the motivations of typ-<br />
ical DMs. But, because of its blanket approach, the majority of items contained in the Ring Measure<br />
provide no useful information about the motivations of the person answering them. The only items<br />
that offer any useful diagnostic information are those with slopes that are nearly perpendicular to<br />
the underlying motivational vector of the decision maker. This agnostic approach results in a highly<br />
inefficient research tool.<br />
Second, the ring measure fails to classify a significant number of subjects due to inconsistent<br />
choice behavior. In their analysis of several studies that applied the Ring Measure, Au & Kwong<br />
(2004) reported percentages of up to 20% unclassifiable subjects <strong>and</strong> in two experiments performed<br />
by Liebr<strong>and</strong> (1984) himself, the percentage of unclassifiable subjects across the two experiments was<br />
15%. In analyzing these percentages, one has to take into consideration, that Liebr<strong>and</strong> (1984) used<br />
a 60% consistency criterion, whereas in at least some studies analyzed by Au & Kwong, a 50% con-<br />
sistency criterion was chosen (e.g. Van Lange 1999). Part of this inconsistency could be the result of<br />
23
5<br />
10<br />
15<br />
20<br />
25<br />
Murphy, Ackermann & H<strong>and</strong>graaf (2010) DRAFT v0.6 <strong>Measuring</strong> SVO<br />
asking for people’s preferences across such a wide range of distributions, some of which they may have<br />
only weak preferences about. Moreover, inequality aversion would manifest itself as inconsistency in<br />
the Ring Measure. There are two different distribution options that minimize the difference between<br />
joint payoffs <strong>and</strong> if a subject were to choose both of these distributions when given the chance, the<br />
result would be an inconsistent choice set, as well as a shorter vector. And a further complication is<br />
that the Ring Measure has both positive <strong>and</strong> negative options. Given the evidence of how losses loom<br />
larger than gains (Kahneman & Tversky 1979), it is possible that DMs make different tradeoffs when<br />
considering positive outcomes versus negative (or mixed) outcomes. Lastly, the presence of losses<br />
makes it a challenge to implement the Ring Measure in an incentive compatible way as taking money<br />
from research subjects is generally verboten.<br />
Third, the Ring Measure would diagnose inequality aversion as inconsistency. The 45 ◦ diagonal<br />
line from the origin intersects the ring in two places; the point in quadrant 1 corresponds to both<br />
minimizing inequality as well as maximizing joint gain, whereas the point in quadrant 3 corresponds<br />
to minimizing inequality but minimizing joint gain. If a DM were sufficiently motivated by inequality<br />
aversion, he would produce an inconsistent set of allocations by selecting allocations on the diagonal<br />
whenever possiable. The Ring Measure does not address this limitation.<br />
3.5.3 Circle-test: A one-item version of the Ring Measure<br />
Sonnemans, van Dijk, & Winden (2006) conducted a study which required that subjects complete<br />
an SVO measure four times within the context of an ongoing public goods game. To these ends, the<br />
researchers modified the Ring Measure so that subjects had to make only one allocation decision to<br />
yield an SVO score. They termed this modified Ring Measure the “Circle Test.” In the Circle Test, sub-<br />
jects were provided with a graphical representation of the SVO Ring on a computer screen (similar to<br />
Figure 1). Subjects were then requested to make their joint allocation decision by clicking on a posi-<br />
tion somewhere on the arc of the circle. Once a position was tentatively chosen, the corresponding<br />
vector appeared on the screen as an arrow. Subjects then could, if they wanted to, change the angle<br />
of the vector while seeing how these changes affected the payoff allocations for themselves <strong>and</strong> the<br />
other person. Once a subject found her most preferred joint allocation, she confirmed her decision<br />
24
5<br />
10<br />
15<br />
20<br />
25<br />
Murphy, Ackermann & H<strong>and</strong>graaf (2010) DRAFT v0.6 <strong>Measuring</strong> SVO<br />
<strong>and</strong> this completed the measurement session.<br />
The Circle Measure is a highly efficient measure of SVO, requiring only one allocation choice be<br />
made in order to yield a continuos score for a person. But one disadvantage of this brevity is that no<br />
information about measurement reliability can be gained. As the circle measure has only one item,<br />
it is not possible to check whether the choice is transitive or consistent with respect to other choices.<br />
The the measure does not provide any possibility to assess the magnitude of measurement error, <strong>and</strong><br />
at the extremes cannot asses if a participant responded veridically or r<strong>and</strong>omly. Another limitation<br />
is that the changes in payoffs that correspond to movements on the arc are non-linear. The visual<br />
representation is straight forward but the underlying tradeoffs that occur as a DM moves between<br />
different points on the arc are non-intuitive. The arc defining the joint payoffs is necessarily curved<br />
(its second derivative is non-zero), thus not only are the joint payoffs changing as a DM adjusts the<br />
allocation vector, but the rate of change for each of the payoffs is also changing. DMs may mitigate this<br />
complexity by selecting cardinal points on the circle rather than points consistent with their actual<br />
preferences. Lastly, secondary preferences about different allocation options remain unknown when<br />
using the circle measure.<br />
3.6 Regression <strong>and</strong> clustering approach<br />
Consistent with judgment (e.g. Wyer 1969, 1971) <strong>and</strong> conjoint measurement (e.g. Luce & Tukey<br />
1964, Sawyer 1966, Radzicki 1976), Knight & Dubro (1984) developed another method for assessing<br />
SVO that applies regression <strong>and</strong> cluster analysis to well structured preference judgments.<br />
3.6.1 Regression <strong>and</strong> clustering approach described<br />
To obtaining preference data, Knight & Dubro had subjects rate the desirability of joint alloca-<br />
tions on a 7-point scale, where the possible allocations were composed of all combinations of payoffs<br />
ranging from 0¢ to 6¢ in increments of 1¢, resulting in a total of 49 possible allocations <strong>and</strong> the same<br />
number of ratings. Then, for each person’s ratings, a multiple regression equation was used to model<br />
the desirability ratings, while three predictors were used in the analyses: own gain (number of cents<br />
25
5<br />
10<br />
15<br />
20<br />
25<br />
Murphy, Ackermann & H<strong>and</strong>graaf (2010) DRAFT v0.6 <strong>Measuring</strong> SVO<br />
for self), other’s gain (number of cents for the other) <strong>and</strong> equal gains (difference between the own gain<br />
<strong>and</strong> the other’s gain). The resulting regression coefficients were then used in a cluster analysis which<br />
yielded six general clusters. These clusters were interpreted as different categories of SVO: equality;<br />
group enhancement; superiority; individualism; equality & individualism; <strong>and</strong> individualism & supe-<br />
riority.<br />
3.6.2 Discussion of regression <strong>and</strong> clustering approaches<br />
The similarities between the utility measurement approach, as proposed by Wyer (1969) (see sec-<br />
tion 3.3), <strong>and</strong> this regression analysis method are clear. In both methods, preference data are elicited<br />
<strong>and</strong> used to compute parameter values by a least squares estimation technique. The weights attached<br />
to outcome values in the utility functions are conceptually equivalent to the regression coefficients.<br />
The novelty of Knight & Dubro’s approach is the use of regression coefficients in a cluster analysis in<br />
order to classify people into SVO categories. Given the relatively high median squared multiple cor-<br />
relation coefficients for each of the six clusters, ranging from 0.609 to 0.858, it is clear that subjects<br />
exhibited substantial consistency in their judgments of the attractiveness of joint distributions.<br />
One minor drawback with respect to the feasibility of the measure is that Knight & Dubro’s proce-<br />
dure, like the utility measure approaches, makes use of more sophisticated statistical tools that may<br />
be a barrier to adoption for some researchers. Additionally, the amounts of money used as payoffs in<br />
their study were exceptionally small.<br />
3.7 Schulz <strong>and</strong> May’s Sphere Measure<br />
3.7.1 The Sphere Measure described<br />
On the basis of previous work on techniques of assessing SVO such as utility measurement (e.g.<br />
Wyer 1969, 1971, Griesinger & Livingston 1973, Radzicki 1976), the Ring Measure procedure (Liebr<strong>and</strong><br />
1984), <strong>and</strong> the regression <strong>and</strong> clustering approach (Knight & Dubro 1984), an additional way of de-<br />
termining people’s social motivations was devised by Schulz & May (1989). They differentiate be-<br />
tween simple linear SVOs (individualism, sacrifice, altruism, aggression, cooperation, competition),<br />
nonsimple linear SVOs (all possible mixtures of simple linear SVOs), simple conditional linear SVOs<br />
26
5<br />
10<br />
15<br />
20<br />
25<br />
Murphy, Ackermann & H<strong>and</strong>graaf (2010) DRAFT v0.6 <strong>Measuring</strong> SVO<br />
(maximin <strong>and</strong> egalitarianism) as proposed by MacCrimmon & Messick (1976), <strong>and</strong> nonsimple nonlin-<br />
ear SVOs (all possible mixtures of simple conditional <strong>and</strong> nonconditional linear SVOs). For assessing<br />
these different SVO types, Schulz & May applied two measurement methods with the goal of compar-<br />
ing results from each of them. First they used a ranking procedure <strong>and</strong> second they used a pairwise<br />
comparison procedure. Concretely, subjects first made pair-wise comparisons between all possible<br />
combinations of 15 own-other-payoff distributions, resulting in a total of 105 comparisons per sub-<br />
ject. After completing the pair-wise comparison task, subjects were asked to rank order the same 15<br />
payoff allocations without ties using a graphic presentation of the allocation options. The data from<br />
both methods were then analyzed by using a utility model with the general form<br />
u x, y = ax + by + c x − y (4)<br />
which is flexible enough to contain all of the archetypical SVO types as special cases. Roughly speak-<br />
ing, while the Ring Measure uses the parameters a <strong>and</strong> b for calculating the SVO angle on a two-<br />
dimensional plane, Schulz & May extend the model with parameter c, thus yielding a three-dimensional<br />
model. The third dimension is useful in accounting for conditional SVOs (e.g. egalitarian or maximin).<br />
In order to restrict the model, the authors set the condition such that a 2 +b 2 +c 2 = 1, giving the model<br />
a spherical representation. Similar to the Ring Measure procedure, subjects are then categorized ac-<br />
cording to their vector direction. In contrast to the Ring Measure, the Sphere Measure vector extends<br />
into space <strong>and</strong> results as a point on the unit sphere rather than a point on a two dimensional circle.<br />
3.7.2 Discussion of the Sphere Measure<br />
Although Schulz & May make use of sophisticated mathematical tools, <strong>and</strong> uses a more complex<br />
geometric representation than previous methods, the measure still yields results at the nominal level.<br />
Richer results could be extracted from the data of Schulz & May (e.g. transitivity of individual’s choice<br />
sets; the angle of the projection of the inferred motivational vector on the self/other plane) but are<br />
unfortunately not. Further, this measurement method places substantial dem<strong>and</strong>s upon subjects,<br />
requiring them to make 105 pair-wise decisions about joint payoff allocations, as well as rank order<br />
15 different self/other allocations. Considering the resolution of the results, these dem<strong>and</strong>s are hard<br />
27
5<br />
10<br />
15<br />
20<br />
25<br />
Murphy, Ackermann & H<strong>and</strong>graaf (2010) DRAFT v0.6 <strong>Measuring</strong> SVO<br />
to justify.<br />
4 The SVO Slider Measure<br />
We introduce here a new measure of SVO that has several advantages over existing measurement<br />
methods. The new method is referred to as the SVO Slider Measure <strong>and</strong> it can be administered as a<br />
paper based survey or as an online measure. The measure has six primary items with nine optional<br />
follow-up items. All of the items have the same general form. Each item is an allocation choice over a<br />
well defined continuum of joint payoffs. For example, consider a DM choosing a value x between 50<br />
<strong>and</strong> 100 inclusive. Her payoff would be x, whereas the other’s payoff would be 100− x. The DM would<br />
indicate her allocation choice by marking a line at the point that defines her most preferred joint<br />
distribution (see Item 1 in Figure 7, see also Table 11). After the DM has marked her most preferred<br />
allocation point, she would write the corresponding payoffs resulting from her choice to the right<br />
of the item. Although this step of writing the values is redundant, it serves to verify that the DM<br />
underst<strong>and</strong>s the choice task <strong>and</strong> the resulting allocations.<br />
4.1 Primary SVO Slider items<br />
There are six primary slider items. They are defined to cover the four most common social orien-<br />
tations, namely altruistic, prosocial, individualistic, <strong>and</strong> competitive. The items are shown in Figure<br />
7.<br />
These six items were derived from the six lines that fully interconnect the four points correspond-<br />
ing to the most common social orientations reported in the literature (altruistic, prosocial, individ-<br />
ualistic, <strong>and</strong> competitive; see Figure 8). A DM evaluates each of the items sequentially <strong>and</strong> for each<br />
one indicates her most preferred joint distribution. The set of responses can then be scored to yield<br />
an SVO single score for the DM, as well as the rank order of her social preferences, <strong>and</strong> a check for her<br />
preference transitivity.<br />
There are several advantages with the SVO Slider Measure. First, the responses can be evaluated<br />
for comprehension (e.g. checking the correspondence between the mark on the distribution line <strong>and</strong><br />
28
5<br />
10<br />
Murphy, Ackermann & H<strong>and</strong>graaf (2010) DRAFT v0.6 <strong>Measuring</strong> SVO<br />
Figure 7: Primary SVO Slider items. The first item is completed, indicating a DM chose to allocate<br />
herslf 81 <strong>and</strong> the other person 69.<br />
1<br />
2<br />
3<br />
4<br />
5<br />
6<br />
You receive<br />
Other receives<br />
You receive<br />
Other receives<br />
You receive<br />
Other receives<br />
You receive<br />
Other receives<br />
You receive<br />
Other receives<br />
You receive<br />
Other receives<br />
100<br />
85<br />
50<br />
100<br />
50<br />
100<br />
100<br />
94<br />
87<br />
54 59 63 68 72 76 81 85<br />
98<br />
96 94 93 91 89 87 85<br />
54 59 63 68 72 76 81 85<br />
89<br />
98<br />
88<br />
89<br />
79 68 58 47 36 26 15<br />
96<br />
81<br />
50 56 63 69 75 81 88 94<br />
91<br />
15 19 24 28 33 37 41 46<br />
85<br />
85<br />
x<br />
94<br />
50 54 59 63 68 72 76 81<br />
75<br />
93<br />
85 85 85 85 85 85 85 85<br />
76<br />
93<br />
69<br />
94<br />
91<br />
63<br />
96<br />
89<br />
56<br />
98<br />
87<br />
50<br />
100<br />
100<br />
68 59 50 41 33 24 15<br />
the written distribution values). Second, the responses can be evaluated for transitivity. Although SVO<br />
is a matter of subjective preferences, these preferences should conform to the elemental requirement<br />
of transitivity. R<strong>and</strong>om responding on behalf of a subject would likely result in an intransitive set of<br />
responses. Third, the responses yield a full ranking of preferences over motivations. Fourth, the scale<br />
can be scored in a straight-forward manor as follows. The mean allocation for self is computed as is<br />
the mean allocation for the other. Then 50 is subtracted from each of these means (to account for the<br />
midpoint of the ring being at 50, 50). Then the inverse tangent of the ratio between these means is<br />
computed. The reason for the subtraction of 50 from each of the means is to “shift” the base of the<br />
resulting angle to the center of the circle rather than having its base start at the Cartesian origin. The<br />
resulting angle is interpretable just as the resulting angle vector that comes from the Ring Measure.<br />
SVO ◦ <br />
(Āo) − 50)<br />
= arctan<br />
(Ās) − 50)<br />
This response format is highly sensitive to individual differences <strong>and</strong> yields an index at the ratio level<br />
of measurement. Assessing SVO in this way also facilitates parameterization <strong>and</strong> model assessment<br />
(see section 5.6) that is not possible with other existent measures. Nonetheless, reducing the high res-<br />
29<br />
50<br />
85<br />
85<br />
You<br />
Other<br />
You<br />
Other<br />
You<br />
Other<br />
You<br />
Other<br />
You<br />
Other<br />
You<br />
Other<br />
81<br />
69<br />
(5)
5<br />
10<br />
15<br />
Murphy, Ackermann & H<strong>and</strong>graaf (2010) DRAFT v0.6 <strong>Measuring</strong> SVO<br />
olution score to a nominal category may be desirable in some cases, <strong>and</strong> Slider angles can be trans-<br />
formed into corresponding categories with ease.<br />
It can be shown that the resulting angle for a perfect altruist would be 61.39 ◦ . A prosocial DM<br />
with inequality aversion would yield an angle of 37.48 ◦ . A prosocial DM who endeavored to maximize<br />
joint gain (<strong>and</strong> is inequality tolerant) would yield an angle between 37.09 ◦ <strong>and</strong> 52.91 ◦ . The reason<br />
for this range is that this DM would be wholly indifferent across the entire SVO Slider item that has<br />
a slope of -1 (e.g. the item with endpoints 100,50 <strong>and</strong> 50,100) as it has a constant sum. A perfectly<br />
consistent individualist yields an angle between -7.82 ◦ <strong>and</strong> 7.82 ◦ . The reason for this range is that this<br />
particular DM would be wholly indifferent across the entire SVO Slider item that has an undefined<br />
slope (endpoints 85, 85 <strong>and</strong> 85, 15). A perfectly consistent competitor yields an angle of -16.26 ◦ . Given<br />
Figure 8: This figure shows where in the self/other allocation plane the six primary items are from the<br />
Slider Measure.<br />
Payoff to other<br />
100<br />
75<br />
50<br />
25<br />
50<br />
100<br />
0 25<br />
50 75 100<br />
Payoff to Self<br />
the angles that result from idealized SVO types, proper boundaries between categories can be derived.<br />
Altruists would have an angle greater than 57.15 ◦ ; prosocials would have scores between 22.45 ◦ <strong>and</strong><br />
57.15 ◦ ; individualists would have scores between -12.04 ◦ <strong>and</strong> 22.45 ◦ ; <strong>and</strong> competitive types would<br />
have an angle less than -12.04 ◦ . As it can be seen, these boundaries are not at intuitive locations. The<br />
reason for this is that the Slider Measure only uses a subset of possible items from the allocation plane<br />
<strong>and</strong> these items are not symmetrically distributed around the whole of the ring. Because only an<br />
30<br />
85<br />
85<br />
85<br />
15<br />
100<br />
50
5<br />
10<br />
15<br />
20<br />
Murphy, Ackermann & H<strong>and</strong>graaf (2010) DRAFT v0.6 <strong>Measuring</strong> SVO<br />
asymmetric set of items is used here, the resulting convex hull of possible scores is “squished” to the<br />
upper-right, relative to the midpoint of the ring. This feature does not adversely affect the validity<br />
of the measure. 6 We recognize that computing results from the SVO slider (checking for transitivity,<br />
establishing the ranking of preferences, finding a subject’s SVO angle) may be arduous <strong>and</strong> thus we<br />
have developed several analysis scripts that automate <strong>and</strong> simplify the process. These scripts are<br />
available on our SVO website at http://vlab.ethz.ch/svo/SVO_Slider/.<br />
4.2 Secondary SVO Slider items<br />
There are nine secondary Slider Measure items. This set of items is designed to disentangle the<br />
motivation of joint maximization from the motivation of inequality aversion. The items are defined<br />
in the prosocial area of the self/other allocation plane <strong>and</strong> have approximately the same magnitude<br />
(ranging between 50 <strong>and</strong> 100) as the six primary Slider items. One noteworthy feature is that all of<br />
the distribution ranges intersect the diagonal line. This is an important feature of the set as the diag-<br />
onal line corresponds to perfectly equal allocations, i.e., those distributions that minimize inequality<br />
between the DM <strong>and</strong> the other person. A participant motivated to minimize inequality would make<br />
allocations on or very near the 45 ◦ line. Conversely a participant motivated to maximize joint gains<br />
would make allocations near the endpoints, as far from the diagonal as possible, as these allocations<br />
maximize collective earnings. Previous measures of SVO have not been able to make a differentiation<br />
between these two motivations. The nine items are shown in Figure 9. An example of results from<br />
these items is discussed in Section §5.6.<br />
4.3 Web-based SVO Slider Measure<br />
In addition to being administrable as a paper-based measure, the Slider Measure has been pro-<br />
grammed as an online research tool (http://vlab.ethz.ch/svo/slider/). Once a researcher has<br />
an account, he or she can create a new study. This requires two things. First the researcher must<br />
6 It would be possible to extend the Slider Measure in such a way that it would have a symmetric set of items <strong>and</strong> thus<br />
have a rotationally symmetric convex hull of possible scores. This extended measure certainly would be more aesthetically<br />
pleasing <strong>and</strong> would have intuitive angles as boundaries between the categories. However, this extended measure would<br />
require about five times as many items <strong>and</strong> would likely yield no better estimation of a person’s SVO as the additional items<br />
would be targeting the sparsely populated categories (e.g. martyr, sadomasochistic). In developing the Slider Measure we<br />
strove for efficiency over aesthetics.<br />
31
5<br />
10<br />
Murphy, Ackermann & H<strong>and</strong>graaf (2010) DRAFT v0.6 <strong>Measuring</strong> SVO<br />
Figure 9: This figure shows the location of the nine secondary items for the Slider Measure in the<br />
self/other allocation plane.<br />
Payoff to other<br />
100<br />
75<br />
50<br />
25<br />
50<br />
100<br />
70<br />
100<br />
90<br />
100<br />
0 25<br />
50<br />
Payoff to Self<br />
75 100<br />
select which SVO measures to use (Slider primary items <strong>and</strong>/or Slider secondary items); second the<br />
researcher must input a list of subjects’ emails. These subjects then receive an email invitation to par-<br />
ticipate in online research. Each email invitation has a unique tokened link that when clicked upon<br />
takes the subject directly to the SVO website. Once there, the subject is presented with instructions<br />
<strong>and</strong> then a series of allocation choices. For each subject, the items are presented in a r<strong>and</strong>om order.<br />
Subjects record their choices by moving a slider back <strong>and</strong> forth, changing the joint allocations until<br />
they find their most preferred outcome (see Figure 10 for a screen shot). Once they are satisfied with<br />
the distribution, they finalize it by clicking the “Submit” button. Then the program takes them to<br />
the next item or if they have answered all of the items, to a conclusion <strong>and</strong> “thanks for participating”<br />
page. After all the subjects on the invitation list have participated (or a predetermined end date/time,<br />
whichever happens first) the researcher is sent via email a datafile with the subjects’ identifying infor-<br />
mation, item order, all of their choices, summary scores, <strong>and</strong> transitivity verification.<br />
32<br />
100<br />
90<br />
100<br />
70<br />
100<br />
50
5<br />
10<br />
15<br />
Murphy, Ackermann & H<strong>and</strong>graaf (2010) DRAFT v0.6 <strong>Measuring</strong> SVO<br />
Figure 10: Online Slider Measure.<br />
5 Psychometric properties of SVO measures<br />
Considering the relatively large number of measurement methods that have been developed, rel-<br />
atively little effort has been made to validate them. However, some data are available. For example,<br />
Liebr<strong>and</strong> & van Run (1985) reported 73% agreement between the ring measure <strong>and</strong> the decomposed<br />
game procedure proposed by Kuhlman & Marshello (1975a), but only under the terms that altru-<br />
ists <strong>and</strong> cooperators were combined into a single category. Otherwise, the agreement between the<br />
two measures can at best be deemed only moderate, at least with respect to the altruistic <strong>and</strong> co-<br />
operative categories. Another test of the convergent validity of two SVO measures was performed<br />
by Parks (1994), who compared data from a classical decomposed game technique (Kuhlman et al.<br />
1986) to data from the regression <strong>and</strong> clustering approach (Knight & Dubro 1984). In coding data<br />
from both measures so that higher scores indicate greater cooperation, he reported a very small <strong>and</strong><br />
non-significant correlation (r = 0.08) between the two SVO measures, hence challenging the basic as-<br />
sumption that the same construct was assessed. Although there are other studies in which different<br />
measures of SVO were applied (e.g. Sheldon 1999, Van Lange 1999), results from which convergent<br />
validity could be inferred are often neither reported nor sufficiently elucidated.<br />
5.1 Slider Measure validation procedure<br />
In order to assess the psychometric properties of the new SVO Slider Measure it was tested in tan-<br />
dem with the established <strong>and</strong> commonly used measures of SVO; namely the Triple-Dominance Mea-<br />
33
5<br />
10<br />
15<br />
20<br />
25<br />
Murphy, Ackermann & H<strong>and</strong>graaf (2010) DRAFT v0.6 <strong>Measuring</strong> SVO<br />
sure <strong>and</strong> the Ring Measure. Fifty-six individuals were recruited to participate in a multi-part “decision<br />
making study” at a European university. Participation was voluntary <strong>and</strong> no deception was used in<br />
this research. Participants were guaranteed strict confidentiality for all of their answers. The stimuli in<br />
the experiment were made incentive compatible by means of a lottery: for each experimental session<br />
four participants were r<strong>and</strong>omly selected after making their choices <strong>and</strong> for each selected person one<br />
of their allocation decisions was implemented (i.e. their allocation choice was carried out such that<br />
they received some chosen payoff, as well as did some other r<strong>and</strong>omly selected person, according to<br />
their actual choice). For all research sessions, participants were reminded that their decisions were<br />
private <strong>and</strong> that there was a real chance that their choices would have a pecuniary effect upon them-<br />
selves <strong>and</strong> some other person if they happened to be selected by lottery. DMs selected by lottery were<br />
paid privately in cash within a week of their participation. The average earnings were about 70 Swiss<br />
francs (US$68) each.<br />
Three research sessions were run, with one week separating the sessions. Each research session<br />
required fewer than 15 minutes to conduct <strong>and</strong> used paper based methods. In the first session, partic-<br />
ipants completed the 9-item Triple-Dominance Measure <strong>and</strong> the 24 item Ring Measure. In the second<br />
session, participants completed the Slider Measure (the 6 primary items) <strong>and</strong> the Triple-Dominance<br />
Measure. In the third session, participants completed the Ring Measure <strong>and</strong> the Slider Measure. All<br />
of the measures used st<strong>and</strong>ardized values between 0 <strong>and</strong> 100. This design allowed us to assess the<br />
test-retest reliability of the Triple-Dominance Measure, the Ring Measure, <strong>and</strong> the Slider Measure. It<br />
also allowed us to compute the associations between the different measures <strong>and</strong> establish norming<br />
data <strong>and</strong> convergent validity for the new SVO Slider Measure.<br />
5.2 Results<br />
Table 4 shows the percentage of individuals that were assigned to each of the different SVO cat-<br />
egories by the different measurement methods, ordered by experimental session. Across all mea-<br />
surement methods there is a clear majority type, namely prosocial, occurring about 59% of the time.<br />
Individualist is less common, but found about 34% of the time. Competitive <strong>and</strong> unclassifiable types<br />
complete the remainder of the sample representing about 3-4% each.<br />
34
5<br />
10<br />
Murphy, Ackermann & H<strong>and</strong>graaf (2010) DRAFT v0.6 <strong>Measuring</strong> SVO<br />
Table 4: The percentage of individuals that were assigned to each of the different SVO categories by<br />
the different measurement methods, ordered by experimental session.<br />
5.3 Reliability<br />
SVO<br />
Session 1 Session 2 Session 3 Gr<strong>and</strong><br />
TD RM TD SM RM SM mean<br />
Prosocial 60 53 61 58 57 64 59<br />
Individualistic 21 45 32 39 36 34 34<br />
Competitive 2 2 4 4 4 2 3<br />
Unclassifiable 17 0 4 0 2 0 4<br />
5.3.1 Triple-Dominance Measure test-retest reliability<br />
Table 5: A cross tabulation showing the frequency of categorization from test-retest for the Triple-<br />
Dominance Measure.<br />
Session 1<br />
Session 2<br />
Prosocial Individualistic Competitive Unclassifiable<br />
Prosocial 23 1 0 1<br />
Individualistic 2 8 0 0<br />
Competitive 0 1 0 0<br />
Unclassifiable 3 5 1 1<br />
Forty-six participants completed both sessions 1 <strong>and</strong> 2. Of those, 32 (23+8+0+1) were categorized<br />
in the same SVO category each time by the Triple-Dominance Measure, yielding a consistency of 70%<br />
(Goodman <strong>and</strong> Kruskal’s gamma 7 = 0.391).<br />
5.3.2 Ring Measure test-retest reliability<br />
Forty-four participants completed both sessions 1 <strong>and</strong> 3. Of those, 30 (18 + 12 + 0 + 0) were cate-<br />
gorized into the same SVO category each time by the Ring Measure, yielding a consistency of 68%.<br />
Further the correlation between the resulting angles from the test-retest of the ring measure was<br />
r = 0.599.<br />
7 As the Triple-Dominance Measure yields a nominal level variable with more than two categories, a Pearson product<br />
moment correlation coefficient is not an appropriate statistic for assessing its reliability, hence the non-parametric<br />
Gamma statistic is used as an index of test-retest association.<br />
35
5<br />
10<br />
Murphy, Ackermann & H<strong>and</strong>graaf (2010) DRAFT v0.6 <strong>Measuring</strong> SVO<br />
Table 6: A cross tabulation showing the frequency of categorization from test-retest for the Ring Measure.<br />
9<br />
Session 1<br />
Session 3<br />
Prosocial Individualistic Competitive Unclassifiable<br />
Prosocial 18 3 0 0<br />
Individualistic 8 12 1 0<br />
Competitive 0 1 0 0<br />
Unclassifiable 0 0 0 0<br />
5.3.3 Slider Measure test-retest reliability<br />
Table 7: A cross tabulation showing the frequency of categorization by test-retest for the Primary SVO<br />
Slider items.<br />
Session 2<br />
Session 3<br />
Prosocial Individualistic Competitive Unclassifiable<br />
Prosocial 25 1 0 0<br />
Individualistic 3 15 0 0<br />
Competitive 0 1 1 0<br />
Unclassifiable 0 0 0 0<br />
Forty-six participants completed both sessions 2 <strong>and</strong> 3. Of those, 41 were categorized in the same<br />
SVO category each time by the Slider Measure, yielding a consistency of 89%. Further the correlation<br />
between the resulting angles from the test-retest SVO Slider Measure was r = 0.915.<br />
5.4 Convergent validity<br />
5.4.1 Categorical agreement<br />
Across research sessions, the Triple-Dominance Measure <strong>and</strong> the Ring Measure categorized the<br />
same subjects into the same SVO category 62% of the time. The Triple-Dominance Measure <strong>and</strong> the<br />
Slider Measure categorized the same subjects in the same SVO category 70% of the time. And the Ring<br />
Measure <strong>and</strong> the Slider Measure categorized the same subjects in the same SVO category 75% of the<br />
time.<br />
36
5<br />
10<br />
15<br />
20<br />
Murphy, Ackermann & H<strong>and</strong>graaf (2010) DRAFT v0.6 <strong>Measuring</strong> SVO<br />
5.4.2 Correlational agreement<br />
The Ring Measure <strong>and</strong> Slider Measure both produce continuous results (in the form of angles<br />
within the self/other allocation plane), <strong>and</strong> these results are amenable to computing correlation co-<br />
efficients across different measures. Table 8 displays these correlation coefficients, showing both the<br />
test-retest reliability of the Ring Measure (r = 0.599) <strong>and</strong> Slider Measure (r = 0.915), as well as the<br />
correlations between SVO angles across the different measurement methods.<br />
Table 8: The correlation coefficients between the different sessions <strong>and</strong> methods. These values show<br />
both the test-retest reliabilities, as well as the cross method correlations (in grayed boxes) which address<br />
convergent validity.<br />
RM-1 RM-3 SM-2 SM-3<br />
RM-1 1 - - -<br />
RM-3 0.599 1 - -<br />
SM-2 0.724 0.536 1 -<br />
SM-3 0.680 0.641 0.915 1<br />
The results show that the Slider Measure correlates as well with the Ring Measure as the Ring<br />
Measure does with itself across retests. This is strong evidence that the methods are measuring the<br />
same thing <strong>and</strong> further it demonstrates that the Slider Measure is more reliable than the Ring Measure<br />
(the mean correlation between the different methods is r = 0.649 whereas the test-retest correlation<br />
for the Ring Measure is only r = .599).<br />
5.5 Additional results<br />
As noted before, one advantage of the Slider Measure is its resolution as it yields a ratio level mea-<br />
surement. Previous measures of SVO often reduced output to categorical levels, which can be a limita-<br />
tion. Retaining the ratio level variable, the distribution of SVO angles can be plotted <strong>and</strong> the density of<br />
different orientations can be estimated. Figure 11 shows this distribution. A lowess (Clevel<strong>and</strong> & De-<br />
vlin 1988) smoothed kernel density estimation was made of the distribution of SVO scores to provide<br />
some general idea of its shape. We find a multimodal distribution of SVO types in our sample. The<br />
largest clustering is in the prosocial region shifted slightly to the left (toward individualistic). The sec-<br />
ond clustering is in the individualistic region <strong>and</strong> is shifted to the right (toward prosocial). Within this<br />
37
5<br />
10<br />
15<br />
Murphy, Ackermann & H<strong>and</strong>graaf (2010) DRAFT v0.6 <strong>Measuring</strong> SVO<br />
Figure 11: The distribution of SVO scores from the Slider Measure as represented by angles. The dark<br />
line is a smoothed kernel density estimation.<br />
region is the most common SVO score of 7.82 ◦ which corresponds to perfectly individualistic choices.<br />
The density function trails off to the left, denoting only a few competitive types.<br />
The transitivity of responses can also be assessed with the Slider Measure. We found that 97% of<br />
our subjects produced completely transitive sets of social preferences. This finding st<strong>and</strong>s in stark<br />
contrast to the consistency results from the Ring Measure where only 53% of the same subjects pro-<br />
duced internally consistent results. The cause of this difference is likely the result of the Ring Mea-<br />
sure’s blanket approach to measuring social preferences which introduces a substantial amount of<br />
noise.<br />
The full ranking of people’s social preferences can be obtained from evaluating the primary items<br />
of the Slider Measure. Across sessions the majority of people’s first preference was consistent with a<br />
prosocial orientation (see Table 9 for the full rankings). Considering these people who most preferred<br />
to be prosocial, about 66% of them had individualistic as their next preference, whereas the remaining<br />
34% preferred altruism. The least preferred SVO from the Slider Measure was competitive, with 52%<br />
of subjects revealing this as their least favorite orientation. Altruism was also commonly the least<br />
preferred option, being ranked last by 42% of the participants.<br />
38
5<br />
10<br />
15<br />
20<br />
Murphy, Ackermann & H<strong>and</strong>graaf (2010) DRAFT v0.6 <strong>Measuring</strong> SVO<br />
Table 9: Full rank orderings of social preferences from the SVO Slider Measure across sessions<br />
First preference Second preference Third preference Least prefered Percent<br />
Prosocial Individualistic Altruistic Competitive 28%<br />
Prosocial Altruistic Individualistic Competitive 25%<br />
Prosocial Individualistic Competitive Altruistic 13%<br />
Individualistic Prosocial Competitive Altruistic 24%<br />
Individualistic Competitive Prosocial Altruistic 5%<br />
Individualistic Prosocial Altruistic Competitive 2%<br />
Competitive Individualistic Prosocial Altruistic 3%<br />
5.6 Separating joint maximization <strong>and</strong> inequality aversion<br />
The Secondary items from the Slider Measure are designed to differentiate between two different<br />
prosocial motivations: joint maximization <strong>and</strong> inequality aversion. As prosocial behavior can arise<br />
from both of these underlying motivations, we demonstrate here how to disentangle these motiva-<br />
tions using the Secondary Slider items.<br />
In order to identify prosocial DM’s underlying motivations, two mean difference scores were com-<br />
puted for each subject. The first difference score was defined as the average distance each of the<br />
subject’s allocations was from the allocation that minimized the difference between the payoff for the<br />
self <strong>and</strong> the other. Distance here was defined geometrically in the self/other plane. If a DM always<br />
chose allocations that were on the diagonal line (see Figure 9), her mean difference score would be 0,<br />
indicating perfect consistency with inequality aversion. A second difference score was computed for<br />
each participant that was defined as the mean distance between her selected allocation on an item<br />
<strong>and</strong> the particular allocation that maximized joint payoff for that item. If the mean difference for this<br />
second index was zero, it indicates that a DM’s allocation choices are perfectly consistent with joint<br />
maximization. These indexes are by definition negatively correlated given our set of nine items, as the<br />
more inequality averse a DM was, the less joint maximizing she was, <strong>and</strong> vice versa. Based on these<br />
goodness-of-fit scores, DMs could be categorized as inequality averse or joint gain maximizing.<br />
Results from session 2 show that for the 34 people who were prosocial (according to the primary<br />
slider items from session 2), 21 (62%) were joint maximizing whereas 12 (35%) were inequality averse;<br />
one participant left some items blank <strong>and</strong> was excluded from this analysis. The results were similar for<br />
39
5<br />
10<br />
15<br />
20<br />
25<br />
Murphy, Ackermann & H<strong>and</strong>graaf (2010) DRAFT v0.6 <strong>Measuring</strong> SVO<br />
session 3 in which of the 36 people who were categorized as prosocial (again according to the primary<br />
slider items from that session), 20 (56%) were joint maximizing <strong>and</strong> 16 (44%) were inequality averse.<br />
Between sessions, we find that 76% of subjects had the same categorization.<br />
Although it is beyond the scope of this paper, the data from the SVO Slider Measure (both primary<br />
<strong>and</strong> secondary items) are amendable to sophisticated modeling. Several models of other regarding<br />
preferences have been developed in behavioral economics (see, for instance Fehr & Schmidt 1999,<br />
Bolton & Ockenfels 2000, Andreoni & Miller 2002, Charness & Rabin 2002, Engelmann & Strobel 2004)<br />
that address issues of equity, inequality aversion, fairness, <strong>and</strong> reciprocity. The psychological litera-<br />
ture related to the same issues has developed in parallel but largely done so independently. Perhaps<br />
one reason for this schism is the lack of a common measurement methods between the two fields.<br />
The SVO Slider Measure could act as a bridge to connect these two related but estranged research<br />
streams.<br />
6 Discussion<br />
The arc of scientific knowledge is bounded by our ability to measure things. This paper is about<br />
measuring SVO, a fundamental concept in social decision making. We have provided an overview<br />
of different ways social preferences have been measured to date across a variety of disciplines, high-<br />
lighted limitations with existent measures, <strong>and</strong> reported on the development of a new measure of<br />
individuals’ social preferences. This new measure is efficient, easy to implement, has very good psy-<br />
chometric properties (established convergent validity <strong>and</strong> high test-retest reliability), yields a score at<br />
the ratio level, <strong>and</strong> facilitates comparison to previous findings. The advent of a high resolution mea-<br />
sure of SVO opens opportunities for different research streams to use social preferences as a depen-<br />
dent variable. These types of studies could address questions regarding how context, information,<br />
experience, <strong>and</strong> framing affect peoples’ propensities to make tradeoffs in resources between them-<br />
selves <strong>and</strong> others. These lines of research could also answer larger questions like: when is Homo<br />
Economics a generally good approximation of human behavior <strong>and</strong> when is it insufficient or even<br />
grossly inaccurate.<br />
<strong>Social</strong> preferences are of utmost importance in underst<strong>and</strong>ing how interrelated DMs allocate scarce<br />
40
5<br />
10<br />
Murphy, Ackermann & H<strong>and</strong>graaf (2010) DRAFT v0.6 <strong>Measuring</strong> SVO<br />
resources among themselves <strong>and</strong> others. The postulate of narrow self interest is a point conjecture,<br />
namely that DMs have exactly zero interest in the outcomes of other people. Although this is a useful<br />
baseline assumption in that it facilitates tractable models with precise predictions, <strong>and</strong> in many cases<br />
works well as an “as if” model, there are numerous examples where it fails to account for DMs’ be-<br />
havior. Real people’s preferences are often much richer, more nuanced, <strong>and</strong> complex than narrow self<br />
interest. Moreover it is worth recognizing that the point conjecture is inadequate not only to account<br />
for different people having different social preferences, but the malleability of these preferences in<br />
different situations.<br />
The notion that a DM’s utility is not exclusively a function of his own material well being, but<br />
is also affected by the well being of others (No man is an isl<strong>and</strong>. . . ) is not a new idea. Edgeworth<br />
(1881) explicitly postulated this idea <strong>and</strong> anticipated a wide range of social orientations. The modern<br />
challenge is quantifying Edgeworth’s fraction by building reliable <strong>and</strong> efficient methods to measure<br />
this degree of entanglement in DM’s utilities <strong>and</strong> thus exp<strong>and</strong>ing theories of social decision making<br />
that can accommodate the richness <strong>and</strong> dynamics of social preferences.<br />
41
5<br />
10<br />
15<br />
20<br />
25<br />
Murphy, Ackermann & H<strong>and</strong>graaf (2010) DRAFT v0.6 <strong>Measuring</strong> SVO<br />
References<br />
Anderson, N. (1968). A simple model for information integration. In R. Abelson, E. Aronson, W. McGuire, T. New-<br />
comb, M. Rosenberg, & P. Tannenbaum (Eds.) Theories of Cognitive Consistency: A Sourcebook. Chicago:<br />
R<strong>and</strong> McNally.<br />
Anderson, N. (1970). Functional measurement <strong>and</strong> psychophysical judgment. Psychological Review, 77(3),<br />
153–170.<br />
Andreoni, J., & Miller, J. (2002). Giving according to garp: An experimental test of the consistency of preferences<br />
for altruism. Econometrica, 70(2), 737–753.<br />
Au, W., & Kwong, J. (2004). Measurements <strong>and</strong> effects of social-value orientation in social dilemmas: A review.<br />
In R. Suleiman, D. Budescu, I. Fischer, & D. Messick (Eds.) Contemporary Psychological Research on <strong>Social</strong><br />
Dilemmas, (pp. 71–98). New York: Cambridge University Press.<br />
Balliet, D., Parks, C., & Joireman, J. (2009). <strong>Social</strong> value orientation <strong>and</strong> cooperation in social dilemmas: A<br />
meta-analysis. Group Processes & Intergroup Relations, 12(4), 533–547.<br />
Batson, C. (1995). Prosocial motivation: Why do we help others? In A. Tesser (Ed.) Advanced <strong>Social</strong> Psychology,<br />
(pp. 333–381). Boston: McGraw-Hill.<br />
Bogaert, S., Boone, C., & Declerck, C. (2008). <strong>Social</strong> value orientation <strong>and</strong> cooperation in social dilemmas: A<br />
review <strong>and</strong> conceptual model. British Journal of <strong>Social</strong> Psychology, 47(3), 453–480.<br />
Bolton, G., & Ockenfels, A. (2000). ERC: A theory of equity, reciprocity, <strong>and</strong> competition. The American Economic<br />
Review, 90(1), 166–193.<br />
Charness, G., & Rabin, M. (2002). Underst<strong>and</strong>ing social preferences with simple tests. Quarterly Journal of<br />
Economics, 117(3), 817–869.<br />
Clevel<strong>and</strong>, W. S., & Devlin, S. J. (1988). Locally weighted regression: An approach to regression analysis by local<br />
fitting. Journal of the American Statistical Association, 83(403), 596–610.<br />
Cornelissen, G., Dewitte, S., & Warlop, L. (2007). <strong>Social</strong> value orientation as a moral intuition: <strong>Decision</strong>-making<br />
in the dictator game. Unpublished paper, available at SSRN: http://ssrn.com/abstract=978469.<br />
Cr<strong>and</strong>all, J. (1975). A scale for social interest. Journal of Individual Psychology, 31(2), 187–195.<br />
de Kwaadsteniet, E., van Dijk, E., Wit, A., & de Cremer, D. (2006). <strong>Social</strong> dilemmas as strong versus weak situa-<br />
tions: <strong>Social</strong> value orientations <strong>and</strong> tacit coordination under resource size uncertainty. Journal of Experi-<br />
mental <strong>Social</strong> Psychology, 42(4), 509–516.<br />
42
5<br />
10<br />
15<br />
20<br />
25<br />
Murphy, Ackermann & H<strong>and</strong>graaf (2010) DRAFT v0.6 <strong>Measuring</strong> SVO<br />
de Waal, F., Leimgruber, K., & Greenberg, A. (2008). Giving is self-rewarding for monkeys. Proceedings of the<br />
National Academy of Sciences, 105(36), 13685–13689.<br />
Declerck, C., & Bogaert, S. (2008). <strong>Social</strong> value orientation: Related to empathy <strong>and</strong> the ability to read the mind<br />
in the eyes. The Journal of <strong>Social</strong> Psychology, 148(6), 711–726.<br />
Dehue, F., McClintock, C., & Liebr<strong>and</strong>, W. (1993). <strong>Social</strong> value related response latencies: Unobtrusive evidence<br />
for individual differences in information processing. European Journal of <strong>Social</strong> Psychology, 23, 273–293.<br />
Deutsch, M. (1960). The effect of motivational orientation upon trust <strong>and</strong> suspicion. Human Relations, 13(2),<br />
123–139.<br />
Edgeworth, F. (1881). Mathematical psychics. (L.S.E. Reprint 1934).<br />
Engelmann, D., & Strobel, M. (2004). Inequality aversion, efficiency, <strong>and</strong> maximin preferences in simple distri-<br />
bution experiments. American Economic Review, 94(4), 857–869.<br />
Fehr, E., & Schmidt, K. (1999). A theory of fairness, competition, <strong>and</strong> cooperation*. Quarterly Journal of Eco-<br />
nomics, 114(3), 817–868.<br />
Griesinger, D., & Livingston, J. (1973). Toward a model of interpersonal motivation in experimental games.<br />
Behavioral Science, 18(3), 173–188.<br />
Harrison, M. (1998). The bioeconomics of altruism <strong>and</strong> rivalry. Doctoral Dissertation, Department of Eco-<br />
nomics, University of Texas at Austin.<br />
Haruno, M., & Frith, C. (2009). Activity in the amygdala elicited by unfair divisions predicts social value orien-<br />
tation. Nature Neuroscience, 13, 160–161.<br />
Henrich, J., Boyd, R., Bowles, S., Camerer, C., Fehr, E., Gintis, H., McElreath, R., Alvard, M., Barr, A., Ensminger,<br />
J., Henrich, N., Hill, K., Gil-White, F., Gurven, M., Marlowe, F., Patton, J., & Tracer, D. (2005). “Economic<br />
man” in cross-cultural perspective: Behavioral experiments in 15 small-scale societies. Behavioral <strong>and</strong><br />
Brain Sciences, 28(06), 795–855.<br />
Higgins, E. (1997). Beyond pleasure <strong>and</strong> pain. American Psychologist, 52, 1280–1300.<br />
Iedema, J., & Poppe, M. (1994a). The effect of self-presentation on social value orientation. The Journal of <strong>Social</strong><br />
Psychology, 134(6), 771–782.<br />
Iedema, J., & Poppe, M. (1994b). Effects of social value orientation on expecting <strong>and</strong> learning others’ orienta-<br />
tions. European Journal of <strong>Social</strong> Psychology, 24, 565–579.<br />
43
5<br />
10<br />
15<br />
20<br />
25<br />
Murphy, Ackermann & H<strong>and</strong>graaf (2010) DRAFT v0.6 <strong>Measuring</strong> SVO<br />
Iedema, J., & Poppe, M. (1995). Perceived consensus of one’s social value orientation in different populations in<br />
public <strong>and</strong> private circumstances. European Journal of <strong>Social</strong> Psychology, 25, 497–507.<br />
Joireman, J., Van Lange, P., & Van Vugt, M. (2004). Who cares about the environmental impact of cars?: Those<br />
with an eye toward the future. Environment <strong>and</strong> Behavior, 36(2), 187–206.<br />
Kahneman, D., & Tversky, A. (1979). Prospect Theory - An analysis of decision under risk. Econometrica, 47(2),<br />
263–292.<br />
Kelley, H., & Thibaut, J. (1978). Interpersonal Relations: A Theory of Interdependence. Wiley, New York.<br />
Knight, G., & Dubro, A. (1984). Cooperative, competitive, <strong>and</strong> individualistic social values - an individualized<br />
regression <strong>and</strong> clustering approach. Journal of Personality <strong>and</strong> <strong>Social</strong> Psychology, 46(1), 98–105.<br />
Knight, G., & Kagan, S. (1977). Development of prosocial <strong>and</strong> competitive bahaviors in anglo-american <strong>and</strong><br />
mexican-american children. Child Development, 48(4), 1385–1394.<br />
Kuhlman, D., Brown, C., & Teta, P. (1992). Judgements of cooperation <strong>and</strong> defection in social dilemmas: The<br />
moderating role of judges’s social orientation. In W. Liebr<strong>and</strong>, D. Messick, & H. Wilke (Eds.) <strong>Social</strong> dilem-<br />
mas: Theoretical issues <strong>and</strong> research findings, (pp. 111–132). Oxford, Engl<strong>and</strong>: Pergamon Press.<br />
Kuhlman, D., Camac, C., & Cunha, D. (1986). Individual differences in social orientation. In H. Wilke, D. Messick,<br />
& C. Rutte (Eds.) Experimental social dilemmas, (pp. 150–176). New York: Verlag Peter Lang.<br />
Kuhlman, D., & Marshello, A. (1975a). Individual-differences in game motivation as moderators of prepro-<br />
grammed strategy effects in prisoner’s dilemma. Journal of Personality <strong>and</strong> <strong>Social</strong> Psychology, 32(5), 922–<br />
931.<br />
Kuhlman, D., & Marshello, A. (1975b). Individual-differences in game motives of own, relative, <strong>and</strong> joint gain.<br />
Journal of Research in Personality, 9(3), 240–251.<br />
Liebr<strong>and</strong>, W. (1984). The effect of social motives, communication <strong>and</strong> group-size on behavior in an n-person<br />
multi-stage mixed-motive game. European Journal of <strong>Social</strong> Psychology, 14(3), 239–264.<br />
Liebr<strong>and</strong>, W., & McClintock, C. (1988). The ring measure of social values: A computerized procedure for as-<br />
sessing individual differences in information processing <strong>and</strong> social value orientation. European Journal of<br />
Personality, 2(3), 217–230.<br />
Liebr<strong>and</strong>, W., & van Run, G. (1985). The effects of social motives on behavior in social dilemmas in two cultures.<br />
Journal of Experimental <strong>Social</strong> Psychology, 21, 86–102.<br />
44
5<br />
10<br />
15<br />
20<br />
25<br />
Murphy, Ackermann & H<strong>and</strong>graaf (2010) DRAFT v0.6 <strong>Measuring</strong> SVO<br />
Luce, R., & Tukey, J. (1964). Simultaneous conjoint measurement: A new type of fundamental measurement.<br />
Journal of Mathematical Psychology, 1(1), 1–27.<br />
MacCrimmon, K., & Messick, D. (1976). A framework for social motives. Behavioral Science, 21(2), 86–100.<br />
MacCrimmon, K., & Toda, M. (1969). The experimental determination of indifference curves. The Review of<br />
Economic Studies, 36(4), 433–451.<br />
McClintock, C., & Allison, S. (1989). <strong>Social</strong> value orientation <strong>and</strong> helping behavior. Journal of Applied <strong>Social</strong><br />
Psychology, 19, 353–362.<br />
McClintock, C., & Liebr<strong>and</strong>, W. (1988). Role of interdependence structure, individual value orientation, <strong>and</strong><br />
another’s strategy in social decision making: A transformational analysis. Journal of Personality <strong>and</strong> <strong>Social</strong><br />
Psychology, 55(3), 396–409.<br />
McClintock, C., & Messick, D. (1965). Non-zero sum games - A conceptional orientation. In Game theory <strong>and</strong><br />
social behavior. Presented during symposium at Western Psychological Association, Honolulu.<br />
McClintock, C., Messick, D., Kuhlman, D., & Campos, F. (1973). Motivational bases of choice in three-choice<br />
decomposed games. Journal of Experimental <strong>Social</strong> Psychology, 9(6), 572–590.<br />
McClintock, C., & Van Avermaet, E. (1982). <strong>Social</strong> values <strong>and</strong> rules of fairness: A theoretical perspective. In<br />
V. Derlega, & J. Grzelak (Eds.) Cooperation <strong>and</strong> Helping Behavior, (pp. 43–71). Academic Press, New York.<br />
Messick, D., & McClintock, C. (1968). Motivational bases of choice in experimental games. Journal of Experi-<br />
mental <strong>Social</strong> Psychology, 4(1), 1–25.<br />
Parks, C. (1994). The predictive ability of social values in resource dilemmas <strong>and</strong> public goods games. Person-<br />
ality <strong>and</strong> <strong>Social</strong> Psychology Bulletin, 20, 431–438.<br />
Platow, M., McClintock, C., & Liebr<strong>and</strong>, W. (1990). Predicting intergroup fairness <strong>and</strong> ingroup bias in the mini-<br />
mal group paradigm. European Journal of <strong>Social</strong> Psychology, 20, 221–239.<br />
Pruitt, D. (1967). Reward structure <strong>and</strong> cooperation: The decomposed prisoners dilemma game. Journal of<br />
Personality <strong>and</strong> <strong>Social</strong> Psychology, 7(1), 21–27.<br />
Radzicki, J. (1976). Technique of conjoint measurement of subjective value of own <strong>and</strong> other’s gains. Polish<br />
Psychological Bulletin, 7(3), 179–186.<br />
Rushton, J., Chrisjohn, R., & Fekken, G. (1981). The altruistic personality <strong>and</strong> the self-report altruism scale.<br />
Personality <strong>and</strong> Individual Differences, 2(4), 293–302.<br />
Saaty, T. (1980). The Analytic Hierarchy Process. New York: McGraw-Hill.<br />
45
5<br />
10<br />
15<br />
20<br />
25<br />
Murphy, Ackermann & H<strong>and</strong>graaf (2010) DRAFT v0.6 <strong>Measuring</strong> SVO<br />
Sawyer, J. (1966). Altruism scale - A measure of co-operative, individualistic, <strong>and</strong> competitive interpersonal<br />
orientation. American Journal of Sociology, 71(4), 407–416.<br />
Schulz, U., & May, T. (1989). The recording of social orientations with ranking <strong>and</strong> pair comparison procedures.<br />
European Journal of <strong>Social</strong> Psychology, 19, 41–59.<br />
Sell, A., Tooby, J., & Cosmides, L. (2009). Formidability <strong>and</strong> the logic of human anger. Proceedings of the National<br />
Academy of Sciences, 106(35), 15073.<br />
Sheldon, K. (1999). Learning the lessons of tit-for-tat: Even competitors can get the message. Journal of Person-<br />
ality <strong>and</strong> <strong>Social</strong> Psychology, 77(6), 1245–1253.<br />
Simonson, I. (1989). Choice based on reasons: The case of attraction <strong>and</strong> compromise effects. Journal of Con-<br />
sumer Research, 16(2), 158–174.<br />
Sonnemans, J., van Dijk, F., & Winden, F. (2006). On the dynamics of social ties structures in groups. Journal of<br />
Economic Psychology, 27(2), 187–204.<br />
Stevens, S. (1946). On the theory of scales of measurement. Science, 103(2684), 677–680.<br />
Stevens, S. (1950). Mathematics, measurement, <strong>and</strong> psychophysics. In S. Stevens (Ed.) H<strong>and</strong>book of Experi-<br />
mental Psychology, (pp. 1–49). Wiley, New York.<br />
Stouten, J., De Cremer, D., & Van Dijk, E. (2005). All is well that ends well, at least for proselfs: Emotional reac-<br />
tions to equality violation as a function of social value orientation. European Journal of <strong>Social</strong> Psychology,<br />
35(6), 767–783.<br />
Thurstone, L. (1931). The indifference function. Journal of <strong>Social</strong> Psychology, 2, 139–167.<br />
Tricomi, E., Rangel, A., Camerer, C., & O’Doherty, J. (2010). Neural evidence for inequality-averse social prefer-<br />
ences. Nature, 463(7284), 1089–1091.<br />
Utz, S. (2004). Self-activation is a two-edged sword: The effects of “I” primes on cooperation. Journal of Exper-<br />
imental <strong>Social</strong> Psychology, 40(6), 769–776.<br />
Utz, S., Ouwerkerk, J., & Van Lange, P. (2004). What is smart in a social dilemma? Differential effects of priming<br />
competence on cooperation. European Journal of <strong>Social</strong> Psychology, 34(3), 317–332.<br />
van den Bos, W., van Dijk, E., Westenberg, M., Rombouts, S., & Crone, E. (2009). What motivates repayment?<br />
Neural correlates of reciprocity in the trust game. <strong>Social</strong> Cognitive <strong>and</strong> Affective Neuroscience, 4(3), 294–<br />
304.<br />
46
5<br />
10<br />
15<br />
20<br />
Murphy, Ackermann & H<strong>and</strong>graaf (2010) DRAFT v0.6 <strong>Measuring</strong> SVO<br />
van Dijk, E., De Cremer, D., & H<strong>and</strong>graaf, M. (2004). <strong>Social</strong> value orientations <strong>and</strong> the strategic use of fairness<br />
in ultimatum bargaining. Journal of Experimental <strong>Social</strong> Psychology, 40(6), 697–707.<br />
Van Lange, P. (1999). The pursuit of joint outcomes <strong>and</strong> equality in outcomes: An integrative model of social<br />
value orientation. Journal of Personality <strong>and</strong> <strong>Social</strong> Psychology, 77(2), 337–349.<br />
Van Lange, P., Bekkers, R., Schuyt, T., & Van Vugt, M. (2007). From games to giving: <strong>Social</strong> value orientation<br />
predicts donations to noble causes. Basic <strong>and</strong> Applied <strong>Social</strong> Psychology, 29(4), 375–384.<br />
Van Lange, P., De Cremer, D., van Dijk, E., & Van Vugt, M. (2007). Self-interest <strong>and</strong> beyond: Basic principles of<br />
social interaction. In A. Kruglanski, & E. Higgins (Eds.) <strong>Social</strong> Psychology: H<strong>and</strong>book of Basic Principles,<br />
(pp. 540–561). New York: Guilford Press.<br />
Van Lange, P., & Kuhlman, D. M. (1994). <strong>Social</strong> value orientations <strong>and</strong> impressions of partner’s honesty <strong>and</strong><br />
intelligence: A test of the might versus morality effect. Journal of Personality <strong>and</strong> <strong>Social</strong> Psychology, 67,<br />
126–126.<br />
Van Lange, P., & Liebr<strong>and</strong>, W. (1991). <strong>Social</strong> value orientation <strong>and</strong> intelligence: A test of the goal prescribes<br />
rationality principle. European Journal of <strong>Social</strong> Psychology, 21, 273–292.<br />
Van Lange, P., Otten, W., De Bruin, E., & Joireman, J. (1997). Development of prosocial, individualistic, <strong>and</strong><br />
competitive orientations: Theory <strong>and</strong> preliminary evidence. Journal of Personality <strong>and</strong> <strong>Social</strong> Psychology,<br />
73(4), 733–746.<br />
van Prooijen, J., De Cremer, D., van Beest, I., Ståhl, T., van Dijke, M., & Van Lange, P. (2008). The egocentric nature<br />
of procedural justice: <strong>Social</strong> value orientation as moderator of reactions to decision-making procedures.<br />
Journal of Experimental <strong>Social</strong> Psychology, 44(5), 1303–1315.<br />
Wyer, R. (1969). Prediction of behavior in 2-person games. Journal of Personality <strong>and</strong> <strong>Social</strong> Psychology, 13(3),<br />
222–238.<br />
Wyer, R. (1971). Effects of outcome matrix <strong>and</strong> partner’s behavior in two-person games. Journal of Experimental<br />
<strong>Social</strong> Psychology, 7, 190–210.<br />
47
Murphy, Ackermann & H<strong>and</strong>graaf (2010) DRAFT v0.6 <strong>Measuring</strong> SVO<br />
Appendix<br />
a<br />
1<br />
2<br />
3<br />
4<br />
5<br />
6<br />
Figure 12: Paper based SVO Slider Measure, primary items<br />
In the following decision task, you are given the opportunity to distribute money between yourself <strong>and</strong> some other<br />
person whom you will remain anonymous. For each of the following 6 questions, please indicate the distribution you<br />
prefer most by marking the respective position along the midline. You can only make one mark for each question.<br />
There are no right or wrong answers, just place your mark at the position of your most preferred distribution. After<br />
you have made your decision, write the resulting distribution of money on the spaces on the right.<br />
In the example below, a person has chosen to distribute money so that he/she receives 50 dollars, while the<br />
anonymous other person receives 40 dollars.<br />
You receive<br />
30<br />
50<br />
100<br />
50<br />
100<br />
50<br />
100<br />
85<br />
85<br />
85<br />
85<br />
100<br />
50<br />
54 59 63 68 72 76 81 85<br />
98<br />
56 63 69 75 81 88 94 100<br />
94<br />
54 59 63 68 72 76 81 85<br />
89<br />
88 81 75 69 63 56 50<br />
79 68 58 47 36 26 15<br />
87 89 91 93 94 96 98 100<br />
81<br />
76 72 68 63 59 54 50<br />
85 85 85 85 85 85 85 85<br />
76<br />
68 59 50 41 33 24 15<br />
98 96 94 93 91 89 87 85<br />
46<br />
Instructions<br />
Example:<br />
35 40 45 50 55 60 65 70<br />
Other receives 80 70 60 50 40 30 20 10 0<br />
Other 40<br />
You receive<br />
Other receives<br />
You receive<br />
Other receives<br />
You receive<br />
Other receives<br />
You receive<br />
Other receives<br />
You receive<br />
Other receives<br />
You receive<br />
Other receives<br />
96 94 93 91 89 87 85<br />
41 37 33 28 24 19 15<br />
48<br />
You<br />
50<br />
You<br />
Other<br />
You<br />
Other<br />
You<br />
Other<br />
You<br />
Other<br />
You<br />
Other<br />
You<br />
Other
Murphy, Ackermann & H<strong>and</strong>graaf (2010) DRAFT v0.6 <strong>Measuring</strong> SVO<br />
Figure 13: Paper based SVO Slider Measure, secondary items<br />
7<br />
8<br />
9<br />
10<br />
11<br />
12<br />
13<br />
14<br />
15<br />
You receive<br />
Other receives<br />
You receive<br />
Other receives<br />
You receive<br />
Other receives<br />
You receive<br />
Other receives<br />
You receive<br />
Other receives<br />
You receive<br />
Other receives<br />
You receive<br />
Other receives<br />
You receive<br />
Other receives<br />
You receive<br />
Other receives<br />
100<br />
100<br />
50<br />
100<br />
94<br />
56 63 69 75 81 88 94 100<br />
99<br />
88<br />
81<br />
70 74 78 81 85 89 93 96<br />
70<br />
100<br />
50<br />
100<br />
100<br />
96<br />
75<br />
69<br />
98 96 95 94 93 91 90<br />
63<br />
56<br />
50<br />
100<br />
74 78 81 85 89 93 96 100<br />
96<br />
56 63 69 75 81 88 94 100<br />
94<br />
96<br />
93<br />
93 89 85 81 78 74 70<br />
88 81 75 69 63 56 50<br />
93<br />
89<br />
50 56 63 69 75 81 88 94<br />
90<br />
100<br />
100<br />
89<br />
90 91 93 94 95 96 98 99<br />
85<br />
85<br />
81<br />
81<br />
78<br />
78<br />
74<br />
74<br />
70<br />
100<br />
91 93 94 95 96 98 99 100<br />
99<br />
99<br />
98 96 95 94 93 91 90<br />
98<br />
96<br />
70 74 78 81 85 89 93 96<br />
90<br />
100<br />
95<br />
94<br />
93<br />
91<br />
90<br />
100<br />
70<br />
100<br />
91 93 94 95 96 98 99 100<br />
94<br />
88 81 75 69 63 56 50<br />
49<br />
You<br />
Other<br />
You<br />
Other<br />
You<br />
Other<br />
You<br />
Other<br />
You<br />
Other<br />
You<br />
Other<br />
You<br />
Other<br />
You<br />
Other<br />
You<br />
Other
Murphy, Ackermann & H<strong>and</strong>graaf (2010) DRAFT v0.6 <strong>Measuring</strong> SVO<br />
Table 10: The st<strong>and</strong>ardized items from the 24-item Ring Measure. Notice how the values have been<br />
transformed to be positive <strong>and</strong> range between 0 <strong>and</strong> 100.<br />
Option 1 Option 2<br />
Item Self Other Self Other<br />
1 50 100 37 98<br />
2 37 98 25 93<br />
3 25 93 15 85<br />
4 15 85 7 75<br />
5 7 75 2 63<br />
6 2 63 0 50<br />
7 0 50 2 37<br />
8 2 37 7 25<br />
9 7 25 15 15<br />
10 15 15 25 7<br />
11 25 7 37 2<br />
12 37 2 50 0<br />
13 50 0 63 2<br />
14 63 2 75 7<br />
15 75 7 85 15<br />
16 85 15 93 25<br />
17 93 25 98 37<br />
18 98 37 100 50<br />
19 100 50 98 63<br />
20 98 63 93 75<br />
21 93 75 85 85<br />
22 85 85 75 93<br />
23 75 93 63 98<br />
24 63 98 50 100<br />
50
Murphy, Ackermann & H<strong>and</strong>graaf (2010) DRAFT v0.6 <strong>Measuring</strong> SVO<br />
Figure 14: SVO measurement overview. The diagram reflects a subjective estimation of influences<br />
certain measurement techniques had on the development of subsequent ones. Arrows in the diagram<br />
mean that there are respective citations. When two papers are not connected to each other in this<br />
figure, it does not necessarily mean that there is no relation between them, it simply means that there<br />
is no citation.<br />
1965<br />
1970<br />
1980<br />
1990<br />
1995<br />
Utility & Conjoint Tradition Decomposed Games Tradition<br />
Sawyer<br />
(1966)<br />
Altruism Scale<br />
Griesinger & Livingston<br />
(1973)<br />
Geometric Model<br />
Radzicki<br />
(1976)<br />
Conjoint Measurement<br />
Wyer<br />
(1969)<br />
Utility Measurement<br />
Knight & Dubro<br />
(1984)<br />
Regression & Clustering<br />
Schulz & May<br />
(1989)<br />
Sphere Measure<br />
Iedema & Poppe<br />
(1994)<br />
Rank Correlation Procedure<br />
51<br />
Messick & McClintock<br />
(1968)<br />
Decomposed Games<br />
Liebr<strong>and</strong><br />
(1984)<br />
Ring Measure<br />
Kuhlman & Marshello<br />
(1975)<br />
DG Procedure<br />
VanLange & Kuhlman<br />
(1994)<br />
9 Item Triple Dominance Scale<br />
Pruitt<br />
(1967)<br />
Decomposed Games<br />
McClintock et al.<br />
(1973)<br />
Three option DG<br />
Knight & Kagan<br />
(1977)<br />
<strong>Social</strong> Behavior Scale<br />
Kuhlman et al.<br />
(1992)<br />
DG Procedure
Murphy, Ackermann & H<strong>and</strong>graaf (2010) DRAFT v0.6 <strong>Measuring</strong> SVO<br />
Table 11: SVO Item endpoints <strong>and</strong> subsequent slopes that define each of the Slider Measure items.<br />
Option 1 Option 2 Descriptive information<br />
Item Self Other Self Other Slope Equation<br />
1 50 100 85 85 -0.43 y = − 3 850<br />
7 · x + 7<br />
2 50 100 100 50 -1.00 y = −1 · x + 150<br />
3 50 100 85 15 -2.43 y = − 17<br />
4 85 85 100 50 -2.33<br />
1550<br />
7 · x + 7<br />
y = − 7 850<br />
3 · x + 3<br />
5 85 85 85 15 Undefined y ∈ [15,85], x = 85<br />
6 100 50 85 15 2.33 y = 7 550<br />
3 · x + 3<br />
7 100 50 70 100 -1.67 y = − 5 650<br />
3 · x + 3<br />
8 90 100 100 90 -1.00 y = −1 · x + 190<br />
9 100 70 50 100 -0.60 y = − 3<br />
5 · x + 130<br />
10 100 70 90 100 -3.00 y = −3 · x + 370<br />
11 70 100 100 70 -1.00 y = −1 · x + 170<br />
12 50 100 100 50 -1.00 y = −1 · x + 150<br />
13 100 90 70 100 -0.33<br />
3<br />
y = − 1<br />
14 100 90 70 100 -0.33<br />
370<br />
3 · x + 3<br />
y = − 1 370<br />
3 · x + 3<br />
15 90 100 100 50 -5.00 y = −5 · x + 550<br />
52