Myanmar National Environmental Performance Assessment Report
Myanmar National Environmental Performance Assessment Report
Myanmar National Environmental Performance Assessment Report

Create successful ePaper yourself
Turn your PDF publications into a flip-book with our unique Google optimized e-Paper software.
Foreword<br />
Like its neighbors in the Greater Mekong Subregion (GMS), <strong>Myanmar</strong> has been trying to reconcile the demands<br />
of economic growth with the integrity of its physical environment. Despite its great natural resources and<br />
progress made at reversing some decline in forest cover, there remain many challenges for the country’s<br />
environmental stability, from soil degradation to water quality. This environmental performance assessment<br />
(EPA) encompasses seven key environmental concerns: forest resources, biodiversity, land degradation,<br />
management of water resources, waste management, air pollution from mobile sources, and climate change.<br />
The prime purpose of the second Strategic <strong>Environmental</strong> Framework (SEF II), initiated in 2003, is to promote<br />
sustainable development in the GMS through the creation of a national and subregional environmental<br />
performance assessment system and the building of capacity to implement such a system. Supported by a<br />
detailed and transparent database, the EPA report draws a picture of principal environmental trends, assesses<br />
the degree of success in achieving specific targets, and makes key recommendations. In this way, EPA assists<br />
the process of policy adjustment and becomes a tool for public accountability, as well as a device for the wider<br />
GMS to implement on a subregional picture. This national EPA was prepared under the guidance of a national<br />
coordination committee.<br />
Like all assessments of performance, assessment of environmental performance demands a retrospective<br />
look at what has happened, not what might happen in the future. Here, the present EPA draws on the “P-S-R”<br />
model pioneered by Organization for Economic Cooperation and Development (OECD). In the model, indicators<br />
are chosen to capture the state of the concern being studied, the underlying pressures, and the responses, to<br />
counter the pressures and improve the state. The report is vital in highlighting gaps and weaknesses in current<br />
policy, by illustrating <strong>Myanmar</strong>’s current record, and then showing ways forward. The EPA report is vital not<br />
just as a national marker, but also as a tool for the whole GMS to incorporate.<br />
<strong>Myanmar</strong> was able to carry out SEF II with guidance of the Asian Development Bank (ADB) and United Nations<br />
Environment Programme (UNEP) teams.<br />
The report is written in four parts. After an introduction in Part I, Part II is an assessment of performance<br />
under principal environmental concerns. Part III of the report deals with the factors that affect performance.<br />
Part IV draws conclusions and gives recommendations. As well as in national application, this report will also<br />
be of great use for future planning and improvement of environmental management in <strong>Myanmar</strong>.<br />
Dr. San Win<br />
<strong>National</strong> Commission for <strong>Environmental</strong> Affairs<br />
Union of <strong>Myanmar</strong><br />
i
Acknowledgment<br />
The completion of the <strong>National</strong> <strong>Environmental</strong> <strong>Performance</strong> <strong>Assessment</strong> (EPA) <strong>Report</strong> for <strong>Myanmar</strong> would not<br />
have been possible without the valuable inputs and assistance of many individuals. A core team of international<br />
and national consultants prepared the initial and final draft of the report under the aegis of the <strong>National</strong><br />
Commission for <strong>Environmental</strong> Affairs (NCEA). Daw Yin Yin Lay, NCEA Joint Secretary and Daw Htwe Nyo<br />
Nyo, NCEA Deputy Director, served as the <strong>National</strong> Focal Point and <strong>National</strong> Coordinator, respectively, for the<br />
project. We wish to thank international consultants Ivan Ruzicka, Kumar Mohit, and Mike Comeau and national<br />
consultants Win Myo Thu and Maung Maung Than for their very significant work on the report.<br />
Acknowledgement is also given to the many people and institutions that participated in the various consultations<br />
and workshops organized during the preparation of the report and provided feedback. This includes an EPA<br />
technical review team consisting of representatives from NCEA, Ministry of Energy, Ministry of Transport,<br />
Yangon City Development Committee, Ministry of Agriculture and Irrigation, and Ministry of Health.<br />
The project was made possible through financial and technical support from the Asian Development Bank (ADB),<br />
the Global Environment Facility (GEF), the United Nations Environment Programme (UNEP), Institute for Global<br />
<strong>Environmental</strong> Studies (IGES) of Japan, and the <strong>National</strong> Institute for <strong>Environmental</strong> Strategies (NIES) of Japan.<br />
A note of thanks is given to Masami Tsuji and Herath Gutanilake, both ADB staffs, who provided valuable<br />
insight and support throughout the process of preparing this report. Finally, kudos to the team from UNEP<br />
who ably coordinated the management of the entire project on Strategic <strong>Environmental</strong> Framework for the<br />
Greater Mekong Subregion (SEF II): Yuwaree In-na and Tin Aung Moe.Acknowledgment<br />
The completion of the <strong>National</strong> <strong>Environmental</strong> <strong>Performance</strong> <strong>Assessment</strong> (EPA) <strong>Report</strong> for <strong>Myanmar</strong> would not<br />
have been possible without the valuable inputs and assistance of many individuals. A core team of international<br />
and national consultants prepared the initial and final draft of the report under the aegis of the <strong>National</strong><br />
Commission for <strong>Environmental</strong> Affairs (NCEA). Daw Yin Yin Lay, NCEA Joint Secretary and Daw Htwe Nyo Nyo,<br />
NCEA Deputy Director, served as the <strong>National</strong> Focal Point and <strong>National</strong> Coordinator, respectively, for the project.<br />
We wish to thank international consultants Ivan Ruzicka, Kumar Mohit, and Mike Comeau and national<br />
consultants Win Myo Thu and Maung Maung Than for their very significant work on the report.<br />
Acknowledgement is also given to the many people and institutions that participated in the various consultations<br />
and workshops organized during the preparation of the report and provided feedback. This includes an EPA<br />
technical review team consisting of representatives from NCEA, Ministry of Energy, Ministry of Transport,<br />
Yangon City Development Committee, Ministry of Agriculture and Irrigation, and Ministry of Health.<br />
The project was made possible through financial and technical support from the Asian Development Bank<br />
(ADB), the Global Environment Facility (GEF), the United Nations Environment Programme (UNEP), Institute<br />
for Global <strong>Environmental</strong> Studies (IGES) of Japan, and the <strong>National</strong> Institute for <strong>Environmental</strong> Strategies<br />
(NIES) of Japan. A note of thanks is given to Masami Tsuji and Herath Gutanilake, both ADB staffs, who<br />
provided valuable insight and support throughout the process of preparing this report. Finally, kudos to the<br />
team from UNEP who ably coordinated the management of the entire project on Strategic <strong>Environmental</strong><br />
Framework for the Greater Mekong Subregion (SEF II): Yuwaree In-na and Tin Aung Moe.<br />
Regional Director and Representatives<br />
United Nations Environment Programme for Asia and the Pacific
Executive Summary<br />
Like its Greater Mekong Subregion neighbors, <strong>Myanmar</strong><br />
has been trying to reconcile the demands of<br />
economic growth with the integrity of its physical<br />
environment and the long-term health of its citizens.<br />
This <strong>Environmental</strong> <strong>Performance</strong> <strong>Assessment</strong> (EPA)<br />
report evaluates the degree of success that national<br />
stakeholders have had in achieving this objective, expressed<br />
in a number of different ways in official policy<br />
documents. The assessment is confined to seven<br />
key environmental concerns, viz., forest resources,<br />
biodiversity, land degradation, management of water<br />
resources, waste management, air pollution from<br />
mobile sources and climate change. The assessment<br />
uses a structure of performance indicators and is<br />
supported by detailed statistical information.<br />
Reinforced by policy and institutional support,<br />
progress has been made towards safeguarding the<br />
forest resources despite evidence of increased pressure<br />
on them during the last three decades. Following<br />
a period of rapid loss between 1975 and 1995,<br />
the forest cover stabilized around 51 per cent at the<br />
turn of the last decade. The expansion of the Permanent<br />
Forest Estate is a strong positive feature. It is<br />
too early to say what the effect of recent<br />
re-orientation of forest management towards<br />
community management and greater attention to<br />
reducing fuelwood consumption has been.<br />
<strong>Myanmar</strong>’s exceptionally rich biodiversity could not<br />
escape the effect of the pressure on habitats during<br />
the last two decades, in particular the rapid loss<br />
of natural forest in the 1980s (and its continuation to<br />
this day), and loss of mangroves. The authorities’<br />
response has been to expand the protected area<br />
system to about 6.5 per cent of the total land area<br />
by 2004.<br />
Although the country is well endowed with land<br />
suitable for agriculture, it is not immune to different<br />
forms of land degradation. Soil erosion is serious in<br />
the uplands on about 10 per cent of the country’s<br />
cultivated areas. The authorities’ land rehabilitation<br />
schemes have not kept pace with new cultivation<br />
by the upland farmers, the trend sustained by high<br />
rates of population growth.<br />
<strong>Myanmar</strong> is perceived as a low water stress country.<br />
Nonetheless, the dominant role of rice in the cropping<br />
systems and several other factors has made<br />
irrigation a priority concern. The volume of irrigation<br />
water storage capacity has increased 27 times since<br />
1988. Given the continued policy and strategic preference<br />
for more paddies, the pressure on supplying<br />
more water for irrigated farming is set to remain<br />
high in the foreseeable future. Sustained funding of<br />
the irrigation water storage capacity and irrigation<br />
management has made it possible to improve the<br />
percentage of total lands effectively irrigated.<br />
The country has achieved substantial progress in<br />
providing its population with safe drinking water and<br />
<strong>Myanmar</strong> scores well in comparison to other GMS<br />
countries. In rural areas, access increased from 50%<br />
in 1995 to 74% in 2003. In urban areas the increase<br />
was from 78% in 1995 to 92% in 2003.<br />
Solid waste management in <strong>Myanmar</strong> presents a<br />
mixed picture of clear improvements in the country’s<br />
two premier cities (Yangon and Mandalay)<br />
combined with stagnating or deteriorating collection and<br />
disposal in other States and Divisions. In Yangon, a<br />
reduced volume of waste per capita has resulted in<br />
an overall decline in the volume of waste generated.<br />
The authorities’ greater efforts at collecting the<br />
waste disposal fees are believed to be largely responsible<br />
for this outcome.<br />
Unsystematic and insufficient information on air<br />
quality in <strong>Myanmar</strong> limits the authorities’ and the<br />
public’s knowledge about the principal trends and<br />
the contributions that vehicles make to<br />
atmospheric pollution in the principal cities. What<br />
can be said with a greater degree of confidence is<br />
that the “vehicle density” has been on the rise in<br />
Yangon and Mandalay. At the same time, it appears<br />
that the fuel consumed per vehicle has been<br />
declining.<br />
The <strong>National</strong> Commission for <strong>Environmental</strong> Affairs<br />
(NCEA) is the central body tasked to manage the<br />
environment in concert with sectoral agencies such<br />
as the Ministry of Forestry. Since its establishment,
NCEA has achieved some progress in integrating<br />
environmental concerns into the economic<br />
development mainstream. This included the<br />
ormulation of the national environmental policy<br />
(1994), and drafting of ‘<strong>Myanmar</strong> Agenda 21’ as a<br />
framework for a multi-pronged approach to<br />
sustainable development. However, NCEA requires<br />
more administrative and financial support to further<br />
increase its effectiveness. The enactment of the<br />
draft national environment protection law might be a<br />
key step in that direction.<br />
v
Acronyms & Abbreviations<br />
AAC annual allowable cut<br />
ADB Asian Development Bank<br />
ALGAS Asia Least Cost Greenhouse Gas Abatement Strategy<br />
ARI acute respiratory infection<br />
ASEAN Association of Southeast Asian Nations<br />
CDM Clean Development Mechanism<br />
CEU car equivalent unit<br />
CFI Community Forestry Instruction<br />
CI Conservation International<br />
CITES Convention on International Trade in Endangered Species of<br />
Wild Flora and Fauna<br />
CNG compressed natural gas<br />
CSO Central Statistical organization<br />
DAP Department of Agriculture Planning<br />
DDA Department for Development Affairs<br />
DHSHD Department of Human Settlement and Housing Development<br />
DISI Directorate of Industry Supervision and Inspection<br />
DMH Department of Meteorology and Hydrology<br />
DNP Department of <strong>National</strong> Planning<br />
DOF Department of Fishery<br />
DOH Department of Health<br />
DOP Department of Population<br />
DWIR Directorate of Water Resources and Improvement of River Systems<br />
DZGD Dry Zone Greening Department<br />
EE <strong>Environmental</strong> education<br />
EIA environmental impact assessment<br />
EPA environmental performance assessment<br />
EPD Energy Planning Department<br />
EPF <strong>Environmental</strong> Partnership Fund<br />
EPP <strong>Environmental</strong> Partnership Program<br />
ERC <strong>Environmental</strong> Resource Center<br />
FAO Food and Agricultural Organization of the United Nations<br />
FD Forest Department<br />
FREDA Forest Resource Environment Development Association<br />
FWP forest working plan<br />
GAD Government Affairs Department<br />
GDP gross domestic product<br />
GEF Global Environment Facility<br />
Gg gigagram<br />
GHG greenhouse gases<br />
GIS geographic information system<br />
GMS Greater Mekong Subregion<br />
GWP Global warming potential<br />
HSD high-speed diesel<br />
ID Irrigation Department<br />
IGES Institute of Global <strong>Environmental</strong> Strategies<br />
IMF International Monetary Fund<br />
IPCC Intergovernmental Panel on Climate Change<br />
IPTG Inter Panel Technical Group<br />
ISO International Standard Organization<br />
v
IUCN International Union for the Conservation of Nature<br />
JICA Japan International Cooperation Agency<br />
MCDC Mandalay City Development Committee<br />
MCM million cubic meters<br />
MDG Millennium Development Goals<br />
MOAI Ministry of Agriculture and Irrigation<br />
MOF Ministry of Forestry<br />
MOFA Ministry of Foreign Affairs<br />
MOH Ministry of Public Health<br />
MOI Ministry of Information<br />
MOST Ministry of Science and Technology<br />
MPBND Ministry of Progress of Border Area Development and <strong>National</strong> Races<br />
and Development Affairs<br />
MS motor spirit<br />
MSS <strong>Myanmar</strong> Selection System<br />
NCC <strong>National</strong> Coordination Committee<br />
NCCE <strong>National</strong> Coordination Committee for Environment<br />
NCEA <strong>National</strong> Commission for <strong>Environmental</strong> Affairs<br />
NCHRD <strong>National</strong> Center for Human Resource Development<br />
NGO Non Governmental Organization<br />
NIES <strong>National</strong> Institute for <strong>Environmental</strong> Studies (of Japan)<br />
NWFP/NTFP Non-Wood/Timber Forest Products<br />
ODA official development assistance<br />
OECD Organization for Economic Co-operation and Development<br />
OWA other woodland area<br />
PAS Protected Area System<br />
PCCD Pollution Control and Cleansing Department<br />
PFE permanent forest estate<br />
PPP polluter pays principle<br />
RS remote sensing<br />
RTAD Road Transport Administration Department<br />
UNEP United Nations Environment Program<br />
RRCAP Regional Resource Center for Asia and the Pacific<br />
SALT sloping agriculture land technology<br />
SEF Strategic <strong>Environmental</strong> Framework<br />
SLRD Settlements and Land Records Department<br />
SOE state of the environment<br />
SPM suspended particulate matter<br />
TSP total suspended particulate<br />
UNCBD United Nations Convention on Biological Diversity<br />
UNCCD United Nations Convention to Combat Desertification<br />
UNDP United Nations Development Program<br />
UNEP United Nations <strong>Environmental</strong> Program<br />
UNFCCC United Nations Framework Convention on Climate Change<br />
UNICEF United Nations Children Fund<br />
VFMP village-forest-management-plan<br />
WHO World Health Organization<br />
WRUD Water Resource Utilization Department<br />
WWF World Wildlife Fund<br />
YCDC Yangon City Development Committee<br />
vi
An EPA technical review team was also created consisting of:<br />
Daw Yin Yin Lay Joint Secretary, <strong>National</strong> Commission for <strong>Environmental</strong> Affairs (NCEA)<br />
U Thein Lwin Deputy Director General, Energy Planning Department, Ministry of Energy<br />
U Htun Lwin Deputy Director General, Department of Meteorology and Hydrology, Ministry of Transport<br />
Dr. Htun Than Htun Head of Department, Yangon City Development Committee<br />
U Zaw Win Director, Irrigation Department, Ministry of Agriculture and Irrigation<br />
Dr. Than Htut Deputy Director, Occupational Health Unit, Department of Health, Ministry of Health<br />
Daw Htwe Nyo Nyo Deputy Director, <strong>National</strong> Commission for <strong>Environmental</strong> Affairs (NCEA)<br />
The principal authors of this draft were:<br />
U Win Myo Thu ADB’s Domestic Consultant, <strong>Environmental</strong> Issues, SEF II Project<br />
U Maung Maung Than ADB’s Domestic Consultant, <strong>Environmental</strong> Database, SEF II Project<br />
The report was reviewed by the subregional expert<br />
group and international consultants and edited<br />
by Messrs. Mike Comeau, Mohit Kumar and Ivan<br />
Ruzicka.<br />
5. The report is organized in four parts, in<br />
addition to this Introduction. Part II is an<br />
assessment of performance under principal<br />
environmental concerns, such concerns selected<br />
by the <strong>National</strong> Coordination Committee after<br />
an extensive internal discussion. In <strong>Myanmar</strong>’s<br />
case, these include (1) depletion or degradation<br />
of forest resources, (2) threats to biodiversity, (3)<br />
land degradation (4) air pollution from mobile<br />
sources, (5) inadequate solid waste management,<br />
(6) threats to sustainable use of water resources<br />
and (7) climate change. Part III of the report<br />
deals with factors (such as institutional strength,<br />
environmental education etc.) that affect<br />
performance while cutting across individual<br />
concerns. Part IV draws conclusions and contains<br />
recommendations.<br />
The <strong>Assessment</strong> Method Used<br />
6. Like all assessments of performance,<br />
assessment of environmental performance<br />
demands a retrospective look at what has<br />
happened, not what might happen in future. To<br />
make that judgment, suitable indicators need<br />
to be selected and their values established.<br />
Also, in order to learn from the assessment,<br />
the indicators should be logically inter-related.<br />
Here, the present EPA draws on the “P-S-R”<br />
model pioneered by OECD (see Figure 1 below).<br />
In that model, indicators are chosen to capture<br />
the “state” (S) of the concern being studied, the<br />
underlying “pressures” (P), and the responses (R)<br />
intended to counter the pressures and lead to an<br />
improvement of the situation (the state).<br />
7.The P, S and R indicators’ values are the raw<br />
material of the EPA. The statistical background<br />
of each indicator is summarized in indicator<br />
“fact sheets” and these are attached to the<br />
report to give the reader an opportunity to<br />
judge the underlying basis of the assessment.<br />
The assessment itself is a matter of rating<br />
(a) individual indicators and (b) the overall<br />
performance –an interplay of all indicators-- under<br />
the concern being studied. A rating structure has<br />
been developed for this purpose.<br />
8.nA double-word description is utilized to rate<br />
each indicator. The first word describes the<br />
magnitude of the indicator relative to some<br />
benchmark (such as an international standard,<br />
an average for several countries etc.). The<br />
second word describes the observed trend of the<br />
indicator value, as depicted by long or short-term<br />
historical data. The magnitude and the trend<br />
keywords are typically combined (e.g. “relatively<br />
poor and deteriorating”). In the case of baseline<br />
indicators with only one or few observations, the<br />
trend-keyword (and the “and” conjunction) is<br />
omitted. The descriptions applied to each class of<br />
indicators are contained in Table 1 and the rating<br />
applied to each concerns is given in Table 2.
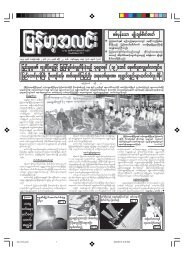
Figure 1: Simplified Representation of a P-S-R Model<br />
(Hypothetical Example of Air Quality Management with Four Indicators of<br />
<strong>Performance</strong>, Marked in Yellow)<br />
A. “Pressure” factors (indicators):<br />
1. Number of vehicles<br />
2. Vehicle characteristics<br />
3. Type of fuel<br />
4. Estimated emissions of selected pollutants<br />
5. etc.<br />
B. “State” factors (indicators)<br />
1. Concentrations of carbon monoxide<br />
2. Concentrations of atmospheric lead<br />
3. etc.<br />
C. “Response” factors (indicators)<br />
1. Frequency of vehicle inspections<br />
2. Fuel quality standards<br />
3. Expenditure on traffic management<br />
4. etc<br />
Unlike a state-of-the-environment reporting that tends to<br />
focus on the description of the environmental conditions<br />
in a given locality and on the underlying pressure factors,<br />
an environmental performance assessment (EPA) probes<br />
the effectiveness of the responses by environmental<br />
managers. It asks not mainly how well the “environment<br />
is doing” but how well those in a position to influence<br />
environmental outcomes are doing.
Table 1: Rating Used to Assess Selected Indicators<br />
STATE INDICATOR<br />
In order to qualify the magnitude of the state indicator using the recommended keywords below, the values of the state<br />
indicator are compared against known benchmark figures. The national policy target for the indicator is one such possible<br />
benchmark. In many cases, a GMS average values or an international standard would be more suitable if the indicator is<br />
to tell us something about the relative performance of each GMS country. If no such figures exist, the magnitude keyword<br />
is omitted. The “poorness” or “goodness” of the magnitude is dependent on the interpretation of the indicator value. In<br />
some cases a high state indicator value is “good” (e.g. % forest cover); at other times a low value is preferred (e.g. #<br />
threatened species).<br />
The trend of the State indicator is easy to rate as either deteriorating, stabilizing or improving, provided it is based on longterm<br />
historical data. In other cases or for benchmark indicators, the indicator value may not show any trend at all, in which<br />
case the trend keyword is left blank or specified as “Undetermined Trend”.<br />
Relatively Poor<br />
and ….<br />
As evidenced by an indicator<br />
value which is far below<br />
(or far above) the same<br />
indicator value for other<br />
GMS countries or far below<br />
(or above) other benchmark<br />
figures such as international<br />
standards or national targets<br />
Average and ... Relatively Good<br />
and ….<br />
As evidenced by an indicator<br />
value which is close to the<br />
same indicator value for<br />
other GMS countries or<br />
within the range of other<br />
acceptable benchmark<br />
figures such as international<br />
standards or national targets<br />
As evidenced by an indicator<br />
value which is far above<br />
(or far below) the same<br />
indicator value for other<br />
GMS countries or far above<br />
(or below) other benchmark<br />
figures such as international<br />
standards or national targets<br />
Unknown State<br />
and ….<br />
This rating is used if the<br />
value of the indicator cannot<br />
be compared against the<br />
value of the same indicator<br />
in other countries or regions<br />
and there are no other<br />
benchmark figures, such as<br />
international standards or<br />
national targets<br />
Deteriorating Stabilizing Improving Undetermined<br />
Trend<br />
As evidenced by a steady<br />
long-term deteriorating trend<br />
and with no immediate signs<br />
of improvement.<br />
As evidenced by a steady<br />
long-term deteriorating<br />
trend but with short-term<br />
signs of leveling or even<br />
improvement, or a long-term<br />
level trend.<br />
As evidenced by a long-term<br />
deteriorating trend but with<br />
sure signs of improvement<br />
based on more than one<br />
observation in the positive<br />
trend.<br />
This rating is used if<br />
the selected indicator in<br />
inconclusive in terms of long<br />
or short-term trends or if the<br />
indicator is based on a single<br />
observation over time.
PRESSURE INDICATOR<br />
There will always be some magnitude of pressure and the trend over time can simply be rated as increasing or decreasing.<br />
Qualifying the magnitude of the indicator value may at times be difficult, especially if the pressure indicator is unique to<br />
one country and no comparative figures are available from other countries. It is also unlikely that international benchmark<br />
figures will exist for pressure indicator. Judgment is required to rate the magnitude of unique pressure indicators.<br />
The trend of pressure indicators should be easy to rate, provided that long-term historical data exists. If only one or few<br />
observations exist, the trend keyword can be left blank.<br />
High and Medium and Low and Non-Comparable<br />
and<br />
As evidenced by the value of<br />
an indicator which is much<br />
higher than the value of<br />
the same indicator in other<br />
GMS countries or much<br />
higher than other benchmark<br />
figures, such as international<br />
standards or national targets<br />
As evidenced by the value<br />
of an indicator with a value<br />
more or less equal to that of<br />
other GMS countries or other<br />
benchmark figures such as<br />
international standards or<br />
national targets.<br />
As evidenced by the value of<br />
an indicator which is much<br />
lower than the value of the<br />
same indicator in other<br />
GMS countries or much<br />
lower than other benchmark<br />
figures, such as international<br />
standards or national<br />
targets.<br />
Increasing Steady Decreasing (blank)<br />
As evidenced by a long-term<br />
trend of increasing pressure,<br />
with very little sign of relief or<br />
stabilization.<br />
As evidenced by a long-term<br />
steady or near-constant<br />
pressure that shows no sign<br />
of increase or decrease in<br />
the past or future.<br />
As evidenced by a long-term<br />
trend of declining pressure,<br />
with perhaps fluctuating<br />
short-term oscillations.<br />
RESPONSE INDICATOR<br />
This rating is used if, through<br />
lack of comparative numbers<br />
or other information, an<br />
order of magnitude cannot<br />
be assigned to the value of<br />
the indicator.<br />
The keyword is left<br />
blank if there is only one<br />
observation, or if there is no<br />
observed trend over time in<br />
the indicator value.<br />
Since responses tend to be very diverse, there may be few benchmarks to rate the magnitude of response indicators<br />
other than the national targets for the indicator selected. Once more, judgment is required to rate the magnitude of unique<br />
indicators to say how “big” or “small” the response was.<br />
Low and Average and Significant and Non-Comparable<br />
If the magnitude of the<br />
response is significantly<br />
below the national target or<br />
below the average in other<br />
GMS countries or other<br />
comparable regions.<br />
If the magnitude of the<br />
response is in line with<br />
national targets or the<br />
average responses of<br />
other GMS countries or<br />
comparable regions.<br />
If the magnitude of the<br />
response exceeds national<br />
targets of the average of<br />
other GMS countries or<br />
comparable regions.<br />
Sporadic Intermittent Consistent (blank)<br />
If the response has been<br />
irregularly applied over<br />
time with no set program<br />
or budgets to continue the<br />
response in the future.<br />
If the response has not<br />
been consistently applied<br />
but there are programs and<br />
budgets to continue the<br />
application of the response<br />
in future.<br />
If the response has been<br />
consistently applied,<br />
calibrated to the pressure,<br />
with plans to continue until<br />
the pressure has been<br />
reduced to a desired level<br />
This rating is used (or the<br />
keyword left blank) if there<br />
are no data or information to<br />
compare the magnitude of<br />
the response with, or there<br />
are no other benchmark<br />
figures.<br />
The keyword is left<br />
blank if there is only one<br />
observation, or if there is no<br />
observed trend over time in<br />
the indicator value.
Table 2: Rating Used to Evaluate <strong>Performance</strong> Under a Selected<br />
<strong>Environmental</strong> Concern<br />
ENVIRONMENTAL CONCERN<br />
For purposes of communicating the EPA results, rating of performance under each priority concern is required. In this<br />
EPA, a star-rating system is used where any performance counts but with different levels of merit. The star rating is based<br />
on what the indicators are saying, backed up by hard evidence presented in fact sheets, not on what a consensus view or<br />
expectations may be.<br />
1-Star * 2-Stars ** 3-Stars *** Un-Rated<br />
If the pressure continues to<br />
increase, the state continues<br />
to deteriorate and the<br />
response(s) do not appear<br />
to have any effect on the<br />
pressure or the state.<br />
Additional criteria for 1-Star<br />
rating:<br />
1) Reasonable targets have<br />
not been set or have not<br />
been met.<br />
2) International conventions<br />
have not been ratified or<br />
adhered to.<br />
3) No ongoing monitoring or<br />
data collection.<br />
4) No clear institutional<br />
role and responsibilities for<br />
environmental management<br />
of environmental concerns<br />
have been assigned or<br />
where they have been, no<br />
tangible progress has been<br />
achieved suggesting an<br />
appropriate response and<br />
non-achievement of the<br />
target.<br />
If there are signs that the<br />
responses will or have had<br />
an effect on releasing the<br />
pressure, even though the<br />
state does not yet show<br />
signs of improvement.<br />
Additional criteria for 2-Star<br />
rating:<br />
1) Targets have been set<br />
and generally met.<br />
2) International conventions<br />
have been or will be ratified<br />
and most of the reporting<br />
requirements have been met<br />
3) Plans exist for ongoing<br />
monitoring and data<br />
collection.<br />
4) Institutional<br />
responsibilities assigned<br />
though limited progress<br />
achieved due to weaknesses<br />
in institutional arrangements<br />
e.g. lack of coordination,<br />
duplication of roles,<br />
multiplicity of authorities etc.<br />
If there is clear evidence that<br />
the responses have reduced<br />
the pressure and/or there is<br />
a clear sign that the state is<br />
improving.<br />
Additional criteria for 3-star<br />
rating:<br />
1) Effective targets have<br />
been set and met.<br />
2) International conventions<br />
have been ratified and<br />
reporting requirements have<br />
been met.<br />
3) Ongoing monitoring and<br />
databases exist.<br />
4) Specific institutions<br />
with targeted roles and<br />
responsibilities assigned.<br />
Institutional measures in<br />
place for the management<br />
of the concern e.g.<br />
EIA process, adequate<br />
budgetary and resources for<br />
environment monitoring, staff<br />
with appropriate technical<br />
skills and know-how, regular<br />
interaction with industry and<br />
NGOs on environmental<br />
management matters etc.<br />
If the trend in the state<br />
indicator cannot be<br />
explained by the pressures<br />
or the responses.<br />
The label “un-rated” is a<br />
sign that we have failed<br />
to identify appropriate<br />
indicators backed by fact<br />
sheets, and/or have failed to<br />
apply the PSR model, and/<br />
or have failed to apply the<br />
PSR model to performance<br />
assessment.
The Target Audience<br />
The target audiences for the report are:<br />
• <strong>National</strong>-level decision and policy makers<br />
• <strong>National</strong> Commission for <strong>Environmental</strong><br />
Affairs (NCEA)<br />
• Government departments, institutions<br />
and agencies related to environmental<br />
management in <strong>Myanmar</strong><br />
• Universities and research institutes<br />
• <strong>National</strong> non-governmental organizations<br />
active in socio-economic development and<br />
environmental conservation such as FREDA,<br />
<strong>Myanmar</strong> Woman Association, etc.<br />
• Non-for-profit professional and private<br />
organizations such as <strong>Myanmar</strong> Engineering<br />
Society, Chamber of Industry and<br />
Commerce, and etc.<br />
• Collaborating international and regional<br />
organizations such as GEF, ADB, UNEP, IGES<br />
and NIES.<br />
• Local authorities, implementers and<br />
communities in selected case study areas<br />
References<br />
NCEA. 1997. <strong>Myanmar</strong> Agenda 21, <strong>National</strong><br />
Commission for <strong>Environmental</strong> Affairs,<br />
Government of the Union of <strong>Myanmar</strong>, Yangon.<br />
Project Secretariat. 2003. Implementation<br />
Plan: <strong>National</strong> <strong>Performance</strong> <strong>Assessment</strong> and<br />
Subregional Environment Strategic Framework<br />
for the Greater Mekong Subregion – ADB/<br />
TA.No.6069-REG. Prepared by Project Secretariat,<br />
UNEP Regional Resource Center for Asia and the<br />
Pacific, Bangkok, pp: 1-2.
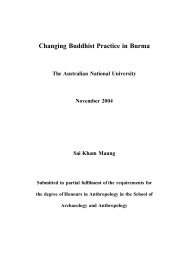
Source: Forest Department 2005<br />
Map : Administrative Map of <strong>Myanmar</strong>
MYANMAR<br />
NATIONAL ENVIRONMENTAL<br />
PERFORMANCE ASSESSMENT<br />
(EPA) REPORT<br />
2 MANAGEMENT OF PRINCIPAL<br />
ENVIRONMENTAL CONCERNS<br />
1. Forest resources<br />
1.1. context<br />
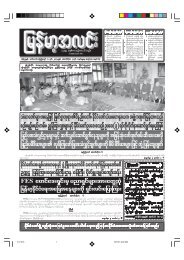
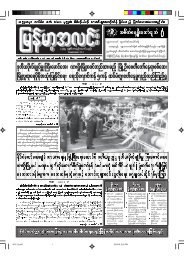
9. The richness of <strong>Myanmar</strong>’s forest reflects<br />
the diversity of the country’s climatic and<br />
topographic conditions and a wide range of<br />
latitude. The forests are of eight broad types;<br />
namely (1) mangrove tidal forests, (2) beach and<br />
dune forests, (3) swamp forests, (4) evergreen<br />
forests, (5) mixed deciduous forests, (6) dry<br />
thorny forests, (7) dipterocarp (Dipterocarpus)<br />
forests and (8) Hill and Temperate Evergreen<br />
10<br />
Forest. Besides the above classification, the<br />
forest flora can be divided into 48 ecological<br />
sub-divisions based on climatic, edaphic and<br />
other factors. Among the principal categories,<br />
the (1) mixed deciduous teak and hardwood<br />
forests and (2) dipterocarp forests are the most<br />
important commercially. The mangrove forests in<br />
the coastal areas and Ayeyarwaddy delta are vital<br />
for the ecological stability of these areas. (Forest<br />
Department 1989, pp: 3-4)<br />
Figure 1.1: Forest Area by Forest type – 1989/90 (square miles)<br />
Hill Forest, 34,509 ,<br />
26%<br />
Dipterocarpus Forest,<br />
6,636 , 5%<br />
Dry Thorny Forest,<br />
13,273 , 10%<br />
Mangrove + Beach &<br />
Dune +Sw amp Forest,<br />
5,309 , 4%<br />
Mixed Deciduous,<br />
51,764 , 39%<br />
Evergreen Forest,<br />
21,237 , 16%
10. These diverse forests have been providing<br />
a wide range of goods and environmental<br />
services. Forty-five commercial timber species<br />
are extracted, the teak, ironwood and rosewood<br />
the most valuable and best known among them<br />
(Forest Department 1994, pp: 14). Non-wood<br />
forest products (NWFP) such as charcoal,<br />
bamboo, cane, resin, latex, honey, beeswax, edible<br />
bird nests, bat’s guano, turpentine and orchids<br />
support local livelihoods. The forests continue to<br />
provide wood energy to rural households and local<br />
cottage industries. Although the forestry sector<br />
accounted for only 0.6% of total GDP in 2001/02,<br />
it generated over 10% of total export earnings,<br />
second only to agriculture and petroleum sectors<br />
(CSO, 2002). In these circumstances, the state<br />
of forest resources is of major significance for<br />
livelihoods and the environmental stability of the<br />
nation.<br />
11<br />
Indicator: Percentage of Forest Cover in Total Land<br />
Area 1975-1998<br />
1.2. state<br />
11. Following globally accepted indicators of<br />
the state of forests as used, for instance, by the<br />
Food and Agriculture Organization of the United<br />
Nations (FAO) in ongoing global monitoring of<br />
tropical forests, forest cover, expressed as a<br />
percentage of the total land area, was selected as<br />
the state indicator.<br />
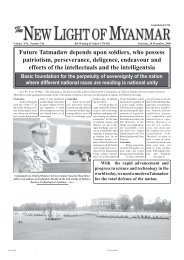
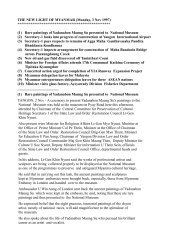
12. In 2005, half of the country is still covered<br />
with natural forests. Based on the Forest<br />
Department (FD)’s estimates, total forest area<br />
was 41.2, 39.7 and 35.5 million ha in 1975,<br />
1989 and 1998, respectively, corresponding to<br />
approximately 61%, 59% and 52% of the total<br />
land area (see Figure 1.2.). The loss of forest<br />
cover accelerated over time from a 2% loss<br />
between 1975 and 1989 to 7% during 1989-<br />
1998. According to Forest Policy and Master<br />
Plan, 30% of total land is to be a Permanent<br />
Forest Estate or PFE (Reserved Forest and Public<br />
Protected Forest) while another 10% is to be<br />
under Protected Area System. An additional<br />
10% of total land is to be managed for multiple<br />
land use containing agroforestry and community<br />
forests. (MOF, 2001a)<br />
Figure 1.2: Forest cover as a Percentage of total Land<br />
Thousand hectares<br />
42,000<br />
41,000<br />
40,000<br />
39,000<br />
38,000<br />
37,000<br />
36,000<br />
35,000<br />
34,000<br />
33,000<br />
32,000<br />
1975 1989 1997 1998<br />
62.0%<br />
60.0%<br />
58.0%<br />
56.0%<br />
54.0%<br />
52.0%<br />
50.0%<br />
48.0%<br />
46.0%<br />
Forest Cover Forest As % of Total Land<br />
Percent as of Total Land
Map 2: Dominant type of Forests<br />
Source: Forest Department (2005) (based on Forest Inventory Data)<br />
12
13. The spatial pattern of deforestation is<br />
presented in detail in the corresponding fact<br />
sheet. Out of 14 States and Divisions, the most<br />
serious deforestation (measured by the forest<br />
area lost between 1989 and 1998) occurred in<br />
the Sagaing Division, Shan State and Magwe<br />
Division. The Mandalay Division, Kachin State and<br />
Rakhine State followed. When measured by the<br />
excess of the local annual deforestation rate over<br />
the national average (1.18%) between 1989 to<br />
1998, the fastest deforestation was found in these<br />
following areas:<br />
a. Ayeyarwaddy Division – Annual deforestation<br />
rate was 5.6 % per annum as total forest<br />
cover declined from 24% of the total area in<br />
1989 to 12% in 1998. Major threats in this<br />
region were over-exploitation of mangroves<br />
for fuelwood supply to major urban areas<br />
(especially Yangon) and expansion of<br />
shrimp farming in recent years.<br />
b. Mandalay Division – Annual deforestation<br />
rate was 5.0% per annum as the forest<br />
area decreased from 35% to 19% of total<br />
land between 1989 and 1999, fuelled by<br />
rapid urbanization in the central part of<br />
the country and commercial exploitation of<br />
forest products in the north and south of<br />
the region.<br />
c. Yangon Division – Annual deforestation rate<br />
was 5.0% per annum. Forest cover declined<br />
from 15% of the total land area in 1989<br />
to 9% in 1998 affected by the closeness to<br />
Yangon, the timber export capital. Forests<br />
in the far north of the Division were opened<br />
up for commercial timber extraction<br />
and for fuelwood supply to the capital.<br />
Increased accessibility due to infrastructure<br />
development in recent years contributed to<br />
accelerated forest exploitation.<br />
d. Magwe Division – Annual deforestation<br />
rate was 4.2% per annum. Unlike in<br />
other regions, deforestation took place<br />
predominantly in the open forest while a<br />
net increase of forest cover was recorded<br />
in the closed forest after 1989. This was<br />
due mainly to better forest protection in<br />
the Shwe Setaw <strong>National</strong> Park and Forest<br />
Plantation contrasting with open access<br />
elsewhere. Within 9 years, a 38% forest<br />
cover (both open and close forest) in 1989<br />
13<br />
declined to 23% in 1998.<br />
e. Bago Division – The teak bearing forests<br />
of the Division were being lost at a rate of<br />
2.8% per annum during the decade 1989-<br />
1998. Forest cover declined from 45% to<br />
33% during that period. The teak forest was<br />
under the pressure of lucrative teak exports.<br />
f. Rakhine State – Annual deforestation<br />
rate was 2.6% per annum. This coastal<br />
area in the western part of the country<br />
is less densely populated and had a high<br />
forest cover of 62% in 1989. The coastal<br />
mangrove forests were being encroached for<br />
paddy cultivation and shrimp farming. The<br />
forest cover declined to 50 % by 1998.<br />
g. Kachin State and Sagaing Division are the<br />
northern regions of the country with large<br />
areas of commercially valuable species.<br />
Many of them disappeared after 1989 as<br />
commercially driven production took hold.<br />
Expansion of mining and illegal timber<br />
exports to PRC contributed to deforestation.<br />
However, given the initially large forest cover,<br />
the average deforestation rate during the<br />
studied decade was only 1.8% in Kachin<br />
State and 1.3% in Sagaing Division. These<br />
regions contain the Ayeyarwaddy and<br />
Chindwin watersheds and deforestation here<br />
poses the threat of complex socioeconomic<br />
and environmental repercussions<br />
downstream.<br />
14. From the above it is clear that deforestation<br />
has been positively correlated with each region’s<br />
commercial forest potential and the state of the<br />
local economy. From two periodical assessments<br />
on forest cover of <strong>Myanmar</strong>, it emerges that each<br />
year, 107,910 ha of natural forests were lost<br />
during the period 1975 to 1989 while the forest<br />
area lost in later years from 1989 to 1998 was<br />
466,420 ha per annum. The major acceleration<br />
after 1989 coincided with the opening of the<br />
forestry sector to the private sector in the<br />
aftermath of the economic reforms of 1988.<br />
15. The 2000 FAO Forest Resource <strong>Assessment</strong><br />
put the forest cover of other GMS countries<br />
at 54.4% in Lao PDR, 52.8% in Cambodia,<br />
30% in Viet Nam, and 28.9% in Thailand (FAO,<br />
2000). The forest cover of Yunnan was 32.4%.<br />
Thus <strong>Myanmar</strong>’s forest cover (52.5%) is the<br />
second highest among them after Lao PDR. It is
important to add, however, that the methods of<br />
classifying forest continue to differ among GMS<br />
countries (especially in terms of canopy cover<br />
percentage) and the cross-country comparisons<br />
should be treated with caution.<br />
Suggested Rating:<br />
Relatively Good<br />
But Deteriorating<br />
Justification: Forest cover in <strong>Myanmar</strong> declined from<br />
61% in 1975 to 52% in 1998. Since 1989, about<br />
460,000 ha of natural forest were lost on average each<br />
year. This represented a major acceleration in forest<br />
cover loss compared with the situation prevailing until<br />
then. However, compared with other GMS countries,<br />
<strong>Myanmar</strong>’s forests are still abundant despite recent<br />
deteriorating trends.<br />
1.3 Pressure<br />
Indicator: Ratio of Wood Removal over Thousand<br />
Hectares of Forest Cover 1975- 2001<br />
16. The description of forest cover and its<br />
changes over time in the previous section<br />
identified land use change and forest exploitation<br />
as principal causes of deforestation in <strong>Myanmar</strong>.<br />
The former has been related to conversion of<br />
forest to agriculture, particularly by slash and<br />
burn farmers but also by commercial agriculture,<br />
most notably for tree crops (rubber, palm oil and<br />
fruit). The net sown area (including a relatively<br />
small area of tree crops like rubber and palm oil)<br />
14<br />
increased from 19.9 million acres in 1988/89 to<br />
25 million acres in 1999/2000. This compares<br />
with a net loss of forest cover of 4.2 million acres<br />
during the period of 1989 to 1998 (consisting<br />
of 6 million acres of closed forest lost and 1.8<br />
million acres of open forest gained). As timber<br />
elephants are used in official timber extraction,<br />
legal logging did not cause deforestation, merely<br />
a change from closed forest to open (logged-over)<br />
forest. Commercial logging accounted for the<br />
bulk of the 4.2 million acres of closed forest lost<br />
but some loss due to clearance for agriculture<br />
cannot be excluded. If, on the other hand,<br />
agriculture expansion is confined to “cultivable<br />
waste land” 1 (as it should be in theory), the<br />
principal factors for the loss of forest would be<br />
illegal forest exploitation given that slash and<br />
burn areas during 1990 to 1999 remained stable<br />
at around half a million acres 2 . It is possible that<br />
under-reported slash and burn cultivation is also<br />
contributing to forest loss.<br />
17. The influence of commercial logging is not<br />
easy to analyze. Available data do not support<br />
the notion that commercial logging operations<br />
systematically violated existing annual allowable<br />
cut (AAC) regulations 3 . The key to a satisfactory<br />
explanation seems to lie in illegal logging taking<br />
place in remote and difficult-to-monitor areas.<br />
18. While the pattern of deforestation is clearly<br />
complex, there is little doubt about the expansion<br />
of the commercial forestry segment (including<br />
commercial logging, fuelwood extraction and<br />
commercial harvesting of non-timber forest<br />
products) 4 during the last decade 5 . As can be seen<br />
the pressures on forest resources in <strong>Myanmar</strong><br />
have been many and a single indicator is unlikely<br />
to capture this complexity.<br />
1 The Settlement and Land Record Department (SLRD) considers “cultivable waste land” to be neither permanent farmland nor permanent<br />
forest estate (or PFE, defined as reserve forest and protected public forest under the management of the Forest Department) but land<br />
available for agriculture expansion. Such land may contain trees but is not considered as forestland by the Forest Department yet.<br />
This category is often confused with “other woodland area” (OWA), which may not be used for agriculture cropping. OWA is not given the<br />
same legal protection as PFE.<br />
2 According to data compiled by NCEA for ASEAN’s SOE <strong>Report</strong>, annually reported shifting cultivation areas were 235, 228, 221, 228, 232,<br />
230, 209, 201, 180 and 150 thousand hectares respectively for the period 1990-1999. (NCEA 1999).<br />
3 Under the <strong>Myanmar</strong> Selection System, the volumes of wood that can be sustainably removed each year is fixed. Adherence to this limit in<br />
practice has varied. For instance, AAC for teak was 350,000 and 226,954 hoppus tons respectively before and after 1996 periods but annual<br />
extraction of teak during 1975 to 2001 ranged from 203,122 to 489,019 hoppus tons p.a. In case of hardwood species, AAC fixed for<br />
before and after 1996 were 1.3 and 1.8 million hoppus tons respectively and actual felling has never exceeded the AAC limits. (Ohn, 1999),<br />
(Forest Department 1991), and MOF (2001b)<br />
4 The growth of export-led timber industry coincided with the official adoption of a market economy in 1988.<br />
5 As of CSO (2002), annual growth rate of forestry sector gross domestic product were 8.3 % (1990/91), -4.5% (1995/96), 2.1% (1996/97),<br />
2.8% (1997/98), 3.2% (1998/99), 4.6% (1999/2000), 3.3% (2000/01) and 10% (2001/02).
19. In this EPA, the indicator “Ratio of Wood<br />
Removal to 1000 Hectares of Forest Area” has<br />
been developed to describe the pressure on the<br />
forest resource exerted by forest exploitation.<br />
Wood removal combines the figures of<br />
commercial round wood production with those<br />
of fuelwood production derived from estimated<br />
consumption of firewood and charcoal in both<br />
rural and urban areas.<br />
20. Figure 1.3 illustrates the near doubling of the<br />
pressure on average forest area between 1975<br />
and 2000 from 624 m3 of annual wood removal<br />
per 1000 ha of forest to 1232 m3 in 2000. The<br />
indicator also shows an acceleration of pressure<br />
during the last decade coinciding with a rapid<br />
loss of forest cover during the same period (as<br />
brought out in the “state” section). Broadly<br />
speaking, the rate of forest loss was twice as fast<br />
as the rate of pressure increase.<br />
21. The data presented in this report also suggest<br />
that extraction of fuelwood has had a far greater<br />
impact on the state of <strong>Myanmar</strong>’s forest than<br />
round-wood removals. Firewood and charcoal<br />
constituted approximately 92% of total wood<br />
Figure 1.3: ratio of Annual Wood removal over thousand Hectares of Forest Land<br />
Cubic meter per thousand hectares of forest cover<br />
1,400<br />
1,200<br />
1,000<br />
800<br />
600<br />
400<br />
200<br />
-<br />
1975<br />
1976<br />
1977<br />
1978<br />
1979<br />
1980<br />
Source: Forest Department (2005)<br />
1981<br />
1982<br />
1983<br />
1984<br />
1985<br />
1986<br />
1987<br />
15<br />
removal at the turn of the decade and dominate<br />
the values of our indicator. The dominance of<br />
fuelwood in total wood production is hardly<br />
surprising given that more than 80% of total<br />
primary energy in <strong>Myanmar</strong> is still supplied by<br />
fuelwood (ADB et al., 1998, pp: 54). Coupled<br />
with a population increase of 2% per annum and<br />
a slow pace of alternative energy introduction,<br />
the demand for fuelwood continues to rise (from<br />
24.5 million m3 in 1975 to 40.4 million m3 in<br />
2000). Furthermore, the actual extraction of<br />
fuelwood might be higher still than the figures<br />
generated here. This is because official estimates<br />
of per capita fuelwood consumption (used in<br />
this report) date back to 30 years ago and may<br />
underestimate the current average use. Also,<br />
fuelwood consumption by small enterprises and<br />
cottage industries, a rapidly growing sector in<br />
recent years, is not fully taken into account in<br />
our estimates. No up to date figures for other<br />
GMS countries are readily available to make<br />
comparisons with although such comparisons<br />
could be made with additional effort.<br />
1988<br />
1989<br />
1990<br />
1991<br />
1992<br />
annual wood removal<br />
1993<br />
1994<br />
1995<br />
1996<br />
1997<br />
1998<br />
1999<br />
2000<br />
2001
Suggested Rating:<br />
High and Increasing<br />
Justification: The pressure on the forest has been<br />
increasing in <strong>Myanmar</strong>. Wood removal per thousand<br />
hectares of forest cover nearly doubled from 624 m 3<br />
in 1975 to 1,232 3 in 2000.<br />
1.4 response<br />
22. Attempts to respond to the threat of forest<br />
depletion and loss in <strong>Myanmar</strong> have a long history<br />
going back to 1856 (Saw El Dah, 2004) and the<br />
development of sustainable management regimes<br />
for the teak forests of Bago and the <strong>Myanmar</strong><br />
Selection System (MSS) built around the concepts<br />
of allowable cut, forest-working plans (FWP),<br />
decentralized management and “local supply<br />
working circles” 6 . Under MSS, teak forests of<br />
<strong>Myanmar</strong> sustained their production over three<br />
felling cycles, i.e. almost a century.<br />
23. With the abundance in natural forests during<br />
the colonial period, the establishment of forest<br />
plantations was not a priority (Slebbing, 1962).<br />
It remained a low priority during the early years<br />
of independence. The decentralized forest<br />
management was replaced by a centralized<br />
national planning system between 1962-1988.<br />
The basic planning unit shifted from forest<br />
ecosystem to an administration unit disrupting<br />
operations within the same ecological unit. The<br />
ecological stability of the forest became harder to<br />
establish and enforce. The quality and execution<br />
of forest working plans declined.<br />
16<br />
24. In the meantime the profile of plantation<br />
forestry, especially teak, increased. From modest<br />
compensatory planting during the 1960s it<br />
progressed to an annual average of around<br />
80,000 acres (MOI 2000) in the late 1990s<br />
(see Table 1.1 below). Among others, the World<br />
Bank (WB) and Asian Development Bank (ADB)<br />
supported forest plantation establishment, from<br />
1979 to1987, through the East Pegu Yoma Project<br />
(Ohn U, 1999).<br />
25. A major change took place in 1988, when<br />
the state-run timber industry was opened<br />
to private sector participation. Efforts were<br />
made to accompany this by reinforcing forest<br />
management: Forest Law was revised in 1992,<br />
national forest policy formulated in 1995,<br />
community forestry given a legislative basis<br />
(1995) and Dry Zone Greening Department<br />
(DZGD) created in 1997.<br />
26. The 1995 Forest Policy set the target of<br />
expanding the reserve forest to 30% of the total<br />
land area and setting aside no less than 5% of<br />
total land as protected area system (10% for<br />
the long term). Annual reforestation target of<br />
20,000 ha (approximately, 50,000 acres) was<br />
also announced to restore degraded lands and<br />
meet rural needs. (MOF, 1996, pp: 4-5). Forest<br />
conservation and reforestation for environmental<br />
protection and for rural development have become<br />
the centerpiece of forest management in recent<br />
years while MSS was retained to regulate the<br />
exploitation of non-plantation forest. Through<br />
the activities of DZGD, reforestation work and<br />
law enforcement intensified in the neediest areas<br />
like the heavily deforested parts of Magwe,<br />
table 1.1: establishment of Forest Plantations (acres)<br />
type of Plantation 1968 to 1988 1989 to 2000 total as of 2000<br />
Commercial timber<br />
plantations<br />
402,910 514,017 916,927<br />
Village supply (fuelwood) 185,575 280,709 466,284<br />
Industrial supply 50,796 73,633 124,429<br />
Catchment protection 65,439 96,683 162,122<br />
Total 704,720 965,042 1,669,762<br />
Source: Forest Department (1989) and MOF (2001a), pp: 121<br />
6“Local supply working circles”, designed to ensure supply of forest products to the population living in the vicinity of forest, pre-date the<br />
current discussion about buffer zone management by almost one hundred years.
Mandalay and Sagaing Divisions. Community<br />
forestry legislation is also providing for the right<br />
of local people to manage nearby forests for<br />
their own use. A comprehensive Forestry Master<br />
Plan for 2001-2031 reinforced the policy support<br />
for sustainable forest management. Overall,<br />
the management of forest resources has been<br />
receiving policy-, legal and institutional support<br />
during the last decade.<br />
27. Real expenditure on forest conservation<br />
has been developed in this EPA as an indicator<br />
of response based on information provided by<br />
the Forest Department and Dry Zone Greening<br />
Department, under Ministry of Forestry.<br />
1 st Indicator: Expenditure on Forest Conservation<br />
1988-2001<br />
28. Annual expenditure for forest conservation<br />
rose 15 times in nominal terms over the period<br />
1988 to 2001. Adjusted for price inflation, the<br />
picture is mixed. The total annual expenditure<br />
at constant prices of both Forest Department<br />
and DZGD during 1994 to 1999 were lower than<br />
in 1988. The increase in total real expenditure<br />
after 1999 was due largely to a sharp increase<br />
in current expenditure (mainly salaries of<br />
government employees).<br />
7One of the main functions of Dry Zone Greening Department is to promote wood saving. Energy-efficient cooking stoves were purchased<br />
and distributed to dry zone rural villages. The expenditure incurred for this activity was included in “Capital Cost” and could not be separately<br />
reported. Energy saving activity outside dry zone is carried out by Forest Department and there is no separate budget line for this<br />
activity.<br />
17<br />
29. The real capital expenditure on forest<br />
plantations, natural forest management and<br />
related conservation activities also increased<br />
slightly during the same period. Most of the<br />
expenditure was incurred to establish forest<br />
plantations. Expenditure on other forest<br />
management operations was minimal. For<br />
instance, 22% to 34% of the FD’s expenditure<br />
was spent on forest plantations and only 1.5%<br />
on forest conservation and natural forest<br />
management. Expenditure for wood energy<br />
saving was virtually non-existent in FD though<br />
there might have been some expenditure by<br />
the Dry Zone Greening Department 7 . The 2001<br />
expenditure, i.e. spending on personnel and<br />
administration, consumed almost 63% of the<br />
total budget and this contributed to a weakening<br />
of forest conservation work in the field. The<br />
allocation for 2000 and 2001 increased somewhat<br />
but overall, the period 1988 to 2001 saw a<br />
fluctuating trend. Therefore, expenditure on forest<br />
conservation is considered “intermittent”. It is<br />
not comparable with other GMS’s countries the<br />
majority of which used different indicators to<br />
assess the response.<br />
Figure 1.4:expenditure on Forest conservation at 1988 constant Price<br />
Million Kyat at 1988 constant price lev<br />
300<br />
250<br />
200<br />
150<br />
100<br />
-<br />
50<br />
1988<br />
1994<br />
1995<br />
1996<br />
1997<br />
1998<br />
1999<br />
Source: Forest Department (2005), Dry Zone Greening Department quoted in NCEA (2004)<br />
2000<br />
2001<br />
Capital Current Total
Suggested Rating: Average<br />
and Intermittent<br />
Justification: The inflation-adjusted expenditures<br />
available for forest conservation have been<br />
fluctuating during the period 1988 to 2001. The<br />
response is considered intermittent. In general, the<br />
expenditures averaged 200 Million Kyat p.a. The<br />
largest share was used to finance administration<br />
and personnel with the remainder divided between<br />
forest plantations and natural forest management<br />
including wildlife conservation.<br />
2 nd Indicator: Permanent Forest Estate as a<br />
Percentage of Total Land 1985 - Expenditure on Forest<br />
Conservation 1988-2003<br />
30. In <strong>Myanmar</strong>, different typologies of forest and<br />
differences in their legal status are found. Forest<br />
Reserve is the best-known category fully protected<br />
by existing forestry related laws. Establishing<br />
a Forest Reserve is normally a lengthy official<br />
process during which potential conflicts of<br />
interest and tenurial claims of different parties<br />
and the State need to be reconciled. Notification<br />
18<br />
of an area as a Protected Public Forest is a<br />
simpler alternative to giving legal protection to<br />
trees and placing limits on the type of activities<br />
allowed. Other forested areas are normally in<br />
the category of either (1) public forest (“other<br />
woodland area” – OWA) where forest cover might<br />
be still good and access to trees and land is open<br />
to local communities or (2) “wasteland” where<br />
natural vegetation is sparse or very poor. The<br />
former two categories, i.e. the Forest Reserve and<br />
Protected Public Forest, are termed Permanent<br />
Forest Estate (PFE) and 1995’s Forest Policy has<br />
been targeting 30% of total land to be managed<br />
under PFE. Therefore, PFE as percentage of total<br />
land was developed as an indicator here to assess<br />
the current level of response.<br />
31. Before the policy target was announced, the<br />
total percentage of Permanent Forest Estate (PFE)<br />
was about 15%. The Forest Department data show<br />
no or very little change from 1985 to 1997 (Figure<br />
1.5). Between 1998 and 2003, the total area of<br />
PFE increased to 22% of the total land area. The<br />
additional 7% of total land placed under PFE<br />
is about half of the projected increase and the<br />
official target therefore looks to be within the<br />
authorities’ reach.<br />
Figure 1.5: Area of Permanent Forest estate in <strong>Myanmar</strong><br />
thousand hectares<br />
16,000<br />
14,000<br />
12,000<br />
10,000<br />
8,000<br />
6,000<br />
4,000<br />
2,000<br />
-<br />
1985-86<br />
1986-87<br />
1987-88<br />
1988-89<br />
1989-90<br />
1990-91<br />
1991-92<br />
1992-93<br />
1993-94<br />
1994-95<br />
1995-96<br />
1996-97<br />
1997-98<br />
1998-99<br />
1999-2000<br />
2000-2001<br />
2001-2002<br />
2002-2003<br />
2003-2004<br />
25.0%<br />
20.0%<br />
15.0%<br />
10.0%<br />
5.0%<br />
0.0%<br />
PFE area PFE As % of Total Land Area<br />
% PFE over Total Land
Source: Forest Department (2005)<br />
Map 3: reserved and unclassed Forest in <strong>Myanmar</strong><br />
19
Suggested Rating:<br />
Average and consistent<br />
Justification: Annually, an average of about 1% of<br />
total land area was added to <strong>Myanmar</strong>’s Permanent<br />
Forest Estate during the period 1998 to 2003. In 2003,<br />
the total Permanent Forest Estate (PFE) amounted<br />
to 22% of the country’s total land area. Over a<br />
decade and a half, the response was average with a<br />
consistent improvement, however.<br />
1.5 conclusions<br />
32. Average wood removals in <strong>Myanmar</strong><br />
(measured in average volume extracted from<br />
a unit of forest area) approximately doubled<br />
since 1975 and annual losses of forest area<br />
accelerated notably since 1989. In spite of these<br />
developments, <strong>Myanmar</strong>’s forest cover continues<br />
to compare favorably with other GMS countries<br />
even if more work is needed to achieve true<br />
comparability of forest cover data in the GMS.<br />
Without consistent and increasing response to<br />
the pressures on the resource the loss of forest<br />
cover is set to continue. The resources devoted to<br />
forest conservation have fluctuated in recent years<br />
showing no clear trend.<br />
33. The response has been more telling in a<br />
related domain: FD was able to increase PFE from<br />
15.3 % of the total land area in 1995 to 22.4%<br />
in 2003. This is almost half of the policy target<br />
established in the 1995 Forest Policy.<br />
34. Forest management has also been<br />
strengthened by several sound policy and<br />
institutional measures. In particular, a forestry<br />
master plan has been formulated for a 30-year<br />
period starting from the budget year 2001/2002.<br />
It addresses principal shortcomings currently<br />
observed in forest management, and gives greater<br />
attention to elements such as forestry extension,<br />
community forestry, agro forestry, wood energy<br />
saving and human resource development.<br />
A shift towards people-oriented forestry is<br />
underway. Thus, overall performance in managing<br />
forest resource is fair with signs of a greater<br />
momentum.<br />
20<br />
References<br />
ADB, GEF & UNDP. 1998. Asia Least-cost<br />
Greenhouse Gas Abatement Strategy - <strong>Myanmar</strong>,<br />
Asian Development Bank, Global Environment<br />
Facility and United Nations Development<br />
Programme, Manila.<br />
Central Statistical Organization (CSO). 2002.<br />
Statistical Yearbook 2002, CSO, the Government<br />
of the Union of <strong>Myanmar</strong>, Yangon.<br />
Slebbing, E.P. 1962. Forest of India”, Volume IV<br />
- quoted in Forestry Situation in <strong>Myanmar</strong>, Forest<br />
Department, 1989, New Delhi: 113.<br />
Food and Agriculture Organization of the United<br />
Nations (FAO). 2000. Global Forest <strong>Assessment</strong><br />
2000, Food and Agriculture Organization, Rome.<br />
Available: www.fao.org/forestry/fo/fra/main/<br />
index.jsp<br />
Forest Department (FD).1989. Forestry Situation<br />
in <strong>Myanmar</strong>, Forest Department, Ministry<br />
of Agriculture, Livestock and Forestry, the<br />
Government of the Union of <strong>Myanmar</strong>, Yangon.<br />
Forest Department (FD).1991.Forest Resource<br />
of <strong>Myanmar</strong>, Ministry of Agriculture, Livestock<br />
and Forestry, the Government of the Union of<br />
<strong>Myanmar</strong>, Yangon.<br />
Forest Department (FD).1994. Note on <strong>Myanmar</strong><br />
Forestry, unpublished departmental paper, Forest<br />
Department, Ministry of Forestry, the Government<br />
of the Union of <strong>Myanmar</strong>, Yangon.<br />
Forest Department (FD). 2005. Data related to<br />
environmental indicator development for <strong>National</strong><br />
<strong>Performance</strong> <strong>Assessment</strong> SEF II, submission to<br />
<strong>National</strong> <strong>Environmental</strong> Commission for Affairs<br />
by Forest Department, Ministry of Forestry,<br />
the Government of the Union of <strong>Myanmar</strong>, Ref:<br />
Planning/020/611-612/05, Yangon.<br />
Ministry of Forestry (MOF).1996. <strong>Myanmar</strong><br />
Forest Policy, 1995, Policy Statement, Ministry<br />
of Forestry, the Government of the Union of<br />
<strong>Myanmar</strong>, Yangon,<br />
Ministry of Forestry (MOF). 2001a. Forestry<br />
Master Plan for the period of 2001/02 to<br />
2030/31, Volume I, Ministry of Forestry (MOF),<br />
the Government of the Union of <strong>Myanmar</strong>,<br />
Yangon.<br />
Ministry of Forestry (MOF). 2001b. Forestry<br />
Master Plan for the period of 2001/02 to<br />
2030/31, Volume II, Ministry of Forestry (MOF),<br />
the Government of the Union of <strong>Myanmar</strong>,<br />
Yangon.
Ministry of Information (MOI). 2002. <strong>Myanmar</strong><br />
Facts and Figures 2002, Ministry of Information,<br />
the Government of the Union of <strong>Myanmar</strong>,<br />
Yangon.<br />
<strong>National</strong> Commission for <strong>Environmental</strong> Affairs<br />
(NCEA).1999.Harmonizing of <strong>Environmental</strong><br />
Information Database, ASEAN State of the<br />
Environment <strong>Report</strong> 2000, departmental office file<br />
of <strong>National</strong> Commission for <strong>Environmental</strong> Affairs,<br />
the Government of the Union of <strong>Myanmar</strong>, Ref no:<br />
6-01/32/98, Yangon.<br />
<strong>National</strong> Commission for <strong>Environmental</strong> Affairs<br />
(NCEA) 2004. Second Country <strong>Report</strong> for United<br />
Nations Convention on Combating Desertification,<br />
<strong>National</strong> Commission for <strong>Environmental</strong> Affairs,<br />
the Government of the Union of <strong>Myanmar</strong>,<br />
Yangon.<br />
Ohn, U.1999. The Promotion of Private Initiative<br />
for Forest Sector Development, Technical Paper –<br />
No.15, Forest Resource Environment Development<br />
and Conservation Association, Yangon.<br />
Saw El Dah. 2004.Teak and Forest Management<br />
in <strong>Myanmar</strong>, ITTO Tropical Forest Update 14 (1),<br />
ITTO Yokohama. Available: http:// www.itto.or.jp<br />
2. tHreAts to BioDiversity<br />
2.1. context<br />
35. <strong>Myanmar</strong> is a country of exceptional<br />
ecological biodiversity featuring lowland wet<br />
evergreen forests in the southern part of the<br />
country, deciduous Dipterocarp forests and thorn<br />
scrub in the central part and sub-alpine forests<br />
in the north. Large, slow-flowing rivers and large<br />
lakes support freshwater ecosystems and the<br />
extensive seacoast with tidal mangroves supports<br />
marine ecosystems (UNDP/FAO, 1983).<br />
36. The wildlife of <strong>Myanmar</strong> is equally diverse. It<br />
includes, among others, most of the larger Indo-<br />
Malayan mammals. The Taninthari Division in the<br />
south is characteristics of Malaysian rain forests.<br />
By contrast, in the mountainous area of Kachin<br />
State in the extreme north, the fauna is typically<br />
Himalayan. Based on a World Wildlife Fund (WWF)<br />
definition, <strong>Myanmar</strong> includes all or part of seven<br />
Global-200 eco-regions (Olson and Dinerstein,<br />
1988, Dinerstein et al., 1999).<br />
37. The Indo-<strong>Myanmar</strong> “hot-spot” is known as<br />
one of the most threatened areas globally and<br />
is one of the eight hotspots likely to lose most<br />
plants and vertebrates as a result of continued<br />
21<br />
forest cover loss (Brooks et al., 2002). Throughout<br />
the hotspot, a combination of economic<br />
development and human population growth is<br />
placing increasing pressure on natural habitats<br />
and species populations. While these trends are<br />
currently not as pronounced in <strong>Myanmar</strong>, the<br />
country is becoming increasingly exposed to<br />
external economic forces, including demand for<br />
timber and wildlife products. (CI, 2004).<br />
38. As the designated agency for biodiversity<br />
conservation in <strong>Myanmar</strong>, the Ministry of Forestry<br />
(MOF) through its 30-year Master Plan (MOF,<br />
2001) has identified the following major threats to<br />
biodiversity:<br />
a. Conversion of closed forests for other land<br />
uses.<br />
b. Shifting cultivation by hill tribes.<br />
c. Importing and introduction of invasive<br />
species without proper supervision and<br />
monitoring.<br />
d. Lack of modern and appropriate fishing<br />
gear and equipment and un-controlled use<br />
of chemicals in ocean and fresh waters<br />
causing pollution.<br />
e. Weak regulation and control of commercial<br />
exploitation and trade in endangered flora<br />
and fauna.<br />
f. Lack of <strong>Environmental</strong> Impact <strong>Assessment</strong><br />
and integration of biodiversity concerns in<br />
development activities affecting land use<br />
change.<br />
2.2. state<br />
39. <strong>Myanmar</strong> is far from having completed an<br />
inventory of its biological resources and there are<br />
many conflicting figures on the number of existing<br />
species of both fauna and flora in the literature.<br />
Therefore, a state indicator, which is sensitive to<br />
both nationally threatened and globally threatened<br />
species, is not feasible at this time.<br />
Indicator: Threatened Species as a Percentage of<br />
Globally Threatened Species – 1996-2004<br />
40. The selected indicator tracks the number of<br />
threatened species over time and is expressed<br />
as the percentage of the number of threatened<br />
species at the national level over the number of<br />
threatened species at the global level. Threatened<br />
species are those defined by the International
Union for the Conservation of Nature (IUCN)<br />
(World Conservation Union) as vulnerable,<br />
endangered or critically endangered in the “Red<br />
List of Threatened Species”. Extinct or lower<br />
risk (conservation dependent, near threatened or<br />
least concern) do not form part of the indicator.<br />
Species under consideration include mammals,<br />
birds, reptiles, amphibians and fish; plant and<br />
insect species, for which the process of evaluation<br />
has only just begun, are excluded from the<br />
indicator figures.<br />
41. As can be observed from the 2004 data in<br />
Figure 2.1, <strong>Myanmar</strong> is a tentative sanctuary to<br />
approximately 2.4% of the globally threatened<br />
species (mammals, birds, reptiles and fish). This<br />
standing includes approximately 3.6% of globally<br />
threatened mammals, 4% of birds, 8.6% reptiles,<br />
and 1.3% of globally threatened fish. As of 2004<br />
there were no globally threatened amphibians,<br />
which have sanctuary in <strong>Myanmar</strong>.<br />
42. It is highlighted here that the rise in the share<br />
of globally threatened species from 0.91% in<br />
1996 to 2.41% in 2004 is largely attributed to<br />
the progress of the evaluation work of IUCN and<br />
is not necessarily indicative of a trend of loss of<br />
biodiversity in <strong>Myanmar</strong> during 1996 to 2004.<br />
The 0.91% value in 1996 is based on the first<br />
version of the IUCN Red Book, when most relevant<br />
mammals, some reptiles and some fish species<br />
had been evaluated but at which time amphibians<br />
and birds were not yet part of the equation. The<br />
Figure 2.1: threatened species as a Percentage of Globally threatened species<br />
(1996 to 2004)<br />
Threated Spp As % of Glob<br />
threatened spp<br />
10.0%<br />
9.0%<br />
8.0%<br />
7.0%<br />
6.0%<br />
5.0%<br />
4.0%<br />
3.0%<br />
2.0%<br />
1.0%<br />
0.0%<br />
1996 2000 2002 2003 2004<br />
mamal bird<br />
reptile amphibians<br />
f ish Total<br />
22<br />
bulk of the relevant reptiles were not evaluated<br />
until year 2000 and relevant amphibians and<br />
birds were not evaluated until year 2004.<br />
Therefore the indicator value and the trend before<br />
2004 have very little meaning.<br />
43. Subsequent to 2004 and now that the<br />
indicator value is inclusive of all threatened<br />
species tracked by this indicator, the future<br />
value of the indicator will be more indicative of<br />
the trend in the loss of biodiversity in <strong>Myanmar</strong>.<br />
It is not expected to vary dramatically from<br />
the 2004 figures. It may artificially rise if new<br />
globally threatened species also have sanctuary in<br />
<strong>Myanmar</strong>; it may artificially fall if new threatened<br />
species have sanctuary outside of <strong>Myanmar</strong>.<br />
Some of this artificial oscillation can already be<br />
observed in the reptile species since 2000. While<br />
the indicator serves well to measure <strong>Myanmar</strong>’s<br />
share of the global priority, only changes in the<br />
status of individual species (as detailed in the<br />
relevant fact sheet) can be utilized to measure<br />
progress at the national level. Any future decrease<br />
in the level of endangerment of the listed species,<br />
or the removal of the species from the list, is<br />
indicative of progress in conserving biodiversity;<br />
any future increase in the level of endangerment<br />
will be a negative indication of progress.<br />
44. With regards to the degree of vulnerability of<br />
these threatened species, as of 2004, 75 species<br />
were listed as vulnerable, 34 as endangered and<br />
16 as critically endangered. It is also observed
that not all of <strong>Myanmar</strong>’s share of the globally<br />
threatened species is endemic to <strong>Myanmar</strong> and<br />
therefore <strong>Myanmar</strong> alone is not solely responsible<br />
for its 2.4% share of globally threatened species.<br />
However, 88 of the threatened species, including<br />
5 reptile species, are endemic to <strong>Myanmar</strong> and for<br />
another 5 threatened species, <strong>Myanmar</strong> and one<br />
of its GMS neighbors share the responsibility. It<br />
was also observed that 15 of <strong>Myanmar</strong>’s current<br />
125 threatened species are endemic within GMS<br />
countries.<br />
Suggested Rating: Average<br />
with No Observable<br />
Trend<br />
Justification: In comparison with other GMS’s<br />
countries, <strong>Myanmar</strong>’s 2.4% of globally threatened<br />
species is slightly below the average of all GMS<br />
countries combined. Reptiles are the largest<br />
contributors to <strong>Myanmar</strong>’s share of the threatened<br />
species and, as noted above, <strong>Myanmar</strong> is currently<br />
void of amphibian species on its threatened list.<br />
The number of threatened reptile species (26) is<br />
above average in <strong>Myanmar</strong> but only 5 of these<br />
threatened reptile species are endemic to <strong>Myanmar</strong>.<br />
However <strong>Myanmar</strong> alone is not accountable for<br />
all of these threatened reptile species. But at the<br />
same time, <strong>Myanmar</strong> could provide safe heaven to<br />
a relatively high proportion of globally threatened<br />
reptiles. Based on this comparison it is concluded<br />
that the current state of biodiversity in <strong>Myanmar</strong><br />
is on average with other GMS countries, with no<br />
observable past trends and an expectation that the<br />
global share of <strong>Myanmar</strong>’s threatened species will<br />
remain constant in the very near future.<br />
2.3 Pressure<br />
45. The state indicator analysis has also provided<br />
some insight as the habitats of the threatened<br />
species in <strong>Myanmar</strong> and the major threats to<br />
those threatened species. Forests were identified<br />
as the dominant habitat for approximately 36%<br />
of the threatened mammals and birds but loss of<br />
wetlands and grasslands were equally important<br />
to threatened bird species. Therefore pressure<br />
indicators which attempt to track the loss of<br />
habitat are an appropriate choice.<br />
23<br />
46. Loss of forest cover has already been<br />
addressed under the forest resources concern<br />
and there is no need to repeat such indicator<br />
here. Instead, the loss of tropical rain forest was<br />
selected as one pressure indicator and the loss of<br />
mangroves as another. Loss of tropical rain forest<br />
is based on existing land use studies in Taninthari<br />
Division where most tropical rain forests are<br />
found in <strong>Myanmar</strong>. Loss of mangroves is based<br />
on the results of historical land use monitoring<br />
in the Delta Forest Reserve. This forest reserve<br />
is by no means inclusive of all mangrove forests<br />
in <strong>Myanmar</strong> but the trends observed there may<br />
well be representative of the loss of mangroves<br />
throughout the country.<br />
1 st Indicator: Loss of Tropical Rainforest in Taninthari<br />
Division from 1990-2000<br />
47. As can be observed from Figure 2.2, the area<br />
of rainforests (closed forest) in Taninthari Division<br />
declined from 24603 km 2 (or approximately 32%)<br />
of the division area in 1990 to 17,820 km2 (or<br />
23%) of the division area in 2000. This translates<br />
to a 9% loss of tropical rain forest over the 10year<br />
period and there was very little observed<br />
loss, if not a gain, in the period prior to 1990.<br />
The accelerated rate of deforestation, including<br />
the decline of tropical rain forests, substantially<br />
coincides with the 1988 open market economy<br />
and the competition from competing land uses.<br />
48. The loss of 6,783 km2 of tropical rain forest<br />
is counter-balanced by a 4,772 km 2 increase in<br />
the area of degraded forest which increased from<br />
9,820 km 2 in 1990 to 14,593 km 2 in 2000. The<br />
transition from tropical rain forest to degraded<br />
forest is even higher than this in the land use<br />
change matrix and in fact 6,350 km 2 were lost<br />
from closed forest to degraded forest. Given the<br />
closure of all forest concessions along the Thai-<br />
<strong>Myanmar</strong> border in 1992/93, the loss of tropical<br />
forests in Taninthari Division strongly points to<br />
existence of illegal logging. Palm oil plantations<br />
may also be a contributing factor.
Figure 2.2: change of rainforest in taninthari Area<br />
square kilometer<br />
30,000<br />
25,000<br />
20,000<br />
15,000<br />
10,000<br />
5,000<br />
Suggested Rating: High<br />
and Increasing<br />
Justification: When compared with the national<br />
deforestation rate of 1.2% for the same period, the<br />
deforestation rate of 2.8% in the tropical rain forest<br />
of Taninthari Division is high. Given the continued<br />
pressures from illegal activities and competing land<br />
uses, there does not appear to be any immediate<br />
sign that the pressures will be reduced.<br />
2 nd Indicator: Loss of Mangroves in Delta Forest<br />
Reserve – 1924-2001<br />
-<br />
1990 2000<br />
Tropical rain forest area<br />
Degrated forest area<br />
Rain forest cover<br />
Degrated forest cover<br />
24<br />
35%<br />
30%<br />
25%<br />
20%<br />
15%<br />
10%<br />
5%<br />
0%<br />
Source: Forest Department & Food & Agriculture Organization (2005)<br />
forest cover as % of total land<br />
Figure 2.3: change of Delta Mangrove Area<br />
300,000<br />
250,000<br />
200,000<br />
150,000<br />
100,000<br />
50,000<br />
-<br />
Hectares<br />
49. As can be observed from Figure 2.3,<br />
mangrove forests in the Delta Forest Reserve<br />
declined at an alarming rate from 253,018 ha<br />
in 1924 to 111,939 ha in 2001. Approximately<br />
44% of the original mangroves remain. The<br />
increase in the area of rice cultivation during the<br />
past 25 years is probably the main contributing<br />
factor. The cultivated area is now more than half<br />
the total reserve area. Fuelwood extraction for<br />
charcoal production was also a contributing factor<br />
in the 1980s but was banned in 1990. Shrimp<br />
farming is now the main contributor to the loss of<br />
mangrove forest in the delta area.<br />
1924 1974 1983 1995 2001<br />
Mangrove Cultivation Others<br />
Source: Forest Department (2005)
Suggested Rating: High<br />
and increasing<br />
Justification: Despite a decade-long ban on the<br />
use of mangroves for charcoal, the pressure on the<br />
remaining mangrove forest from competing land<br />
uses (rice cultivation and shrimp farming) remains<br />
high. Unless drastic measures are taken, there will<br />
be a continued decline of mangrove forests in the<br />
delta.<br />
2.4 response<br />
50. In the past, the most effective means of<br />
protecting threatened species was to enact<br />
laws which had the aim to ensure the species’<br />
future existence. <strong>Myanmar</strong> has a long history of<br />
protecting species, starting with the Elephant<br />
Preservation Act of 1897, the Wild Bird and<br />
Animals Protection Acts of 1912 and 1936 and<br />
the Protection of Wildlife and Wild Plants and<br />
Conservation of Natural Areas Law proclaimed<br />
in 1994 (Forest Department 1991. pp: 10-11,<br />
NCHRD 2002.pp:274-275). The development of<br />
an indicator, which attempts to track the number<br />
of globally threatened species locally protected by<br />
Thousand Hectares<br />
25<br />
law was considered and remains a valid response<br />
indicator for the future. However for the present<br />
exercise and for compatibility with other GMS<br />
countries, an indicator which tracks protected<br />
areas was opted for instead.<br />
51. Protected areas also have a long history in<br />
<strong>Myanmar</strong>. The Pidaung Wildlife Sanctuary and the<br />
Pyin-O-Lwin Bird Sanctuary date back to 1918.<br />
A substantial number of other wildlife and bird<br />
sanctuaries were added throughout the 1920’s,<br />
1930’s and 1940’s. A formal PAS has existed<br />
since the late 1980, however, the management of<br />
protected area was not clarified in the Wild life<br />
Protected and Protected Area Law until 1994.<br />
Indicator: Percentage of Protected Area over Total<br />
Land Area 1918-2004<br />
52. The area under the national Protected Area<br />
System was selected as the response indicator;<br />
the result is expressed as a percentage over total<br />
land area. The trend of the indicator to year 2004<br />
is illustrated in Figure 2.4.<br />
Figure 2.4: Protected Area as a Percentage of total Land 1918-2004<br />
6,000<br />
5,000<br />
4,000<br />
3,000<br />
2,000<br />
1,000<br />
-<br />
1918<br />
1927<br />
1928<br />
1930<br />
1936<br />
Source: Forest Department (2005)<br />
1939<br />
1940<br />
1941<br />
1942<br />
1970<br />
1971<br />
1972<br />
1982<br />
1985<br />
1988<br />
1989<br />
1993<br />
1996<br />
PAS Area Accumulated % PAS Accumulated<br />
1997<br />
2001<br />
2002<br />
2004<br />
8.0%<br />
7.0%<br />
6.0%<br />
5.0%<br />
4.0%<br />
3.0%<br />
2.0%<br />
1.0%<br />
0.0%<br />
Protected Area As % of Total Land
Map 4: existing Wildlife sanctuaries and <strong>National</strong> Parks of <strong>Myanmar</strong><br />
Source: Forest Department 2005<br />
26
53. As illustrated in Figure 2.4 and detailed in<br />
the corresponding fact sheet, the area of PAS<br />
defined in the Wildlife Law of 1994 was about 1%<br />
of the total land area of <strong>Myanmar</strong>. Six additional<br />
protected areas were added in 1996/97 bringing<br />
the total to 1.8% of total land area. Another 9<br />
were added in 2001/2002 bringing the total to<br />
3.4% of total land area.<br />
54. In 2004, notifications were issued to add<br />
another three protected areas, including the<br />
Taninthari Nature Reserve and Hu-kaung Valley<br />
Wildlife Sanctuary (extension) in the northern<br />
forest complex area where biodiversity is<br />
extremely rich. This will extend the system to 39<br />
protected areas equivalent to 7.2% of total land<br />
area, or approximately 4.9 million hectares.<br />
55. Although currently no targets directly<br />
associated with protected areas have been made,<br />
The <strong>National</strong> Forest Policy, which was proclaimed<br />
in 1995, has set an indirect target of having a<br />
forest area equivalent to 5% of the total land<br />
area under the system of protected areas (MOF,<br />
1996, pp: 22). Forestry Master Plan (2001/2002<br />
– 2030/31) adjusted this target to 10 % in the<br />
long term (MOF, 2001, pp: 21), while keeping the<br />
5% for short-term implementation. These short<br />
term and long-term targets are to be achieved<br />
by the budget year 2005/2006 and 2017/2017<br />
respectively (MOF, 2001, pp: 264). Therefore,<br />
present coverage of protected area has already<br />
met the short-term target. However, notable is<br />
the focus on conserving forest-based habitats<br />
(96%). There are only a few areas for protecting<br />
wetlands (0.8%) and marine habitats (3.2%). In<br />
the meantime, it is found that protected area as<br />
percentage of total land is higher in other GMS<br />
countries; e.g. 32% in Cambodia (2002) 8 , 27.5%<br />
in Thailand (2004) 9 and 14% in Lao (1999) 10 .<br />
Here, too, it is important to keep in mind the<br />
limitations of cross-country comparisons based<br />
on area figures only without supplementary<br />
indicators about the effectiveness of protection.<br />
8EPA’s Fact Sheet on Protected Area, SEF II Project, Cambodia (2005)<br />
9EPA’s Fact Sheet on Protected Area, SEF II Project, Thailand (2005)<br />
10ASEAN’s Secretariat (2001), “ASEAN State of the Environment <strong>Report</strong> 2000, pp:96<br />
27<br />
Suggested Rating: Low<br />
But Consistent<br />
Justification: While there has been a good and<br />
consistent effort to expand the PAS over the recent<br />
years, the magnitude of the response and the end<br />
result is considered low in comparison with other<br />
GMS’s countries.<br />
2.5 conclusions<br />
56. Although there is currently no observable<br />
or measurable trend in the biodiversity state<br />
indicator, it is widely accepted that biodiversity<br />
has been diminishing throughout <strong>Myanmar</strong> and<br />
throughout the GMS. <strong>Myanmar</strong>’s 2.4% share of<br />
globally threatened species, which is average by<br />
GMS standards, already highlights the need for<br />
added conservation measures, both in terms of<br />
species protection and habitat protection.<br />
57. In terms of species protection, a preliminary<br />
analysis revealed that only 66 of <strong>Myanmar</strong>’s 125<br />
globally threatened species are protected by law.<br />
However, this law is under review and the revision<br />
aims to take into account these recently identified<br />
species that are threatened at the global level.<br />
58. Loss of habitat is no doubt the largest<br />
threat to biodiversity in <strong>Myanmar</strong>. Overall forest<br />
cover and forest habitats are on the decline and<br />
immediate plans to reduce the loss of forest<br />
cover are urgently needed. Tropical rain forests,<br />
mainly concentrated in Taninthari Division, which<br />
provide habitat to a wide range of threatened<br />
species, seem to be under pressure for other land<br />
uses. Mangrove forests throughout <strong>Myanmar</strong> and<br />
especially in the Delta Forest Reserve are being<br />
lost to competing land uses.<br />
59. On the response side, there has been good<br />
progress in expanding the system of protected<br />
areas. The current 7.2% of total land area could<br />
be regarded as a realization of short-term targets.
However, this target is primarily derived from<br />
forest conservation objectives and there is a<br />
need to accommodate the holistic strategies and<br />
approaches of biodiversity conservation such as<br />
bio-corridor conservation and community-based<br />
nature conservation.<br />
References<br />
ASEAN Secretariat .2001. ASEAN State of the<br />
Environment <strong>Report</strong> 2000, Jakarta.<br />
Brooks, T.M, Mittermeier, R.A Mittermeier, C.G.,<br />
da Fonseca, G.A.B., Rylands, A.B., Konstant, W.R.,<br />
Flick, P., Pilgrim, J., Oldfield, S., Magin, G. and<br />
Hilton-Taylor C. 2002. Habitat loss and extinction<br />
in the hotspots of biodiversity. Conservation<br />
Biology 16:909 – 923.<br />
CI. 2004. Investment Opportunities in Biodiversity<br />
Conservation by Civil Society in <strong>Myanmar</strong>; INDO-<br />
BURMA HOTSPOT. Draft version circulated to<br />
stakeholders for comment by Conservation<br />
International, Yangon.<br />
Dinerstein, E., Powell, G., Olson, D.,<br />
Wikramanayake, E., Abell, R., Loucks, C.,<br />
Underwood, E., Allnut, T., Wettengel, W., Ricketts,<br />
T., Strand, H., O’Connor, S., Burgess, N. and<br />
Mobley, M. 1999. A workbook for conducting<br />
biological assessments and developing<br />
biodiversity visions for eco-region based<br />
conservation. Part I: terrestrial ecoregions.<br />
Washington D.C.:WWF-US Conservation Science<br />
Program.<br />
Forest Department. 1991. Forest Resource of<br />
<strong>Myanmar</strong>, Ministry of Agriculture, Livestock<br />
and Forestry, the Government of the Union of<br />
<strong>Myanmar</strong>, Yangon.<br />
Forest Department. 2005. Data related to<br />
environmental indicator development for <strong>National</strong><br />
<strong>Performance</strong> <strong>Assessment</strong> SEF II. Submission to<br />
<strong>National</strong> <strong>Environmental</strong> Commission for Affairs<br />
by Forest Department, Ministry of Forestry,<br />
the Government of the Union of <strong>Myanmar</strong>, Ref:<br />
Planning/020/611-612/05, Yangon.<br />
Forest Department and Food and Agriculture<br />
Organization.2004. A study on forest resources<br />
and land use changes in the Taninthari Division,<br />
southern part of <strong>Myanmar</strong>”, unpublished<br />
technical paper, Yangon.<br />
IUCN.2004. Red List 2004. Available: http://<br />
www.iucn.org<br />
28<br />
MOF. 1996. <strong>Myanmar</strong> Forest Policy, 1995, Policy<br />
Statement, Ministry of Forestry, the Government<br />
of the Union of <strong>Myanmar</strong>, Yangon.<br />
MOF.2001.Forestry Master Plan for the period<br />
of 2001/02 to 2030/31 Volume I, Ministry of<br />
Forestry (MOF), Yangon.<br />
NCHRD. 2002. <strong>Environmental</strong> Conservation and<br />
Sustainable Development. <strong>National</strong> Center for<br />
Human Resource Development, the Government<br />
of Union of <strong>Myanmar</strong>; Ministry of Education,<br />
Yangon.<br />
Olson, D. and Dinerstein, E. 1998. The Global<br />
200: a representation approach to conserving the<br />
Earth’s most biologically valuable ecoregions.<br />
Conservation Biology 12:502 – 515.<br />
UNDP/FAO. i983. Nature Conservation and<br />
<strong>National</strong> Parks, Burma. Interim <strong>Report</strong>, Food<br />
and Agriculture Organization and United<br />
Nations Development Programme, FO:UNDP/<br />
BUR/80/006, Rangoon.<br />
3. LAND DeGrADAtioN<br />
3.1. context<br />
60. With a total area of 167 million acres,<br />
<strong>Myanmar</strong> is rich in land resources, with adequate<br />
land available for agriculture use and socioeconomic<br />
development. About 21 million acres or<br />
13% of total land area is under cultivation. There<br />
is about 16 million acres of cultivable “wasteland”<br />
that can still be utilized for cropping and animal<br />
husbandry. From 1991 to 2001, the area under<br />
agriculture grew by an average of 0.48% p.a.<br />
while agricultural workforce grew by 1.17% p.a.<br />
(MOAI, 2003, pp: 70).<br />
61. There is a broad consensus in <strong>Myanmar</strong><br />
concerning the existence of untapped land<br />
resources for further agricultural growth despite<br />
signs of land degradation in some areas.<br />
62. Official data indicate that problem soils<br />
occupy an area of about 2.4 million acres,<br />
accounting for about 5.3% of the total cultivable<br />
land area of 44.5 million acres. Of this about<br />
0.74 million acres are acid sulphate soils,<br />
degraded soils, peat soils and swampy soils<br />
while saline and alkaline soils accounted for<br />
the remaining 1.63 million acres (Kyi Win &<br />
Tin Hla, 1999). Key factors characterizing land<br />
degradation have been summarized as (NCEA<br />
1997):
1. Soil erosion and degradation in the hilly<br />
region and dry zone,<br />
2. Salinity problems occurring in delta and<br />
coastal areas,<br />
3. Alkalinity problems especially in dry zones,<br />
4. Acidity problems in some laterite soil areas,<br />
5. Seasonal flooding in low-lying agriculture<br />
land.<br />
63. Within the constraints of time and data<br />
availability soil erosion has been adopted as the<br />
major land degradation issue for evaluation under<br />
this EPA.<br />
Other land<br />
27%<br />
Other<br />
Woodland<br />
28%<br />
Source: Statistical Yearbook (CSO, 2003)<br />
Figure 3.1: Land use in <strong>Myanmar</strong><br />
Net A rea<br />
Sow n<br />
13%<br />
29<br />
3.2. state<br />
Indicator: Vulnerable Farm Area as a Percentage of<br />
Total Cultivated Area 1998<br />
64. This is a commonly used indicator for<br />
assessing state of land degradation; and for<br />
tracking the total extent of vulnerable farming<br />
area in the sub-administrative areas of the<br />
country i.e., State and Division. It is expressed in<br />
acres. Vulnerable farming area is defined as the<br />
area of cultivated land susceptible to soil erosion,<br />
located at altitudes of 1000 feet and above with<br />
the slopes of 10 degrees and above.<br />
Fa llo w<br />
Land<br />
1%<br />
Reserved<br />
Fores ts<br />
21%<br />
C u ltiv a b le<br />
w aste<br />
la n d<br />
10%
Map 5: Distribution of shifting cultivation Above 10% slope in <strong>Myanmar</strong><br />
Source: Forest Department 2005<br />
30
Figure 3.2: vulnerable Farming Areas within respective sub Administrative Areas 1998<br />
Thousand acres<br />
9,000<br />
8,000<br />
7,000<br />
6,000<br />
5,000<br />
4,000<br />
3,000<br />
2,000<br />
1,000<br />
-<br />
Kachin<br />
Kayah<br />
State & Division<br />
Source: Remote Sensing and Geographical Information System Section, Forest Department 2005<br />
65. Two hundred and thirteen townships<br />
accounting for 66% of total administrative<br />
townships in <strong>Myanmar</strong> are located in the upland<br />
area of the country. The degree of risk associated<br />
with soil erosion in these areas is relatively high.<br />
The 1998 Forests Department RS/GIS data<br />
indicate that total vulnerable farming area with<br />
slopes of 10˚ and more in these upland townships<br />
was estimated to be 4.8 million acres. Prominent<br />
amongst them were the Shan State (1.6 million<br />
acres), Sagaing Division (1.1 million acres)<br />
and Chin State (0.8 million acres) followed by<br />
Mandalay Division, Kayin State, Kachin State and<br />
Kayah States with smaller areas affected at 0.32,<br />
0.31, 0.18 and 0.16 million acres respectively.<br />
In comparing vulnerable farming area with total<br />
cultivated area, the highest percentages of<br />
vulnerable farming area were found in Chin State<br />
(76%), Kayah State (31%), Kayin State (24%) and<br />
Shan State (20%). On the whole, the data reveal<br />
that 10% of total cultivated land throughout the<br />
country is vulnerable to higher risk in soil erosion.<br />
Kayin<br />
Chin<br />
Sagaing<br />
Taninthayi<br />
Bago<br />
Magway<br />
Vulnerable Farming Area Total Cultivated Land % of Vulnerable Farm Land<br />
31<br />
Mandalay<br />
Mon<br />
Rakhine<br />
Yangon<br />
Shan<br />
Ayeyarwaddy<br />
80%<br />
70%<br />
60%<br />
50%<br />
40%<br />
30%<br />
20%<br />
10%<br />
0%<br />
Percent as of Total<br />
Cultivated Land<br />
66. Soil conservation schemes and projects have<br />
been implemented in Shan and Chin States. The<br />
figures quoted above would suggest that similar<br />
programs are also needed in Kayah, Kayin, Kachin<br />
and Sagain. Findings of the study “Soil Loss in<br />
Chindwin Watershed” (Nilar Aye, 2004) for Kachin,<br />
Sagain and Chin found that total area subject<br />
to severe soil erosion had increased from 4,799<br />
km2 in 1990 to 36,429 km2 in 2002 primarily<br />
due to rapid deterioration of vegetation cover. Soil<br />
susceptibility to erosion appears to have been the<br />
single largest factor in land degradation. However,<br />
due to data deficiencies more work is required to<br />
produce a more secure assessment of vulnerable<br />
farming area across the country.
Suggested Rating:<br />
Average with<br />
undetermined trend<br />
Justification: Soil erosion is a key factor in making<br />
agricultural land vulnerable to land degradation in<br />
<strong>Myanmar</strong>. About 10% of total cultivated land in the<br />
country is estimated to be vulnerable to severe soil<br />
erosion. Severely affected areas include Shan State,<br />
Sagaing Division and Chin State. Soil erosion in the<br />
upland regions of <strong>Myanmar</strong> is primarily a result of<br />
farming on steep lands (10 degrees or above). As<br />
data were only available for a single year (1998),<br />
the trend is undetermined. As a percentage of total<br />
cultivated land, the existing vulnerable farming area<br />
is considered to be average.<br />
3.3 Pressure<br />
Indicator: Growth in Upland Population 1980-2000<br />
67. This indicator tracks the rate of change in the<br />
population of those townships within states or<br />
divisions that are either partially or fully located<br />
in upland areas. Population data are amongst<br />
population growth rate<br />
35.0%<br />
30.0%<br />
25.0%<br />
20.0%<br />
15.0%<br />
10.0%<br />
5.0%<br />
0.0%<br />
Kachin<br />
Kayah State<br />
Kayin State<br />
Chin State<br />
Sagaing Division<br />
Taninthayi Division<br />
32<br />
the most comprehensively collected in GMS<br />
and changes in population are agreed to be an<br />
important driver of land use –and, indirectly, land<br />
productivity-- change, especially in upland areas;<br />
hence the choice of population as a pressure.<br />
Uplands areas are defined here as areas with<br />
altitudes of 1000 feet or more above sea level.<br />
Without recent occupation surveys for upland<br />
areas it is assumed that the majority of the<br />
population residing in upland areas are engaged<br />
in agriculture and other land related activities.<br />
68. As of 2000, the upland population of 21<br />
million accounted for almost 42% of national<br />
population. The population growth rates were<br />
3.3% per annum in Kayah State, 2.1% per annum<br />
in Shan State, 1.5% per annum in Chin State<br />
and 1.4% per annum in Kachin Sate against<br />
the national average of 2% per annum. Except<br />
in Shan State, the general trend of population<br />
growth rates has been up between the period<br />
1980-1990 and 1990-2000.<br />
Figure 3.3: Percentage of change in Population in upland Areas<br />
Bago Division<br />
population grow ht rate for 1980 to 1990 population grow ht rate for 1990 to 2000<br />
Source: Adapted from Department of Population, DOP 2004 by authors of the report<br />
Magway Division<br />
Mandalay Division<br />
Mon State<br />
Rakhin State<br />
Shan State<br />
Ayeyarwaddy
69. Population increase in the upland areas has<br />
led to increased farming including the use of<br />
unsustainable farming practices. The relationship<br />
between farming vulnerability and population<br />
growth rates, however, is not clear cut with<br />
areas of high vulnerability including both areas<br />
of above-average and below-average population<br />
growth rates.<br />
Suggested Rating: Medium<br />
and Steady<br />
Justification: From 1980 to 2000, the population of<br />
upland areas grew by 6.8 million reaching 21 million,<br />
accounting for 42% of the national population. On<br />
the whole, population growth in upland areas is<br />
not significantly different from the national average<br />
although important differences exist among different<br />
upland areas. The pressure resulting from this<br />
growth is deemed to be medium and steady.<br />
3.4 response<br />
Indicator: Land Rehabilitated as a Percentage of Area<br />
Sown to Crops 1974-2002<br />
70. This indicator tracks the area of agricultural<br />
land under various conservation and rehabilitation<br />
programs (here, for simplicity referred to as<br />
rehabilitation programs) as a percentage of<br />
total area sown to crops, nation-wide. Details of<br />
different rehabilitation programs are given in the<br />
relevant fact sheet. The area of rehabilitated land<br />
is among response indicators suggested by OECD.<br />
71. Ministry of Agriculture and Irrigation is<br />
responsible for undertaking land rehabilitation<br />
including the promotion of terracing, contour<br />
bund making, sloping agriculture land technology<br />
(SALT), agriculture extension activities including<br />
the use of organic fertilizers as well as flood<br />
management and prevention of saline water<br />
intrusion.<br />
72. In 2003, the total area under land<br />
rehabilitation was 3.4 million acres which was<br />
0.3 million acres (or 10%) more than in 1989.<br />
Most of the area included multipurpose irrigation<br />
management schemes. Other land conservation<br />
and rehabilitation activities such as flood<br />
33<br />
control, organic farming, erosion control, soil<br />
improvement measures and agricultural extension<br />
in general have been receiving increasing levels of<br />
official attention.<br />
73. However, as Figure 3.4 shows, the percentage<br />
of rehabilitated area has averaged around 10%<br />
and seen a decline since 1989/90. The total area<br />
of sown crops has simply grown faster than the<br />
rate of land rehabilitation. The growing population<br />
of upland areas is largely responsible for the<br />
former. In addition, multiple cropping has become<br />
more common and conservation programs have<br />
not kept pace. The data can be interpreted in<br />
several different ways, either as suggesting that<br />
farming is become more sustainable and fewer<br />
conservation and rehabilitation measures are<br />
needed than before, or that the proportionately<br />
lower level of conservation measures observed<br />
in recent years merely stokes up the problem of<br />
land degradation that will eventually show up in<br />
the value of the state indicator. A re-estimation of<br />
the 1998 figures of the percentage of vulnerable<br />
lands might help to throw more light on the<br />
nature of the relationship. No information is<br />
available to assess the progress under MOAI’s<br />
land rehabilitation targets.<br />
Suggested Rating: Low<br />
and Intermittent<br />
Justification: On average, 3 million acres of<br />
agriculture land have been included each year in<br />
some form of land conservation and rehabilitation<br />
program of the Ministry of Agriculture and Irrigation.<br />
However, the growth of areas under crops has<br />
outpaced these rehabilitation efforts. Not enough<br />
information is available for now to assess of the<br />
effectiveness of land rehabilitation programs.
Figure 3.4: Land rehabilitated as % of total crop sown Area<br />
Thousand acres<br />
45,000<br />
40,000<br />
35,000<br />
30,000<br />
25,000<br />
20,000<br />
15,000<br />
10,000<br />
5,000<br />
-<br />
1974-75<br />
1984-85<br />
1989-90<br />
1990-91<br />
1991-92<br />
1992-93<br />
1993-94<br />
1994-95<br />
1995-96<br />
1996-97<br />
1997-98<br />
1998-99<br />
1999-00<br />
2000-01<br />
2001-02<br />
2002-03<br />
Total Rehabilitated Acre Total Crop Sown Area<br />
% of Rehabilitated Area<br />
3.5 conclusions<br />
74. Several factors contribute to agricultural land<br />
degradation in <strong>Myanmar</strong>. Key amongst those<br />
factors is soil erosion. Around 42% of <strong>Myanmar</strong>’s<br />
population resided in upland areas (areas located<br />
at 1000 feet and more above the sea level), at the<br />
turn of the decade resulting in increased level of<br />
human activity in particular agriculture. Growth in<br />
agriculture has outpaced the rehabilitation efforts<br />
by the government. However, government has been<br />
taking steps to stem the impact of soil erosion<br />
and other associated impacts. Some of the key<br />
initiatives and programs being implemented by<br />
the government include:<br />
a. <strong>National</strong> Action Plan to Combat<br />
Desertification, United Nations Convention<br />
to Combat Desertification (NCEA, 2002)<br />
b. Watershed Management Plan, for<br />
conserving 52 catchments of newly<br />
constructed dams, Forest Department,<br />
(MOF, 2002)<br />
Source: Department of Agriculture Planning, DAP 2005, and<br />
Statistical Yearbooks, CSO 1980, 1991, 1997, 2003<br />
34<br />
14.00<br />
12.00<br />
10.00<br />
8.00<br />
6.00<br />
4.00<br />
2.00<br />
0.00<br />
Percent as of total sown acre<br />
c. Management of Development Activities in<br />
the Highland of Border Areas, to reducing<br />
slash and burn cultivation on sloping<br />
lands by hill tribe people, Department for<br />
Progress of Border Area and <strong>National</strong> Race<br />
(MOI 2003, pp:227-232)<br />
d. Planning Highland Reclamation for Period<br />
2003 to 2007, Ministry of Agriculture and<br />
Irrigation (MOI 2003)<br />
e. Implementation of community based<br />
natural resource management activities,<br />
International and Local Non-Governmental<br />
Organizations (NCEA, 2000)<br />
75. In spite of the above initiatives more work<br />
is needed to safeguard the productivity of the<br />
upland farms in conditions of growing upland<br />
population. The Ministry of Agriculture and<br />
Irrigation has taken the lead in implementing the<br />
programs for land management. It has set targets<br />
for reclaiming 111,900 acres of permanent<br />
sloping agriculture land; 223,816 acres of slash<br />
and burn area in the period from 2003 to 2007 in<br />
Eastern and Northern Shan State and Chin State.
Suggested Rating: Low and<br />
Intermittent<br />
Justification: On average, 3 million acres of<br />
agriculture land have been included each year in<br />
some form of land conservation and rehabilitation<br />
program of the Ministry of Agriculture and<br />
Irrigation. However, the growth of areas under crops<br />
has outpaced these rehabilitation efforts.<br />
Not enough information is available for now to assess<br />
of the effectiveness of land rehabilitation programs.<br />
References<br />
CSO. 1980. <strong>National</strong> Statistical Yearbook – 1980.<br />
Central Statistical Organization, the Government<br />
of the Union of <strong>Myanmar</strong>, Yangon.<br />
CSO. 1991. <strong>National</strong> Statistical Yearbook – 1991.<br />
Central Statistical Organization, the Government<br />
of the Union of <strong>Myanmar</strong>, Yangon.<br />
CSO. 1997. <strong>National</strong> Statistical Yearbook – 1997.<br />
Central Statistical Organization, the Government<br />
of the Union of <strong>Myanmar</strong>, Yangon.<br />
CSO. 2003. <strong>National</strong> Statistical Yearbook – 2003.<br />
Central Statistical Organization, the Government<br />
of the Union of <strong>Myanmar</strong>, Yangon.<br />
DAP. 2005. Agriculture Data for <strong>Environmental</strong><br />
<strong>Performance</strong> <strong>Assessment</strong>. Submission of<br />
Department of Agriculture Planning, Ministry of<br />
Agriculture and Irrigation to <strong>National</strong> Commission<br />
for <strong>Environmental</strong> Affairs, the Government of the<br />
Union of <strong>Myanmar</strong>, Yangon.<br />
DOP. 2004. Township Population Density for<br />
1980, 1990 and 2000.Submittal to <strong>National</strong><br />
Commission for <strong>Environmental</strong> Affairs by<br />
Department of Population, Ref.No: 102/Sa-1(15-<br />
Nga)-2374/Pa-tha-Aa), Dated December 17th<br />
2004, Yangon.<br />
Forest Department. 2005. Data related to<br />
environmental indicator development for <strong>National</strong><br />
<strong>Performance</strong> <strong>Assessment</strong> SEF II Submission to<br />
<strong>National</strong> <strong>Environmental</strong> Commission for Affairs<br />
by Forest Department, Ministry of Forestry,<br />
the Government of the Union of <strong>Myanmar</strong>, Ref:<br />
Planning/020/611-612/05, Dated February 21,<br />
2005, Yangon.<br />
35<br />
Kyi Win and Tin Hla. 1999. Current <strong>National</strong><br />
Agriculture and Food Situation of <strong>Myanmar</strong>.<br />
Technical Paper of Ministry of Agriculture and<br />
Irrigation, The Government of the Union of<br />
<strong>Myanmar</strong>, Yangon.<br />
MOAI 2003 <strong>Myanmar</strong> Agriculture At A Glance.<br />
Department of Agriculture Planning, Ministry of<br />
Agriculture and Irrigation, the Government of the<br />
Union of <strong>Myanmar</strong>, Yangon.<br />
MOF. 2002.Summary of 30 Years Plan for the<br />
period from 2001-2002 to 2030-2031. Ministry<br />
of Forestry, The Government of the Union of<br />
<strong>Myanmar</strong>, Yangon.<br />
MOI. 2003.Magnificent <strong>Myanmar</strong>, Ministry of<br />
Information, the Government of the Union of<br />
<strong>Myanmar</strong>, Yangon.<br />
NCEA. 1997.<strong>Myanmar</strong> Agenda 21. <strong>National</strong><br />
Commission for <strong>Environmental</strong> Affairs, the<br />
Government of the Union of <strong>Myanmar</strong>, Yangon.<br />
NCEA. 2000.<strong>National</strong> <strong>Report</strong> on UNCCD<br />
implementation. <strong>National</strong> Commission for<br />
<strong>Environmental</strong> Affairs, The Government of the<br />
Union of <strong>Myanmar</strong>, Yangon.<br />
NCEA. 2002. Second <strong>National</strong> <strong>Report</strong> on UNCCD<br />
implementation. <strong>National</strong> Commission for<br />
<strong>Environmental</strong> Affairs, the Government of the<br />
Union of <strong>Myanmar</strong>, Yangon.<br />
Nilar Aye. 2004. Developing Hydrologic<br />
Flood Control Model for Chindwin Watershed<br />
Conservation Planning and Management. Ph.D<br />
Dissertation, Yangon Technology University,<br />
Yangon.<br />
4. WAter resources<br />
4.1. context<br />
76. Due to favorable climatic conditions and<br />
large river basins that cover 90% of the country’s<br />
area, <strong>Myanmar</strong> is perceived as a low water stress<br />
country. In terms of available water resources,<br />
<strong>Myanmar</strong> stands at 14th position globally and 5th<br />
position in the Asian region. There are altogether<br />
eight major river basins and it is estimated<br />
that the surface and groundwater potential of<br />
<strong>Myanmar</strong> is 876 and 400 million acre feet per<br />
annum respectively (Zaw Win, 2004).
iver Basin No<br />
table 4.1: Average Annual Water resource Potential by river Basin<br />
Name of river<br />
Basin<br />
Drainage area<br />
(square mile)<br />
36<br />
surface Water<br />
(Million Acre<br />
Feet)<br />
Ground Water<br />
(Million Acre<br />
Feet)<br />
I Chindwin 44,500 114.5 46.6<br />
II Upper Ayeyarwady 74,600 184.7 75.0<br />
III Lower Ayeyarwady 36,900 69.5 124.1<br />
IV Sittoung 18,600 65.8 23.0<br />
V Rakhine State 22,500 112.8 33.8<br />
VI Taninthari Division 15,700 106.1 31.8<br />
VII Thanlwin 61,000 209.0 60.6<br />
VIII Mekong 11,000 14.3 5.7<br />
Source: Irrigation Department, 2005<br />
77. However, making this abundant water<br />
resource available for human use requires<br />
investment and currently that remains a challenge<br />
for the country’s planners and decision makers.<br />
According to a 2000/2001 assessment by the<br />
Irrigation and Water Utilization Departments,<br />
total annual water consumption was roughly 25.7<br />
million acre feet, approximately 2% of the total<br />
water potential annually available as groundwater.<br />
By sectors, 89% of annual water consumption<br />
was for agriculture use, whereas water for<br />
domestic and industry uses accounted for 10%<br />
and 1% respectively.<br />
Total 284,800 876.7 400.6<br />
78. The inability to translate abundant water<br />
resources into reliable water supply results in<br />
seasonal water shortage in some regions of the<br />
country, particularly in the dry zone of central<br />
<strong>Myanmar</strong> and the rain shadow areas. Out of 63<br />
districts throughout the country, 12 districts were<br />
classified as water shortage areas (see Maps<br />
6 and 7). In this EPA, management of water<br />
resource is assessed with respect to drinking<br />
water and water for agriculture use.<br />
Figure 4.1: Water consumption by sector (2000-2001)<br />
million acre feet<br />
25<br />
20<br />
15<br />
10<br />
5<br />
0<br />
22.43<br />
0.82 1.82 0.14 0.04<br />
Source: Irrigation Department, 2005<br />
23.39<br />
0.45<br />
Domestic Industrial Irrigation Total<br />
Surface w ater Ground Water<br />
2.31
(ID, WRUD and Private Sector surface surface water water withdrawals)<br />
withdrawals)<br />
Sagaing<br />
Shwebo<br />
Lun =39.37%<br />
Lun =41.22%<br />
Myingyan<br />
Mandalay<br />
Lun = 21.86%<br />
Lun =106.00%<br />
Minbu<br />
L<br />
Kyaukse<br />
un = 23.44%<br />
Lun = 45.51%<br />
Yamethin<br />
L Meiktila<br />
un = 32.20%<br />
Lun =66.24%<br />
Northern Yangon<br />
Magway<br />
Lun = 24.29%<br />
Lun = 14.74%<br />
Western Yangon<br />
Lun = 36.25%<br />
Pyin Oo Lwin<br />
Lun =28%<br />
Monywa<br />
Lun =27%<br />
Kyaukse<br />
Lun =37%<br />
Nyaung U<br />
L un =27%<br />
Myingyan<br />
L un =28%<br />
Meiktila<br />
L un =31%<br />
Yamethin<br />
L un =23%<br />
Loikaw<br />
L un =34%<br />
Pathein<br />
Lun =39%<br />
Southern Yangon<br />
Lun =23%<br />
Water Scarcity levels in <strong>Myanmar</strong> for (2000-2001)<br />
(2000 2001)<br />
SEVERE (Lun > 40%)<br />
MEDIUM TO SEVERE<br />
(20%
4.2 state (Drinking Water)<br />
Indicator: Percentage of Population with Access to Safe<br />
Drinking Water 1995-2003<br />
79. This indicator measures the percentage of the<br />
national population (urban and rural) with access<br />
to safe drinking water. Halving the percentage<br />
of people without access to safe potable water<br />
by 2010 is one Millennium Development Goals<br />
(MDGs).<br />
80. As observed in Figure 4.2, the share of<br />
population with access to safe drinking water in<br />
<strong>Myanmar</strong> has been growing. In 1995, 60% of the<br />
national population had access to safe drinking<br />
water and this increased to 80% in 2003. This<br />
improvement was observed in both rural and<br />
urban areas. In rural areas, access increased from<br />
50% in 1995 to 74% in 2003. In urban areas the<br />
increase was from 78% in 1995 to 92% in 2003.<br />
81. Among the various sources of safe drinking<br />
water, the use of protected open dug wells and<br />
ponds has been the highest (34%) followed by<br />
the use of tube wells (22%). Piped water supply<br />
to households has also increased and by 2003,<br />
15.4% of the total population was estimated to<br />
have access to piped water supply. Population<br />
with water supply from a public standpipe source<br />
declined from 8.8% to 7.3% during this period,<br />
confirming the move to piped water supply.<br />
11Asian Development Bank (2004), “Greater Mekong Region – Atlas of the Environment”, Manila, pp:193<br />
38<br />
82. The official target for safe drinking water is to<br />
have full access for all people by 2010. At present,<br />
approximately 80% of the population enjoys such<br />
access.<br />
Suggested Rating: Average<br />
and Improving<br />
Justification: For the country as a whole, access<br />
to safe drinking water increased by almost 20%<br />
between 1995 and 2003 to a total of 80%. The<br />
rates in rural and urban areas were 74% and 92%,<br />
respectively. As of 2000, the corresponding figures<br />
for GMS countries ranged from 30% to 80% and<br />
<strong>Myanmar</strong>’s figures were therefore at the high end of<br />
the range. 11<br />
4.3. Pressure (Drinking Water)<br />
Indicator: Population Growth – 1985-2015<br />
83. This indicator presents the growth in national<br />
population, projected to the year 2015 (beyond<br />
2010, the year for MDG target for safe drinking<br />
water). It is estimated that the total population<br />
in 2015 will be 62 million, an increase of about<br />
16% of in the next decade. As discussed, the<br />
percentage of the population with the access<br />
Figure 4.2 Percentage of Population Access to safe Drinking Water<br />
percent of population<br />
100<br />
90<br />
80<br />
70<br />
60<br />
50<br />
40<br />
30<br />
20<br />
10<br />
0<br />
1995 1997 2000 2003<br />
national urban rural<br />
Source: Multiple Indicator Cluster Survey, Ministry of Health 2003
Rating: High and<br />
Increasing<br />
Figure 4.3: rural and urban Population 1985-2015<br />
70,000<br />
60,000<br />
50,000<br />
40,000<br />
30,000<br />
20,000<br />
10,000<br />
Justification: An additional 20 million people need<br />
to be provided access to safe drinking water if<br />
the target of water to all has to be met by 2010.<br />
Whereas the current rate of safe water access<br />
approx. 80% is commendable, additional work is<br />
required to meet the targets set of 2010 and 2015.<br />
The projected growth of the rural population is<br />
higher than that of the urban population and the<br />
effort will need to take this into account.<br />
-<br />
1985<br />
Thousand<br />
persons<br />
1988<br />
1991<br />
1994<br />
1997<br />
Source: Statistical Yearbooks, CSO 1992 & 2003<br />
to safe drinking water was 80% up to 2003,<br />
equivalent to 42 million persons approximately.<br />
84. In order to meet the target of drinking water<br />
to all by 2010, 20 millions people (or 4 million<br />
people per annum) will need to be provided with<br />
access to improved water supply. In the last eight<br />
years from 1995 to 2003, an average of 2.5<br />
million people annually acquired access. This is<br />
a considerable achievement. However, unless the<br />
pace of the activity is considerably stepped up,<br />
the 2010 target will not be achieved (although the<br />
relevant MDG already has been).<br />
39<br />
2000<br />
2003<br />
2006<br />
2009<br />
Urban Rural Total<br />
2012<br />
2015<br />
4.4 response (Drinking Water)<br />
Indicator: Expenditure on Drinking Water<br />
Supply 1997-2003<br />
85. This indicator tracks the inflation-adjusted<br />
expenditure by concerned government<br />
departments on improved access to safe drinking<br />
water supply throughout the country.<br />
86. There are several organizations involved<br />
in improving water supply in <strong>Myanmar</strong>. The<br />
Department of Development Affairs is the key<br />
agency responsible for both town and rural water<br />
supply. Water supply in the capital cities like<br />
Yangon and Mandalay, is the responsibility of<br />
municipal authorities [Yangon City Development<br />
Committee (YCDC) and Mandalay City<br />
Development Committee (MCDC)]. Housing<br />
Department under the Ministry of Construction<br />
is also involved in developing water supply for the<br />
housing estates in theses cities.
Figure 4.4: expenditure for rural and urban Water supply<br />
700<br />
600<br />
500<br />
400<br />
300<br />
200<br />
100<br />
87. In addition, rural water schemes have been<br />
supported by the <strong>Environmental</strong> Sanitation<br />
Department under Ministry of Health, Water<br />
Resource Utilization Department (WRUD) and the<br />
Irrigation Department. International organizations<br />
like UNDP, UNICEF and international NGOs are<br />
also implementing community development<br />
activities related to rural water supply in<br />
their project areas. The private sector has<br />
contributed to the establishment of water supply<br />
infrastructure especially in the dry zone areas. For<br />
the purposes of this indicator, expenditure data<br />
from WRUD, DDA, YCDC and MCDC have been<br />
used.<br />
88. The total investment for rural and urban water<br />
supply expressed at constant prices of 1997<br />
reached 994 million kyat(MK) in 2003, 60% more<br />
than in 1997 (Figure 4.4.).<br />
Rural & Urban (Million Kyat)<br />
0<br />
1997<br />
1998<br />
1999<br />
2000<br />
Source: WRUD (2005), YCDC (2005), DDA (2005) & MCDC 2005.<br />
40<br />
2001<br />
2002<br />
2003<br />
Urban Rural Total<br />
1200<br />
1000<br />
800<br />
600<br />
400<br />
200<br />
0<br />
Total Expenditure (Million Kyat)<br />
Suggested Rating:<br />
Significant and Consistent<br />
Justification: Expenditure on the provision of safe<br />
drinking water has been increasing since 1998. The<br />
expenditure has been consistent and instrumental in<br />
helping reach a figure of 80% country-wide access<br />
by 2003. More work is still required to meet the goal<br />
of safe potable water for all by 2010.<br />
4.5 conclusions (Drinking Water)<br />
89. Significant progress has been made in<br />
providing safe drinking water access in <strong>Myanmar</strong>.<br />
While the population of <strong>Myanmar</strong> increased<br />
steadily, at around 2% per annum, the rate of<br />
access to safe potable water was faster than that,<br />
around 2.5% per annum. Nonetheless if the 2010<br />
policy target of full access to drinking water is to<br />
be achieved, provision of access will need to be<br />
accelerated and grow by about 5% per annum.
Suggested Rating: 2 Stars<br />
Justification: Notable progress has been made and<br />
<strong>Myanmar</strong> scores well in comparison to other GMS<br />
countries. Also, <strong>Myanmar</strong> seems to be making<br />
progress towards the objective of providing safe<br />
drinking water access for its entire population.<br />
Institutional responsibilities are being discharged by<br />
appropriate government authorities though the tempo<br />
needs to be stepped up to keep pace with the<br />
growing population.<br />
4.6 state (Water resource for<br />
Agriculture)<br />
Indicator: Irrigated Area as a Percentage of Irrigable<br />
Area 1997-2002<br />
90. This indicator tracks the capacity of irrigation<br />
storage facilities to serve potential command<br />
areas. It is expressed as a share of agricultural<br />
land actually irrigated in the total irrigable<br />
area served by the facilities constructed by<br />
Government’s Irrigation Department.<br />
91. Figure 4.5 plots the values of the indicator.<br />
The ratio rose steadily, approximately doubling<br />
from 1997 to 2002 to approximately 50%.<br />
41<br />
92. This was the result of a strong official<br />
support since 1989 for the policy of increasing<br />
the irrigation storage capacity. By the end of the<br />
budget year 2001/02, the water storage capacity<br />
reached almost 10 million acre feet, or 27 times<br />
more than in 1989.<br />
93. The indicator points to a significant<br />
improvement in the overall capacity of the<br />
system to deliver water to the fields. There is<br />
a number of reasons why the percentage falls<br />
well short of 100%. Factors such as the pattern<br />
of annual precipitation, maintenance of canal<br />
systems and off-take structures, conveyance<br />
losses and others reduce the percentage of water<br />
effectively delivered (see FAO 2004, pp:10-11) and<br />
all of these have played some role in <strong>Myanmar</strong>.<br />
The government’s policy since the launching of<br />
pro-market reforms of 1988 has been to utilize<br />
fully the water resource potential for agricultural<br />
development although no official target value of<br />
the indicator has been formulated.<br />
Figure 4.5: ratio of irrigated Area to irrigable Area<br />
1,600,000<br />
1,400,000<br />
1,200,000<br />
1,000,000<br />
800,000<br />
600,000<br />
400,000<br />
200,000<br />
acres<br />
-<br />
1997-98<br />
1998-99<br />
1999-2000<br />
2000-2001<br />
Irrigable Area (acre)<br />
Irrigated Area (acre)<br />
Source: Forest Department (2005)<br />
2001-2002<br />
2002-2003<br />
Ratio of Irrigated to Irrigable Area<br />
60%<br />
50%<br />
40%<br />
30%<br />
20%<br />
10%<br />
0%<br />
% as of total irrigable area
Suggested Rating: Average<br />
and Improving<br />
Justification: The volume of irrigation water storage<br />
capacity has increased 27 times since 1988,<br />
following the construction of more reservoirs and<br />
irrigation facilities. The target is to maximize the<br />
percentage of potentially irrigable areas that actually<br />
receive irrigation supplies. That percentage stands<br />
at about 50% at present and this is considered<br />
average. The trend has been improving but still has<br />
a long way to go to meet the potential.<br />
4.7. Pressure (Water resource for<br />
Agriculture)<br />
Indicator: Irrigated Crop Sown Area 1985-2002<br />
94. This indicator tracks the growth in the total<br />
demand for irrigation water. It is measured by the<br />
total area effectively irrigated allowance made for<br />
multiple cropping.<br />
95. As observed in Figure 4.6, the value of the<br />
indicator rose to 6.2 million acres between<br />
1985 and 2002, a nearly two-fold increase. The<br />
total area served by irrigation showed a similar<br />
increase reflecting the expansion of the irrigation<br />
42<br />
water storage capacity described in the previous<br />
section of this EPA<br />
96. In 2002, the area sown with irrigated crops<br />
was 134% of the total irrigated area in 2002,<br />
pointing to a significant extent of multiple<br />
cropping. Paddy played a major role in this as<br />
the policy of self-sufficiency in rice production<br />
led to a greater share of paddy in the prevailing<br />
cropping patterns, such increase particularly<br />
marked from mid-1980s to the mid 1990s (Figure<br />
4.6)<br />
97. Water requirements for paddy cultivation<br />
under double cropping can be as high as 5 acre<br />
feet per acre. The 4.5 million acres planted to<br />
paddy in <strong>Myanmar</strong> in 2002-2003 thus created<br />
a potential demand for up to 22.5 million acre<br />
feet of irrigation water. This compares with<br />
the capacity of irrigation water storage in the<br />
Irrigation Department’s reservoirs of about 10<br />
million acre feet at present.<br />
98. The current acreage of irrigated paddy sown<br />
area is therefore already exercising pressure on<br />
irrigation water supplies and the capacity of the<br />
storage and conveyance system. The promotion of<br />
multiple cropping of paddy in line with the policy<br />
of achieving self-sufficiency in rice promises to<br />
further add to this pressure.<br />
Figure 4.6: irrigated crop sown Area and % of Paddy<br />
thousand acres<br />
7000<br />
6000<br />
5000<br />
4000<br />
3000<br />
2000<br />
1000<br />
0<br />
1985-86<br />
1990-91<br />
1995-96<br />
1996-97<br />
1997-98<br />
1998-99<br />
1999-2000<br />
2000-2001<br />
2001-2002<br />
2002-2003<br />
Total Irrigated area<br />
Total Irrigated Crop Sown Acre<br />
Source: Statistical Yearbook, CSO 2003<br />
84%<br />
82%<br />
80%<br />
78%<br />
76%<br />
74%<br />
72%<br />
70%<br />
68%<br />
66%<br />
64%<br />
62%<br />
Paddy Acre As % of Total Crop Sown<br />
paddy acre as percent of<br />
total crop sown area
Suggested Rating: High<br />
and Steady<br />
Justification: Irrigated sown area approximately<br />
doubled from 3 to 6 million acres during the period<br />
1985 to 2002. More than 70% of this growth was the<br />
result of a greater share of paddy in the cropping<br />
patterns. Given the continued policy and strategic<br />
preference for more paddies, the pressure on<br />
supplying more water for irrigated farming is set to<br />
remain high in the foreseeable future.<br />
4.8 response (Water resource for<br />
Agriculture)<br />
Indicator: Expenditure on Irrigation Management<br />
1992-2004<br />
99. This indicator tracks the expenditure<br />
on irrigation management by the Irrigation<br />
Department, expressed in millions kyat per<br />
annum. Figure 4.7 plots the values of the<br />
43<br />
indicator as well as expenditures on dam<br />
(reservoir) construction, and expenditure on<br />
irrigation management as a percentage of the<br />
overall investment by the Irrigation Department. A<br />
rising trend in all forms of irrigation expenditure<br />
can be observed. The 2004-05 level of budget<br />
spending is twice as high in real terms as the<br />
1992 levels. The increased spending during<br />
the studied was directed at improved irrigation<br />
management, alongside a sharp increase in<br />
investments in reservoir construction.<br />
100. During the period 1992 to 2004, expenditure<br />
on irrigation management as a percentage of total<br />
investment of the Irrigation Department ranged<br />
from 12 to 45%.<br />
101. As noted earlier, the ratio of irrigated<br />
to irrigable area was approximately 50% in<br />
2000. The increase in expenditure on irrigation<br />
management in the last few years has made it<br />
possible to stabilize the trend at around 50%.<br />
However, more work is still required to capture the<br />
potential to further increase this percentage.<br />
Figure 4.7. expenditure on irrigation Management<br />
million kyat<br />
3,000<br />
2,500<br />
2,000<br />
1,500<br />
1,000<br />
500<br />
-<br />
1992-93<br />
1993-94<br />
1994-95<br />
1995-96<br />
1996-97<br />
1997-98<br />
1998-99<br />
1999-2000<br />
2000-2001<br />
2001-2002<br />
2002-2003<br />
2003-2004<br />
2004-2005<br />
Irrigation Management<br />
Dam Construction<br />
% of Irrigation Management to total investment<br />
Source: Irrigation Department – ID 2005<br />
50%<br />
45%<br />
40%<br />
35%<br />
30%<br />
25%<br />
20%<br />
15%<br />
10%<br />
5%<br />
0%<br />
percent as of total investment
Suggested Rating: Average<br />
and Consistent<br />
Justification: The real value of expenditure on<br />
irrigation management has been increasing in real<br />
terms and its value now is about the double of what<br />
it was in 1992. Sustained funding of the irrigation<br />
water storage capacity and irrigation management<br />
has made it possible to improve, over time, the<br />
percentage of total lands effectively irrigated.<br />
4.9 conclusions (Water resource<br />
for Agriculture)<br />
102. Efforts have been made since 1989 to<br />
increase irrigation water storage and improve<br />
irrigation infrastructure to boost water supply<br />
to the agricultural sector. The storage capacity<br />
has increased spectacularly since 1989 and<br />
with it, the area irrigated (and area sown).<br />
The conveyance and other losses have been<br />
reduced during the last decade to allow a greater<br />
percentage of the area potentially irrigable to<br />
actually receive water but more can be done.<br />
103. The demands on irrigation supplies<br />
and corresponding infrastructure are closely<br />
linked to the pattern of cropping. Here, the<br />
official preference for self-sufficiency in paddy<br />
and for greater use of multiple cropping has<br />
significantly increased the demand for irrigation<br />
water. Irrigation management including<br />
canal maintenance, better monitoring and<br />
mobilization of local farmers for participatory<br />
water distribution and management have been<br />
strengthened through greater government<br />
budgetary allocations. More effort is still required<br />
to realize the full potential of the irrigation<br />
storage facilities.<br />
44<br />
Suggested Rating: 2 Stars<br />
Justification: Government efforts to utilize more fully<br />
the irrigation water storage capacity have yielded<br />
tangible results with almost 50% of the total irrigable<br />
area receiving irrigation supplies. Still more can be<br />
achieved. The Government has significantly and<br />
consistently increased its funding for the sub sector.<br />
References (Water Resources)<br />
ADB. 2004. Atlas of the Environment. Greater<br />
Mekong Region, Manila.<br />
CSO. 1992. Statistical Yearbook. Central<br />
Statistical Organization, the Government of the<br />
Union of <strong>Myanmar</strong>, Yangon.<br />
CSO.2003. Statistical Yearbook. Central Statistical<br />
Organization, the Government of the Union of<br />
<strong>Myanmar</strong>, Yangon.<br />
DDA. 2005. Data related to the development of<br />
environmental indicator for national performance<br />
assessment. .Submission to <strong>National</strong> Commission<br />
for <strong>Environmental</strong> Affairs, by Department of<br />
Development Affairs, Reference Letter No: 282/<br />
Nga-07/Sa-Ya-Kha (46) 5, 9 February Yangon.<br />
FAO. 2004. Irrigation and Water Resource<br />
Management. In: Agriculture Sector Review<br />
and Investment Strategy, Food and Agriculture<br />
Organization, Working Paper 4, Yangon.<br />
Irrigation Department .2005. Data pertaining<br />
to environmental indicator development for<br />
national performance assessment. Submission<br />
of Irrigation Department, Ministry of Agriculture<br />
and Irrigation to <strong>National</strong> Commission for<br />
<strong>Environmental</strong> Affairs. The Government of<br />
the Union of <strong>Myanmar</strong>, Reference Letter No:<br />
1868/201 Sa-Ma-Ka,8 February 2005, Yangon.<br />
MCDC. 2005. Data related to the development of<br />
environmental indicator for national performance<br />
assessment. Submission to <strong>National</strong> Commission<br />
for <strong>Environmental</strong> Affairs, by Mandalay City<br />
Development Committee, Reference Letter No:<br />
1001/11/Ya-tha-ya (0234) dated 10 March 2005,<br />
Yangon.<br />
Ministry of Health. 2003. Multiple Indicator<br />
Cluster Survey. Departmental statistics on water
and sanitation coverage, Yangon.<br />
<strong>Myanmar</strong> Academy of Agriculture, Forestry<br />
and Livestock and Fisheries Science. 2003.<br />
Agricultural water resource study in <strong>Myanmar</strong><br />
(water scarcity variations in <strong>Myanmar</strong>), Yangon.<br />
WRUD.2005 .Data related to the development of<br />
environmental indicator for national performance<br />
assessment. Submission to <strong>National</strong> Commission<br />
for <strong>Environmental</strong> Affairs, by Water Resource<br />
Utilization Department, Ministry of Agriculture<br />
and Irrigation, the Government of the Union of<br />
<strong>Myanmar</strong>, Reference Letter No: Sa-ma-ka (4)/280<br />
(055/2005),10 February 2005, Yangon.<br />
YCDC. 2005. Data related to the development of<br />
environmental indicator for national performance<br />
assessment. .Submission to <strong>National</strong> Commission<br />
for <strong>Environmental</strong> Affairs, by Yangon City<br />
Development Committee, Reference Letter No:<br />
109/01 (322)/Sa-tha-ka, 8 February, 2005,<br />
Yangon.<br />
Zaw Win. 2004. Water <strong>Assessment</strong> and Water<br />
Sector Profile for <strong>Myanmar</strong>. Unpublished<br />
departmental paper, Irrigation Department,<br />
Yangon.<br />
5. soLiD WAste<br />
MANAGeMeNt<br />
5.1. context<br />
104. Since <strong>Myanmar</strong> jettisoned the socialist<br />
economy in 1988, the pace of urbanization<br />
quickened with the mainly urban-based private<br />
sector leading the way. Many cities and townships<br />
throughout the country have expanded their<br />
boundaries and new settlements have been<br />
created. Many urban squatters have been<br />
relocated to the new settlements. Between 1988<br />
and 2001, 18 industrial zones were established<br />
most of them are located at Yangon and<br />
Mandalay. The number of factories increased from<br />
39,802 to 55,227 in the same period (MOI, 2002,<br />
pp: 67). The population of Yangon City grew from<br />
2.5 million in 1983 to 4.1 million in 2003/2004<br />
and Mandalay from 532,949 in 1983 and to<br />
856,264 in 2003 (Department of Population, DOP<br />
2005).<br />
105. The industrial and urban expansion, while<br />
clearly positive for employment and incomes,<br />
has brought with it the challenge of wastewater<br />
and solid waste management. Throughout<br />
the studied period, the volume of each of the<br />
45<br />
principal categories of solid waste, i.e. household,<br />
commercial and industrial, increased though –as<br />
shown later- increased much less than might have<br />
been expected, especially in Yangon.<br />
106. Traditionally, waste collection and disposal<br />
in <strong>Myanmar</strong> have been the responsibility of local<br />
municipal authorities, without any private sector<br />
involvement. In Yangon (lower <strong>Myanmar</strong>) and<br />
Mandalay (upper <strong>Myanmar</strong>), autonomous City<br />
Development Committees and their Pollution<br />
Control and Cleansing Departments (PCCDs)<br />
with a network of branches and sub-units are<br />
tasked with solid waste management within their<br />
municipal areas. In other parts of the country<br />
Township Development Committees under the<br />
Department for Development Affairs (DDA),<br />
Ministry of Progress of Border Area Development<br />
and <strong>National</strong> Races and Development Affairs<br />
(MPBND), manage municipal waste collection and<br />
disposal. This makes DDA responsible for 323 out<br />
of the total of 325 townships in <strong>Myanmar</strong>.<br />
107. The assignment of institutional responsibility<br />
for waste management is clear but there<br />
are financial and other hurdles to effective<br />
performance by these bodies. [Khin Maung,<br />
1997. pp: 301 and Yamauchi and Sato (2001)].<br />
Traditionally, urban centers have claimed most<br />
of the attention of the agencies responsible for<br />
waste collection while sub-urban areas continue<br />
to rely on burning of waste or dumping it into in<br />
unauthorized low-lying areas (Yu L.S, 1998, pp:<br />
23). In some townships, solid waste has been<br />
used to raise the level of streets and lanes prone<br />
to flooding. (Khin Maung, 1997, pp: 298-299).<br />
5.2. state<br />
Indicator: Percentage of Solid Waste Collected in<br />
Yangon City 1983-2004<br />
108. This indicator measures the volume of solid<br />
waste collected by official means from the point<br />
of production, expressed as a percentage of<br />
total estimated municipal solid waste generated.<br />
Municipal solid waste is defined as the “non<br />
gaseous and non-liquid waste” that results from<br />
the daily activities of community’s residential and<br />
commercial sector within a given administrative<br />
urban area.
109. The indicator was based on the data for<br />
Yangon City. It was confirmed by PCCD/YCDC that<br />
most of municipal waste collected in Yangon is<br />
disposed at designated dumping sites.<br />
110. The values of the indicator (Figure 5.1) show<br />
that the total volume of solid waste collected in<br />
Yangon capital grew from 400 tons/day in 1983<br />
to 1150 tons/day in 2003/04. The percentage<br />
of solid waste collected increased from 39% in<br />
1983 to 80% in 2003. Solid waste management<br />
in Yangon has clearly been improving even if the<br />
figure of 80% is still low in comparison with, for<br />
instance, Bangkok.<br />
111. At present all waste collected by the<br />
municipality is hauled to designated dumping<br />
sites which also accommodate any other waste.<br />
PCCD/YCDC data suggest that 99.96 % of the<br />
total amount of transported waste in 2004 was<br />
treated by land filling and about half a ton (0.04%<br />
of the total) of medical waste was incinerated.<br />
Approximately 10% of total solid waste generated<br />
was collected by private collectors and used as<br />
raw materials for cottage industries in Yangon.<br />
112. With respect to the volume of waste<br />
collected and disposed in other States and<br />
Figure 5.1: Percentage of solid Waste collection in yangon city<br />
solid waste collection as % of total solid<br />
waste generated<br />
90%<br />
80%<br />
70%<br />
60%<br />
50%<br />
40%<br />
30%<br />
20%<br />
10%<br />
0%<br />
39%<br />
Source: Khin Maung (1995), Yamauchi and Sato (2001),<br />
46<br />
Divisions (except Yangon & Mandalay), it was<br />
found that 9 out of 14 States and Divisions<br />
had lower rates of collection in 2003 than in<br />
1998. Improvement in solid waste disposal was<br />
observed only in Magwe Division, Mon Division,<br />
Shan State and Ayeyarwady Division (see the<br />
relevant fact sheet for details). On a national<br />
basis, the percentage of solid waste disposed of<br />
in 2003 decreased to 28% from 24% in 1998.<br />
(see Figure 2 of the relevant fact sheet)<br />
113. It seems safe to conclude that solid waste<br />
management in <strong>Myanmar</strong> presents a mixed<br />
picture of clear improvements in the country’s<br />
two premier cities combined with a stagnating or<br />
even deteriorating collection and disposal in other<br />
States and Divisions. Although no quantitative<br />
target has been formulated to which the indicator<br />
could be related, the “Green and Garbage Free<br />
City” campaign embodies the official desire to<br />
improve collection and disposal. While medical<br />
waste is recognized as a separate category<br />
deserving (and getting) a special disposal regime<br />
the same has not yet happened with other types<br />
of hazardous waste much of which is mixed in<br />
with the solid waste.<br />
42%<br />
54%<br />
80%<br />
1983 1991 2000 2004<br />
Solid Waste Collection Rate
Suggested Rating:<br />
Relatively Poor and<br />
Stabilizing<br />
Justification: The percentage of solid waste<br />
collected in Yangon City increased from about<br />
40% at the beginning of the 1990s to 80% in 2004,<br />
whereas it declined from 28% in 1998 to 24% in<br />
2003 for all other urban areas taken together. No<br />
quantified national targets have been established<br />
for solid waste management but the Government<br />
has launched the “Green and Clean City” campaign.<br />
The percentage of waste collected in Yangon has<br />
improved and is comparable to, for instance, Hanoi<br />
but it lags significantly behind Bangkok.<br />
5.3 Pressure<br />
Indicator: Municipal Solid Waste Generated in Yangon<br />
City 1983-2004<br />
114. This indicator tracks the amount of solid<br />
waste generated per person per day in Yangon<br />
municipal area. As before, municipal solid<br />
waste is defined as the “non gaseous and nonliquid”<br />
waste generated by the community in the<br />
residential and commercial sector in an urban<br />
administrative area. It is expressed in kg per day.<br />
47<br />
115. It can be seen from Figure 5.2 that the<br />
volume of waste generated decreased in the<br />
period 1983 to 2004, on a per capita basis.<br />
This is unexpected given the rising real GDP<br />
per capita during the last decade. International<br />
evidence almost invariably finds a strong positive<br />
correlation between disposable incomes and the<br />
volume of solid waste. If recent efforts of PCCD<br />
to collect fees for waste disposal are responsible<br />
for the declining trend (as has been suggested)<br />
this would provide a nice illustration of an<br />
economic instrument that appears to work the<br />
way it was intended to.<br />
116. In general, solid waste in Yangon<br />
is characterized by a high proportion of<br />
biodegradable materials. A study by YCDC<br />
in 2003 found that on average, solid waste<br />
contained 77% food refuse, 7% paper and textile,<br />
13% plastics and 3% other substances. This<br />
largely confirmed World Bank’s earlier estimate<br />
(World Bank, 1999) that put the percentage<br />
of biodegradable waste at 80%. The modest<br />
increase in the share of paper and plastic waste<br />
observed for year 2003 indicates a growing<br />
importance of waste from commercial sources.<br />
117. Despite a significant fall in solid waste<br />
per capita in Yangon, the total amount of MSW<br />
generated in Yangon has remained steady due<br />
to urbanization and population growth. World<br />
Figure 5.2: Amount of solid Waste Generated in yangon<br />
ton/day<br />
1,600<br />
1,400<br />
1,200<br />
1,000<br />
800<br />
600<br />
400<br />
200<br />
-<br />
0.405<br />
0.405<br />
0.395<br />
0.312<br />
1983 1991 2000 2004<br />
0.450<br />
0.400<br />
0.350<br />
kilogram<br />
0.300<br />
0.250<br />
per<br />
0.200<br />
0.150<br />
person<br />
0.100<br />
per<br />
0.050<br />
day<br />
0.000<br />
total amount of solid w aste daily generated<br />
per capita solid w aste daily generated<br />
Source: Khin Maung (1995), Yamauchi, Hisashi. and Sato, Shinsuke. (2001),<br />
YCDC (2005), Immigration & Manpower Dept<br />
(1986), DOP 2005
Bank’s 1999 study contains a comparison among<br />
selected GMS capitals. Yangon’s daily amount of<br />
solid waste of about 1,400 ton falls well within<br />
the range of about 100 tons/day in Vientiane/Lao<br />
PDR to 6000 tons in Bangkok.<br />
Rating: Medium and<br />
Steady<br />
Justification: The total volume of waste generated<br />
by Yangon City has remained fairly steady during<br />
the last decade despite the growth of the city’s<br />
population. A reduced volume of waste per capita<br />
is largely responsible for this outcome and it seems<br />
that the authorities’ greater efforts at collecting<br />
the waste disposal fees have played a role in this<br />
outcome.<br />
48<br />
5.4 response (inadequate solid<br />
Waste Management)<br />
Indicator: Expenditure on Solid Waste<br />
Management in Yangon City 1994-2004<br />
118. The indicator tracks the annual expenditure<br />
on solid waste management by Yangon City<br />
Development Committee. It is expressed in million<br />
kyat at constant prices of 1994. Consumer Price<br />
Index of the Central Statistical Organization was<br />
used to convert current to constant prices.<br />
119. As observed in Figure 5.3, the inflationadjusted<br />
expenditure on solid waste management<br />
increased steadily from the 1994 level of 69<br />
million kyat to 300 million kyat in 2003, an<br />
almost four and half fold increase. The increase<br />
was particularly steep during the last four<br />
years (2000 to 2004), demonstrating a clear<br />
commitment on the part of government.<br />
120. The revenues generated by PCCD/YCDC also<br />
increased and this helped reduce waste disposal<br />
subsidies from 376 kyat per ton in 2000 to 134<br />
kyat per ton in 2003. The more aggressive cost<br />
recovery policy of PCCD/YCDC clearly had both<br />
an incentive effect referred to earlier on and a<br />
healthy financial effect.<br />
Figure 5.3. expenditure and revenue in solid Waste Management in yangon<br />
(1994 constant Price)<br />
1,400<br />
1,200<br />
1,000<br />
800<br />
600<br />
400<br />
200<br />
-<br />
million kyat<br />
1994<br />
1995<br />
1996<br />
1997<br />
1998<br />
1999<br />
2000<br />
2001<br />
Source: CSO (1997), CSO (2002), & YCDC (2005)<br />
2002<br />
Annual Expenditure Annual Revenue<br />
2003/04
121. The largest components of the expenditure<br />
were labor and waste handling. A total of 4,469<br />
workers were employed by PCCD/YCDC in waste<br />
collection and disposal in 2003/04 compared<br />
to 1700 in 1983. There was some capital<br />
expenditure for waste-treatment infrastructure<br />
such as establishment of West Final Disposal<br />
Site in Hlaing Tharyar during the last three years<br />
of the observed period. Collection and disposal<br />
continue to dominate for the time being and<br />
waste treatment (re-cycling) plays a minimal role.<br />
122. In summary, real expenditure on solid waste<br />
management has increased and financial viability<br />
(and, hence, sustainability) of waste collection<br />
and disposal has improved within Yangon<br />
municipal area.<br />
Suggested Rating:<br />
Average and Consistent<br />
Justification: Financial resources made available<br />
for solid waste management in Yangon steadily<br />
increased from 1994 to 2004. Total expenditure in<br />
2003/04 was four and a half times higher than that<br />
of 1994. The financial viability of waste collection<br />
and disposal in Yangon has improved.<br />
5.5 conclusions<br />
123. Solid waste collection and disposal improved<br />
considerably in <strong>Myanmar</strong>’s two principal<br />
cities during the last decade but remained<br />
unsatisfactory in the majority of small towns<br />
and settlements. Somewhat surprisingly, in<br />
Yangon, the total volume of solid waste generated<br />
remained steady at a time of strong population<br />
growth and this was achieved through a reduction<br />
in waste generation per capita. About 80% of<br />
waste generated in Yangon is now collected<br />
and deposited at designated landfills. The<br />
performance in second-tier towns has stagnated<br />
or even deteriorated slightly. The achievements<br />
in <strong>Myanmar</strong> and Mandalay reflected a significant<br />
increase in budget support for solid waste<br />
management and sustained efforts to improve<br />
cost recovery. The Government’s vision has been<br />
articulated in the ‘Green & Clean City’ campaign<br />
without, however, being accompanied by specific<br />
quantified targets for the activity.<br />
49<br />
124. Until now, the focus in <strong>Myanmar</strong>’s cities<br />
has been on collection and disposal of waste to<br />
the detriment of waste treatment and re-cycling.<br />
Also, with the exception of medical waste, the<br />
question of hazardous waste has not featured<br />
significantly in the discussion of performance and<br />
its monitoring. Quantified targets that would make<br />
monitoring of performance easier have not been<br />
formulated or sufficiently publicized.<br />
Suggested Rating: 2 Stars<br />
Justification: Progress has not been consistent in<br />
collection and disposal of solid waste in <strong>Myanmar</strong><br />
during the last decade and a half. Improvements are<br />
noticeable in the two largest cities but performance<br />
remains poor elsewhere. Also, little information<br />
exists on disposal methods. No quantified targets<br />
exist; however budgets for solid waste management<br />
have been increased and steps taken to improve the<br />
financial performance of the entities charged with<br />
solid waste management.<br />
References<br />
CSO. 1997. Statistical Yearbook 1997. Central<br />
Statistical Organization, the Government of the<br />
Union of <strong>Myanmar</strong>, Yangon.<br />
CSO.2002. Statistical Yearbook 2002. Central<br />
Statistical Organization, the Government of the<br />
Union of <strong>Myanmar</strong>, Yangon.<br />
DOP. 2005. Amendment of Population Data in EPA<br />
<strong>Report</strong>. Submission of Department of Population<br />
to <strong>National</strong> Commission for <strong>Environmental</strong> Affairs,<br />
Reference Letter No: 300/15 (0011)/ La-Pa-Na,<br />
31 October 2005, Yangon.<br />
Immigration and Manpower Department. 1986.<br />
Rangoon City – 1983 Population Census. Ministry<br />
of Home and Religious Affairs, the Socialist<br />
Republic of the Union of Burma, Rangoon.<br />
Khin Maung.1995. Solid Waste Management<br />
at the City of Yangon for Sustained Urban<br />
Development. Technical paper presented<br />
in <strong>National</strong> Conference on <strong>Environmental</strong><br />
Management organized by <strong>National</strong> Commission<br />
for <strong>Environmental</strong> Affairs (NCEA) in cooperation<br />
with Hanns Seidel Foundation, 28-30 August<br />
1995, NCEA/HSF DOC.No.15, Yangon.<br />
MOI. 2002. <strong>Myanmar</strong> Facts and Figures 2002.<br />
Ministry of Information, the Government of Union
of <strong>Myanmar</strong>, Yangon,<br />
World Bank. 1999. What A Waste: Solid Waste<br />
Management in Asia. Urban Development<br />
Sector Unit, East Asia and Pacific Region,<br />
Urban and Local Government Working Paper,<br />
The International Bank for Reconstruction and<br />
Development/ The World Bank, Washington, D.C.<br />
Yamauchi, H. and Sato, S. 2001. Related solid<br />
waste data of Yangon City for 2000, Daw Khin<br />
Win; Quoted in “Final <strong>Report</strong> on Planning and<br />
Techniques for Solid Waste Disposal in Yangon<br />
City, the Union of <strong>Myanmar</strong>”, Japan International<br />
Cooperation Agency (JICA) and Yangon City<br />
Development Committee (YCDC), Yangon.<br />
YCDC. 2005. Data related to environmental<br />
indicator development for national performance<br />
assessment. Submission of Pollution Control<br />
and Cleansing Department of Yangon City<br />
Development Committee to NCEA, Reference<br />
Letter No: 109/01(322)/Sa-Tha-Ka, 8 February<br />
2005, Yangon.<br />
Yu L.S. 1998. Solid Waste Management in Yangon,<br />
<strong>Myanmar</strong>: A Focus on Hospital Waste. M.Sc.<br />
Thesis, Asian Institute of Technology, Bangkok.<br />
Figure 6.1: Number of total registered vehicles in <strong>Myanmar</strong><br />
1,200,000<br />
1,000,000<br />
800,000<br />
600,000<br />
400,000<br />
200,000<br />
-<br />
1998 1999 2000 2001 2002 2003 2004<br />
Union Total Yangon Div.<br />
Mandalay Div. Others<br />
Source: Energy Planning Department, EPD, 2005<br />
50<br />
6. MoBiLe source Air<br />
PoLLutioN<br />
6.1 context<br />
125. Since 1993, <strong>Myanmar</strong> has recorded annual<br />
GDP growth rates ranging from 5.7% to 10.9%<br />
resulting in a gradual improvement in the<br />
standard of living of the middle classes in urban<br />
areas. Growth of vehicle ownership has been a<br />
sign of that modest prosperity. Vehicle import<br />
rules were relaxed at the beginning of the 1990s.<br />
The growth in the total number of registered<br />
vehicles in Yangon and other urban centers of<br />
<strong>Myanmar</strong>, rapid in the last two years, is shown in<br />
Figure 6.1.
126. Increases in vehicular density and in<br />
automotive fuel consumption have inevitably<br />
led to a rise in air pollution levels in the<br />
cities, particularly Yangon and Mandalay (see<br />
Figure 6.2). Although –somewhat surprisingly-<br />
- there is no national standard on ambient air<br />
quality, WHO standards for air quality are an<br />
appropriate alternative standard for assessing the<br />
performance of mobile source pollution for the<br />
purposes of this EPA. A 1996 UNEP/WHO study<br />
undertaken with the Occupational Health Unit of<br />
the Department of Health spoke of worsening air<br />
pollution in Yangon linked to the use of low octane<br />
number petrol containing lead and other additives<br />
(<strong>National</strong> <strong>Environmental</strong> Engineering Research<br />
Institute, 1996, pp: 20).<br />
6.2. state<br />
127. The concentrations of suspended particulate<br />
matter (SPM) in Yangon City have been chosen<br />
as an indicator of air quality. TSP concentrations<br />
capture reasonably well the spectrum of fine<br />
solid and liquid particles associated with mobile<br />
source emissions though, clearly, the nature and<br />
chemistry of such pollution is very complex and<br />
the number of pollutants large. However, data on<br />
many other types of air pollution are simply not<br />
51<br />
available in <strong>Myanmar</strong> for the time being or not<br />
available for a meaningfully long period.<br />
Figure 6.2: Automotive Fuel sold in <strong>Myanmar</strong><br />
300<br />
250<br />
200<br />
150<br />
100<br />
-<br />
50<br />
(million<br />
gallons)<br />
242<br />
237<br />
152 146 146 150<br />
90 90<br />
245<br />
99<br />
Source: Energy Planning Department- EPD, 2005<br />
128. Figure 6.3 shows the concentrations of TSP<br />
(annual averages for selected sampling sites in<br />
Yangon city) during the period 1998 – 2000. The<br />
annual average of TSP concentrations exceeded<br />
the WHO standard of 100 µg/m3 in two out<br />
of the three years of the studied period. Not<br />
surprisingly, seasonal variations were observed<br />
(please refer to the relevant fact sheet), the<br />
concentrations being higher during summer (April<br />
and May) and early winter months (November and<br />
December) than during other parts of the year.<br />
To be expected also, TSP concentrations were<br />
higher in areas with a high density of vehicles<br />
viz., Theinphyu Road, Shwe Gon Daing Junction,<br />
Kanber Aye road, Yankin and Thamine junction.<br />
129. Data on additional parameters viz., aerosol<br />
concentrations, SO2 concentrations are also<br />
presented in the relevant fact sheet. The annual<br />
average of lead concentrations in 1997, 1998 and<br />
1999 ranged from 0.3 to 0.5 µg/m3. This was<br />
close to but below WHO’s standard of 0.5 to 1 µg/<br />
239<br />
89<br />
284 280<br />
189<br />
95<br />
170<br />
109<br />
1998 1999 2000 2001 2002 2003 2004<br />
Gasoline Diesel Total Fuel<br />
Indicator: Total Suspended Particulate (TSP)<br />
Concentration in Yangon City 1998-2000<br />
210<br />
119<br />
91
Figure 6.3: Annual Average of total suspended Particulate (tsP) Matter in yangon<br />
microgram per cubic meter<br />
140<br />
120<br />
100<br />
80<br />
60<br />
40<br />
20<br />
0<br />
117 116<br />
Source: Adapted from Wai Zin Oo, Department of Atomic Energy, Ministry of Science and Technology, 2001<br />
m 3 (<strong>National</strong> <strong>Environmental</strong> Engineering Research<br />
Institute, 1996, pp: 7).<br />
130. Data on SO2 concentrations in residential<br />
areas around Bayint Naung Road, Hlaing<br />
Township were obtained from Yangon University<br />
for the period 1999-2000. As in the case of TSP,<br />
dry season concentrations of SO2 were well above<br />
those of the wet season (Saw Kalayar, 2000).<br />
In 1999, the annual average was 54.4 µg/m3<br />
exceeding the WHO standard of 50 µg/m3 or 0.02<br />
ppm (ASEAN Secretariat 2001, pp: 109).<br />
131. No information is available on the impact of<br />
TSP, SO2 and other pollutants on public health<br />
in <strong>Myanmar</strong> and/or other harmful impacts of<br />
these pollutants on the environment. A link<br />
between air pollution and associated health risks<br />
was highlighted by a recent study by the Health<br />
Department on “Causes of Death in Under Five<br />
Year Old Children 12 ”, Acute respiratory infection<br />
(ARI) ranked as the highest cause of mortality<br />
for the under 5 in <strong>Myanmar</strong> (UNICEF, 2003,<br />
pp:40) and air pollution was among the likely<br />
contributors. 13 . More work, however, needs to be<br />
1998 1999 2000<br />
Annual Average of TSP in Selected Sites of Yangon City WHO Standard (annual mean limit)<br />
52<br />
done to establish more securely the pattern of<br />
these impacts in <strong>Myanmar</strong>.<br />
132. The data used here were available only for<br />
the period 1998-2000. This is because monitoring<br />
was discontinued at the end of the project<br />
under which these data were generated. Regular<br />
monitoring of air pollutants has not been kept up<br />
by any of the government agencies and for now, it<br />
remains impossible to establish long-term trends<br />
of relevant air pollutant concentrations.<br />
82<br />
Suggested Rating:<br />
Relatively Poor with<br />
Undetermined Trend<br />
Justification: Annual average TSP concentrations<br />
in Yangon exceeded WHO standards in two out of<br />
three years for which data are available. The rapid<br />
rise in vehicle registrations in the last two years<br />
suggests that the situation may have worsened<br />
although the lack of regular pollutant monitoring<br />
since 2000 makes this only an educated guess.<br />
12The first survey was carried out during 1994 – 1996 and a second study called “Overall and Cause Specific Under Five Mortality Survey<br />
was conducted from March 2002 to March 2003.<br />
13Air pollution that affects the ARI might be sourced from either mobile vehicle or household cooking with poor ventilation in the house<br />
(indoor pollution)
6.3 Pressure<br />
Indicator: Car Equivalent Unit per km2 in Major Cities<br />
1999-2004<br />
133. For the purpose of this EPA, a Car Equivalent<br />
Unit (CEU) was developed for all types of<br />
registered vehicle based on the level and type of<br />
fuel consumption (please refer to the relevant fact<br />
sheet). The indicator tracks the number of Car<br />
Equivalent Units per square kilometer of principal<br />
urban area in Yangon and Mandalay cities.<br />
134. Total CEU/sq km values in Yangon and<br />
Mandalay rose only very slowly until 2003 with<br />
signs of a faster increase after that. The rapid<br />
increase of CEU in Mandalay is linked to a largescale<br />
licensing of motorcycles imported from a<br />
neighboring country. As would be expected, the<br />
total CEU/sq km was higher in Yangon than in<br />
Mandalay. The potential for air pollution increased<br />
in line with the values of the indicator.<br />
135. The total volume of high-speed diesel<br />
and motor spirit sold in 1998 was 242 millions<br />
gallons. The volume reached a peak of 284<br />
million gallons in 2002. By 2004, total automotive<br />
fuel sold (MS & HSD) had fallen back to 210<br />
millions gallons or an average of 1 gallon per<br />
vehicle per day for a total of 960,341 vehicles.<br />
Total consumption of automotive fuels is higher in<br />
Figure 6.4. ceu per sq-Km of Major cities<br />
Car Equivalent Unit Per Square<br />
Kilometer<br />
1,800<br />
1,600<br />
1,400<br />
1,200<br />
1,000<br />
800<br />
600<br />
400<br />
200<br />
-<br />
1999 2000 2001 2002 2003 2004<br />
Yangon<br />
CEU/(km)2<br />
Source: RTAD 2005, YCDC 2003, & GAD 2004<br />
53<br />
Yangon than in Mandalay. The higher consumption<br />
in Yangon is reinforced by the differences in the<br />
ceiling on the amount of automotive fuel per<br />
car that can be purchased at government petrol<br />
stations that is higher (60 gallons per month per<br />
car) in Yangon than in Mandalay (40 gallons).<br />
136. The rising vehicle density in the two<br />
largest cities of <strong>Myanmar</strong> coincided with falling<br />
total amounts of automotive fuels sold. The<br />
decline in fuel sales reflects a likely increase<br />
in fuel efficiency associated with newer vehicle<br />
vintages imported into the country and possibly<br />
lower distance traveled per vehicle, and higher<br />
fuel prices. The first mentioned, if true, is clearly<br />
a positive development that offsets some or all of<br />
the increase in the values of CEU/sq km.<br />
Suggested Rating: Medium<br />
and Increasing<br />
Justification: During the last few years, there has<br />
been a steady rise in the vehicular density in<br />
Yangon and Mandalay. The values of CEU per<br />
square kilometer increased by 13% and 39%,<br />
respectively, between 1999 and 2004. At the same<br />
time fuel consumption per CEU has been declining.<br />
Without additional information, the direction of<br />
pressure is impossible to establish with confidence.<br />
Mandalay<br />
CEU/(km)2
6.4 response<br />
Indicator: Percentage of Vehicles Inspected<br />
1998 -2004<br />
137. This indicator measures the numbers of<br />
vehicles inspected as a percentage of total<br />
numbers of vehicle registered in <strong>Myanmar</strong>. As<br />
mentioned earlier, national ambient air quality<br />
standards have not yet been established in<br />
<strong>Myanmar</strong>. Air quality standard is drafted under<br />
the Yangon City’s Pollution and Cleansing Rules,<br />
which was issued in 1999, but awaiting for final<br />
approval. According to this rule, PCCD under<br />
YCDC is an authority for handling all air and water<br />
pollution matters in Yangon City’s Municipal<br />
area. Institutional capacity is another constraint<br />
to monitor ambient air quality and air pollution<br />
on regular basis. Studies were undertaken in<br />
the past but none of them has generated a<br />
comprehensive picture of air pollution in major<br />
cities of <strong>Myanmar</strong>. At national level, committees<br />
on pollution control exist under the Ministry of<br />
Science and Technology (MOST) and <strong>National</strong><br />
Commission for <strong>Environmental</strong> Affairs but they<br />
have no clear-cut control powers or ambient air<br />
quality standards to refer to in the event they<br />
Figure 6.5 Percentage of vehicles inspected<br />
Inspected vehicles as % of total registered<br />
vehicles<br />
96.0%<br />
94.0%<br />
92.0%<br />
90.0%<br />
88.0%<br />
86.0%<br />
84.0%<br />
82.0%<br />
80.0%<br />
Source: Road Transport Administration Department,<br />
54<br />
were to pursue a particular policy. The most<br />
relevant of the legislation are the <strong>Myanmar</strong><br />
Motor Vehicle Rules under the Motor Vehicle<br />
Law of 1964 (NCEA, 2000). The Law requires all<br />
vehicles to be technically inspected by the Road<br />
Transport Administration Department (RTAD) for<br />
roadworthiness prior to registration.<br />
138. Both vehicle emissions and noise pollution<br />
feature in the RTAD test. The test is formally<br />
based on ASEAN standards on emission levels.<br />
However, no monitoring equipment is used to<br />
inspect the actual emission performance (see the<br />
relevant fact sheet). Equipping gasoline-fuelled<br />
cars with catalytic converters remains voluntary.<br />
On the plus side, restrictions imposed by the<br />
Trade Council on the age and model of imported<br />
cars has prevented an accumulation of old cars in<br />
<strong>Myanmar</strong>.<br />
139. The data on the number of vehicles<br />
inspected shows no particular trend. The<br />
percentage of registered cars annually inspected<br />
for renewal of license is relatively high at<br />
above 80%. In the absence of clear pollution<br />
performance guidelines, these inspections do<br />
little more than eliminate the worst of mechanical<br />
defects.<br />
1998 1999 2000 2001 2002 2003 2004<br />
% of vehicle inspected
140. RTAD has begun to equip their inspection<br />
facilities with improved inspection devices<br />
but these steps are too new to assess their<br />
effectiveness. The Government has begun to<br />
promote compressed natural gas (CNG) vehicles<br />
with the objective of converting one fifth of the<br />
total vehicle stock (i.e. about 200,000 out of 1<br />
million) to CNG in order to control the level of air<br />
pollution in major cities.<br />
Suggested Rating: Low<br />
and Intermittent<br />
Justification: Lack of appropriate emission standards<br />
and a weak vehicle inspection regime limit the<br />
effectiveness of the official response to the threat of<br />
worsening air pollution in <strong>Myanmar</strong>’s principal cities.<br />
Most of the credit for containing such pollution goes<br />
to the manufacturers of vehicles who have improved<br />
the pollution performance of their new vehicle<br />
models.<br />
6.5 conclusions<br />
141. Unsystematic and insufficient information<br />
on air quality in <strong>Myanmar</strong> limits the authorities’<br />
and the public’s knowledge about the principal<br />
trends and the contributions that vehicles<br />
make to atmospheric pollution in the principal<br />
cities. What can be said with a greater degree<br />
of confidence is that the “vehicle density” has<br />
been on the rise in Yangon and Mandalay. At the<br />
same time, it appears that the fuel consumed per<br />
vehicle has been declining. A complex interplay<br />
of technical and non-technical factors such as<br />
improved pollution performance of newer vehicles<br />
(versus the older vintages), increasing proportion<br />
of motorcycles in the stock of vehicles, fuel<br />
composition, traffic management and several<br />
others would deserve to be studied more<br />
systematically to present a rounded picture of the<br />
current situation and principal trends.<br />
142. The absence of national air quality standards<br />
makes it harder for the authorities to implement<br />
pollution control measures. The responses have<br />
been relatively low-key. The inspections of vehicle<br />
emissions, relatively ineffective in mitigating<br />
pollutant discharges, need to become more<br />
meaningful. The policy regulating imports of<br />
second-hand vehicles has been tightened. Overall,<br />
55<br />
however, the performance in dealing with the<br />
prospect of worsening vehicular pollution has<br />
been poor.<br />
143. More work is required to develop a credible<br />
database of pollution levels and the development<br />
of national air quality standards should begin.<br />
Suggested Rating: Low<br />
and Intermittent<br />
Justification: Lack of appropriate emission standards<br />
and a weak vehicle inspection regime limit the<br />
effectiveness of the official response to the threat of<br />
worsening air pollution in <strong>Myanmar</strong>’s principal cities.<br />
Most of the credit for containing such pollution goes<br />
to the manufacturers of vehicles who have improved<br />
the pollution performance of their new vehicle<br />
models.<br />
Reference<br />
ASEAN Secretariat .2001. Second ASEAN State of<br />
the Environment <strong>Report</strong> 2000. Jakarta. pp 109.<br />
EPD. 2005. Energy Data Related to Indicator<br />
Development for <strong>National</strong> <strong>Performance</strong><br />
<strong>Assessment</strong>. Submittal to <strong>National</strong> Commission<br />
for <strong>Environmental</strong> Affairs, by Energy Planning<br />
Department, Ministry of Energy, the Government<br />
of the Union of <strong>Myanmar</strong>, Ref Letter No: 116/1/<br />
G, 19 April 2005, Yangon.<br />
GAD.2004. Local Data of Mandalay District.<br />
Internal document of Mandalay District’s<br />
Government Affairs Department, Ministry of<br />
Home Affairs, the Government of the Union of<br />
<strong>Myanmar</strong>, Mandalay.<br />
<strong>National</strong> <strong>Environmental</strong> Engineering Research<br />
Institute. 1996. Review of GEMS/AIR Monitoring<br />
Stations South East Asia Region. Sponsored by<br />
UNEP and WHO, Nehru Marg, Nagpur , pp: 7, 20.<br />
NCEA. 2000. <strong>Environmental</strong> Legislation in<br />
<strong>Myanmar</strong> and <strong>Myanmar</strong> Agenda 21. Lecture<br />
note of <strong>National</strong> Commission for <strong>Environmental</strong><br />
Affairs, the Government of the Union of <strong>Myanmar</strong>,<br />
Yangon.<br />
RTAD. 2005. Data Related to Indicator<br />
Development for <strong>National</strong> <strong>Performance</strong><br />
<strong>Assessment</strong>. Submission of Road Transport<br />
Administration Department, Ministry of Transport<br />
to <strong>National</strong> Commission for <strong>Environmental</strong> Affairs,
the Government of the Union of <strong>Myanmar</strong>, Ref<br />
Letter No: Katha-912/05/13, 2 February 2005,<br />
Yangon<br />
Saw Kalayar. 2000. Sulphur Dioxide in Yangon City<br />
Area Near Chaung Wa. M.Sc. thesis, Department<br />
of Chemistry, Yangon University, Yangon.<br />
UNICEF. 2003. Overall and Cause Specific Under<br />
Five Mortality Survey 2002 – 2003. Women and<br />
Child Health Development Project 2003, Ministry<br />
of Health and UNCIEF, Yangon, pp:40.<br />
Wai Zin Oo.2001. Air Pollution Monitoring<br />
Using Nuclear Related Analytical Techniques.<br />
Departmental technical paper, Department<br />
of Atomic Energy, Ministry of Science and<br />
Technology, the Government of the Union of<br />
<strong>Myanmar</strong>, Yangon.<br />
YCDC.2003.Township Maps and Data on Yangon<br />
City. Published by Yangon City Development<br />
Committee, Yangon.<br />
7. cLiMAte cHANGe<br />
7.1 context<br />
144. Climate Change and Ozone Layer Depletion<br />
were not identified as major concerns during<br />
the initial selection and prioritization of national<br />
environmental concerns. The downstream effects<br />
of climate change might be a national concern<br />
but emissions of Greenhouse Gases (GHGs)<br />
were not seen as a priority for the time being.<br />
Lively discussion has been going on domestically<br />
about the figures compiled by the Department<br />
of Meteorology and Hydrology and the extent to<br />
which they could be interpreted as indicating the<br />
effect of global warming. A variety of parameters<br />
features in these discussions such as frequency of<br />
depressions and cyclones, average temperatures<br />
and others (Tun Lwin, 2002).<br />
145. All GMS countries are parties to the United<br />
Nations Framework Convention on Climate<br />
Change (UNFCCC) and the related Kyoto Protocol.<br />
<strong>Myanmar</strong> ratified this convention on November<br />
25th, 1994 and the Kyoto Protocol on August<br />
13th, 2003 (NCEA, 2005).An assessment of<br />
<strong>Myanmar</strong>’s response under UNFCCC has therefore<br />
been considered a suitable addition to this EPA.<br />
<strong>Myanmar</strong> is also a party to the Vienna Convention<br />
for the Protection of the Ozone Layer but unlike<br />
GHG emissions, this convention and its related<br />
protocols are not addressed in this assessment.<br />
56<br />
7.2 state<br />
146. Under the P-S-R model utilized in this<br />
assessment of environmental performance, it<br />
is not feasible to develop an indicator of the<br />
state of climate change at the national level.<br />
An appropriate state indicator would have to be<br />
developed at the global level and this is beyond<br />
the scope of this assessment. Therefore only a<br />
pressure and a response indicators have been<br />
developed in this assessment<br />
7.3 Pressure<br />
Indicator: GHG Emissions in CO Equivalent<br />
2<br />
1990-2005<br />
147. As required by all parties to the UNFCCC,<br />
<strong>Myanmar</strong> conducted its first GHG inventory with<br />
the assistance of ADB in 1997 under the Asia<br />
Least Cost Greenhouse Gas Abatement Strategy<br />
(ALGAS) project. The inventory is for base year<br />
1990 and includes annual projections of GHG<br />
emissions through to year 2020. The selected<br />
pressure indicator is based on these estimates<br />
and projections and the result is expressed in<br />
terms of CO 2 equivalent.<br />
148. The baseline inventory featured a relatively<br />
complex methodology and a set of rules used<br />
to estimate GHG emissions originating in the<br />
energy sector, industrial processes, agriculture,<br />
land use change and forestry, and production of<br />
waste. While in advanced economies (and this now<br />
probably includes Thailand, at least from a GHG<br />
point of view), the energy and industrial sectors<br />
are the largest GHG sources, in less industrialized<br />
countries (and this includes <strong>Myanmar</strong>),<br />
agriculture and land use changes dominate.<br />
Forest cover and the conditions of the forest are<br />
an important part of the equation since forests<br />
absorb some of the gases and are considered a<br />
“GHG sink”<br />
149. In a simulation analysis the baseline<br />
inventory can be combined with a number of key<br />
parameters (population growth, land use, GDP,<br />
etc) to generate projections of GHG emissions.<br />
For <strong>Myanmar</strong>, these estimates were generated up<br />
to 2020. The principal point here is that while the<br />
1990 figures are based on an actual inventory<br />
of GHG sources and sinks, the later values
are projections only, their reliability naturally<br />
declining with the length of the projection period.<br />
150. As can be seen in Figure 7.1 and the<br />
corresponding fact sheet, net GHG emissions in<br />
CO 2 equivalent were estimated at approximately<br />
41,500 gigagrams (Gg) in the 1990 base year.<br />
These were projected to climb to 55,900 Gg<br />
in year 2000, 68,200 Gg in 2010 and 82,900<br />
Gg by 2020. The agriculture sector, mainly rice<br />
cultivation, was by far the largest emitter of GHGs<br />
in <strong>Myanmar</strong>. It accounted for 94% of the overall<br />
emissions in 1990 and is expected to dominate<br />
throughout 2020, at a somewhat reduced rate.<br />
The energy sector was the second largest source<br />
but the magnitude of its emissions was dwarfed<br />
by that of the agriculture sector. The burning<br />
of fuelwood was the major contributing factor<br />
in the energy sector. Emissions from industrial<br />
processes and waste, both existing and projected,<br />
were minimal.<br />
Thousand Giga-grams of CO2 equivalent GHGs<br />
70.00<br />
60.00<br />
50.00<br />
40.00<br />
30.00<br />
20.00<br />
10.00<br />
0.00<br />
-10.00<br />
-20.00<br />
Figure 7.1: GHG emissions in co 2 equivalent – 1990-2005<br />
1990<br />
1991<br />
1992<br />
1993<br />
1994<br />
Source: ALGAS Study (ADB et al., 1998), CSO 1989, 1993, 1997 & 2003<br />
1995<br />
1996<br />
1997<br />
57<br />
151. It can also be observed from Figure 7.1 that<br />
forestry and land use change were a net sink of<br />
GHGs. In the base year, the net removal was 6,655<br />
Gg but this figure was estimated to decline to<br />
2,400 Gg by 2020. This projection was based on<br />
a deforestation rate of 218,800 hectares per year,<br />
through to 2020. The actual deforestation rate<br />
in the 1990s was closer to 400,000 hectares per<br />
annum and it is possible that the sequestration<br />
effect may have disappeared by the turn of the<br />
new millennium.<br />
152. In terms of pure CO 2 emissions, <strong>Myanmar</strong><br />
was a net sequester, i.e. the country absorbed<br />
more CO 2 gases that it generated. The growing<br />
forest stock and the abandonment of marginal<br />
lands compensated for all the CO 2 emissions<br />
of all the other sectors. The amounts are also<br />
significant here. Approximately 67,100 Gg of CO 2<br />
were emitted; approximately 73,000 Gg were<br />
removed. The balance of 5,900 Gg was subtracted<br />
from the other gases in the CO 2 -equivalent<br />
equation.<br />
Energy Combustion Industrial Process Agriculture<br />
Forestry & Land use change Waste CO2 Equivalent Total<br />
1998<br />
1999<br />
2000<br />
2001<br />
2002<br />
2003<br />
2004<br />
2005
153. Most of the other CO 2 -equivalent emissions<br />
were the result of rice cultivation. In the 1990<br />
base year, approximately 1,327 Gg of methane<br />
or 27,900 Gg of CO 2 -equivalent originated<br />
in rice cultivation. The overall contribution<br />
of rice farming is unlike that of any of the<br />
other GMS countries. For <strong>Myanmar</strong>, the rate<br />
applied in calculating methane emissions was<br />
based on actual field measurements that were<br />
approximately three times higher than the<br />
magnitude recommended by UNFCCC as a default<br />
value. The large difference is partially explained by<br />
the use of organic manure applied to the rice crop<br />
in <strong>Myanmar</strong>.<br />
154. The UNFCCC’s early estimate on the excess<br />
pressure on the planet is in the order of 37<br />
million Gg. That figure is based on a tentative<br />
estimate of what the planet can withstand without<br />
undergoing climate change. Obviously <strong>Myanmar</strong>’s<br />
41,500 Gg share of the excess 37-million Gg<br />
problem is miniscule. On a per capita basis and<br />
using year 2005 estimates and for emissions and<br />
population, the ratio is approximately 1.1 metric<br />
ton CO 2 per person.<br />
Suggested Rating: Low<br />
But Increasing<br />
Justification: The current estimated emission level<br />
(1.1 metric ton of CO 2 per person) is relatively low<br />
comparing to other GMS countries like Thailand,<br />
Yunnan (PRC) and Viet Nam; the per capita rate is<br />
also low by international standards. However, the<br />
trend and the pressure are expected to increase as<br />
methane gases from rice cultivation continue to rise<br />
and as the sequestration of CO 2 by growing biomass<br />
diminishes.<br />
7.4 response<br />
Indicator: GHG Emissions Over Per Unit Value of<br />
GDP – 1990-2001<br />
155. GHG Emissions Over Per Unit Value of Gross<br />
Domestic Product (GDP) –termed here “GHG<br />
intensity”-- was selected as the response indicator.<br />
58<br />
This indicator attempts to track the increase or<br />
decrease of GHG emissions for every additional<br />
unit of GDP. It is expressed in kilograms of CO 2<br />
per Kyat (Kg CO 2 /Kyat).<br />
156. While GDP growth will normally result in<br />
an increase in GHG emissions, the increase will<br />
be less than proportional if existing policies and<br />
economic environment encourage emissions<br />
reduction. Greater efficiency of combustion<br />
processes, brought about by industrial<br />
competition and environmental regulation that<br />
penalizes GHG emissions, is among the chief<br />
forces that will lead to a “de-coupling” of GDP<br />
growth and GHG emissions growth. The declining<br />
values of the indicator will be an indirect indicator<br />
of the effectiveness of national responses that<br />
normally combine measures adopted by the<br />
Government to promote emissions reduction and<br />
the steps taken by the GHG emitters themselves.<br />
157. In <strong>Myanmar</strong>’s case it is important to<br />
remember, once more, that the only true estimate<br />
of GHG emissions is that made in 1997 using<br />
the data of 1990. All subsequent GHG emissions<br />
values are projections only, “educated” as<br />
they may be. GDP data, on the other hand, are<br />
available up to 2002. The values of the indicator<br />
will therefore combine a true estimate (for 1990)<br />
with “best-guess” estimates (from 1991 to 2002)<br />
and projections from 2002 onwards when both<br />
GHG emissions and GDP values are assumed<br />
rather than actual.<br />
158. Figure 7.2 illustrates the trend under the<br />
conditions described above. Assuming GHG<br />
emission values during the post-1990 period<br />
to be reliable, the results suggest a positive<br />
development i.e. declining values of GHG<br />
emissions per unit of GDP. The rapid decrease<br />
in the value of the indicator in the year 2001<br />
appears to reflect an unexpected jump in the<br />
value of GDP in that year (the ALGAS model<br />
assumed a growth rate of 6.8% for 2000 whereas<br />
in reality the GDP growth rate was nearly double<br />
of this amount at 13.7%) rather than necessarily<br />
demonstrating a suddenly improving performance<br />
by GHG emitters. This jump illustrates one of the<br />
pitfalls of relying on assumed rather than actual<br />
values of indicators in assessing performance.
1.00<br />
0.90<br />
0.80<br />
0.70<br />
0.60<br />
0.50<br />
0.40<br />
0.30<br />
0.20<br />
0.10<br />
0.00<br />
Figure 7.2: GHG emissions per Gross Domestic Product<br />
1990 1991 1992 1993 1994 1995 1996 1997 1998 1999 2000 2001 2002<br />
Source: ALGAS Study and Statistical Yearbooks, CSO 1989, 1993, 1997 & 2003<br />
159. In general, a declining value of the<br />
indicator is desirable as it suggests –especially in<br />
industrializing economies-- that energy supporting<br />
GDP growth but also resulting in GHG emissions<br />
is being produced with increasing efficiency. In<br />
the case of <strong>Myanmar</strong>, there are signs that the<br />
indicator values may be declining but the absence<br />
of fresh estimates (post-1990) of GHG emissions<br />
makes it impossible to say with confidence what<br />
the recent trend has been.<br />
Suggested Rating:<br />
Non-Comparable and<br />
Undetermined Trend<br />
Energy Intensity per GDP (kgoe/kyat) GHGs Emission per GDP (kgCO2/kyat)<br />
Justification: GHGs emission per unit of GDP<br />
probably declined during the 1990s. Absence<br />
of up-to-date GHG emission inventory makes it<br />
impossible to establish a trend and provide a reliable<br />
assessment.<br />
59<br />
7.5 conclusions<br />
160. <strong>Myanmar</strong> commitments to the UNFCCC<br />
include the following tasks. (ADB & et al, 1998,<br />
pp: 4-5.<br />
a. developing national inventories on sources<br />
and sinks of all greenhouse gases (GHGs);<br />
b. formulating, implementing, and publishing<br />
national and regional programs to mitigate<br />
climate change;<br />
c. promoting and cooperating in the<br />
development, application, and transfer of<br />
technologies, practices, and processes that<br />
control, reduce, or prevent GHGs emissions;<br />
d. promoting sustainable forest management<br />
practices by conserving and enhancing<br />
sinks and reservoirs of GHGs;<br />
e. cooperating in the development of programs<br />
of adaptation to potential impacts of<br />
climate change<br />
f. taking climate change considerations into<br />
account in relevant social, economic, and<br />
environmental policies;<br />
g. promoting and cooperating in research and<br />
data development to help understand and<br />
reduce the potential impacts of climate<br />
change
h. promoting and cooperating in the exchange<br />
of technical, scientific, socioeconomic, and<br />
legal information related to the climate<br />
system and climate change;<br />
i. promoting and cooperating in education,<br />
training, and public awareness campaign<br />
related to climate change and<br />
j. communicating to the Conference<br />
of the Parties information related to<br />
implementation of the Convention<br />
commitments<br />
161. As a non-annex I country of UNFCCC, there<br />
is no obligation for <strong>Myanmar</strong> to reduce its GHG<br />
emissions. However, as mentioned above, there<br />
are monitoring and reporting requirements for<br />
all parties to the convention. Although <strong>Myanmar</strong><br />
has completed it baseline inventory through the<br />
ALGAS project, there is currently no program<br />
in place to monitor current emissions (item<br />
a. above). There is still a need to establish a<br />
national-level communication committee to<br />
raise citizen’s awareness and the most effective<br />
adaptation measures formulated.<br />
162. The state of climate change was not<br />
assessed under this EPA since it is a global<br />
rather than mainly a national concern. The<br />
pressure indicator developed for this assessment<br />
highlights the importance of natural GHG sinks.<br />
These natural sinks are being diminished through<br />
deforestation. Energy saving programs, which<br />
are important for reducing GHG emissions, are<br />
underway but mostly through sectoral efforts<br />
rather than through integrated approaches within<br />
the climate change context.<br />
Suggested Rating: 1 Star<br />
Justification: One star rating is given for overall<br />
performance in climate change because <strong>Myanmar</strong><br />
still needs to fulfill certain obligations stipulated<br />
under UNFCCC.<br />
60<br />
References<br />
ADB, GEF & UNDP. 1998. Asia Least-cost<br />
Greenhouse Gas Abatement Strategy - <strong>Myanmar</strong>.<br />
Asian Development Bank, Global Environment<br />
Facility and United Nations Development<br />
Program, Manila.<br />
CSO.1989. Statistical Yearbook 1989. Central<br />
Statistical Organization, the Government of the<br />
Union of <strong>Myanmar</strong>, Yangon.<br />
CSO.1993. Statistical Yearbook 1993. Central<br />
Statistical Organization, the Government of the<br />
Union of <strong>Myanmar</strong>, Yangon.<br />
CSO.1997. Statistical Yearbook 1997. Central<br />
Statistical Organization, the Government of the<br />
Union of <strong>Myanmar</strong>, Yangon.<br />
CSO.2003. Statistical Yearbook 2003. Central<br />
Statistical Organization, the Government of the<br />
Union of <strong>Myanmar</strong>, Yangon.<br />
NCEA.2005. International Convention and Treaty<br />
related to Environment. Unpublished official<br />
notes of <strong>National</strong> Commission for <strong>Environmental</strong><br />
Affairs, the Government of the Union of <strong>Myanmar</strong>,<br />
Yangon.<br />
Tun Lwin. 2002. The Climate Changes over<br />
<strong>Myanmar</strong> during the Last Decades. In: Water<br />
Resources Journal, Economic and Social<br />
Commission for Asia and the Pacific, ST/ESCAP/<br />
SER.C/212, June 2002, Bangkok.
MYANMAR<br />
NATIONAL ENVIRONMENTAL<br />
PERFORMANCE ASSESSMENT<br />
(EPA) REPORT<br />
3 ENVIRONMENT AND<br />
ECONOMIC DEVELOPMENT:<br />
CROSSCUTTING ISSUES IN EPA<br />
163. The purpose of Part III is not to<br />
comprehensively review the existing institutional<br />
and legislative basis of environmental<br />
management in <strong>Myanmar</strong>. Several summaries<br />
exist including the Institutional Analysis prepared<br />
as part of the SEF II Project (SEFII 2005) and<br />
the reader is referred to them for details. Rather,<br />
the purpose is to identify those elements of the<br />
existing institutional framework that affect the<br />
national environmental management performance.<br />
3.1. Integration of <strong>Environmental</strong><br />
Concerns into Economic Decision<br />
Making<br />
164. <strong>Myanmar</strong> continues to be an agriculturebased<br />
country and environmental concerns<br />
chosen for assessment under EPA, dominated<br />
by resourced-related concerns, are indeed of key<br />
importance for national economic development.<br />
As shown in Table 3.1 below, the combined<br />
share of agriculture, livestock, fisheries and<br />
forestry sectors in 1998-99 GDP was 68.2%. The<br />
Third Five Year Short-Term <strong>National</strong> Economic<br />
Plan (from 2001/02 to 2005/06) has set<br />
six objectives, i.e. to (a) expand agro-based<br />
industries, (b) develop hydro-electrical power<br />
generation, (c) expand agriculture, livestock and<br />
fishery sector for domestic sufficiency and export<br />
promotion, (d) strive for all round development of<br />
other sectors, (e) expand the education and health<br />
61<br />
sectors for developing human resource, and (f)<br />
develop rural areas.<br />
165. Increased agriculture and other development<br />
activities have complex impacts on the natural<br />
resource environment and/or public health.<br />
Growth of fishery sector may lead to a decline<br />
in mangroves; hydropower development may be<br />
associated with sedimentation in conditions of<br />
rapid deforestation, and rapid urbanization tends<br />
to go hand in hand with increased air and water<br />
pollution and waste disposal problems, all of<br />
them impacting public health.<br />
166. Integration of environmental concerns into<br />
economic decision-making then becomes crucial<br />
if the natural resources and environmental “sinks”<br />
are to benefit the population in a lasting manner.<br />
As the 1994 national environmental policy states<br />
(Yin Yin Lay, 1997):<br />
…….. The wealth of the nation is its people, its cultural<br />
heritage, its environment and its natural resources. The<br />
objective of <strong>Myanmar</strong>’s environmental policy is aimed at<br />
achieving harmony and balance between these through<br />
the integration of environmental considerations into the<br />
development process to enhance the quality of the life of all<br />
its citizens. Every nation has the sovereign right to utilize<br />
its natural resources in accordance with its environmental<br />
polices; but great care must be taken not to exceed its<br />
jurisdiction or infringe upon the interests of other nations.<br />
It is the responsibility of the State and every citizen to<br />
preserve its natural resources in the interests of present and<br />
future generations. <strong>Environmental</strong> protection should always<br />
be the primary objective in seeking development.”
Table 3.1: GDP Composition (1998-99)<br />
Sector Share %<br />
Agriculture 59.7%<br />
Livestock and Fishery 7.5%<br />
Forestry 1.0%<br />
Mining 1.4%<br />
Processing & Manufacturing 9.1%<br />
Energy 1.0%<br />
Communication 1.9%<br />
Construction 4.9%<br />
Transportation 4.3%<br />
Financial Institutions 2.1%<br />
Social and Admin Services 6.7%<br />
Rental and Other Services 4.2%<br />
Trade 21.1%<br />
Source: <strong>National</strong> Planning Dept. 2005<br />
3.1.1 Policy and Institutional Integration<br />
167. In <strong>Myanmar</strong>, environmental management<br />
has been traditionally undertaken by line<br />
agencies within their respective mandates.<br />
In the most obvious example, the Ministry of<br />
Agriculture and the Ministry of Forestry are<br />
largely responsible for the management of “their”<br />
natural resources under agriculture and forestry<br />
development projects/programs. The mandates<br />
are sometimes combined: For instance, the<br />
Irrigation Department, Water Resource Utilization<br />
Department, Yangon/Mandalay City Development<br />
Committees, the Department of Development<br />
Affairs, and <strong>Environmental</strong> Sanitation Division<br />
under Department of Health share the<br />
responsibility for improving water supply in<br />
rural and urban areas. For the management<br />
of urban environment, the responsibilities<br />
have been allocated mainly to City/township<br />
Development Committees, Government Affairs<br />
Department, Department of Human Settlement<br />
and Housing Development, Department of<br />
62<br />
Health, and Directorate of Industrial Supervision,<br />
and Inspection. Among the omissions is the<br />
assignment of responsibility for national air and<br />
water quality management.<br />
168. Until 1989, no governmental agency<br />
existed to oversee environmental matters. In<br />
1989, the Ministry of Foreign Affairs (MOFA)<br />
began to assume authority over domestic<br />
environmental protection, while the Cabinet<br />
retained responsibility for international<br />
environmental matters. In 1990, the <strong>National</strong><br />
Commission for <strong>Environmental</strong> Affairs (NCEA) was<br />
created by MOFA to act as a central agency for<br />
environmental management. In 2005, NCEA was<br />
transferred under the stewardship of the Ministry<br />
of Forestry, with Minister of Forests assuming the<br />
NCEA chairperson role.<br />
169. NCEA has a Chairman, a Secretary and a<br />
Joint Secretary as shown in the chart below, with<br />
the chairman and secretary being officials of<br />
MOFA.
Sub-Committee for<br />
Pollution Control<br />
Chart 3.1: Organization Structure of NCEA , NCEA (2000)<br />
Cabinet<br />
<strong>National</strong> Commission for<br />
<strong>Environmental</strong> Affairs<br />
Sub-Committee for<br />
Natural Resource<br />
Conservation<br />
Chairman<br />
170. Creation of NCEA was a significant step in<br />
the integration of environmental considerations<br />
into <strong>Myanmar</strong>’s development planning process.<br />
NCEA’s main mission is to ensure sustainable<br />
use of environmental resources and to promote<br />
environmentally sound practices in industry and<br />
in other economic activities. Its key functions are<br />
to:<br />
(i) Formulate policies on natural resource<br />
management,<br />
(ii) Prepare environmental legislation<br />
(standards and regulations) for pollution<br />
control, monitoring and enforcement,<br />
(iii)Promote environmental awareness through<br />
public education and to liaise as necessary<br />
with international organizations in<br />
environmental matters.<br />
171. NCEA is supported by sub-committees that<br />
oversee the management of several environment<br />
and related concerns viz., (a) pollution control,<br />
(b) natural resource conservation (c) research,<br />
information and education, and (d) international<br />
cooperation.<br />
172. Since its inception, NCEA has been able<br />
to accomplish a series of initiatives required<br />
for integration of environmental concerns<br />
63<br />
Secretary<br />
Joint Secretary<br />
Secretariat<br />
Office<br />
Sub-Committee for<br />
Training, Research &<br />
Education<br />
Sub-Committee for<br />
International Relations<br />
into economic development. These included<br />
formulation of national environmental policy<br />
(1994) and development of ‘<strong>Myanmar</strong> Agenda<br />
21’ as a framework for adopting multi-sectoral<br />
approaches to sustainable development. It also<br />
drafted the <strong>National</strong> <strong>Environmental</strong> Protection<br />
Law that is awaiting approval. All of these<br />
initiatives were taken in collaboration with other<br />
government and non-government organizations.<br />
3.1.2 Inter-Agency Coordination<br />
173. Inter-ministerial and departmental<br />
committees are set up as the need arises to<br />
address cross-sectoral environmental issues.<br />
The <strong>National</strong> Committee for Combating Land<br />
Degradation under UNCCD is one such example.<br />
<strong>National</strong> Water Committee has also been formed<br />
to better address conflicts in water management<br />
and related institutional issues. The Committee<br />
is tasked to establish a ‘national water council’<br />
in future to implement <strong>Myanmar</strong>’s Water Vision.<br />
In parallel to NCEA and PCCD/YCDC, another<br />
pollution control committee was formed under<br />
Ministry of Science and Technology Development<br />
to monitor and regulate industrial pollution in<br />
urban environment at the operational level.
174. As many institutions are involved in different<br />
or same aspects of environmental management,<br />
there are some overlaps, resource conflicts and<br />
instances of inconsistent approaches. Although<br />
NCEA has been playing a coordinating role,<br />
the process has not always been smooth. In<br />
the absence of the national environmental law,<br />
coordination among stakeholders tends to be<br />
ad hoc and informal rather than structured and<br />
systematic. This also affects environmental<br />
information and data management.<br />
175. The way it is set up, NCEA does not have<br />
the authority to enforce coordination. It can<br />
facilitate and ensure that the concerned agencies<br />
are kept informed about each other’s activities.<br />
There are the sub-committees that play a key<br />
role in achieving coordination at the central level.<br />
However, they are not very active and effective<br />
for the operations at the provincial and local<br />
levels. Local committees created until 2004 to<br />
coordinate natural resource management and<br />
land use have had no direct relationship to NCEA.<br />
The formation of the <strong>National</strong> Coordination<br />
Committee for Environment (NCCE) in 2004 with<br />
a structure of sub-committees 14 was a step in the<br />
direction of achieving both horizontal and vertical<br />
coordination. Ministerial agencies and local<br />
authorities are represented in the Committee.<br />
176. Conducting future EPAs through NCCE subcommittees<br />
might be an effective mechanism of<br />
supporting this integration given NCEA’s likely<br />
responsibility for future EPAs. Nevertheless,<br />
there is still a need for a legislative mandate to<br />
mainstream EPA more securely.<br />
3.1.3 EIA Process and other tools<br />
177. The above discussion highlights the need<br />
for better integration between environmental<br />
management and economic development<br />
planning. Some of the approaches that could<br />
reinforce this integration are:<br />
(i) Integrated land use planning – land zoning<br />
for commercial, agricultural, industrial and<br />
institutional uses could be a simple form<br />
of land use demarcation that prevents long<br />
term land use conflicts. Industrial estates<br />
should be planned and all industries should<br />
64<br />
be located within these estates preferably at<br />
some distance from settlements;<br />
(ii) EIA Process – EIA of large development<br />
projects as a means of identifying adverse<br />
environmental impacts will allow for a better<br />
understanding of a project or program and<br />
the necessary mitigation measures.<br />
(iii)Integrated watershed management<br />
–<strong>Myanmar</strong>’s forests, agricultural lands and<br />
rivers are interlinked. Integrated catchments<br />
and watershed planning allows to formulate<br />
an approach to these areas’ development<br />
that does take these linkages into account.<br />
178. However, turning these ideas into more<br />
telling and regular components of NCEA’s and<br />
other agencies’ activities requires a legislative<br />
mandate. Without it, the existing ad hoc<br />
approach to environmental management is likely<br />
to persist. Such a legislative support would<br />
furthermore need to be accompanied by easing<br />
of the budgetary constraints on NCEA and other<br />
resource management agencies.<br />
179. International organizations and nongovernmental<br />
organizations like UNEP, ESCAP<br />
and Hans Seidel Foundation have been helping<br />
NCEA to lay the foundations of a more integrated<br />
approach to environmental management typified<br />
by <strong>Myanmar</strong> Agenda 21. Previous ADB-supported<br />
environmental projects under the GMS umbrella<br />
have also contributed. However, more work is<br />
required to keep the momentum generated by<br />
these activities. Steps need to be taken that<br />
make it possible to institute the culture of<br />
collaboration between economic decision-makers,<br />
environmental specialists and civil society.<br />
3.1.4. <strong>Environmental</strong> Expenditure and<br />
Financing<br />
180. The current national accounting system<br />
does not separately report environmental<br />
expenditure. Financial resources for environmental<br />
management are apportioned to sectoral<br />
ministries or agencies. Table 3.2 below gives an<br />
indication of the budget’s sectoral breakdown<br />
in 1999/2000. Of the total expenditure, only<br />
11.8% was allocated to the agencies most closely<br />
linked to the management of natural resources<br />
14 NCCE sub-committees have been set up based on the eco-region, including Northern Forest Region, Eastern Forest Region, Western<br />
Forest Region, Southern Forest Region, Ayeyarwaddy River Region, Chindwin River Region, Sittoung River Region, Thanlwin River Region,<br />
Central Plain Zone and Coastal Zone
(i.e. agriculture, livestock, fisheries, forestry)<br />
whilst –not unlike in the other GMS countries-- a<br />
greater proportion of the funds were allocated<br />
to defense, administration and social services.<br />
The level of resources available to development<br />
committees, the key local bodies for managing<br />
solid waste, pollution control, and rural and urban<br />
water supply, was insignificant within the overall<br />
national budget.<br />
181. Needless to say such budgetary patterns do<br />
not bode well for enhancing the environmental<br />
management tasks, not to mention EPAs in the<br />
future.<br />
Table 3.2: Financial Expenditure of Government Administrative Organization<br />
in Year 1999-2000<br />
No. Sector<br />
Current Capital<br />
Both Current &<br />
Capital<br />
Amount % Amount % Amount %<br />
1 Union Total 84,646.6 100.0 60,404.7 100.0 145,051.3 100.0<br />
2 Agriculture 6,638.4 7.9 8,519.2 14.1 15,157.6 10.4<br />
3.<br />
Livestock &<br />
Fishery<br />
406.0 0.5 93.2 0.2 499.2 0.3<br />
4. Forestry 790.1 0.9 868.5 1.4 1,658.6 1.1<br />
5. Industry 443.8 0.5 1,659.7 2.8 2,103.5 1.5<br />
6. Energy 18.5 * 7.1 * 25.6 *<br />
7. Social Services 24,272.9 28.7 6,390.6 10.6 30,663.5 21.1<br />
8. Defense 19,279.5 22.8 18,758.0 31.1 38,037.5 26.2<br />
9. Administration 25,151.6 29.7 3,070.0 5.1 28,221.6 19.5<br />
10.<br />
Development<br />
Committee<br />
23.2 * 8.6 * 31.8 *<br />
11. Others 7,622.0 9.0 21,029.8 34.8 28,651.8 19.8<br />
Source: Statistical Yearbook 2002; Note: (a) Value in million kyats, (b) * for in-significant data value.<br />
65<br />
182. Table 3.3 gives the annual expenditure of<br />
NCEA during the period 2001/01 to 2004/05,<br />
showing a significant increase. However even the<br />
2004/05 amounts are barely enough to meet<br />
the administrative and office operational costs.<br />
If NCEA is to assume a more active coordinating<br />
and integrating role as advocated in this report<br />
the annual budget for NCEA needs to be increased<br />
further. Such an increase should make suitable<br />
provisions for financing future monitoring and<br />
evaluation activities such as future EPAs and the<br />
improved financing secured through a suitable<br />
legal provision.<br />
Table 3.3: Annual Expenditure of NCEA (Kyats)<br />
Year Admin Personnel<br />
Operation &<br />
Maintenance<br />
Others Total<br />
2000/01 346,970 2,577,750 788,490 1,915,480 5,628,690<br />
2001/02 296,030 2,290,500 810,730 2,566,700 5,963,960<br />
2002/03 953,820 2,771,330 1,053,920 2,880,530 7,659,600<br />
2003/04 1,524,940 3,018,070 1,092,680 2,241,040 7,876,730<br />
2004/05<br />
Source: NCEA (2005)<br />
975,000 8,380,000 651,000 2,254,000 12,260,000
183. International donor assistance is severely<br />
limited in <strong>Myanmar</strong>. Access to loans or grants<br />
from the international financial institutions in<br />
support of environmental initiatives is minimal<br />
or none, although the GMS program is a partial<br />
exception. At present, official development<br />
assistance (ODA) to <strong>Myanmar</strong> is channeled almost<br />
exclusively toward humanitarian assistance.<br />
The non-availability of financial and technical<br />
resources is a key constraint to improving<br />
environmental management capacity in the<br />
country.<br />
3.1.5 Conduct of Future EPAs<br />
184. Based on the experience gained in the<br />
current SEFII project, NCEA is most likely to be<br />
responsible for future EPAs. It should discharge<br />
this role in collaboration with the <strong>National</strong><br />
Coordination Committee for Environment (NCCE).<br />
NCCE’s sub-committees may want to utilize<br />
EPA as a tool of improving local environmental<br />
performance.<br />
3.2. Implementation Issues<br />
185. Given the cross-sectoral nature of<br />
environment management, collaboration among<br />
government agencies is essential if objectives<br />
are to be reached. <strong>Myanmar</strong> is taking small steps<br />
towards achieving that collaboration but it still<br />
has a long way to go. The following are three<br />
examples of how inter-agency collaboration is<br />
being promoted<br />
(i) In the water resources sector the<br />
catchments of irrigation dams built by<br />
the Ministry of Agriculture & Irrigation for<br />
agriculture needs also serve as a source of<br />
water supply for domestic purposes and the<br />
storage reservoirs are co-managed.<br />
(ii) Ministry of Agriculture and Irrigation, and<br />
Ministry of Forestry have jointly made the<br />
efforts to curtail shifting cultivation and to<br />
halt deforestation and land degradation.<br />
(iii)Normally, nature conservation is the<br />
responsibility of the Wildlife Division<br />
under the Forest Department. However, the<br />
Fisheries Department has been also making<br />
efforts in establishing marine parks and<br />
protecting fishery biodiversity and pristine<br />
island ecosystem in Myeik Archipelago.<br />
66<br />
186. At the local level, local authorities (State<br />
& Division, District, Township and Village Tract<br />
Peace and Development Councils) are responsible<br />
for the implementation of environmental<br />
programs and initiatives within the territory they<br />
administer. Under the “Re-Greening Program”;<br />
local authorities have been active in mobilizing<br />
local people to take part in the program in<br />
collaboration with departments technically<br />
responsible. This coordination is carried out<br />
through committees formed at the local level.<br />
The Inle Watershed Conservation Committee<br />
is one such committee addressing the issues<br />
of land degradation, deforestation and species<br />
biodiversity in Southern Shan and Kayah States.<br />
3.2.1. Regulatory and Economic<br />
Instruments<br />
187. Regulatory instruments are the backbone<br />
of environmental management, more recently<br />
supplemented worldwide by economic (incentive)<br />
instruments. Below, examples are given of<br />
each group of instruments in today’s <strong>Myanmar</strong><br />
practice.<br />
• Tree Cutting Restrictions: According<br />
to Forest Law, cutting of trees without<br />
permission is prohibited in Forest Reserves<br />
and Protected Public Forest, which are<br />
termed as Permanent Forest Estate (PFE).<br />
Generally, there is no legal prohibiting<br />
of tree cutting in areas outside of PFE.<br />
However, local authorities impose restriction<br />
on tree cutting outside PFE area for better<br />
conservation. Cutting of trees is a serious<br />
offence in Dry Zone areas and legal action<br />
can be taken against the offender.<br />
• Restricting Shifting Cultivation: There<br />
are still many forest areas outside PFE in<br />
<strong>Myanmar</strong> and these are subject to pressures<br />
from the community. To regulate such<br />
practices, prior permission is required from<br />
the concerned local authority before any<br />
forest area outside of PFE can be used for<br />
shifting cultivation.<br />
• Zoning Rules for Shrimp Farming: To<br />
prevent the depletion of mangroves, Fishery<br />
Department is preparing zoning rules for<br />
shrimp farming. No farming is allowed in<br />
the restricted segments of the mangrove<br />
area.
• Vehicle Emission Standard: Road Transport<br />
Administration Department (RTAD) has<br />
established a vehicle emission standard to<br />
control air pollution from mobile sources.<br />
• Regulation on Disposal of Healthcare<br />
Waste: Medical and healthcare waste pose<br />
hazards to public health; City Development<br />
Committees have issued special regulations<br />
for the systematic collection and disposal<br />
of these wastes and for their incineration as<br />
appropriate.<br />
Elements of economic instruments are present in<br />
several areas:<br />
• Sustainable Forest Management Criteria:<br />
The Ministry of Forestry has developed<br />
criteria for sustainable forest management<br />
in order to issue ‘Green Certificates’ to<br />
producers of timber products originating<br />
in forests certified as sustainably managed.<br />
‘Code of Practice for Logging and Timber<br />
Harvesting’ is also being developed to<br />
minimize environmental damage associated<br />
with timber harvesting. These measures are<br />
an attempt to reinforce the AAC principle.<br />
The command tools are still present: export<br />
licenses are issued to private sector for<br />
valued added forest products. A Quota<br />
system on log sale is also being applied<br />
for supplying round wood to private woodbased<br />
industry.<br />
• Privatization of Forest Plantation: Forest<br />
law (1992) promotes private investment<br />
in commercial forest plantations. Recently<br />
Government opened teak plantations<br />
to private investors. The ‘Community<br />
Forestry Instruction’, which was legislated<br />
in 1995, encourages local community to<br />
manage forests. It grants 30-year leases<br />
to communities and depending on their<br />
performance, the lease can be extended for<br />
an additional period.<br />
• Credit facility for CNG Vehicles: The<br />
Government is encouraging the use of CNG<br />
in public transport. Preferential loans are<br />
given to vehicle owners for conversion to<br />
CNG. It is planned to convert one fifth of all<br />
registered vehicles in <strong>Myanmar</strong> to CNG.<br />
188. The <strong>National</strong> <strong>Environmental</strong> Law has been<br />
drafted and is awaiting approval. This will allow<br />
NCEA to proceed with developing national<br />
67<br />
ambient standards on air and water quality. A<br />
regulation on the conduct of EIA is also expected<br />
to be prepared.<br />
189. Apart from government measures, initiatives<br />
have also been taken by the private sector. Several<br />
industrial establishments have been certified<br />
compliant with the International Standard<br />
Organization (ISO) 14000-series voluntary<br />
standards. For the most part, however, local<br />
industries lack the capacity and resources to<br />
adopt measures required for ISO certification.<br />
On a related front, some large international<br />
companies have undertaken community based<br />
conservation programs. For instance, Total, the<br />
international oil company, has financed several<br />
biodiversity conservation studies.<br />
190. Financing of municipal environmental<br />
infrastructure is a complex mix of government<br />
funding with varying elements of cost recovery.<br />
While the Government and City Development<br />
Committees bear the cost of infrastructure<br />
investment, its subsequent use if partly or wholly<br />
financed by the urban users. Part II described the<br />
effect of waste disposal charges on restraining<br />
the generation of waste in Yangon. With regard<br />
to land degradation, small-farmer loans provided<br />
by <strong>Myanmar</strong> Agriculture Development and<br />
Cooperative Bank are utilized for application of<br />
soil conservation measures such as terraces and<br />
contour bunds.<br />
3.2.2 Enforcement<br />
191. Enforcement of the “rules of the game”<br />
is agreed to be a major determinant of<br />
performance. The degree of enforcement varies in<br />
<strong>Myanmar</strong>’s environmental management. Although<br />
strong when it comes to cutting of individual trees<br />
within commercial forestry, for instance, it is less<br />
than effective when addressing shifting cultivation.<br />
In some cases, enforcement is adversely affected<br />
by overlapping mandates: In regulating shrimp<br />
farming to protect mangroves, for instance, the<br />
authority to manage mangrove forest assigned to<br />
Forest Department conflicts with that assigned<br />
to the Fisheries Department to regulate shrimp<br />
farming.<br />
192. For the control of air pollution from<br />
vehicles, RTAD is manually inspecting vehicles in<br />
accordance with the vehicle emission standards.<br />
RTAD also plans to secure smoke detectors
for better inspection. Eight task forces have<br />
been deployed throughout Yangon City for<br />
regular checking of emission levels. Yangon<br />
City Development Committee has developed<br />
a surveillance system for monitoring waste<br />
disposal by the local residents and commercial<br />
enterprises. Fines are levied on those who breach<br />
the established disposal restrictions.<br />
3.3 Environment and Civil Society<br />
193. Traditionally, civil society has played an<br />
active role in <strong>Myanmar</strong> in improving social<br />
welfare at the local level. Collectively tackling<br />
tasks and contributing labor and other resources<br />
are common in activities such as improving<br />
community water supply, maintenance of village<br />
infrastructure (schools, roads) and improving<br />
village sanitation. The youth, women and religious<br />
groups are active in such collective activities.<br />
In the hilly areas of the country, hill tribe<br />
people have traditional customs that encourage<br />
sustainable use of water and other land resources<br />
e.g. managing water springs, mini-watersheds<br />
and community forests. Religious groups and<br />
monasteries play an important role in nature<br />
conservation around religious monuments.<br />
194. In urban areas, neighborhood groups are<br />
active in organizing sports, festival, religious<br />
ceremonies and social welfare activities. They<br />
sometimes campaign with local residents for<br />
drainage clearance, solid waste collection and<br />
disposal, and children health immunization. NGO<br />
presence is increasing in <strong>Myanmar</strong>. Local NGOs<br />
such as ‘Union of Solidarity and Development<br />
Association’ and ‘<strong>Myanmar</strong> Women Association’<br />
are active in community based environmental<br />
and natural resource management programs.<br />
Emerging local NGOs in environmental sector are<br />
“Friends of Rainforest <strong>Myanmar</strong> (FORM)”; “Forest<br />
Resource <strong>Environmental</strong> Development Association<br />
(FREDA)”; “Renewable Energy Association of<br />
<strong>Myanmar</strong> (REAM)” and “Biodiversity and Nature<br />
Conservation Association (BANCA)” to name a few.<br />
However, these local NGOs are working primarily<br />
in rural areas and are less involved in urban<br />
environmental issues like air pollution and solid<br />
waste management. That role is in part performed<br />
by the <strong>Myanmar</strong> Women Association, especially in<br />
relation to solid waste management.<br />
68<br />
3.3.1 Environment, Health and Safety<br />
195. Surveys on the causes of mortality among<br />
children under the age of five single out acute<br />
respiratory infections (ARI), and diarrhea and<br />
dysentery as the principal causes (UNICEF,<br />
2003). This finding is a wake up call for those<br />
in charge of air quality and sanitary condition<br />
in urban areas. Government has been making<br />
efforts to improve access to safe drinking water<br />
and provide better sanitation. Figure 3.1 indicates<br />
some decline in cases of 2 weeks prevalence of<br />
diarrhea among children under age five alongside<br />
the improvements in safe water supply and<br />
sanitary latrine use<br />
196. <strong>National</strong> health policy, formulated in 1993,<br />
highlighted the concern about environmental<br />
health risks and targets were set to intensify and<br />
expand environmental health activities including<br />
prevention and control of air and water pollution.<br />
An environmental health component was included<br />
in the national health plan for implementation.<br />
Pilot scale activities were launched to measure<br />
air and industrial wastewater discharges for<br />
toxicity. ARI Control Project was implemented to<br />
enhance the awareness of environmental health<br />
risks posed by air pollution (Win Lwin Nyunt,<br />
1997). <strong>National</strong> Poison Control Center was<br />
established and methods of dealing with poison<br />
and toxic contamination are being disseminated<br />
in hospitals and public health care centers.
Figure 3.1:Prevalence of Diarrhea Among the Children Under Five Versus Improved<br />
Water Supply and Sanitation<br />
percent of total population<br />
90<br />
80<br />
70<br />
60<br />
50<br />
40<br />
30<br />
20<br />
10<br />
0<br />
Source: Ministry of Health, (2003)<br />
1995 1997 2000 2003<br />
safe and convenient drinking w ater supply<br />
sanitary latrine use<br />
3.3.2 Information Access and Stake<br />
Holder Participation<br />
197. Newspapers, journals, radio and television<br />
are key sources of information pertaining to the<br />
management of environment. Popular opinions on<br />
environmental issues are often voiced in “People’s<br />
voice” sections of local newspapers and journals.<br />
The government often takes note of these<br />
especially in cases involving industrial pollution.<br />
There is no law restricting access to information<br />
on environmental issues by the public. In practice,<br />
however, prior approval from heads of the<br />
agencies is required to release information.<br />
198. In general, government agencies seek public<br />
participation in implementing the activities<br />
sanctioned in national planning documents.<br />
The <strong>National</strong> Tree Planting Campaign is a<br />
case of an activity with a conservation focus<br />
attracting substantial participation. Local NGOs<br />
participate in national workshops and working<br />
committees. The committee set up to facilitate<br />
the implementation of UNCCD in <strong>Myanmar</strong><br />
is a good illustration of such participation.<br />
Among significant steps in institutionalizing<br />
stakeholder participation in decision-making is<br />
the ‘Community Forestry Instruction (CFI)’. The<br />
Instruction recognizes local customary rights<br />
to trees and customary land tenure and allows<br />
communities to form forest user groups in their<br />
Diarrhea tw o w eeks prevalence among children under<br />
five<br />
69<br />
16<br />
14<br />
12<br />
10<br />
8<br />
6<br />
4<br />
2<br />
0<br />
Percent of children<br />
neighborhoods. The forest user groups draw up a<br />
village-forest-management-plan (VFMP) with the<br />
assistance of local Forest Department. Among<br />
others, the plans specify the pattern of benefit<br />
sharing. The scheme stimulates community-based<br />
natural conservation and gives local communities<br />
a direct stake in sustainable forest management.<br />
Since CFI was legislated in 1995, Forest<br />
Department has been handing over forestland to<br />
local community for self-management. Japanese<br />
International Cooperation Agency (JICA) has<br />
assisted the Forest Department in the training of<br />
forestry staff in extension and participatory forest<br />
management activities. The CFI may well become<br />
a model for other environment-related activities<br />
in promoting local people’s role not only in<br />
implementation but also in decision-making and<br />
resource sharing.<br />
3.3.3 <strong>Environmental</strong> Awareness and<br />
Education<br />
199. Attempts have been made by various<br />
government agencies to raise environmental<br />
awareness and improve environmental education<br />
in <strong>Myanmar</strong>. The Ministry of Education has<br />
developed a life skill-learning curriculum for<br />
children for integration with the usual subjects<br />
taught in primary schools. It includes basic<br />
principles of environmental conservation such as
water recycling, relationship between living and<br />
non-living things, tree planting, waste disposal,<br />
and personal hygiene. Training is also given<br />
to Primary School Teachers to improve their<br />
environment-related skills. An interdisciplinary<br />
curriculum for bachelor and postgraduate degrees<br />
in environmental management has recently<br />
been developed and introduced. This will greatly<br />
assist in building human resource skills in the<br />
environmental sector. Post-graduate studies in<br />
environmental engineering are now available at<br />
the Yangon Technology University.<br />
200. There are regular programs on local<br />
television to raise environmental awareness of<br />
the public. These programs cover a broad range<br />
of topics such as deforestation, household<br />
energy saving, pesticide handling, integrated pest<br />
management, soil fertility improvement, solid<br />
waste disposal, personnel hygiene, sanitation etc.<br />
NCEA organizes the national environment day<br />
once a year. <strong>National</strong> tree planting campaign is<br />
also an effective tool in relaying the sustainability<br />
message to the wider society.<br />
References<br />
CSO. 2002. Statistical Yearbook 2002. Central<br />
Statistical Organization, the Government of the<br />
Union of <strong>Myanmar</strong>, Yangon.<br />
Ministry of Health. 2003. Multiple Indicator<br />
Cluster Survey. Departmental statistics on water<br />
and sanitation coverage. Yangon.<br />
<strong>National</strong> Planning Department. 2005. Correction<br />
of Related Data in Country <strong>Report</strong>. Submission to<br />
<strong>National</strong> Commission for <strong>Environmental</strong> Affairs,<br />
by <strong>National</strong> Planning Department, Ministry of<br />
<strong>National</strong> Planning and Economic Development,<br />
the Government of the Union of <strong>Myanmar</strong>, Ref:Sa-<br />
8/1505/2005 (1363), 26 October 2005, Yangon.<br />
NCEA. 2000. <strong>National</strong> <strong>Report</strong> on UNCCD<br />
Implementation of the Union of <strong>Myanmar</strong>.<br />
<strong>National</strong> Coordination Body, <strong>National</strong> Commission<br />
for <strong>Environmental</strong> Affairs, Yangon.<br />
NCEA. 2005. Financial data provided for national<br />
performance assessment. SEF II Project,<br />
unpublished official data of <strong>National</strong> Commission<br />
for <strong>Environmental</strong> Affairs, the Government of the<br />
Union of <strong>Myanmar</strong>, Yangon.<br />
SEF II. 2005. Institutional Analysis-<strong>Myanmar</strong>.<br />
Technical background paper under TA 6069,<br />
RRCAP, Bangkok.<br />
70<br />
UNICEF. 2003. Overall and Cause Specific Under<br />
Five Mortality Survey 2002 – 2003. Women and<br />
Child Health Development Project 2003, Ministry<br />
of Health and UNICEF, Yangon, pp:40.<br />
Win Lwin Nyunt. 1997. Promoting Health for a<br />
Better Environment. In: <strong>Environmental</strong> Stakes,<br />
<strong>Myanmar</strong> and Agenda 21, Edited by Victor<br />
R.Savage, Lily L.L.Kong, <strong>National</strong> Commission for<br />
<strong>Environmental</strong> Affairs (<strong>Myanmar</strong>), Hanns Seidel<br />
Foundation (Germany), <strong>National</strong> University of<br />
Singapore, Yangon.<br />
Yin Yin Lay. 1997. <strong>Myanmar</strong> Agenda 21. In:<br />
<strong>Environmental</strong> Stakes, <strong>Myanmar</strong> and Agenda 21,<br />
Edited by Victor R.Savage, Lily L.L.Kong, <strong>National</strong><br />
Commission for <strong>Environmental</strong> Affairs (<strong>Myanmar</strong>),<br />
Hanns Seidel Foundation (Germany), <strong>National</strong><br />
University of Singapore, Yangon.
201. This section contains recommendations<br />
based on the material presented in Parts II and<br />
III. The recommendations are of two types:<br />
those relating to the quality of EPA and those<br />
addressing the management of the relevant<br />
environmental concern.<br />
Forest Resource<br />
Recommendations concerning data and<br />
EPA<br />
202. The Forest Department should build on<br />
the experience of this EPA to collaborate with<br />
professional peers in other GMS countries to<br />
achieve greater comparability of key parameters<br />
describing the conditions of the forest resource.<br />
Forest cover is the most obvious example but<br />
there are others where inertia and other reasons<br />
(in all countries concerned) have perpetuated<br />
insufficient comparability.<br />
203. Future EPAs in <strong>Myanmar</strong> should focus on<br />
providing a better understanding of the reasons<br />
for the loss of forest cover, in particular the<br />
possibility of significant under-reporting of the<br />
true extent of slash-and-burn practices and the<br />
extent of illegal logging.<br />
204. Forest assessment has already been done<br />
twice in the past and the forestry master plan<br />
commits the authorities to the continuation of<br />
this work. Consistent methodology is required to<br />
facilitate future assessments of performance. It<br />
is recommended that the question of consistency<br />
of method be explicitly addressed in future<br />
assessments. Also, future assessments should<br />
add information about the condition of forest<br />
MYANMAR<br />
NATIONAL ENVIRONMENTAL<br />
PERFORMANCE ASSESSMENT<br />
(EPA) REPORT<br />
4 CONCLUSIONS AND<br />
RECOMMENDATIONS<br />
71<br />
within forest reserves, by type of eco-system.<br />
205. There is a need to gather better information<br />
about the pattern of fuelwood production and<br />
use. In particular, new estimates are needed of<br />
today’s per capita use of fuelwood by selected<br />
categories, and the use of fuelwood by ruralbased<br />
and other industries. The results should be<br />
integrated into national energy-saving strategies<br />
and communicated also to those in charge of<br />
monitoring <strong>Myanmar</strong>’s GHG emissions and be.<br />
206. Now is the good time to put in place<br />
an appropriate system of monitoring of the<br />
“new” activities in the forestry sector, such as<br />
community forestry, to make sure future EPAs<br />
can begin to draw lessons about these activities’<br />
effectiveness.<br />
Other recommendations<br />
207. Forest conservation activities have been<br />
overshadowed in <strong>Myanmar</strong> by commercial logging,<br />
on the one hand, and state-run forest plantations,<br />
on the other. “New” activities such as community<br />
forestry are only slowly becoming a telling<br />
component of the sector. The notable absentee is<br />
the private sector. It is recommended that a study<br />
be undertaken of the obstacles to the involvement<br />
of the private sector in different forms of forestry<br />
(other than logging in the old forest). The study<br />
should also address (1) the question whether a<br />
greater involvement by the private sector could<br />
free the Government resources for more intensive<br />
forest conservation and watershed management,<br />
and (2) the environmental and other safeguards to
accompany private sector involvement.<br />
208. Existing forest policy contains a clear policy<br />
target regarding the loss of forest cover. But it<br />
does not specify any target concerning forest<br />
degradation (a change from closed forest to open<br />
forest as well as changes within the category of<br />
open forest). The desirability of adding targets<br />
specifically related to forest degradation should<br />
be considered.<br />
Threat to Biodiversity<br />
Recommendations concerning data and<br />
EPA<br />
209. The national inventory on flora and fauna<br />
should be considered an ongoing activity the<br />
completion of which will significantly improves<br />
the authorities’ ability to monitor the state<br />
of biodiversity. In such inventory, the place of<br />
globally threatening species should be highlighted<br />
to facilitate global comparisons.<br />
210. GIS-based ecosystem assessment is<br />
needed to add to the knowledge of changes in<br />
habitats within PAS, as partially done in this EPA.<br />
Future assessments may want to target critical<br />
ecosystems and bio-corridors as a basis for<br />
possible expansion of PAS to other non-forested<br />
areas and non-terrestrial ecosystems.<br />
Other recommendations<br />
211. The idea of extending the concept of<br />
community management from forestry only to<br />
nature conservation for effective biodiversity<br />
conservation should be seriously considered.<br />
212. As trafficking is a serious threat to<br />
biodiversity not only within <strong>Myanmar</strong> but also<br />
other GMS countries, <strong>Myanmar</strong>’s authorities<br />
should work working more closely with CITES as<br />
well as international NGOs like WWF.<br />
213. In compliance with the UNCBD, the<br />
followings activities should be implemented:<br />
a. Preparation and submission of 1st, 2nd<br />
and 3rd <strong>National</strong> <strong>Report</strong>s (due date for the<br />
3rd report was 15 May, 2005). Only one<br />
of these reports has been submitted by<br />
<strong>Myanmar</strong> to UNCBD.<br />
b. Development of the <strong>National</strong> Biodiversity<br />
Strategy and Action Plan.<br />
c. Preparation and submission of thematic<br />
reports on invasive alien species, access<br />
to genetic resources and benefit sharing,<br />
72<br />
forest ecosystems, mountain-ecosystems,<br />
protected areas, technology transfer<br />
and cooperation, and global taxonomy<br />
initiatives.<br />
Land Degradation<br />
Recommendations concerning data and<br />
EPA<br />
214. Land use planning is crucial for not only land<br />
rehabilitation but also many other applications.<br />
All spatial information now scattered between<br />
Ministry of Forestry and Ministry of Agriculture<br />
and Irrigation should be pooled and used to<br />
develop land capability maps and land suitability<br />
classifications, which are key elements in land<br />
use planning. The current EPA confirmed the such<br />
task is technically possible<br />
215. Not enough is known in <strong>Myanmar</strong> about the<br />
pattern of soil erosion. Regular monitoring of soil<br />
erosion backed by establishment of monitoring<br />
stations and points and appropriate monitoring<br />
design should be designed and implemented.<br />
Other recommendations<br />
216. The analysis of Part II suggests that a strong<br />
case exists for expanding land rehabilitation<br />
activities in Kayah and Karen States.<br />
217. The role of credit in supporting soil<br />
conservation activities should be given greater<br />
consideration.<br />
218. A “Farmer-Field School Approach” has been<br />
used by agriculture extension agencies. This<br />
approach should be extended to soil conservation<br />
and sloping agriculture technology development.<br />
219. Greater use should be made of the<br />
international experience with the sloping<br />
agricultural land technology (SALT) and its<br />
applicability in <strong>Myanmar</strong>.<br />
Solid Waste Management<br />
Recommendations concerning data and<br />
EPA<br />
220. Future EPAs should address the<br />
management of hazardous waste as a<br />
subcomponent of waste management.<br />
221. An assessment of the condition of existing<br />
landfills would add to the quality of the overall<br />
assessment of solid waste management in<br />
<strong>Myanmar</strong>.
222. Quantitative targets for solid waste<br />
management should be formulated.<br />
Other recommendations<br />
223. Given a good performance in waste<br />
management in Yangon contrasting with poor<br />
performance in second-tier towns, efforts should<br />
be taken to strengthen the capacity of local<br />
authorities in these towns for improved solid<br />
waste management.<br />
224. Commission a study on best ways of<br />
promoting private sector participation in solid<br />
waste management drawing on relevant GMS and<br />
other experience.<br />
Water Resource<br />
Recommendations concerning data and<br />
EPA<br />
225. Link future EPAs more closely with<br />
information on the efficiency of the irrigation<br />
systems, especially parameters such as<br />
conveyance losses and on-farm irrigation<br />
efficiency.<br />
Other recommendations<br />
226. A study should be carried out comparing<br />
the cost effectiveness – in representative<br />
local conditions — of investments in new<br />
irrigation water storage vs. improved irrigation<br />
management. The environmental repercussions of<br />
reservoir construction would deserve a separate<br />
attention<br />
Mobile Source Air Pollution<br />
Recommendations concerning data and<br />
EPA<br />
227. Monitoring of key air quality parameters<br />
(TSP, at a minimum) should be resumed in Yangon<br />
and started in Mandalay with adequate attention<br />
to the methodology of a scientific basis of such<br />
monitoring (e.g. particle size, frequency, location<br />
of monitoring points, etc).<br />
228. Future EPAs should pay more attention<br />
to the approaches used in recent initiatives on<br />
vehicular pollution management in Asia, including<br />
those funded by ADB. These approaches should<br />
be used to further develop the methodology<br />
adopted in this EPA.<br />
229. The findings of future EPAs should be more<br />
closely related to the topic of GHG emissions.<br />
Other recommendations<br />
73<br />
230. <strong>National</strong> air quality standards should be<br />
formulated and enacted.<br />
231. Institutional strengthening is required to<br />
allow regular monitoring of air quality in urban<br />
areas. NCEA, PCCD under YCDC and Occupation<br />
Health Unit under Department of Health are<br />
probably the most suitable candidates for this<br />
task. International technical assistance should be<br />
sought to equip these institutions for that task.<br />
232. Promotion of CNG as a policy alternative<br />
should be treated with caution given the high cost<br />
of creating the CNG distribution infrastructure.<br />
The experience of Delhi and Bangkok should be<br />
studied and the cost effectiveness of the CNG<br />
option should be compared with different models<br />
of public transport promotion. If the preference<br />
for the CNG option is confirmed, its promotion<br />
should be linked also to the topic of GHG<br />
emissions a possible financial support under the<br />
Clean Development Mechanism (CDM).<br />
Climate Change<br />
Recommendations concerning data and<br />
EPA<br />
233. An outside support should be sought for<br />
updating the ALGAS inventory of GHG emissions<br />
in <strong>Myanmar</strong>. Such an update should also serve<br />
to gain better understanding of the continued<br />
validity (or not) of ALGAS-type projections.<br />
234. Information on several important elements<br />
of the national response under UNFCCC needs to<br />
be more systematically organized. This includes<br />
information on fuelwood use, pattern of vehicular<br />
emissions and various energy-saving initiatives.<br />
Other recommendations<br />
235. To comply with UNFCCC provisions, a<br />
national communication committee should be<br />
set up within appropriate agencies. <strong>National</strong><br />
communication reports should be prepared and<br />
submitted to UNFCCC sooner. <strong>National</strong> adaptation<br />
program should be formulated. Meeting the<br />
requirements of an international environmental<br />
convention should not be considered as an end<br />
in itself but a means of improving domestic<br />
environmental performance, supported by sound<br />
energy-efficiency and related policies.
Crosscutting recommendations<br />
236. The draft <strong>National</strong> <strong>Environmental</strong> Law should<br />
be approved. To enforce the proposed ‘<strong>National</strong><br />
<strong>Environmental</strong> Law’, strengthening and reorganization<br />
of NCEA should be undertaken. The<br />
re-organization should be used as an opportunity<br />
also to review on the functioning of existing subcommittees<br />
under NCEA and reform them. Areas<br />
deserving particular attention are air and water<br />
quality monitoring and environmental database<br />
management within NCEA.<br />
237. Based on the experience gained through<br />
current SEFII project, NCEA is the body most<br />
likely to be responsible for future EPAs. It should<br />
discharge this function in collaboration with the<br />
<strong>National</strong> Coordination Committee for Environment<br />
(NCCE). NCCE’s sub-committees may want to<br />
utilize EPA as a management tool in improving<br />
local environmental performance.<br />
238. Greater funding is an essential (though not<br />
the only) precondition of improved environmental<br />
performance and better future EPAs as well.<br />
Funding should involve international partners<br />
(international NGOs, foundations, private sector<br />
etc.) and contain flexible financial mechanisms.<br />
An <strong>Environmental</strong> Partnership Fund (EPF) under<br />
NCEA should be created in conjunction with the<br />
development of <strong>Environmental</strong> Resource Center<br />
(see below) A local non-profit organization such as<br />
<strong>Myanmar</strong> Engineers Society could be asked jointly<br />
to manage the fund in the interest of transparency<br />
and accountability. The search for higher budgets<br />
should not detract from the need periodically to<br />
review the efficiency with which existing budgets<br />
are used, in particular the balance of different<br />
budget categories.<br />
239. Establishment of <strong>Environmental</strong> Resource<br />
Center (ERC) is recommended for two reasons.<br />
Among other duties (see para.) the Center would<br />
serve as a clearing house for the now scattered<br />
environmental information making it available to<br />
stakeholders. Second, the Center would seek to<br />
enhance national and international partnerships<br />
using the EPF to implement environment-related<br />
initiatives such as community based nature<br />
conservation, clean technology development,<br />
alternative energy development, etc.<br />
240. The proposed structure of ERC and EPF<br />
is given in Figure 4.1. The Center’s duties and<br />
functions would be to:<br />
74<br />
a. Archive all environmental information and<br />
manage national database to which all<br />
stakeholders have access.<br />
b. Form an Inter-Panel Technical Group (IPTG)<br />
with technical resource persons from<br />
both government and non-government<br />
organization. Conduct regular fora<br />
or meetings to share knowledge and<br />
information.<br />
c. Develop training curricula for various<br />
environment-related subjects and conduct<br />
short course training for partners.<br />
d. Publish an environmental newsletter<br />
(bulletin, journal/magazine) to disseminate<br />
information and promote environmental<br />
awareness<br />
e. Provide technical backstopping and<br />
environmental consultancy service to<br />
various organizations, particularly to the<br />
private sector.<br />
f. Develop an “<strong>Environmental</strong> Partnership<br />
Program (EPP)” to raise funds for EPF to<br />
support outreach conservation projects<br />
and environmental initiatives. Among<br />
other things, the EPP would facilitate<br />
administrative and technical clearance for<br />
the growing number of potential investors<br />
in environment-related projects in waste<br />
management, pollution control equipment,<br />
CDM projects, community-based<br />
conservation and other fields.
Figure 4.1 Proposed Structure and Activities of the <strong>Environmental</strong> Resource Center<br />
Government Agencies NCEA<br />
<strong>Environmental</strong><br />
Database & Archive<br />
Energy<br />
Conservation<br />
<strong>Environmental</strong><br />
Training<br />
Clean Development<br />
Mechanism Initiatives<br />
Steering Committee<br />
(ERC)<br />
<strong>Environmental</strong> Resource<br />
Center (ERC)<br />
ERC Management Team<br />
Pollution<br />
Control<br />
Inter Panel Technical Group<br />
<strong>Environmental</strong><br />
Advocacy & Publication<br />
Solid Waste<br />
Management<br />
75<br />
Non-Profitable<br />
Professional<br />
Associations<br />
Commercial &<br />
Development<br />
Projects<br />
<strong>Environmental</strong><br />
Consultation<br />
Community based Natural Resource<br />
Management & Ecotourism Initiatives<br />
Non-Governmental<br />
Organizations<br />
Private firms,<br />
suppliers &<br />
investors<br />
<strong>Environmental</strong> Partnership<br />
Program (EPP)<br />
<strong>Environmental</strong><br />
Partnership Fund (EPF)<br />
Outreach <strong>Environmental</strong><br />
Conservation Projects
MYANMAR<br />
NATIONAL ENVIRONMENTAL<br />
PERFORMANCE ASSESSMENT<br />
(EPA) REPORT<br />
FACT SHEET APPENDIX<br />
MYANMAR<br />
1. FACT SHEET TEMPLATE AND GUIDELINES<br />
2. FOREST RESOURCES FACT SHEETS<br />
3. THREATS TO BIODIVERSITY FACT SHEETS<br />
4. LAND DEGRADATION FACT SHEETS<br />
5. WATER RESOURCES FACT SHEETS<br />
6. SOLID WASTE MANAGEMENT FACT SHEETS<br />
7. MOBILE SOURCE AIR POLLUTION FACT SHEETS<br />
8. CLIMATE CHANGE FACT SHEETS<br />
76
Greater mekong Subregion<br />
indicator Fact Sheet template<br />
dataBaSe inFormation<br />
Indicator ID Use as appropriate or leave blank<br />
Indicator Name<br />
Year of <strong>Assessment</strong><br />
77<br />
The name, or title, assigned to the indicator, e.g.<br />
“Population density in the Uplands”, followed by<br />
the time range of the indicator data. e.g. “1914<br />
to 2003” or “1990 and 2000”<br />
The year in which the fact sheet was developed,<br />
e.g. 2004<br />
Type of Indicator Pressure, State or Response<br />
Frequently Asked Question (FAQ)<br />
Priority Concern<br />
The non-scientific FAQ that the indicator attempts<br />
to answer. e.g. “ Is the water safe to drink?” for an<br />
indicator that reports on BOD levels in water<br />
The name of the priority concern that this<br />
indicator relates to. Normally it should relate to<br />
only one concern<br />
Geographic Area The name of the country or province in the GMS<br />
Magnitude & Trend (for pressure indicator)<br />
or State & Trend (for state indicator) or<br />
Impact & Trend (for response indicator)<br />
Key Message<br />
See Fact Sheet and EPA Evaluation Criteria for<br />
vocabulary to be places here for the final rating.<br />
In answer to the FAQ above, the “super-<br />
executive summary” of the fact sheet analysis<br />
results, including, if appropriate a statement of<br />
observed trend and a statement of the current<br />
situation in terms of targets.
technical inFormation<br />
A.Definition<br />
This section should define very precisely what “the indicator” is and in what units the<br />
indicator is expressed. It should also include a precise definition of the terms that make up the<br />
indicator.The section should start out with a generic statement such as “This indicator attempts to<br />
track the amount of … (give precise definition of what you are tracking) over … (usually time); it is<br />
expressed as …. (give the precise units of the indicator, both numerator and denominator).<br />
Follow this definition with the definition of other terms you have utilized for the definition of<br />
the indicator (e.g. define more precisely what “forest cover” means, what “expenditure” means,<br />
what “threatened species” means, etc.<br />
B.Data Source<br />
If the data originates from a known information system, give the name of such information<br />
(e.g. FAOSTAT) along with the name of the organization which maintains such information system<br />
(e.g. FAO). If the data was taken from a publication, give the full reference of that publication. If the<br />
data was extracted from the Internet, give the generic name of the website homepage but do not<br />
include the URL. Otherwise specify where or from whom you obtained the data.<br />
C.Geographic Area / Population Coverage<br />
If the data covers the entire country or province, or if the data represents 100% of the<br />
population you are describing, then simply state so (e.g. “the data and the indicator is<br />
representative of … or the country as a whole”). Otherwise describe any gaps or restrictions on the<br />
geography (e.g. “excluding province X” or “only on agricultural soils’) or on the population<br />
(e.g. “only commercial fisheries” or “only reported cases”). If the data is only for a representative<br />
sample of the population (e.g. “only major rivers” or “only X cities”), then provide more details on<br />
the sub-sample (e.g. “Cities X and Y” or “X rivers with discharge greater than Y cms”.<br />
D.Temporal Coverage<br />
If the data represents a one-time measurement (e.g. land cover), state as precisely as you can<br />
the place in time when this measurement was taken (e.g. “represents ground condition in 1999”).<br />
If the data is expressed as a time series, given the start and end times along with an explanation of<br />
any gaps which may occur in the time series and/or how those gaps may have been filled in.<br />
E.Methodology and Frequency of Coverage<br />
Whenever possible, describe the methodologies that the originator utilized to compile the<br />
datasets that you are utilizing (e.g. “using un-supervised remote sensing classification on a Landsat-7<br />
satellite image” or “using a 1km by 1km random stratified grid’). Comment on the frequency<br />
of measurement and/or update (e.g. “a one-time measurement from a project” or “based on year<br />
2000 data which will be updated shortly”) and on the likelihood that the measurement will be<br />
repeated ( e.g. “maintained by a UN organization for the past four decades”).<br />
F.Methodology of Data Manipulation<br />
The focus here is on the manipulation that you may have made to the original data to get it<br />
into a form where it has become useful to you as an indicator; the focus is not on the methods that<br />
the originator utilized to obtain the data in the first place. Describe all the manipulations you have<br />
done on the original data, ensuring that enough detail is given so that the methodology can be<br />
repeated by others at a late data in time.<br />
78
Qualitative inFormation<br />
A.Strength and Weakness (data level)<br />
Comment on the strengths and weaknesses of the data you have utilized, in relation to the<br />
phenomenon you were trying to measure. If the indicator is to show a trend over time, comment on<br />
the strengths (or weaknesses) of the data to show variance over time (present and future).<br />
Comment on any bias that is inherent with the data in respect of the phenomenon you are trying to<br />
measure.<br />
B.Reliability, Accuracy, Robustness, Uncertainty (data level)<br />
Comment on the reliability of the data, especially in relation to whom or where you got it from;<br />
quote all endorsements that were made on the data during the review process. Quote any accuracy<br />
measures that were given or published with the original data (e.g. “according to IHO standards” or<br />
“according to national mapping standards”. Comment on the robustness of the data in terms of<br />
how it may have been used elsewhere and how it can still be applicable to the GMS subregion. State<br />
any assumptions you have made with the data and any relevant uncertainties.<br />
C.Future Work Required (for data level and indicator level)<br />
If applicable, comment of how the data could be improved to better serve the purposes of the<br />
indicator, or how the indicator could be improved with additional or alternative sources of data.<br />
SupportinG data taBleS, GraphS and mapS<br />
The section should start with a graph (Figure 1) and a table (Table 1) which summarizes the<br />
value of the indicator over time. The graph will normally be re-produced in the EPA report, without<br />
the table. The table therefore should contain all the necessary data to re-produce the graph and, as<br />
much as possible, not too much else.<br />
The title of the graph and table should correspond to the name of the indicator. If the<br />
indicator is expressed as a time series, the x-axis of the graph should also be expressed as a time<br />
series. Add as many supplemental graphs and tables, or maps, as required to further expand on<br />
the indicator or to include non-indicator specific information that might supplement the fact sheet<br />
but make sure supplemental information is used and referenced in the final Analysis Section of the<br />
fact sheet.<br />
All graphs should be followed by the table with the data that was utilized to generate them.<br />
Graph titles and table titles should be placed outside the graph and table, as a bolded title on top<br />
of the figure or table. All tables should identify the source of the data in the last row of the table.<br />
Try and keep the graphs and maps to the minimum size, but with sufficient resolution and<br />
detail so as to portray the trend or spatial distributions that are being evaluated. Number each<br />
table and each graph (or map) so that they can be referenced in the evaluation text. Give the same<br />
number to the table and the corresponding graphic; if you generate more than one graphic from<br />
the same table, use alphabetical sub-numbering.<br />
79
Summary<br />
A.Policy Reference<br />
This section on policy reference may not apply to some pressure and state indicators and to<br />
some very specific response indicators where related policies and regulations cannot be inferred.<br />
In these cases, the entire section can be omitted. But for normal response indicators, the lack of<br />
policy or regulation should be noted and highlighted as a “gaps”.<br />
1.Purpose:<br />
Comment on the purpose of the indicator and (i) what function it performs in terms of<br />
environment performance assessment i.e. what parameter it assesses and what resource it<br />
protects, (ii) what objective’s compliance it monitors and (iii) what potential corrective action (s) it<br />
requires.<br />
2.Relevance to Environment Planning and Management:<br />
Comment on the broad/general importance of this indicator for assessing other related<br />
environmental issues e.g. socio-economic relevance, link with any public health, quality of life<br />
related issues etc.<br />
3.Linkage to Other Indicators:<br />
Give a list of other indicators this indicator is linked to i.e. what other indicator values this<br />
indicator directly or indirectly affects.<br />
4.Targets:<br />
Give details on what targets have been set by the national environment agency or ministry for<br />
this indicator to comply with i.e. what are the quantifiable environmental standard this indicator<br />
has to comply with.<br />
5.International Environment Treaties:<br />
If applicable, give the name, scope, status of implementation of the international<br />
environmental treaty(s) your country has signed for this indicator and give an update on the<br />
progress of its implementation. Otherwise state “None applicable”.<br />
6.Laws<br />
If applicable, name national laws that have some implication to the indicator. Otherwise leave<br />
out this sub-section.<br />
B.Analysis<br />
This section is dedicated to the analysis of the indicator and the final rating of the results.<br />
The first paragraphs should be focused on the description of the observed results, as observed in<br />
the tables and graphs (e.g. “As can be observed from Table 1 and Figure 1”, describe the observed<br />
value and the observed trend of the indicator). State if the indicator values comply with the<br />
stipulated national target or standard and (in relevant cases) international standard. Comment on<br />
the size of the discrepancy between the two and its trend (can a reliable trend be established? Does<br />
it point to an underlying improvement or deterioration? Can the fluctuating values of the<br />
indicator be related to distinct policy interventions such as mitigation measures, changed pattern<br />
of economic incentives, or other corrective actions?). Say whether the results might be indicative<br />
of inappropriate or moving targets/standards rather than simply reflecting performance. Comment<br />
on the role, if any, of factors outside management control (climatic factors, natural disasters, etc.).<br />
Identify the factors most relevant to observed outcomes and specify key related indicators.<br />
Keep in mind the ultimate purpose of your effort, i.e. to review performance by environmental<br />
concerns and groups of concerns such review normally resting on several indicators rather than a<br />
single one. Analysis of a single indicator to be performed below is important but it is in combining<br />
it with the analysis of other indicators that policy insights are generated and performance<br />
assessment gains depth.<br />
80
The last paragraph of this analysis section should be focused on the justification of the<br />
indicator ranking, based on the vocabulary and guidelines given in “Fact sheet and EPA Evaluation<br />
Criteria”. The last sentence should highlight (in bold) the final ranking of the indicator results.<br />
81
Indicator ID<br />
Indicator Name<br />
Greater mekong Subregion<br />
indicator Fact Sheet<br />
dataBaSe inFormation<br />
Year of <strong>Assessment</strong> 2005<br />
Type of Indicator State<br />
Frequently Asked Question (FAQ)<br />
Priority Concern Forest Resources<br />
Geographic Area Union of <strong>Myanmar</strong><br />
82<br />
Percentage of Forest Cover Over Total Land – 1975<br />
to 1998<br />
What is the current state and trend of forest cover<br />
in <strong>Myanmar</strong>?<br />
State & Trend Relatively Good but Deteriorating<br />
Key Message<br />
Forest cover declined steadily from 42 to 35<br />
million ha from 1975 to 1998. Coinciding with the<br />
transitional period to an open market economy,<br />
annual forest loss during 1989 to 1998 (466,000<br />
ha per annum) was four times higher than that of<br />
the years from 1975 to 1989 (108,000 ha per<br />
annum). This accounts for the higher<br />
deforestation rate of 1.2% per annum. However,<br />
half of the country is still covered by forest and<br />
its coverage is considered to be relatively good<br />
comparing to other GMS countries, though it is<br />
facing with the deteriorating trend.
technical inFormation<br />
A.Definition<br />
This indicator attempts to track the amount of natural and plantation forest area tracked over<br />
time; it is expressed as a percentage of the total forest cover over the total land area of the<br />
country. Forest cover includes both open forest and closed forest. Closed forest is defined as area<br />
under forestry or no land use, spanning more than 0.5 ha; with trees higher than 5 m and a canopy<br />
cover of more than 40%, or trees able to reach these thresholds in situ. Open forest is defined as<br />
area under forestry or no land use, spanning more than 0.5 ha; with trees higher than 5 m and a<br />
canopy cover between 10% and 40%, or trees able to reach these thresholds in situ.<br />
B.Data Source<br />
All of the data utilized for the development of this indicator originate from the <strong>Myanmar</strong> Forest<br />
Department (FD).The following are references to sources of data employed in the development of<br />
this indicator:<br />
Forest Department (2000), “Forest Resource <strong>Assessment</strong> 2000 of <strong>Myanmar</strong>”, official data in<br />
collaboration with Food and Agriculture Organization, Yangon<br />
Forest Department (2005), “Forest Resource <strong>Assessment</strong> 2005 of <strong>Myanmar</strong>”, official data in<br />
collaboration with Food and Agriculture Organization, Yangon<br />
Maung Maung Than(2002); “Review of Land Use and Land Degradation Status in <strong>Myanmar</strong>”;<br />
In Proceeding of <strong>National</strong> Workshop on Preparation for <strong>National</strong> Action Plan for Combating<br />
Desertification in <strong>Myanmar</strong> jointly organized by Forest Department and United Nations Convention<br />
of Combating Desertification-Asia/Pacific, Yangon<br />
Kyaw Tint and Tun Hla (1991): “Forest Cover of <strong>Myanmar</strong> – the 1989 appraisal”, Unpublished<br />
Technical Paper of Forest Department, Yangon<br />
Food and Agriculture Organization (2000), “Global Forest <strong>Assessment</strong> 2000”, Rome. www.fao.<br />
org/forestry/fo/fra/main/index.jsp<br />
C.Geographic area / Population Coverage<br />
Forest cover data utilized for the development of this indicator are representative of the Union<br />
of <strong>Myanmar</strong> as a whole and based on a total land area of 67,658,000 ha.<br />
D.Temporal Coverage<br />
The indicator is representative of trends in forest cover trends from 1975 to 1998, based on<br />
four different appraisals conducted by the Forest Department (FD).<br />
83
E.Methodology and Frequency of Coverage<br />
The data utilized to construct this percentage forest cover indicator are the result of four<br />
different appraisals conducted by FD as follows:<br />
Appraisal for 1975: In <strong>Myanmar</strong>, the first appraisal of the country’s forest cover using<br />
remote sensing techniques was initiated in 1980. The study was conducted by <strong>Myanmar</strong><br />
foresters under an FAO/UNEP project using 1:1,000,000 scale Landsat Multi-spectral Scanner<br />
(MSS) imageries taken during 1972-1979.<br />
Appraisal for 1989: As part of the work of the national inventory project (MYA/85/003),<br />
this appraisal was conducted in 1989-90 by using Landsat TM image of 1989-90 (1:500,000<br />
scale). Manual interpretation was conducted for classifying forest cover. Ancillary information<br />
was derived from 1:25,000 scale aerial-photos of 1983.<br />
Appraisal for 1997: For FRA2000 assessment in 1999 FD assessed and compiled updated<br />
forest cover data. Four separate survey data are used as baseline data. The Information System<br />
Development Project (ISDP) of JAFTA provided 67% of country coverage. Data for Taninthary<br />
Division was produced from 1997 imagery (average image year) using manual interpretation<br />
of 1:250,000 scale print outs of LANDSAT 5 TM. Mon State is covered by Land Use and Land<br />
Cover Mapping for Mon State, a test project for Japanese ADEOS satellite by the Forest<br />
Department attempted to monitor the land use and land cover changes of Mon State. The<br />
remaining areas of Shan State, Kachin State are estimated. The average year of all satellite<br />
images are 1997 and hence the name.<br />
Appraisal for 1998: In 2004 FRA 2005 assessment had to be completed. These surveys<br />
provided full coverage. ISDP data was still utilized. Tanintharyi Division is covered by 2000<br />
LANDSAT 7 ETM digital classification. Kachin State and Karen State are newly interpreted<br />
using 2000 LANDSAT 7 ETM data. Shan State is substituted by 2002 Land Use Survey done for<br />
United Nations Office of Drug and Crime (UNODC). The average year becomes 1998.<br />
The frequency of assessments is normally 10 years but FAO have advised that it should be<br />
5 years. The Forest Department is always updating whenever the new satellite data are acquired<br />
from various sources.<br />
F.Methodology of Data Manipulation<br />
Total forest area is quoted from officially recognized figures and has been expressed as a<br />
percentage of total land area assuming a total land area of 67,658,000 ha.<br />
The rate of changes in forest cover over time is calculated for 3 periods; from 1975 to<br />
1989, from 1989 to 1998 and from 1975 to 1998. The change of forest cover during the<br />
concerned period is a subtraction of the forest cover from the latter period to that of former<br />
period. The time lap between these two periods is used for dividing net change of forest area<br />
in order to calculate the annual rate of forest change (deforestation) in the given period. Two<br />
types of change rates are given: one based on the total land area of the country and the other<br />
on the total forest area of the starting year.<br />
84
Qualitative inFormation<br />
A.Strength and Weakness (data level)<br />
The indicator provides explicitly general information about the status of existing environmental<br />
and natural resource in <strong>Myanmar</strong>. It helps in understanding how this resource has been changed<br />
over time, either positive or negative, during last 30 years. Its absolute value also indicates<br />
comparable enrichment of natural resource potential to other countries. However, its generalized<br />
and broad definition on forest in terms of canopy coverage limits the understanding of changes of<br />
forest quality which is more crucial in determining degradation of forest resources and respected<br />
forest ecosystems rather than total depletion of the forest area. If the data are associated with the<br />
value of minor changes in forest cover over time, their interpretation may underestimate the degree<br />
and the nature of environmental deterioration process.<br />
B.Reliability, Accuracy, Robustness, Uncertainty (data level)<br />
Since different sets of spatial data with different techniques in forest assessment were<br />
employed in each appraisal, statistically they cannot be accurately compared. Because the<br />
technique between manual interpretation and digital processing may create an inconsistent base<br />
and larger differences in classifying forest area and area estimation. The data for 1998 seems more<br />
systematic and advanced in interpreting forest classification and calculating respected forest area<br />
with reasonable representation of ground-truthing. However, even in this case, combination of<br />
various set of Remote Sensing data for forest assessment may be associated with the problem of<br />
consistency in representing real time value of forest cover in respected areas at the provincial level.<br />
C.Future Work Required (for data level and indicator level)<br />
Assuming that a consistent technique was applied during 1998, the forest coverage in the past<br />
should be re-assessed. Within the spatial data available, it is possible to compare data from 1989<br />
to 2002. A fairly representative point of ground-truthing should be statistically selected.<br />
Classification of forest should be more detailed in identifying various forest ecosystems such as<br />
Moist Upper Deciduous Forest, Evergreen Forest, Dry Forest and so on, in line with the method that<br />
the Forest Department used to classify different types of forest in the past. In doing so, it will be<br />
able to compare the changes of forest quality over time in understanding the deterioration of the<br />
forest ecosystem. Developing a forest density map will be also useful in analyzing this aspect. For<br />
better analysis, matrix changes of land use within the study period should be done for understanding<br />
changes from one land use to another. For example; how much land extent of bamboo forest in<br />
1989 has remained in 1998 with the conversion of some portions to other land use like agriculture<br />
or shrub forest. Forest cover changes within established forest reserve area should be also studied<br />
in order to monitor the gap that existed between actual land cover and present land use by official<br />
registration and demarcation.<br />
85
Thousand hectares<br />
42,000<br />
41,000<br />
40,000<br />
39,000<br />
38,000<br />
37,000<br />
36,000<br />
35,000<br />
34,000<br />
33,000<br />
32,000<br />
SupportinG data taBleS, GraphS and mapS<br />
Figure 1: percentage Forest cover – 1975-1998<br />
1975 1989 1997 1998<br />
Forest Cover Forest Cover As % of Total Land<br />
table 1: Forest cover as a percentage of total land area – 1975-1998<br />
year of assessment<br />
Forest cover thousand<br />
hectares<br />
86<br />
62.0%<br />
60.0%<br />
58.0%<br />
56.0%<br />
54.0%<br />
52.0%<br />
50.0%<br />
48.0%<br />
46.0%<br />
Percent as of Total Land<br />
percentage of total land<br />
area<br />
1975 41,196 60.89%<br />
1989 39,685 58.66%<br />
1997 35,375 52.28%<br />
1998 35,487 52.45%<br />
Source: Forest Resource <strong>Assessment</strong> 2005, Forest Department (2005)<br />
Thousand Hectares<br />
45,000<br />
40,000<br />
35,000<br />
30,000<br />
25,000<br />
20,000<br />
15,000<br />
10,000<br />
5,000<br />
0<br />
Figure 2: Forest cover change – 1975-1998<br />
Closed Forests Open Forests Total Forests<br />
1975 1989 1997 1998
Forest cover<br />
table 2a: Forest cover change – 1975-1998<br />
extent in thousand hectares<br />
1975 1989 1997 1998<br />
Closed Forests 30,322 31,554 25,294 25,517<br />
Closed Forest As % of<br />
Total Land<br />
44.82% 46.64% 37.38% 37.71%<br />
Open Forests 10,874 8,131 10,081 9,971<br />
Open Forest As % of<br />
Total Land<br />
16.07% 12.02% 14.90% 14.74%<br />
Total Forests 41,196 39,685 35,375 35,487<br />
Forest cover As % of<br />
Total Land<br />
60.89% 58.66% 52.28% 52.45%<br />
Other wooded Land 8,876 10,178 11,919 10,547<br />
Other Land (including<br />
water bodies)<br />
17,587 17,793 20,364 21,624<br />
Total Land area 67,658 67,658 67,658 67,658<br />
Source: Forest Resource <strong>Assessment</strong> 2005, Forest Department (2005)<br />
period<br />
initial<br />
cover<br />
(hectares)<br />
table 2b: deforestation rates – 1975-1998<br />
loss of<br />
Forest<br />
cover<br />
(hectares)<br />
duration<br />
(years)<br />
87<br />
loss<br />
(hectares/<br />
year)<br />
% change<br />
as<br />
of tota<br />
l land<br />
(Fd*)<br />
% change<br />
as of total<br />
Forest<br />
(un)**<br />
1975- 1989 41,195.6 1,510.7 14 107.91 0.16% 0.26%<br />
From 1989 to<br />
1998<br />
39,684.9 4,197.8 9 466.42 0.69% 1.18%<br />
From 1975 to<br />
1998<br />
41,195.6 5,708.5 23 248.20 0.37% 0.60%<br />
Note: * Forest Department calculates deforestation rate as % of total land area<br />
** UN calculates rate as % of total forest area<br />
Source: Forest Resource <strong>Assessment</strong> 2005, Forest Department (2005)
area<br />
(State &<br />
division)<br />
table 2c: Forest cover change by State and division – 1975-1998<br />
75 to<br />
89<br />
close Forest open Forest total Forest<br />
89 to<br />
98<br />
75 to<br />
98<br />
75 to<br />
89<br />
88<br />
89 to<br />
98<br />
75 to<br />
98<br />
75 to<br />
89<br />
89 to<br />
98<br />
75 to<br />
98<br />
Kachin 0.37% -4.50% -1.63% 11.42% 55.35% 63.23% 0.57% -1.81% -0.42%<br />
Kayah -1.77% 2.19% -0.43% 0.21% -0.93% -0.24% -1.17% 1.04% -0.38%<br />
Kayin -0.02% -2.65% -1.05% -1.46% 30.10% 8.49% -0.34% 15.48% 5.57%<br />
Chin 3.72% -1.12% 1.60% -6.20% 12.60% -3.12% -0.20% -0.38% -0.26%<br />
Sagaing 0.53% -3.36% -1.09% -0.42% 13.54% 4.73% 0.41% -1.35% -0.31%<br />
Tanintharyi 0.92% -2.14% -0.39% -3.40% 21.90% 2.43% 0.17% -0.02% 0.10%<br />
Bago -0.01% -7.86% -3.08% -3.76% 24.96% 2.34% -1.03% -2.88% -1.59%<br />
Magway -2.10% 4.13% -0.13% -2.61% -7.77% -3.52% -2.47% -4.24% -2.59%<br />
Mandalay -1.59% -3.09% -1.91% 1.02% -7.07% -2.54% -0.60% -4.97% -2.15%<br />
Mon 3.30% 2.21% 3.27% -3.61% -3.58% -2.89% -1.14% 0.02% -0.69%<br />
Rakhine 0.51% -4.57% -1.61% -3.41% 12.76% 0.53% -0.30% -2.64% -1.17%<br />
Yangon 0.10% -7.84% -3.05% 0.34% 8.46% 3.67% 0.15% -4.24% -1.60%<br />
Shan -0.43% 4.35% 1.34% -0.41% -7.13% -2.88% -0.42% 0.09% -0.22%<br />
Ayeyarwady -0.68% -6.07% -2.56% -2.27% -4.96% -2.71% -1.46% -5.60% -2.63%<br />
Union Total 0.29% -2.13% -0.69% -1.80% 2.51% -0.36% -0.26% -1.18% -0.60%<br />
Source: Forest Resource <strong>Assessment</strong> 2005, Forest Department (2005)<br />
country/region<br />
Source: FAO (2000)<br />
table 2d: Forest cover in other GmS countries - 2000<br />
Forest cover (hectares)<br />
country area<br />
(hectares)<br />
Forest cover as % of<br />
country area<br />
Cambodia 9,334,648 17,652,000 52.88%<br />
PRC 163,480,282 932,745,000 17.53%<br />
Lao PDR 12,561,170 23,080,000 54.42%<br />
<strong>Myanmar</strong> 34,418,666 65,755,000 52.34%<br />
Thailand 14,761,800 51,089,000 28.89%<br />
Viet Nam 9,818,558 32,549,000 30.17%
Summary<br />
A.Policy Reference<br />
1.Purpose:<br />
The purpose of the indicator is to show the area covered by the forest formations of a region/<br />
country over time.<br />
2.Relevance to Environment Planning and Management:<br />
Forests serve multiple ecological, socio-economic, and cultural roles in many countries.<br />
They are among the most diverse and widespread ecosystems of the world. Forests provide many<br />
significant resources and functions including: wood products, recreational opportunities, habitat<br />
for wildlife, water and soil conservation, and a filter for pollutants. They support employment and<br />
traditional uses, and biodiversity. There is general concern over human impact on forest health, and<br />
the natural processes of forest growth and regeneration. Combating deforestation to preserve soils,<br />
water, air and biological diversity is explicitly considered in Agenda 21.<br />
The forest area of a country is not directly related to sustainable/unsustainable development.<br />
However, a continuing and fast decreasing forest area in a country might be an alarm signal of<br />
unsustainable practices in the forestry and agricultural sector. A change in the forested area in a<br />
country or region over time can be positive showing a loss of forest area or negative showing an<br />
increase. The availability of accurate data on a country’s forest area, which is a basic characteristic<br />
of its forest resources, is an essential requirement for forest policy and planning within the context<br />
of sustainable development.<br />
3.Linkage to Other Indicators:<br />
The indicator is closely linked with several other environmental indicators, such as land use<br />
and land condition change, wood harvesting intensity, protected forest area, arable land, threatened<br />
species, sustainable use of natural resources in mountain areas, etc.<br />
4.Targets:<br />
The national forest policy adopted in 1995 requires that forested area equivalent to 30% of<br />
total land area should be fully protected as sustainable forest area under public forest estate in the<br />
category of either forest reserve or protected public forest, whereas another 5% should be under<br />
Protected Area System for nature conservation.<br />
5.International Environment Treaties:<br />
The following international treaties and agreements are concerned with forest cover:<br />
International Tropical Timber Agreement for promotion of “Sustainable Forest Management”<br />
Convention on Biological Diversity (CBD) for forest flora and fauna conservation<br />
Convention on International Trade in Endanger Species (CITES) for efficient forest protection<br />
effective to conserving endanger species<br />
Convention on the Conservation of Wetlands of International Importance (Ramsar Convention) for<br />
Contextual protection of forest ecosystem<br />
Convention on Climate Change for forest environmental conservation<br />
Convention to Combat Desertification for natural resource conservation<br />
B.Analysis<br />
As can be observed from Figure 1, forest cover has been declining during last 28 years from<br />
1975 to 1998. Based on FD’s estimates, total forest areas were 41.2, 39.7 and 35.5 million ha in<br />
1975, 1989 and 1998, respectively, corresponding to 61%, 59% and 52% of the whole country<br />
(Table 1). Table 2a shows the loss in different types of forests and larger areas of closed forest (4.8<br />
million ha) equivalent to approximately 7% of total land had disappeared during 1975 to 1998,<br />
while there was a lesser degree of losses in open forest area of 900 thousand ha equivalent to 1.3<br />
% of total land. It was also found out that forest loss had been accelerating after 1989 compared<br />
to the period from 1975 to 1989. As seen in Table 2b, annual loss of forest area during 1989 to<br />
1998<br />
90
(466,000 ha per annum) was four fold higher than the loss (108,000 ha per annum) that occurred<br />
during 1975 to 1989. In comparison, the rate of deforestation was thus found to be 1.18% per<br />
annum for the former period and 0.26% per annum for the latter period. The higher acceleration of<br />
deforestation might be due to the growing timber business and export that was open to the private<br />
sector since the country adopted the market economy in 1988. Further analysis on deforestation<br />
rate of State and Division (Sub-administrative Area of the country) during 1989 to 1998 (as shown<br />
in Table 2c) could provide an explanation of this fact as stated below:<br />
Ayeyarwaddy Division – Annual deforestation rate was 5.6% per annum as total forest cover<br />
declined from 24% of total area in 1989 to 12% in 1998. Major threats to forest loss in this region<br />
were over exploitation of mangrove forest for fuel wood supply to major urban city like Yangon and<br />
expansion of shrimp farming in recent years.<br />
Mandalay Division – Annual deforestation rate was 4.97% per annum as the forest area decreased<br />
from 35% to 19% of total land between 1989 and 1989, fuelled by rapid urbanization in the<br />
central part of the country and commercial exploitation of forest products in the north and south<br />
of the region.<br />
Yangon Division – Annual deforestation rate was 4.97% per annum. Forest cover declined further<br />
from 15% of the total land area in 1989 to 9% in 1998 affected by the closeness to Yangon, the<br />
timber export capital. Forests in the far north of the Division were opened up for commercial timber<br />
extraction and for fuelwood supply to the capital. Increased accessibility due to infrastructure<br />
development in recent years has also attributed to acceleration of forest exploitation.<br />
Magwe Division – Annual deforestation rate was 4.24% per annum. Unlike in other regions, the<br />
overall deforestation took place predominantly in the open forest while a net increase was recorded<br />
in the closed forest after 1989. This was due mainly to the impact of stricter enforcement in the<br />
Shwe Setaw <strong>National</strong> Park and Forest Plantation contrasting with open access elsewhere. Within 9<br />
years, the 38% forest cover (both open and closed forest) in 1989 declined to 23% in 1998.<br />
Bago Division – The teak bearing forests of the Division were being lost at a rate of 2.8% per<br />
annum during the decade 1989-1998. Forest cover declined from 45% to 33% during that period.<br />
The teak forest was under the pressure of the lucrative teak export.<br />
Rakhine State – Annual deforestation rate was 2.6% per annum This coastal area in the western<br />
part of the country is less densely populated and had a high forest cover of 62% in 1989. The<br />
coastal mangrove forests were being encroached for paddy cultivation and shrimp farming. The<br />
forest cover declined to 50 % by 1998.<br />
Kachin State and Sagaing Division are the northern regions of the country with large areas of<br />
commercially valuable species. Many of them disappeared after 1989 as commercially driven<br />
production took hold. Expansion of mining and illegal timber exports to PRC contributed to<br />
deforestation. However, given the initially large forest cover, the average deforestation rate during<br />
the studied decade was only 1.8% in Kachin State and 1.3% in Sagaing Division. These regions<br />
contain the Ayeyarwaddy and Chindwin watersheds and deforestation here poses the threat of<br />
complex socioeconomic and environmental repercussions downstream.<br />
From this explanation, it is clear that higher deforestation has been associated with a higher<br />
potential of the region for commercial forest production and an active local economy. This calls for<br />
attention to be paid to the need for integrating environmental considerations in the development of<br />
the timber business for sustainable use of forest resources. However, it is notable that the current<br />
level of forest cover in <strong>Myanmar</strong> still exceeds half of the country and it is still a higher coverage<br />
compared to other GMS countries’ forest cover as shown in Table 2d. Therefore, the state of forest<br />
resources is relatively good but it shows a deteriorating trend as illustrated by this indicator.<br />
91
Indicator ID<br />
Indicator Name<br />
Greater mekong Subregion<br />
indicator Fact Sheet<br />
dataBaSe inFormation<br />
Year of <strong>Assessment</strong> 2005<br />
Type of Indicator Pressure<br />
Frequently Asked Question (FAQ)<br />
Priority Concern Forest Resources<br />
Geographic Area Union of <strong>Myanmar</strong><br />
Magnitude & Trend High and Increasing<br />
Key Message<br />
92<br />
Ratio of Wood Removal over Thousand Hectares<br />
of Forest Cover – 1975 to 2001<br />
What are the impacts of wood extraction on the<br />
remaining forest resources?<br />
Wood removal per thousand hectares of forest<br />
area has increased two fold from 624 to 1232<br />
cubic meters during 1975 to 2000. The available<br />
global data (1961-1994) had suggested that this<br />
was relatively low (approx. half the magnitude)<br />
in <strong>Myanmar</strong> when compared to GMS or Asian<br />
countries. But as with all other GMS countries,<br />
the indicator value is 90% dependent on fuelwood<br />
removal, which itself can only be estimated.<br />
Therefore the absolute value of the indicator<br />
is subject to a high level of estimation errors.<br />
While the total removal rate is relatively low,<br />
another doubling of the removal rate would bring<br />
<strong>Myanmar</strong> at par with the rate of other GMS<br />
countries. The trend is moving in this direction, as<br />
removal from logging operations continue to rise<br />
and there is only slight evidence of relief on the<br />
fuelwood extraction.
technical inFormation<br />
A.Definition<br />
This indicator is expressed as the ratio of total annual roundwood production, in m3, over the<br />
total forest area in thousands of hectares. The indicator represents the total wood extraction per<br />
1000 ha of forested land.<br />
Roundwood production refers to all wood in the rough, whether destined for industrial or fuelwood<br />
uses. All wood felled or harvested from forests and trees outside the forest, with or without bark,<br />
round, split, roughly squared, or in other forms such as roots and stumps, is included. Wood<br />
that is harvested for charcoal production is also included. All wood production data refer to both<br />
coniferous and non-coniferous species.<br />
Total forest area includes both natural forests and plantations. Forest area is defined as land with<br />
tree crown cover of more than 10% on the ground and an area of more than 0.5 ha. Tree height at<br />
maturity should exceed 5 m.<br />
B.Data Source<br />
The data utilized for this indicator originate from the Planning and Statistics Division of the<br />
Forest Department and from the <strong>National</strong> Statistical Yearbooks of 1980, 1989, 1994, 1997 and<br />
2002, published by the Central Statistical Organization (CSO) on a regular basis.<br />
C.Geographic Area / Population Coverage<br />
The data utilized for the construction of this indicator are representative of the Union of<br />
<strong>Myanmar</strong> as a whole and include both wood removal for domestic consumption and export.<br />
D.Temporal Coverage<br />
Figures for round wood removal, which forms the numerator of the indicator, were available on<br />
an annual basis from 1975 to 2001. Figures for forest cover, which forms the denominator of the<br />
indicator, were only available for 1975, 1989 and 1998.<br />
E.Methodology and Frequency of Coverage<br />
Annual extraction rates of teak and hardwood were given in statistical yearbooks of the Central<br />
Statistical Organization based on the data provided by government timber extraction agency. For<br />
fuelwood removal, annual volume of fuelwood extracted was estimated by Forest Department<br />
multiplying rural and urban population with the respected rate of per capita fuelwood consumption<br />
both in rural and urban area, which was based on the result of fuelwood surveys conducted by<br />
Forest Department in the past three decades. This per capita consumption rate included the<br />
household consumption of both firewood and charcoal.<br />
Forest area was given for three representative years of 1975, 1989 and 1998 based on various<br />
studies of Forest Resource <strong>Assessment</strong> conducted by the Forest Department (FD) using remote<br />
sensing and geographical information system.<br />
F.Methodology of Data Manipulation<br />
Round wood extraction of teak and hardwood is summed up with total volume of fuelwood<br />
extraction in order to estimate total wood removal. Original figures for logs removal and<br />
fuelwood removal were expressed in hoppus tons and have been converted to cubic meters using<br />
conversion factor of 1.8024 cubic meters per hoppus ton. A straight line method was employed in<br />
interpolating forest area for those gap years during the period of 1975 to 2001. Total wood removal<br />
is then divided by total forest area and multiplied by 1000 for estimating the ratio of wood removal<br />
per thousand hectares of forest area.<br />
93
Qualitative inFormation<br />
A.Strength and Weakness (data level)<br />
In countries dominated by natural forest areas, the relative value of the indicator is indicative<br />
of the pressure of the logging industry on the remaining forest resources. It may be less indicative<br />
of this pressure if the country has a high proportion of plantation forest.<br />
The denominator of the indicator is not sensitive to and does not provide for forests under<br />
strict protection from logging operations. The indicator should nevertheless be reduced to zero if<br />
all of the remaining forest becomes protected from all logging operations.<br />
The major weakness of the indicator, at the data level, is that more than 90% of the wood<br />
removal is for fuelwood, and fuelwood removal is estimated rather that measured.<br />
B.Reliability, Accuracy, Robustness, Uncertainty (data level)<br />
Some data discrepancy may exist for the following reasons:<br />
Forest area estimates may be lower than actual cover due to inconsistencies applied in forest<br />
assessment, particularly between manual and digital technique in interpretation forest and due<br />
area calculation. Especially, delineating open forest area may be quite sensitive in data accuracy.<br />
Official round wood extraction and fuelwood extraction may be associated with discrepancies<br />
such as underestimating measurement and under reporting of the total quantity for volume<br />
estimation, and interpreting the latter.<br />
The rate of per capita fuelwood consumption which was linked to an estimation of household<br />
fuelwood production may be no longer valid in capturing the trend of recent years as it was last<br />
calculated 20 years ago.<br />
Unofficial extraction of both log and fuelwood which is considered to be quite substantial, is<br />
not included in the total estimation.<br />
C.Future Work Required (for data level and indicator level)<br />
Improving data accuracy in estimation of forest area and round wood removal should be<br />
carried out. A new survey studying wood energy consumption and production, both rural and urban,<br />
should be carried out for updating the basic assumption and rate used in estimating fuelwood<br />
consumption and production at national level. Especially, the percentage of fuelwood supply from<br />
natural forest for the use of rural household and cottage industry should be sought in making a<br />
closer estimation of the real situation.<br />
94
SupportinG data taBleS, GraphS and mapS<br />
Figure 1: ratio of annual Wood removal to one thousand hectares of Forest area<br />
Cubic Meters per 1000 Hectares of<br />
Forest Cover<br />
1400<br />
1200<br />
1000<br />
800<br />
600<br />
400<br />
200<br />
0<br />
1975<br />
1977<br />
95<br />
1979<br />
1981<br />
1983<br />
1985<br />
1987<br />
1989<br />
1991<br />
1993<br />
1995<br />
1997<br />
1999<br />
table 1a: ratio of annual Wood removal to one thousand hectares of Forest area<br />
year<br />
Forest area<br />
(thousand<br />
hectares)<br />
log (m3) Fuelwood<br />
(m 3 )<br />
total<br />
removal<br />
(m 3 )<br />
2001<br />
ratio of<br />
removal<br />
m 3 /1000<br />
h.<br />
% of<br />
Fuelwood<br />
removal<br />
1975 41,196 1,187,625 24501377 25,689,001 623.58 95.4%<br />
1976 41,088 1,289,583 25,001,240 26,290,823 639.87 95.1%<br />
1977 40,980 1,288,763 25,509,166 26,797,929 653.93 95.2%<br />
1978 40,872 1,534,318 26,025,154 27,559,472 674.29 94.4%<br />
1979 40,764 2,165,405 26,557,267 28,722,672 704.61 92.5%<br />
1980 40,656 2,178,581 27,097,442 29,276,023 720.09 92.6%<br />
1981 40,548 2,056,410 27,645,680 29,702,090 732.51 93.1%<br />
1982 40,440 1,943,467 28,201,979 30,145,446 745.43 93.6%<br />
1983 40,332 1,251,432 28,750,217 30,001,648 743.86 95.8%<br />
1984 40,225 1,700,326 29,314,579 31,014,905 771.04 94.5%<br />
1985 40,117 1,736,218 29,887,003 31,623,221 788.28 94.5%<br />
1986 40,009 1,427,932 30,475,552 31,903,484 797.41 95.5%<br />
1987 39,901 1,347,397 31,072,164 32,419,560 812.50 95.8%<br />
1988 39,793 1,376,021 31,676,837 33,052,858 830.62 95.8%<br />
1989 39,685 1,635,191 32,273,449 33,908,640 854.44 95.2%<br />
1990 39,218 1,896,815 32,886,185 34,783,000 886.91 94.5%<br />
1991 38,752 1,930,515 33,498,921 35,429,435 914.26 94.6%<br />
1992 38,286 1,755,595 34,119,719 35,875,314 937.05 95.1%<br />
1993 37,819 1,966,604 34,764,704 36,731,308 971.24 94.6%<br />
1994 37,353 1,365,772 35,409,689 36,775,462 984.55 96.3%<br />
1995 36,886 1,600,439 36,070,799 37,671,239 1021.28 95.8%<br />
1996 36,420 1,686,958 36,739,971 38,426,930 1055.11 95.6%<br />
1997 35,953 1,921,295 37,409,144 39,330,439 1093.93 95.1%<br />
1998 35,487 2,010,734 38828111 40,838,845 1150.81 95.1%<br />
1999 35,021 2,003,557 39,610,156 41,613,713 1188.26 95.2%<br />
2000 34,554 2,164,863 40,416,387 42,581,250 1232.30 94.9%<br />
2001 34,088 2,544,789 31,586,825 34,131,614 1001.29 92.5%<br />
Source: Forest Department 2005, Statistical Yearbooks CSO, 1980, 1989, 1994, 1997 & 2002
Figure 2:volume of round Wood extracted for teak and hardwood in hoppus tons<br />
Hoppus Ton<br />
3,000,000<br />
2,500,000<br />
2,000,000<br />
1,500,000<br />
1,000,000<br />
500,000<br />
0<br />
Teak Hardwoods Total<br />
1975<br />
1976<br />
1977<br />
1978<br />
1979<br />
1980<br />
1981<br />
1982<br />
1983<br />
1984<br />
1985<br />
1986<br />
1987<br />
1988<br />
1989<br />
1990<br />
1991<br />
1992<br />
1993<br />
1994<br />
1995<br />
1996<br />
1997<br />
1998<br />
1999<br />
2000<br />
2001<br />
table 2:volume of round Wood removal (commercial logging in hoppus tons)<br />
year teak hardwoods total<br />
96<br />
% of teak<br />
removal<br />
1975 231,084 427,829 658,913 35.1%<br />
1976 265,199 450,282 715,481 37.1%<br />
1977 317,330 397,696 715,026 44.4%<br />
1978 449,479 401,785 851,264 52.8%<br />
1979 478,214 723,187 1,201,401 39.8%<br />
1980 485,079 723,632 1,208,711 40.1%<br />
1981 516,886 624,043 1,140,929 45.3%<br />
1982 489,019 589,247 1,078,266 45.4%<br />
1983 296,682 397,632 694,314 42.7%<br />
1984 358,123 585,245 943,368 38.0%<br />
1985 416,466 546,815 963,281 43.2%<br />
1986 383,275 408,964 792,239 48.4%<br />
1987 381,180 366,377 747,557 51.0%<br />
1988 357,076 406,362 763,438 46.8%<br />
1989 387,753 519,477 907,230 42.7%<br />
1990 441,588 610,795 1,052,383 42.0%<br />
1991 388,697 682,383 1,071,080 36.3%<br />
1992 345,186 628,846 974,032 35.4%<br />
1993 331,944 759,159 1,091,103 30.4%<br />
1994 226,453 531,299 757,752 29.9%<br />
1995 232,397 655,552 887,949 26.2%<br />
1996 203,122 732,829 935,951 21.7%<br />
1997 239,147 826,818 1,065,965 22.4%<br />
1998 251,932 863,655 1,115,587 22.6%<br />
1999 260,966 850,639 1,111,605 23.5%<br />
2000 250,500 950,600 1,201,100 20.9%<br />
2001 276,068 1,135,821 1,411,889 19.6%<br />
Source: Statistical Year Books, Central Statistical Organization
Figure 2:volume of round Wood extracted for teak and hardwood in hoppus tons<br />
cubic meter per hectares'000<br />
2500<br />
2000<br />
1500<br />
1000<br />
500<br />
0<br />
1961<br />
1963<br />
GMS Countries As ia OECD Countries World<br />
1965<br />
1967<br />
1969<br />
1971<br />
1973<br />
1975<br />
97<br />
1977<br />
1979<br />
1981<br />
1983<br />
1985<br />
1987<br />
1989<br />
1991<br />
1993
table 3: ratio of round Wood production to total Forest area<br />
(cubic meters per 1000 hectares) – GmS and the World – 1961-1994<br />
year GmS countries asia<br />
98<br />
oecd<br />
countries<br />
World<br />
1961 824 1348 671 536<br />
1962 820 1339 672 539<br />
1963 851 1355 667 545<br />
1964 882 1383 699 562<br />
1965 905 1401 710 568<br />
1966 926 1447 740 580<br />
1967 956 1468 732 585<br />
1968 980 1484 741 592<br />
1969 1004 1510 755 599<br />
1970 1030 1521 764 610<br />
1971 1060 1543 764 617<br />
1972 1097 1586 754 619<br />
1973 1128 1615 787 636<br />
1974 1175 1634 787 639<br />
1975 1270 1654 717 630<br />
1976 1303 1711 780 654<br />
1977 1341 1684 774 656<br />
1978 1374 1708 823 672<br />
1979 1425 1748 870 693<br />
1980 1459 1771 871 693<br />
1981 1471 1768 849 691<br />
1982 1516 1808 817 691<br />
1983 1564 1834 879 714<br />
1984 1638 1874 929 737<br />
1985 1688 1880 924 741<br />
1986 1734 1914 945 753<br />
1987 1774 1957 975 771<br />
1988 1800 1970 989 779<br />
1989 1810 1980 1004 789<br />
1990 1804 1958 999 783<br />
1991 1782 1957 910 758<br />
1992 1809 1901 933 766<br />
1993 1854 1902 943 763<br />
1994 1877 1892 978 765<br />
Source: FAOSTAT, 2004
Summary<br />
A.Policy Reference<br />
1.Purpose:<br />
The purpose of this indicator is to measure the relative pressure of logging and fuelwood<br />
operations on the forest as a whole, regardless of protection status. It compares the total forest<br />
felling as a ratio to the total remaining forest area.<br />
The United Nations have proposed a wood harvesting intensity indicator with a similar<br />
enumerator but with a much different denominator. The UN indicator proposes to make use of total<br />
annual productive forest increment as the denominator, hence comparing the total forest fellings<br />
as a percentage of net annual increment. The UN however admits that such a denominator does<br />
not yet exist for most tropical natural forests and that more work is needed to develop such an<br />
enumerator. Hence the substitution of total forest area for the development of this indicator.<br />
2.Relevance to Environment Planning and Management:<br />
Unlike the proposed UN indicator which aims at assessing whether forests are being used<br />
within the limits of their actual productivity, this indicator is aimed at measuring the rate at<br />
which intensive logging and wood-cutting activities destroy the overall forest cover. Maintaining<br />
or increasing the percentage forest cover is a high priority in most GMS countries; hence the<br />
appropriateness of this indicator which utilizes total forest area as the denominator.<br />
3.Linkage to Other Indicators:<br />
This indicator is closely related to a separate indicator which measures the per capita<br />
fuelwood production. This indicator is based on total roundwood production and includes fuelwood<br />
and wood use for charcoal production along with wood used for commercial timber. The majority of<br />
roundwood production in <strong>Myanmar</strong> is utilized for fuelwood and commercial timber operations have<br />
less of an impact on the overall forest resources.<br />
4.Targets:<br />
Following the principles of sustainable yield management which <strong>Myanmar</strong> has been practicing<br />
over decades, a logging target which is known as Annual Allowable Cut (AAC) exists for the<br />
extraction of teak and hardwood based on balance of stocking density in remaining forest. Since<br />
1996, AAC for teak is set at 227,000 Hoppus Ton Per Annum (approximately equivalent to 400,000<br />
cubic meters per annum). Before 1986, it was 350,000 Hoppus Ton.<br />
There is no quantifiable target exist for fuelwood extraction although general policy aims<br />
for reducing its consumption and production by wood energy saving and alternative energy<br />
development such as promoting hydro-electricity generation.<br />
5.International Environment Treaties:<br />
Many international agreements cover forests. <strong>Myanmar</strong> is supported to maintain or increase<br />
their forested areas, and discouraged to strongly reduce their forest lands. Specific forest<br />
agreements would include the Non-Legally Binding Authoritative Statement of Principles for a<br />
Global Consensus on the Management, Conservation and Sustainable Development of All Types of<br />
Forests (the Forest Principles of the United Nations Conference on Environment and Development<br />
(UNCED)); and the International Tropical Timber Agreement. Many other international agreements<br />
deal with forests within the context of natural resources and environment conservation, for example<br />
Convention on International trade in Endangered Species (CITES), Convention on the Conservation<br />
of Wetlands of International Importance (Ramsar Convention), Convention on Biological Diversity,<br />
Convention on Climate Change, Convention to Combat Desertification. In addition, ASEAN<br />
agreements on sustainable natural resource management have been established.<br />
99
B.Analysis<br />
As can be observed from Figure 1 and Table 1a, the ratio of wood removal per unit of forest<br />
area has increased steadily from approx. 625 cubic meters per thousand hectares in 1975 to more<br />
than 1000 cubic meters from 1995 onwards. The rate of removal doubled during the period of the<br />
first forest cover assessment (1975 to 1989) and this level of incline continued through to year<br />
2000. There is a noticeable drop in the ratio of the indicator between year 2000 and 2001 but it is<br />
noted that this decline is based on a single observation and based on an un-confirmed decline in<br />
the fuelwood extraction rate.<br />
As can be observed from Figure 2 and Table 2, commercial logging operations doubled during<br />
the same 25-year period but with fluctuating or oscillating pattern.<br />
Since 1975 it had been gradually increased reaching to second highest peak in total<br />
production of both teak and hardwood at 1.2 million tons in 1980. The increase during early 1980<br />
might be strongly related to the policy at that time in reducing the exploitation girth limit of timber<br />
species for the sake of successive economic return and growth in forestry sector under socialist<br />
planning.<br />
Teak extraction had reached the highest peak level in production around 1980. Total<br />
production of commercial logging including teak had somewhat declined after 1980 until<br />
1988. The increasing total production during 1989 to 1993 was related to liberalizing the<br />
commercialization of forest production largely due to the private sector since <strong>Myanmar</strong> adopted an<br />
open market system in 1988. At that time, forest concession along the Thai-<strong>Myanmar</strong> border area<br />
had also resulted in increasing total production volume. When opening annual forest concessions<br />
to the private sector on a competitive basis had stopped around 1993, total production had again<br />
declined for 3 years from 1994 to 1996 before resuming its rise in production since 1997 when the<br />
economic recession in South East Asia started. The highest level of wood removal by commercial<br />
logging for the last 30 years was reached in 2001 with a total volume of 1.4 million tons.<br />
Alongside this fluctuating upward trend within the last 30 years, teak had also relatively<br />
followed a rise in production, however, stagnant or stable extraction has remained around 200,000<br />
to 250,000 tons per annum level in recent years indicating its decline in productive capacity from<br />
remaining natural forest. In contrast, hardwood production has been noticeably boosted in recent<br />
decades. Increasingly land clearing for dam construction at the target of completing 12 dams<br />
per year has been somehow conducive to a gradual increase in wood removal in recent years.<br />
Historically, it is noticeable within last 3 decades that a higher rise in round wood removal has been<br />
affected and derived by the concern of progressive economic growth. Fluctuating wood removal for<br />
the logging industry also creates the argument about meeting the sustainable yield management in<br />
which the production trend is quite stable without frequent rise and fall.<br />
The current ratio of wood removal in <strong>Myanmar</strong> is approx. 1000 cubic meters per 1000<br />
hectares of forest land. As illustrated in Figure 3 and Table 3, this is not an excessive amount when<br />
compared to OECD countries and is well below the average of all GMS or other Asian countries.<br />
However, this data set was only for the years up to 1994 and only gave a glance at the scenario for<br />
the last ten years ago. With the increasing population and higher dependency on forest biomass for<br />
household energy, the trend of wood removal is going to be continued until now as it increased two<br />
fold during the period from 1975 to 2000. This fact concludes the determination of this indicator<br />
that the pressure from wood removal onto forest resource is high and increasing.<br />
100
Indicator ID<br />
Indicator Name<br />
Greater mekong Subregion<br />
indicator Fact Sheet<br />
dataBaSe inFormation<br />
Year of <strong>Assessment</strong> 2005<br />
Type of Indicator Response<br />
Frequently Asked Question (FAQ)<br />
Priority Concern Forest Resources<br />
Geographic Area Union of <strong>Myanmar</strong><br />
101<br />
Expenditure on Forest Conservation - 1988 to<br />
2001<br />
Impact & Trend Average and Intermittent<br />
Key Message<br />
Have sufficient funds been allocated to the<br />
conservation and management of forest resources<br />
in <strong>Myanmar</strong>?<br />
From 1988 to 2001, financial expenditure of both<br />
the Forest Department and Dry Zone Greening<br />
Department on forest conservation ranged from<br />
92 to 283 Million Kyat with a fluctuating trend.<br />
In only two years, 2000 and 2001, was the level<br />
of spending higher than that of 1988. Thus,<br />
the response for improving forest resource is<br />
intermittent over the period and its magnitude<br />
is considered average as the level of spending<br />
in 2001, especially capital expenditure was not<br />
markedly different from the1988 level and it is<br />
likely to decline further under the continuous<br />
trend of market inflation.
technical inFormation<br />
A.Definition<br />
This indicator attempts to track expenditures on forest conservation over time. Expenditures<br />
are expressed in local currency (Kyats) and adjusted to 1988 base-year level using the Consumer<br />
Price Index (CPI).<br />
Expenditure on forest conservation includes expenses on forest plantation, management<br />
of forest reserves, enhancement of natural regeneration, forestry research, training, wildlife<br />
conservation, personnel and administration.<br />
Expenditure figures for the main indicator value are differentiated as capital or current<br />
expenditure. Capital expenditure includes expenditure for permanent buildings, roads, machinery<br />
etc., plus forest plantation. Current expenditure includes operational expenses such as wages,<br />
training, office supplies, etc.<br />
Expenses on Forest Plantation: This is the sum of current and capital expenditure that the<br />
Forest Department incurred for the establishment of all type of forest plantations which include<br />
watershed plantation, commercial teak and hardwood species plantation, fuelwood plantation,<br />
industrial plantation and aesthetic plantation.<br />
Expenses on Management of Forest Reserve: This is the sum of current and capital<br />
expenditure that the Forest Department incurred for forest operations related to the expansion<br />
and maintenance of existing forest reserves such as boundary demarcation, fire protection,<br />
improvement felling, etc.<br />
Expenses on Natural Regeneration: This is the sum of current and capital expenditure that the<br />
Forest Department (FD) incurred for natural regeneration of selected species in natural forest.<br />
Expenses on Forestry Research: This is the sum of current and capital expenditure that FD<br />
incurred for conducting forestry research works dedicated to sustainable forest management by<br />
Forest Research Institute under Ministry of Forestry.<br />
Expenses on Forestry Training: This is the sum of current and capital expenditure that<br />
FD incurred for the training of forestry staff and communities who are active personnel in the<br />
protection and conservation of forest throughout the country.<br />
Expenses on Wildlife Conservation: This is the sum of current and capital expenditure that<br />
FD incurred for field operations related to the maintenance of wildlife parks and sanctuaries and<br />
maintenance of forest reserves.<br />
Expenses on Personnel: This is the sum of current expenditure of FD incurred for salary and<br />
remuneration of staff working under FD.<br />
Expenses on Administration: This is the sum of current and capital expenditure that the Forest<br />
Department incurred for stationery, office maintenance, transportation and overall administration<br />
in running day-to-day work of FD both at headquarters and in township offices throughout the<br />
country.<br />
102
B.Data Source<br />
Expenditure figures for both departments were obtained at source, at the request of the<br />
<strong>National</strong> Commission for <strong>Environmental</strong> Affairs (NCEA). They originate from annual budget reports.<br />
Consumer Price Index figures originate from Central Statistical Organization reports.<br />
C.Geographic Area / Population Coverage<br />
The figures for financial expenditure by FD and the Dry Zone Greening Department and<br />
representative of the expenditures of those two departments throughout the Union of <strong>Myanmar</strong>.<br />
They do not include expenditures on forest conservation incurred by other parties.<br />
D.Temporal Coverage<br />
Expenditure figures for the Forest Department cover the period of 1994 to 2001 consecutively<br />
and selectively for year 1988 to 2002. Dry Zone Greening Department data cover the period from<br />
1997 to 2001 as the Department was established in 1997.<br />
E.Methodology and Frequency of Coverage<br />
Financial figures are excerpted and compiled from annual budget reports of FD (1994-2001)<br />
and for Dry Zone Greening Department from Second <strong>National</strong> <strong>Report</strong> on UNCCD Implementation of<br />
the Union of <strong>Myanmar</strong> (April 2002).<br />
F.Methodology of Data Manipulation<br />
Annual expenditures, in millions of kyat, have been adjusted to 1988 levels using the rise in<br />
CPI since that base year (see last column of Table 1a). The adjustment for a given year is the result<br />
of multiplying the expenditure by 100 (the CPI for the base year 1988) and dividing the result by<br />
the corresponding CPI value.<br />
Qualitative inFormation<br />
A.Strength and Weakness (data level)<br />
The major strength of this indicator, especially when adjusted to CPI, is that it tracks annual<br />
government expenditures on forest conservation without any influence from other non-government<br />
or international agencies who may at times be making significant expenditure in the same area.<br />
The purpose of the indicator is to track Union of <strong>Myanmar</strong> government expenditure and not all<br />
expenditure on forest conservation in <strong>Myanmar</strong>.<br />
One of the weaknesses of the indicator is that the expenditure values are expressed in local<br />
currency, and the indicator is not normalized to some measure of conservation forest area. Both of<br />
these factors make it difficult to draw any conclusion as to whether or not the conservation effort is<br />
sufficiently funded to start with and/or to compare the relative trend with other GMS countries.<br />
Another weakness of the indicator is that it does not give an indication of what conservation<br />
efforts are included in the expenditure, and how much of the expenditure is dedicated to<br />
operational overheads. In this fact sheet, this weakness has been partially overcome but providing<br />
similar tables by various categories of conservation effort.<br />
B.Reliability, Accuracy, Robustness, Uncertainty (data level)<br />
Expenditure figures are quoted from official government sources and are subject to the same<br />
reliability, accuracy and uncertainties of any other government expenditures.<br />
C.Future Work Required (for data level and indicator level)<br />
It will be necessary too update the fact sheet on an annual basis as newer data become<br />
available.<br />
103
table 1a:annual expenditure of Forest department and dry Zone Greening<br />
department on Forest conservation at 1988 constant price level (million Kyats)<br />
year<br />
Million Kyat at 1988 constant price lev<br />
300<br />
250<br />
200<br />
150<br />
100<br />
-<br />
SupportinG data taBleS, GraphS and mapS<br />
Figure 1: expenditure on Forest conservation at 1988 constant price level<br />
50<br />
1988<br />
Forest department<br />
Capital Current Total<br />
1994<br />
1995<br />
dry Zone Greening<br />
department<br />
104<br />
Both Forest dept & dZGd<br />
capital current total capital current total capital current<br />
1996<br />
Grand<br />
total<br />
cpi<br />
1988=100<br />
1988 66 109 175 - - - 66 109 175 100<br />
1994 31 68 99 - - - 31 68 99 389<br />
1995 32 60 92 - - - 32 60 92 475<br />
1996 35 56 92 - - - 35 56 92 570<br />
1997 55 62 116 21 10 31 76 72 147 584<br />
1998 51 54 105 24 19 43 76 72 148 760<br />
1999 72 59 131 24 18 42 96 77 173 879<br />
2000 80 144 224 24 34 58 104 179 283 864<br />
2001 66 114 180 19 28 47 84 143 227 1162<br />
Source: Calculated based on CSO 2002, Forest Department 2005 and NCEA 2002<br />
1997<br />
1998<br />
1999<br />
2000<br />
2001
table 1b: nominal value of annual expenditure of Forest department and dry<br />
Zone Greening department on Forest conservation (million Kyats)<br />
year<br />
Forest department<br />
dry Zone Greening<br />
department<br />
105<br />
Both Forest dept & dZGd<br />
capital current total capital current total capital current Grand<br />
total<br />
1988 66 109 175 - - - 66 109 175<br />
1994 121 265 387 - - - 121 265 387<br />
1995 153 283 436 - - - 153 283 436<br />
1996 202 320 522 - - - 202 320 522<br />
1997 319 360 679 123 58 181 442 418 860<br />
1998 390 409 799 185 141 327 575 550 1,125<br />
1999 633 518 1151 212 158 370 845 675 1,521<br />
2000 691 1248 1939 205 298 503 896 1,546 2,442<br />
2001 762 1326 2089 216 330 546 978 1,656 2,635<br />
Source: CSO2002, Forest Department 2005 and NCEA 2002<br />
Figure 2: percentage Share of itemized annual expenditure of Forest department at<br />
1988 constant prices<br />
100%<br />
90%<br />
80%<br />
70%<br />
60%<br />
50%<br />
40%<br />
30%<br />
20%<br />
10%<br />
0%<br />
1988 1994 1995 1996 1997 1998 1999 2000 2001 2002<br />
Forest Reserve Natural Regeneration Forest Plantation Forestry Research<br />
Forestry Training Wildlife Personnel Administration
table 2a: percentage Share of itemized expenditure of Forest department at<br />
1988 constant prices<br />
year<br />
Forest<br />
reserve<br />
natural<br />
regeneration<br />
Forest<br />
plantation<br />
Forestry<br />
research<br />
106<br />
Forestry<br />
training<br />
Wildlife personnel administration total<br />
1988 0.06% 0.05% 27.56% 2.72% 0.00% 7.13% 14.19% 48.29% 100%<br />
1994 0.04% 0.05% 22.45% 2.44% 0.00% 6.41% 33.07% 35.54% 100%<br />
1995 0.07% 0.04% 24.77% 2.74% 1.32% 6.08% 29.98% 35.00% 100%<br />
1996 0.16% 0.14% 24.97% 2.88% 1.22% 9.32% 25.81% 35.50% 100%<br />
1997 0.55% 0.37% 34.22% 2.69% 1.11% 8.01% 19.17% 33.89% 100%<br />
1998 0.42% 0.25% 34.20% 2.41% 1.87% 9.66% 16.29% 34.90% 100%<br />
1999 0.53% 0.48% 34.57% 1.70% 2.47% 15.26% 11.56% 33.42% 100%<br />
2000 0.44% 0.58% 25.15% 2.15% 1.85% 5.49% 30.52% 33.82% 100%<br />
2001 0.34% 1.61% 24.56% 2.27% 1.97% 5.75% 28.34% 35.16% 100%<br />
2002 0.28% 1.35% 28.04% 2.08% 2.17% 4.96% 30.76% 30.36% 100%<br />
Source: Forest Department (2005) & CSO 2002<br />
table 2b:annual expenditure of Forest department at 1988 constant price level<br />
(million Kyats)<br />
year Forest<br />
reserve<br />
natural<br />
regeneration<br />
Forest<br />
plantation<br />
Forestry<br />
research<br />
Forestry<br />
training<br />
Wildlife personnel administration total<br />
1988 0.11 0.08 48.30 4.77 0.00 12.50 24.86 84.63 175.25<br />
1994 0.04 0.05 22.30 2.42 0.00 6.37 32.84 35.30 99.31<br />
1995 0.07 0.04 22.76 2.52 1.21 5.59 27.55 32.16 91.89<br />
1996 0.15 0.12 22.89 2.64 1.12 8.54 23.67 32.55 91.68<br />
1997 0.64 0.43 39.78 3.12 1.29 9.31 22.28 39.40 116.24<br />
1998 0.44 0.27 35.94 2.53 1.96 10.15 17.12 36.67 105.08<br />
1999 0.70 0.62 45.25 2.23 3.24 19.98 15.14 43.75 130.90<br />
2000 0.98 1.30 56.46 4.82 4.15 12.31 68.51 75.92 224.45<br />
2001 0.61 2.90 44.16 4.07 3.54 10.34 50.94 63.21 179.76<br />
2002 0.42 2.03 42.25 3.14 3.27 7.47 46.34 45.73 150.65<br />
Source: Forest Department (2005) & CSO 2002<br />
year<br />
table 2c: nominal value of annual expenditure incurred by Forest department<br />
Forest<br />
reserve<br />
natural<br />
regeneration<br />
Forest<br />
plantation<br />
Forestry<br />
research<br />
Forestry<br />
training<br />
Wildlife personnel administration total<br />
1988 0.11 0.08 48.30 4.77 0.00 12.50 24.86 84.63 175.25<br />
1994 0.15 0.18 86.85 9.43 0.00 24.81 127.89 137.47 386.77<br />
1995 0.31 0.19 108.00 11.94 5.74 26.53 130.72 152.62 436.04<br />
1996 0.85 0.71 130.37 15.05 6.37 48.64 134.79 185.37 522.14<br />
1997 3.72 2.50 232.43 18.26 7.54 54.39 130.20 230.21 679.25<br />
1998 3.34 2.03 273.19 19.26 14.90 77.19 130.17 278.77 798.85<br />
1999 6.13 5.47 397.78 19.60 28.46 175.67 133.06 384.63 1150.81<br />
2000 8.49 11.23 487.77 41.67 35.84 106.37 591.94 655.95 1939.26<br />
2001 7.13 33.68 513.12 47.33 41.13 120.10 591.91 734.49 2088.88<br />
2002 7.72 37.33 776.20 57.67 60.03 137.25 851.37 840.25 2767.81<br />
Source: Forest Department (2005) & CSO 2002
Summary<br />
A.Policy Reference<br />
1.Purpose:<br />
The purpose of the indicator is to measure expenditures on forest conservation as a societal<br />
response to preserving existing forest resources.<br />
2.Relevance to Environment Planning and Management:<br />
Expenditure on forest conservation provides a general indication of a country’s financial<br />
efforts directed towards forest conservation. However, as absolute figures, their relevance for<br />
policy purposes is limited and forest conservation expenditure has to be related to other variables,<br />
such as Gross Domestic Product (GDP) or Consumer Price Index (CPI). The relation between<br />
forest conservation expenditure and the state of the forest resources can only be explored<br />
with supplementary information on the overall context of a country. Out of context, high forest<br />
conservation expenditure can be associated both with low environmental quality (the situation<br />
makes expenditure necessary) and with high environmental quality (which has improved as a result<br />
of the conservation expenditure).<br />
3.Linkage to Other Indicators:<br />
This indicator may be linked with other indicators concerned with forest conservation as a<br />
response measure to biodiversity, land degradation, etc.<br />
B.Analysis<br />
As shown in Figure 1, the trend of financial resource available for forest conservation has been<br />
mixing with the up and down trend over the period 1988 to 2001. In fact, annual expenditure for<br />
forest conservation rose 15 times in nominal terms over the same period 1988 to 2001. Adjusted<br />
for price inflation, however, the expenditure has decreased. The total expenditure at constant price<br />
of both Forest Department (FD) and Dry Zone Greening Department (DZGD) during the period<br />
of 1994 to 1999 was lower than the 1988 levels (Table 1a). Increase in total real expenditure<br />
after 1999 was mainly due to an increase in current expenditure (mainly salaries of government<br />
employees). It is observable in figure 1 that the trend of current expenditure showed an increase in<br />
2000 while there was not much change in the trend of capital expenditure.<br />
The trend in allocating the given financial resources by the Forest Department for forest<br />
conservation was depicted by the percentage share of itemized budget expenditures in Figure<br />
2 based on data given in Table 2a, Table 2b and Table 2c. Obviously, the expenditure incurred<br />
for personnel and administration constituted the major shares of total budget ranging from<br />
minimal 45% to maximum 69% of total expenditure over the period 1994 to 2001. Budget<br />
available for Forest Plantation was modest with the expenditures accounting for 25% to 35% of<br />
total expenditure during the same period. Expenditure for important conservation works such as<br />
maintaining forest reserve, conducting natural regeneration and promoting forestry training and<br />
research are very minimal and account for not more than 7% of total expenses in peak year (2001)<br />
even if all of them are combined.<br />
Given the inflation rate over the period 1988 to 2001, the financial resource made available<br />
for forest conservation had been weakened and total expenditure that was higher than 1988’s<br />
level was observed only in the years 2000 and 2001. With the fluctuating trend and limited<br />
capital expenditure, total financial expenditure on forest conservation is considered average and<br />
intermittent in responding to the improvement of forest resources.<br />
107
Indicator ID<br />
Indicator Name<br />
Greater mekong Subregion<br />
indicator Fact Sheet<br />
dataBaSe inFormation<br />
Year of <strong>Assessment</strong> 2005<br />
Type of Indicator Response<br />
Frequently Asked Question (FAQ)<br />
Priority Concern Forest Resources<br />
Geographic Area Union of <strong>Myanmar</strong><br />
Impact & Trend Average & Consistent<br />
Key Message<br />
108<br />
Permanent Forest Estate as a Percentage of Total<br />
Land Area -1985 to 2003<br />
Is the area of Permanent Forest Estate increasing<br />
and sufficient for legal protection of forest<br />
resources?<br />
Permanent Forest Area (PFE) has increased<br />
from 15% of total land area in 1995 to 22% in<br />
2003/04. The PFE target in the 1995 Forest Policy<br />
is 30% and forested area equivalent to 1% of<br />
total land has been annually reclaimed for PFE<br />
during the period from 1998 to 2003. As PFE area<br />
before 1995 was 15%, the present PFE coverage<br />
is intended to achieve a further 7%, equivalent to<br />
half the additional target since the policy became<br />
effective. Thus, the response in protecting forest<br />
resource is consistent and the magnitude of this<br />
indicator is average in achieving the policy target.
technical inFormation<br />
A.Definition<br />
This indicator attempts to track the amount of natural and plantation area under forest legal<br />
protection tracked over time; it is expressed as a percentage of the permanent forest estate area<br />
over the total area of the country.<br />
PFE (Permanent Forest Estate) means all Reserved Forest and Protected Public Forest land<br />
areas declared under Forest Law (1992).<br />
Protected Public Forest means land constituted as “protected public forest” under Forest<br />
Rules (1992) which is the property of Government and in such forest, most of the activities are<br />
allowed unless prohibited.<br />
B.Data Source<br />
All of the data utilized for the development of this indicator originate from the <strong>Myanmar</strong><br />
Forest Department.<br />
C.Geographic Area / Population Coverage<br />
The data utilized for the development of this indicator are representative permanent forest<br />
estate area for the Union of <strong>Myanmar</strong> as a whole and based on a total land area of 67,658,000 ha.<br />
D.Temporal Coverage<br />
The indicator is representative of trends in Permanent Forest Estate area from 1985 to year<br />
2003.<br />
E.Methodology and Frequency of Coverage<br />
Forest Department updates PFE areas on real-time basis.<br />
F.Methodology of Data Manipulation<br />
Total PFE area (excluding proposed areas) is expressed as a percentage of total land area<br />
assuming a total land area of 67,658,000 hectares.<br />
Qualitative inFormation<br />
A.Strength and Weakness (data level)<br />
The indicator provides general information about the status of legal protection of forest<br />
resources in <strong>Myanmar</strong>. The trend shows the current drive to reach the policy target of 30% in 2030.<br />
However, it limits the detailed information about the forest cover and land use situation for each<br />
PFE which might have been facing changes over time.<br />
B.Reliability, Accuracy, Robustness, Uncertainty (data level)<br />
Reliability and accuracy of the data is quite good as the Forest Department (FD) has to update<br />
the PFE database in real time for its administrative purposes.<br />
C.Future Work Required (for data level and indicator level)<br />
To update in a regular manner, forest cover and land use changes within each PFE should be<br />
further monitored as a supplement to this indicator for a better understanding of the effectiveness<br />
and efficiency of forest conservation by the PFE system.<br />
109
thousand hectares<br />
16,000<br />
14,000<br />
12,000<br />
10,000<br />
8,000<br />
6,000<br />
4,000<br />
2,000<br />
table 1: percentage of permanent Forest estate (pFe) over total land area 1975-1998<br />
year pFe area 1000 ha<br />
110<br />
pFe as % of total<br />
land area<br />
total land area<br />
1000 ha<br />
1985-86 10,025 15% 67,658<br />
1986-87 10,052 15% 67,658<br />
1987-88 10,059 15% 67,658<br />
1988-89 10,069 15% 67,658<br />
1989-90 10,100 15% 67,658<br />
1990-91 10,142 15% 67,658<br />
1991-92 10,143 15% 67,658<br />
1992-93 10,192 15% 67,658<br />
1993-94 10,270 15% 67,658<br />
1994-95 10,309 15% 67,658<br />
1995-96 10,321 15% 67,658<br />
1996-97 10,396 15% 67,658<br />
1997-98 10,475 15% 67,658<br />
1998-99 11,618 17% 67,658<br />
1999-00 12,590 19% 67,658<br />
2000-01 12,945 19% 67,658<br />
2001-02 13,983 21% 67,658<br />
2002-03 14,182 21% 67,658<br />
2003-04 15,143 22% 67,658<br />
2030 10,025 30% 67,658<br />
Source: Forest Department (2005)<br />
SupportinG data taBleS, GraphS and mapS<br />
Figure 1: percentage of permanent Forest estate (pFe) over total land area 1975-1998<br />
-<br />
1985-86<br />
1986-87<br />
1987-88<br />
1988-89<br />
1989-90<br />
1990-91<br />
1991-92<br />
1992-93<br />
1993-94<br />
1994-95<br />
1995-96<br />
1996-97<br />
1997-98<br />
1998-99<br />
1999-2000<br />
2000-2001<br />
2001-2002<br />
2002-2003<br />
2003-2004<br />
PFE area PFE As % of Total Land Area<br />
25.0%<br />
20.0%<br />
15.0%<br />
10.0%<br />
5.0%<br />
0.0%<br />
% PFE over Total land
Summary<br />
A.Policy Reference<br />
1.Purpose:<br />
This indicator represents the extent to which areas important for managing forest resources for<br />
timber extraction, are protected from incompatible uses.<br />
2.Relevance to Environment Planning and Management:<br />
The Permanent Forest Estate areas, although not in a scale on a par with the Protected Area<br />
Systems (PAS), also contribute as a tool for ecosystem conservation, with functions going well<br />
beyond the conservation of biological diversity. As such, they are one of the building blocks of<br />
sustainable development.<br />
3.Linkage to Other Indicators:<br />
This indicator is linked to other indicators, which have implications for land and resource use.<br />
These would include: land use change, wood harvesting intensity, forest area, ratification of global<br />
agreements, etc.<br />
4.Targets:<br />
The current forest policy clearly declares that 30% of total land area should be under PFE for<br />
forest management.<br />
5.International Environment Treaties:<br />
The following are international treaties and agreement related to the concern of PAS cover:<br />
• International Tropical Timber Agreement for promotion of “Sustainable Forest Management”.<br />
• Convention on Biological Diversity (CBD) for forest flora and fauna conservation.<br />
• Convention on International Trade in Endangered Species (CITES) for efficient forest protection<br />
effective to conserving endanger species.<br />
• Convention on the Conservation of Wetlands of International Importance (Ramsar Convention)<br />
for contextual protection of forest ecosystem.<br />
• Convention on Climate Change for forest environmental conservation.<br />
• Convention to Combat Desertification for natural resource conservation.<br />
B.Analysis<br />
As can be observed in Table 1 and Figure 1, there was almost no or very little change in PFE<br />
area during 1985 to 1997. The only observable change that occurred from 1998 to 2003, was the<br />
total area of PFE increasing to 22% of total land which approached the target of the Forest Policy.<br />
With the current momentum, the targeted 30% of total land will be achieved in the targeted year<br />
2030.<br />
Before this policy target was set by the 1995 Forest Policy, the total PFE area was<br />
approximately 15% of total land. As the policy target is 30% of Total land, an additional 15%<br />
increase will be achieved by expanding the PFE area. From 1995 to 2003, the net increase in<br />
PFE area is equivalent to 7% of total land so that almost 50% of the additional target has been<br />
achieved since the policy was implemented.<br />
Annually, forested area equivalent to 1% of total land has been reclaimed under PFE across<br />
the country and 50% of the additional target of PFE area set by the 1995 Forest Policy was realized<br />
in recent years from 1998 to 2003. Therefore, the level of performance in managing forest resource<br />
has been considered average with a consistent improvement<br />
111
Indicator ID<br />
Indicator Name<br />
Greater mekong Subregion<br />
indicator Fact Sheet<br />
dataBaSe inFormation<br />
Year of <strong>Assessment</strong> 2005<br />
Type of Indicator State<br />
Frequently Asked Question (FAQ)<br />
Priority Concern Threats to Biodiversity<br />
Geographic Area Union of <strong>Myanmar</strong><br />
112<br />
Threatened Species as a Percentage of Globally<br />
Threatened Species - 1996 to 2004<br />
How seriously is biodiversity being depleted in the<br />
Union of <strong>Myanmar</strong>?<br />
State & Trend On Average with no Observable Trend<br />
Key Message<br />
As of the latest 2004 assessment, <strong>Myanmar</strong> could<br />
be providing sanctuary to approximately 2.4% of<br />
the globally threatened species. This percentage<br />
is on average with other GMS countries. The main<br />
focus for conservation should be on species, some<br />
of which are endemic to <strong>Myanmar</strong>.
technical inFormation<br />
A.Definition<br />
This indicator tracks the number of globally threatened species in <strong>Myanmar</strong> over time. It is<br />
expressed as the percentage of the number of threatened species at the national level over the<br />
number of threatened species at the global level.<br />
Threatened species are those defined by the International Union for the Conservation of<br />
Nature (ICUN) as vulnerable, endangered or critically endangered in the “Red List of Threatened<br />
Species”. Extinct or lower risk (conservation dependent, near threatened or least concern) do not<br />
form part of this indicator.<br />
Species under consideration include mammals, birds, reptiles, amphibians and fish; plant<br />
and insect species, for which the process of evaluation has only just begun, are excluded from the<br />
indicator figures. Sub-indicator values are also given for mammals, birds, reptiles, amphibians and<br />
fish species.<br />
For more information on the criteria utilized to classify threatened species as critically<br />
endangered, endangered or vulnerable, see “Categories & Criteria” at www.iucnredlist.org.<br />
For more information on the species habitat definitions utilized in the IUCN Red List, see Major<br />
Habitats Authority File at www.iucnredlist.org.<br />
For more information on the major threats definition utilized in the IUCN Red List, see Major<br />
Threats Authority File at www.iucnredlist.org.<br />
B.Data Source<br />
All data utilized to construct this indicator were extracted from the IUCN Red List on the<br />
Internet (see www.iucnredlist.org), in early 2005 and based on the 2004 online version of the IUCN<br />
Red List.<br />
C.Geographic Area / Population Coverage<br />
Figures are representative of the country as a whole and are not differentiated by any other<br />
spatial sub-category. The indicator value is computed for the total number of threatened mammals,<br />
birds, reptiles, amphibians and fish species; sub-indicator values are also given for each later<br />
category of species.<br />
D.Temporal Coverage<br />
Figures correspond to the contents of the 1996, 1998 (plants only), 2000, 2002, 2003 and<br />
2004 IUCN Red Books.<br />
E.Methodology and Frequency of Coverage<br />
The IUCN Red List is continuously being updated and the equivalent of the paper IUCN Red<br />
Book is being produced on an annual basis. The IUCN online Red List (see www.iucnredlist.org) will<br />
be the most likely source for updating this indicator in the future.<br />
F.Methodology of Data Manipulation<br />
All the figures given in this fact sheet were either extracted from the online IUCN Red List<br />
database, through successive search criteria, or computed from the results of such searches.<br />
113
The search criterion for the online IUCN Red List is flexible; the flexibility also adds to the<br />
complexity. Two forms of search are available: simple search or expert search. For the compilation<br />
of this fact sheet, only the simple search menu was utilized since the expert search menu did not<br />
offer any added advantage.<br />
Except for plants which are not part of the indicator definition, all searches were made against<br />
the entire database using an exact phrase search for keyword “Mammals” or “Birds” or “Reptiles”<br />
or “Amphibians” or “Fish”. For plants, the search was made against the taxonomy database using<br />
the “Plantae” keyword. For plants, using a keyword of “plants” against the entire database resulted<br />
in fewer hits. Likewise, keywords of “mammalia”, “aves”, “reptilia”, etc. against the taxonomy<br />
database may lead to un-predictable results.<br />
For the purpose of reporting progress to date in the evaluation of potential threatened species<br />
(see Table 2), the Red List category of “All Evaluated (excluding Least Concern)” was utilized<br />
to report the number of evaluated species. For the purpose of reporting the overall number of<br />
threatened species, a multiple selection of “CR-Critically Endangered” + “EN-Endangered” +<br />
“VU–Vulnerable” categories were selected.<br />
For the reporting of threatened species by Red List over time, multiple queries were<br />
conducted, with the above screening criteria and with the Red List <strong>Assessment</strong> Year criteria added.<br />
For the purpose of reporting threatened species by major habitat type or by major threat, the<br />
above threatened species criteria was applied against all years of the Red List year of assessment<br />
with the 1st level definition of the habitat or threat as additional search criteria.<br />
The calculation of ratios or percentages related to the downloaded figures should be obvious<br />
from the contents of the data tables. It is noted however that the percentage figure associated<br />
with the main indicator is based on the cumulative number of species added to the Red List, since<br />
1996, and not just the annual figure.<br />
114
Qualitative inFormation<br />
A.Strength and Weakness (data level)<br />
The IUCN Red Books, or the IUCN online Red List, is a relatively new instrument to measure<br />
the degree of biodiversity loss of a particular country or region. It was initiated in 1996 without<br />
plant species, updated with only plant species in 1998, updated in year 2000, skipped in year 2001<br />
and it is only since year 2002 that it shows some degree of completeness and annual updating.<br />
This will improve in the next few years but the temporal trends which can be observed to 2004<br />
are largely based of the level of effort that IUCN biologists have placed on certain species groups<br />
in certain years. The IUCN Red List is nevertheless the best source of consistent information of<br />
threatened species.<br />
For reasons stated above, the absolute number of threatened species that is placed on the<br />
Red List on an annual basis is not very indicative of the trends of biodiversity loss in a particular<br />
country or region. A cumulative number might be more indicative but the indicator demands a<br />
denominator so that the result can be compared with other countries or regions, and so that the<br />
indicator value is less biased by the progress of the work of the IUCN biologists.<br />
The annual ratio of (new) threatened species over the number of evaluated species was<br />
considered (see Table 2) but once again this indicator would be biased by the progress of the<br />
individual species assessments. Other denominators were considered, such as the annual number<br />
of threatened species over the cumulative number of threatened species for a particular country<br />
or region, but in the end the number of globally threatened species, or the number of known<br />
threatened species to date, was selected as the denominator.<br />
The number of globally threatened species as the denominator provides a neutral denominator<br />
for the purpose of comparing one country or region to the other; it is also self-adjusting in terms<br />
of the progress that IUCN is having in terms of identifying and mapping the (country) range of all<br />
threatened species. IUCN provides these totals including the 2004 assessment year in the statistics<br />
section of their homepage (see www.iucnredlist.org).<br />
The indicator value, somewhat representing the global responsibility that the specific country<br />
or region has to protect the enumerated species at the start of the assessment, may appear<br />
extreme at the start of the assessment period but may well be reduced as assessments for other<br />
countries or continents, for related species or species groups, continues. In other cases, it may<br />
increase as the assessment regime approaches non-evaluated species in the biome of specific<br />
countries or regions. The selected indicator value and denominator is far from being perfect, but<br />
at the time of this initial assessment it appears to be the one best suited (given the room for<br />
improvement as discussed in one of the following sub-sections).<br />
The main weakness of the indicator (as discussed in the Future Work Required section below,<br />
is that is does not give added weight to the threatened species that are endemic to the country<br />
or region being considered, or to the lesser concern for species that are globally threatened but<br />
abundant in one specific country or region.<br />
115
B.Reliability, Accuracy, Robustness, Uncertainty (data level)<br />
As with all indicators that attempt to track and environmental phenomena over time, this<br />
indicator is subject to much international debate and peer review with respect to choice of<br />
indicator (based on data availability), reliability, accuracy, robustness and uncertainty.<br />
The reliability of the indicator, especially its denominator, is very much hinged on the future<br />
success of IUCN in getting a true global perspective database on threatened species. The accuracy<br />
is not questioned and the future use of the indicator (given IUCN’s future perspective) appears<br />
quite robust. And as with all other indicators which attempt to reduce a complex phenomenon<br />
into a single variable, there is some level of uncertainty as to the appropriate (future) use of the<br />
indicator as new information sources emerge.<br />
One note is inserted here with respect to uncertainty and the targeting of one threatened<br />
species to a specific country. The IUCN online database sometimes targets one threatened species<br />
to a country with an implied level [a question mark (?)] of uncertainty. For the purpose of this<br />
indicator development and limited by the IUCN Red List query capability; these questionable cases<br />
have been included with country or region-specific tabulations.<br />
C.Future Work Required (for data level and indicator level)<br />
The indicator value, with incremental annual figures, and especially the denominator, should<br />
be updated annually, provided IUCN provides such facility on an ongoing basis. It is expected the<br />
indicator value will converge to its intended purpose within less than half a decade, if not earlier.<br />
It is assumed that IUCN will provide updated global totals to serve as denominator in subsequent<br />
versions of this indicator<br />
As was previously mentioned above in the discussion on strengths and weaknesses of the<br />
indicator, the indicator could be improved, given time and Internet access resources, in giving<br />
added weight to threatened species which are endemic to the country or region of concern,<br />
and less weight to species which are threatened but which have a larger geographic range. The<br />
current online search facility is not ideal for this kind of tabulation (depends on manual count of<br />
enumerated countries), but such a tabulation and weight-ranking is not impossible.<br />
SupportinG data taBleS, GraphS and mapS<br />
Figure 1:threatened Species as a percentage of Globally threatened<br />
Species – 1996 to 2004<br />
Threated Spp in <strong>Myanmar</strong> As %<br />
Global threatened spp<br />
10.0%<br />
9.0%<br />
8.0%<br />
7.0%<br />
6.0%<br />
5.0%<br />
4.0%<br />
3.0%<br />
2.0%<br />
1.0%<br />
0.0%<br />
1996 2000 2002 2003 2004<br />
mamal bird reptile amphibians fish Total<br />
116
table 1:threatened Species as a percentage of Globally threatened<br />
Species – 1996 to 2004<br />
assessmentyear<br />
Globally threatened<br />
(cumulative<br />
number)<br />
mammals<br />
117<br />
nationally<br />
threatened<br />
(cumulative<br />
number)<br />
national/Global (%)<br />
1996 1096 24 2.19%<br />
2000 1130 31 2.74%<br />
2002 1137 37 3.25%<br />
2003 1130 38 3.36%<br />
2004 1101 40 3.63%<br />
assessmentyear<br />
Globally threatened<br />
(cumulative<br />
number)<br />
Birds<br />
nationally<br />
threatened<br />
(cumulative<br />
number)<br />
national/Global (%)<br />
1996 1107 0 0.00%<br />
2000 1183 0 0.00%<br />
2002 1192 0 0.00%<br />
2003 1194 0 0.00%<br />
2004 1212 49 4.04%<br />
assessmentyear<br />
Globally threatened<br />
(cumulative<br />
number)<br />
reptiles<br />
nationally<br />
threatened<br />
(cumulative<br />
number)<br />
national/Global (%)<br />
1996 253 4 1.58%<br />
2000 291 25 8.59%<br />
2002 293 25 8.53%<br />
2003 293 25 8.53%<br />
2004 304 26 8.55%<br />
assessmentyear<br />
Globally threatened<br />
(cumulative<br />
number)<br />
amphibians<br />
nationally<br />
threatened<br />
(cumulative<br />
number)<br />
national/Global (%)<br />
1996 124 0 0.00%<br />
2000 146 0 0.00%<br />
2002 157 0 0.00%<br />
2003 157 0 0.00%<br />
2004 1770 0 0.00%
assessmentyear<br />
Globally threatened<br />
(cumulative<br />
number)<br />
Fish<br />
118<br />
nationally<br />
threatened<br />
(cumulative<br />
number)<br />
national/Global (%)<br />
1996 734 2 0.27%<br />
2000 752 5 0.66%<br />
2002 742 5 0.67%<br />
2003 750 8 1.07%<br />
2004 801 10 1.25%<br />
all threatened mammals, Birds, reptiles,amphibians and Fish<br />
assessmentyear<br />
Globally threatened<br />
(cumulative<br />
number)<br />
nationally<br />
threatened<br />
(cumulative<br />
number)<br />
national/Global (%)<br />
1996 3314 30 0.91%<br />
2000 3502 61 1.74%<br />
2002 3521 67 1.90%<br />
2003 3524 71 2.01%<br />
2004 5188 125 2.41%<br />
Source: IUCN Red List 2004<br />
assessmentyear<br />
table 2: Species evaluated andthreatened – 1996-2004<br />
evaluated Species<br />
(annual number)<br />
mammals<br />
threatened Species<br />
(annual number)<br />
ratio (%)<br />
1996 69 24 34.78%<br />
2000 11 7 63.64%<br />
2002 6 6 100.00%<br />
2003 1 1 100.00%<br />
2004 4 2 50.00%<br />
assessmentyear<br />
evaluated Species<br />
(annual number)<br />
Birds<br />
threatened Species<br />
(annual number)<br />
1996 0 0<br />
2000 0 0<br />
2002 0 0<br />
2003 0 0<br />
ratio (%)<br />
2004 124 49 39.52%
assessmentyear<br />
evaluated Species<br />
(annual number)<br />
reptiles<br />
119<br />
threatened Species<br />
(annual number)<br />
ratio (%)<br />
1996 5 4 80.00%<br />
2000 25 21 84.00%<br />
2002 0 0<br />
2003 0 0<br />
2004 1 1 100.00%<br />
assessmentyear<br />
evaluated Species<br />
(annual number)<br />
amphibians<br />
threatened Species<br />
(annual number)<br />
1996 0 0<br />
2000 0 0<br />
2002 0 0<br />
2003 0 0<br />
ratio (%)<br />
2004 25 0 0.00%<br />
assessmentyear<br />
evaluated Species<br />
(annual number)<br />
Fish<br />
threatened Species<br />
(annual number)<br />
ratio (%)<br />
1996 5 2 40.00%<br />
2000 15 3 20.00%<br />
2002 0 0<br />
2003 7 3 42.86%<br />
2004 6 2 33.33%<br />
assessmentyear<br />
evaluated Species<br />
(annual number)<br />
plants<br />
threatened Species<br />
(annual number)<br />
ratio (%)<br />
1996 52 36 69.23%<br />
2000 2 1 50.00%<br />
2002 0 0<br />
2003 2 1 50.00%<br />
2004 0<br />
Source: IUCN Red List 2004
table 3:threatened Species by major habitat type - 2004<br />
habitat mammals Birds reptiles amphibians Fish total citations<br />
%<br />
Forest 26 37 0 0 0 63 36.00%<br />
Wetlands 3 22 0 0 3 28 16.00%<br />
Grasslands 5 15 0 0 0 20 11.43%<br />
Shrubland 7 11 0 0 0 18 10.29%<br />
Artificial/<br />
Terrestrial<br />
0 17 0 0 0 17 9.71%<br />
Sea 4 1 2 0 5 12 6.86%<br />
Coastlines 1 5 2 0 1 9 5.14%<br />
Savanna 3 3 0 0 0 6 3.43%<br />
Artificial/<br />
Aquatic<br />
1 1 0 0 0 2 1.14%<br />
Rocky Areas 0 0 0 0 0 0 0.00%<br />
Caves<br />
and Sub-<br />
Terrananean<br />
Habitats<br />
0 0 0 0 0 0 0.00%<br />
Desert 0 0 0 0 0 0 0.00%<br />
Introduced<br />
Vegetation<br />
0 0 0 0 0 0 0.00%<br />
Other 0 0 0 0 0 0 0.00%<br />
Unknown 0 0 0 0 0 0 0.00%<br />
Total Citations 50 112 4 0 9 175 100.0%<br />
Source: IUCN Red List - 2004<br />
120
major<br />
threat<br />
Habitat Loss<br />
- Human<br />
Induced<br />
Harvesting<br />
(huntinggathering)<br />
Pollution<br />
(affecting<br />
habitat)<br />
Human<br />
Disturbance<br />
table 4– threatened Species by major threat category - 2004<br />
mammals Birds reptiles amphibians Fish total citations %<br />
29 49 5 0 5 88 32.47%<br />
24 32 13 0 7 76 28.04%<br />
4 18 1 0 2 25 9.23%<br />
3 21 0 0 1 25 9.23%<br />
Persecution 4 11 0 0 0 15 5.54%<br />
Accidental<br />
Mortality<br />
Intrinsic<br />
Factors<br />
Changes in<br />
native species<br />
dynamics<br />
Invasive alien<br />
species<br />
Natural<br />
Disasters<br />
4 5 2 0 3 14 5.17%<br />
5 0 3 0 4 12 4.43%<br />
7 3 0 0 1 11 4.06%<br />
2 0 0 0 0 2 0.74%<br />
1 1 0 0 0 2 0.74%<br />
Unknown 1 0 0 0 0 1 0.37%<br />
Other 0 0 0 0 0 0 0.00%<br />
Total Citations 84 140 24 0 23 271 100.0%<br />
Source: IUCN Red List - 2004<br />
121
Scientific<br />
name<br />
table 5 – list of individual threatened Species - 2004<br />
class<br />
year<br />
evaluated<br />
Status<br />
122<br />
population<br />
trend<br />
country<br />
endemic?<br />
GmS<br />
endemic?<br />
Ailurus fulgens mammals 1996 Endangered Unknown No No<br />
Balaenoptera<br />
musculus<br />
Balaenoptera<br />
physalus<br />
mammals 1996 Endangered No No<br />
mammals 1996 Endangered No No<br />
Bos frontalis mammals 2000 Vulnerable Declining No No<br />
Bos javanicus mammals 2000 Endangered Declining No No<br />
Budorcas taxicolor mammals 1996 Vulnerable Unknown No<br />
Bunopithecus<br />
hoolock<br />
Callosciurus<br />
pygerythrus<br />
Callosciurus<br />
quinquestriatus<br />
Capricornis<br />
sumatraensis<br />
Catopuma<br />
temminckii<br />
mammals 2000 Endangered Unknown No No<br />
mammals 1996 Vulnerable Unknown No No<br />
mammals 1996 Vulnerable Unknown with PRC Yes<br />
mammals 1996 Vulnerable Unknown No No<br />
mammals 2002 Vulnerable Declining No No<br />
Cervus eldii mammals 1996 Vulnerable No No<br />
Cuon alpinus mammals 2004 Endangered Declining No No<br />
Dicerorhinus<br />
sumatrensis<br />
mammals 1996<br />
Critically<br />
Endangered<br />
Unknown No No<br />
Dugong dugon mammals 1996 Vulnerable No No<br />
Elephas maximus mammals 1996 Endangered No No<br />
Hylopetes alboniger mammals 1996 Endangered Unknown No No<br />
Hystrix brachyura mammals 1996 Vulnerable No No<br />
Lutrogale<br />
perspicillata<br />
mammals 2004 Vulnerable Declining No No<br />
Macaca arctoides mammals 2000 Vulnerable Unknown No No<br />
Macaca<br />
assamensis<br />
mammals 2000 Vulnerable Declining No No<br />
Macaca leonina mammals 2000 Vulnerable Unknown No No<br />
Muntiacus<br />
crinifrons<br />
mammals 1996 Vulnerable with PRC Yes<br />
Mustela strigidorsa mammals 1996 Vulnerable Unknown No No<br />
Naemorhedus<br />
baileyi<br />
Naemorhedus<br />
caudatus<br />
mammals 1996 Vulnerable Unknown No with India<br />
mammals 1996 Vulnerable Unknown No No<br />
Neofelis nebulosa mammals 2002 Vulnerable Declining No No<br />
Panthera tigris mammals 2002 Endangered Declining No No<br />
Pardofelis<br />
marmorata<br />
Physeter<br />
macrocephalus<br />
mammals 2002 Vulnerable Declining No No<br />
mammals 1996 Vulnerable No No
Pipistrellus<br />
anthonyi<br />
mammals 1996<br />
Pipistrellus joffrei mammals 1996<br />
Prionailurus<br />
planiceps<br />
Prionailurus<br />
viverrinus<br />
Critically<br />
Endangered<br />
Critically<br />
Endangered<br />
123<br />
Unknown Yes Yes<br />
Declining Yes Yes<br />
mammals 2002 Vulnerable Declining No No<br />
mammals 2002 Vulnerable Declining No No<br />
Rattus sikkimensis mammals 1996 Vulnerable No No<br />
Rhinoceros<br />
sondaicus<br />
mammals 1996<br />
Critically<br />
Endangered<br />
Unknown No No<br />
Tapirus indicus mammals 2003 Vulnerable Declining No with Malaysia<br />
Trachypithecus<br />
pileatus<br />
mammals 2000 Endangered Unknown No No<br />
Ursus thibetanus mammals 1996 Vulnerable Unknown No No<br />
Vernaya fulva mammals 1996 Vulnerable with PRC Yes<br />
Aceros nipalensis birds 2004 Vulnerable Declining No No<br />
Aceros subruficollis birds 2004 Vulnerable Declining No with Malaysia<br />
Acrocephalus<br />
tangorum<br />
birds 2004 Vulnerable Declining No No<br />
Alcedo euryzona birds 2004 Vulnerable Declining No No<br />
Anas formosa birds 2004 Vulnerable Declining No No<br />
Anser erythropus birds 2004 Vulnerable Declining No No<br />
Aquila clanga birds 2004 Vulnerable Declining No No<br />
Aquila heliaca birds 2004 Vulnerable Declining No No<br />
Ardea insignis birds 2004 Endangered Declining No No<br />
Aythya baeri birds 2004 Vulnerable Declining No No<br />
Brachypteryx<br />
hyperythra<br />
birds 2004 Vulnerable Declining No with India<br />
Cairina scutulata birds 2004 Endangered Declining No No<br />
Chrysomma<br />
altirostre<br />
birds 2004 Vulnerable Declining No No<br />
Ciconia boyciana birds 2004 Endangered Declining No No<br />
Columba punicea birds 2004 Vulnerable Declining No No<br />
Eurynorhynchus<br />
pygmeus<br />
birds 2004 Endangered Declining No No<br />
Falco naumanni birds 2004 Vulnerable Declining No No<br />
Gallinago<br />
nemoricola<br />
birds 2004 Vulnerable Declining No No<br />
Grus antigone birds 2004 Vulnerable Declining No No<br />
Gyps bengalensis birds 2004<br />
Gyps tenuirostris birds 2004<br />
Haliaeetus<br />
leucoryphus<br />
Critically<br />
Endangered<br />
Critically<br />
Endangered<br />
Declining No No<br />
Declining No No<br />
birds 2004 Vulnerable Declining No No<br />
Heliopais personata birds 2004 Vulnerable Declining No No<br />
Leptoptilos dubius birds 2004 Endangered Declining No No
Leptoptilos<br />
javanicus<br />
Lophophorus<br />
sclateri<br />
Megapodius<br />
nicobariensis<br />
birds 2004 Vulnerable Declining No No<br />
birds 2004 Vulnerable Declining No with India<br />
birds 2004 Vulnerable Declining No with India<br />
Mergus squamatus birds 2004 Vulnerable Declining No No<br />
Otis tarda birds 2004 Vulnerable Declining No No<br />
Otus sagittatus birds 2004 Vulnerable Declining No with Malaysia<br />
Pavo muticus birds 2004 Vulnerable Declining No No<br />
Pelecanus<br />
philippensis<br />
birds 2004 Vulnerable Declining No No<br />
Pitta gurneyi birds 2004 Critically<br />
Endangered<br />
Polyplectron<br />
malacense<br />
124<br />
Declining with Thailand Yes<br />
birds 2004 Vulnerable Declining No No<br />
Pseudibis davisoni birds 2004 Critically<br />
Endangered<br />
Pycnonotus<br />
zeylanicus<br />
Rhodonessa<br />
caryophyllacea<br />
Declining No with Indonesia<br />
birds 2004 Vulnerable Declining No No<br />
birds 2004 Critically<br />
Endangered<br />
Unknown No No<br />
Rynchops albicollis birds 2004 Vulnerable Declining No No<br />
Sitta formosa birds 2004 Vulnerable Declining No No<br />
Sitta magna birds 2004 Vulnerable Declining No Yes<br />
Sitta victoriae birds 2004 Endangered Declining Yes Yes<br />
Spizaetus nanus birds 2004 Vulnerable Declining No No<br />
Stachyris oglei birds 2004 Vulnerable Declining with India with India<br />
Syrmaticus humiae birds 2004 Vulnerable Declining No with India<br />
Tragopan blythii birds 2004 Vulnerable Declining No No<br />
Treron capellei birds 2004 Vulnerable Declining No No<br />
Tringa guttifer birds 2004 Endangered Declining No No<br />
Turdoides<br />
longirostris<br />
birds 2004 Vulnerable Declining No No<br />
Turdus feae birds 2004 Vulnerable Declining No with India<br />
Amyda cartilaginea reptiles 2000 Vulnerable<br />
Critically<br />
No No<br />
Batagur baska reptiles 2000 Endangered No No<br />
Caretta caretta reptiles 1996 Endangered No No<br />
Chelonia mydas reptiles 2004 Endangered Declining No No<br />
Chitra indica reptiles 2000 Endangered<br />
Critically<br />
Crocodylus<br />
siamensis<br />
No No<br />
reptiles 1996 Endangered No with Indonesia<br />
Cuora amboinensis reptiles 2000 Vulnerable No No<br />
Dermochelys<br />
coriacea<br />
Eretmochelys<br />
imbricata<br />
reptiles 2000 Critically<br />
Endangered<br />
reptiles 1996 Critically<br />
Endangered<br />
No No<br />
No No
Geochelone<br />
platynota<br />
Heosemys<br />
depressa<br />
reptiles 2000<br />
reptiles 2000<br />
Critically<br />
Endangered<br />
Critically<br />
Endangered<br />
125<br />
Yes Yes<br />
Yes Yes<br />
Heosemys grandis reptiles 2000 Vulnerable No with Malaysia<br />
Heosemys spinosa reptiles 2000 Endangered No No<br />
Hieremys<br />
annandalii<br />
Indotestudo<br />
elongata<br />
reptiles 2000 Endangered No with Malaysia<br />
reptiles 2000 Endangered No No<br />
Kachuga trivittata reptiles 2000 Endangered Yes Yes<br />
Lepidochelys<br />
olivacea<br />
reptiles 1996 Endangered No No<br />
Manouria emys reptiles 2000 Endangered No No<br />
Manouria impressa reptiles 2000 Vulnerable No with Malaysia<br />
Morenia ocellata reptiles 2000 Vulnerable Yes Yes<br />
Nilssonia formosa reptiles 2000 Endangered Yes Yes<br />
Notochelys<br />
platynota<br />
reptiles 2000 Vulnerable No No<br />
Pelochelys cantorii reptiles 2000 Endangered No No<br />
Platysternon<br />
megacephalum<br />
reptiles 2000 Endangered No Yes<br />
Pyxidea mouhotii reptiles 2000 Endangered No with India<br />
Siebenrockiella<br />
crassicollis<br />
Scleropages<br />
formosus<br />
reptiles 2000 Vulnerable No No<br />
fish 1996 Endangered No No<br />
Thunnus obesus fish 1996 Vulnerable No No<br />
Anoxypristis<br />
cuspidata<br />
fish 2000 Endangered Declining No No<br />
Pristis pectinata fish 2000 Endangered ? No No<br />
Rhincodon typus fish 2000 Vulnerable Declining No No<br />
Aetomylaeus<br />
nichofii<br />
Negaprion<br />
acutidens<br />
Pangasianodon<br />
gigas<br />
fish 2003 Vulnerable Declining No No<br />
fish 2003 Vulnerable Declining No No<br />
fish 2003<br />
Critically<br />
Endangered<br />
Declining No Yes<br />
Cheilinus undulatus fish 2004 Endangered Declining No No<br />
Haliaeetus<br />
leucoryphus<br />
fish 2004 Vulnerable Declining No No<br />
Vulnerable 75<br />
Endangered 34<br />
Critically<br />
Endangered<br />
Endemic to<br />
<strong>Myanmar</strong><br />
16<br />
8
Endemic to<br />
<strong>Myanmar</strong><br />
plus one<br />
other<br />
Endemic to<br />
GMS<br />
Endemic to<br />
GMS plus<br />
one other<br />
Source: IUCN Red List - 2004<br />
table 6: comparative indicator values in 2004 for all GmS countries<br />
country mammals Birds reptiles amphibians Fish total<br />
Cambodia 2.54% 2.15% 4.93% 0.17% 1.62% 1.64%<br />
Lao PDR 3.09% 2.06% 3.95% 0.23% 0.75% 1.56%<br />
<strong>Myanmar</strong> 3.63% 4.04% 8.55% 0.00% 1.25% 2.41%<br />
Thailand 3.45% 4.13% 7.24% 0.17% 4.74% 2.91%<br />
Viet Nam 4.00% 3.63% 8.88% 0.85% 3.50% 3.05%<br />
Yunnan<br />
Province<br />
2.91% 1.49% 3.95% 0.11% - 1.23%<br />
GMS Average: 3.27% 2.92% 6.25% 0.26% n/a 2.13%<br />
Source: IUCN Red List - 2004<br />
126<br />
5<br />
15<br />
16
Summary<br />
A.Policy Reference<br />
1.Purpose:<br />
The purpose of this indicator is to describe the maintenance or, conversely, the loss of species<br />
diversity. It is understood that the smaller this number is for a specific country or region, the<br />
better the country or region is at the maintenance of species diversity. However, the rise and fall<br />
of the indicator value over the years may or may not be indicative of the government responses<br />
within the country or region. <strong>Assessment</strong> of species outside the country or region leading to a rise<br />
in the denominator may result in the fall of the indicator value. Further assessments for species<br />
contained primarily within the country or region may temporarily inflate the value of the indicator.<br />
2.Relevance to Environment Planning and Management:<br />
Maintenance of biodiversity is essential for ecosystem wellbeing. Species diversity is one of<br />
the three main levels of biodiversity, the others being ecosystem and genetic diversity.<br />
3.Linkage to Other Indicators:<br />
This indicator is linked to other indicators that have implications for biodiversity. These<br />
include: protected area as a percent of total area, loss of designated habitat, protected species,<br />
etc.<br />
4.Targets:<br />
No specific targets have been set for this indicator and it is quite unlikely that a target specific<br />
to this indicator would be established.<br />
5.International Environment Treaties:<br />
For this indicator, the more relevant convention is the Convention on Biological Diversity,<br />
ratified 25/11/94.<br />
B.Analysis<br />
As can be observed from Figure 1 and Table 1, <strong>Myanmar</strong> is a tentative sanctuary to<br />
approximately 2.4% of the globally threatened species. This standing includes approximately<br />
3.6% of globally threatened mammals, 4% of globally threatened birds, 8.5% globally threatened<br />
reptiles, and 1.3% of globally threatened fish. To date, there are no globally threatened amphibians<br />
which have sanctuary in <strong>Myanmar</strong>.<br />
As can be observed from Table 2, the rise in the share of globally threatened species from<br />
0.91% in 1996 to 2.41% in 2004 is largely attributed to the progress of the evaluation work and is<br />
not necessarily indicative of a trend of loss of biodiversity.<br />
As can be observed from Table 2, the 0.91% value in 1996 is based on the first version of<br />
the IUCN Redbook at which time most relevant mammals had been evaluated, few reptile and fish<br />
species had been evaluated and at which time amphibians and birds were not part of the equation.<br />
The relevant amphibians and birds were in fact not evaluated until 2004 and therefore the indicator<br />
value and trend before 2004 has very little meaning.<br />
But now that the indicator value is inclusive of all threatened species types, the future value<br />
of the indicator will be more indicative of the trend in the loss of biodiversity in <strong>Myanmar</strong>. It is<br />
not expected to vary dramatically from the 2004 figures. It may artificially rise if new globally<br />
threatened species also have sanctuary in <strong>Myanmar</strong>; it may artificially fall if new threatened species<br />
have sanctuary outside of <strong>Myanmar</strong>. Some of this artificial oscillation can already be observed<br />
in the reptile species since 2000. While the indicator serves well to measure <strong>Myanmar</strong>’s share of<br />
the global priority, only changes in the status of individual species (see Table 5) can be utilized to<br />
measure progress at the national level.<br />
127
Apart from the indicator value itself, the IUCN database of threatened species has also<br />
provided some insight as to what are the habitats of those species relevant to <strong>Myanmar</strong> and what<br />
are the major threats to those threatened species. As can be observed from Table 3, forests are the<br />
dominant habitat for approximately 36% of the threatened mammal and bird species in <strong>Myanmar</strong><br />
but loss of wetlands and grasslands are equally important to threatened bird species. Therefore<br />
societal responses which attempt to protect non-forest areas may be of equal importance and the<br />
last column of Table 3 might be a model for the ideal composition of protected areas in <strong>Myanmar</strong>.<br />
Based on the same IUCN database, Table 4 provides some insight as to the major threats<br />
relevant to the threatened species in <strong>Myanmar</strong>. Loss of habitat is the dominant threat for a third of<br />
the threatened species but harvesting and gathering is a close second. Therefore societal responses<br />
which deal with the hunting and gathering of these threatened species may be of equal importance<br />
as those societal responses which attempt to protect their habitats.<br />
Table 5 lists all of the currently threatened species which have sanctuary in <strong>Myanmar</strong> along<br />
with their current 2004 standing on the IUCN Red List. As of 2004, 75 species were listed as<br />
vulnerable, 34 as endangered and 16 as critically endangered. Any future decrease in the level<br />
of endangerment of these species, or the removal of the species from this list, is indicative of<br />
progress in conserving biodiversity; any future increase in the level of endangerment will be a<br />
negative indication of progress.<br />
It can also be noted from Table 5 that not all of <strong>Myanmar</strong>’s share of the globally threatened<br />
species are endemic to <strong>Myanmar</strong> and therefore <strong>Myanmar</strong> alone is not solely responsible for its<br />
2.4% share of globally threatened species. However 8 of the threatened species, including 5 reptile<br />
species are endemic to <strong>Myanmar</strong> and for another 5 threatened species, <strong>Myanmar</strong> and one of its<br />
GMS neighbors share the total responsibility. It can also be observed from Table 5 that 15 of<br />
<strong>Myanmar</strong>’s current 125 threatened species are endemic to GMS countries.<br />
Table 6 provides the basis for comparing the current value of the indicator with other GMS<br />
countries, or with GMS countries as a whole. As can be observed from Table 6, <strong>Myanmar</strong>’s 2.4% of<br />
globally threatened species is slightly above the average of all GMS countries combined. Reptiles<br />
are the largest contribution to <strong>Myanmar</strong>’s share of the threatened species and as noted above<br />
<strong>Myanmar</strong> is currently void of amphibian species on its threatened list. The number of threatened<br />
reptile species (26) is above average in <strong>Myanmar</strong> but only 5 of these threatened reptile species<br />
are endemic to <strong>Myanmar</strong> and again <strong>Myanmar</strong> is not solely responsible for all of these threatened<br />
reptile species. But at the same time, <strong>Myanmar</strong> could provide a safe heaven to a relatively high<br />
proportion of globally threatened reptiles.<br />
Based on this comparison of this indicator with the indicator value of other GMS countries,<br />
it is concluded that the current state of biodiversity in <strong>Myanmar</strong> is on average with other GMS<br />
countries, with no observable past trends and an expectation that the global share of <strong>Myanmar</strong>’s<br />
threatened species will remain constant in the very near future.<br />
128
Indicator ID<br />
Indicator Name<br />
Greater mekong Subregion<br />
indicator Fact Sheet<br />
dataBaSe inFormation<br />
Year of <strong>Assessment</strong> 2005<br />
Type of Indicator Pressure<br />
Frequently Asked Question (FAQ)<br />
Priority Concern Threats to Biodiversity<br />
Geographic Area Union of <strong>Myanmar</strong><br />
Magnitude & Trend High and Increasing<br />
Key Message<br />
129<br />
Loss of Tropical Rainforest in Tanintharyi Division<br />
- 1990 to 2000<br />
Are tropical rain forests in the Union of <strong>Myanmar</strong><br />
declining?<br />
Loss of Rainforest in Tanintharyi Division, which<br />
is considered as the last stronghold of the South<br />
East Asian Tropical Forest, is accelerating at the<br />
rate of 2.8% per annum. As the deforestation rate<br />
of the country is reported at 1.2% by the “state”<br />
indicator of Forest Resource, habitat loss of<br />
tropical rainforest is increasing and relatively high.
technical inFormation<br />
A.Definition<br />
This indicator attempts to evaluate how much tropical rain forest areas of <strong>Myanmar</strong> has been<br />
lost and into which type of land use.<br />
Almost all forests in the Tanintharyi divisions are considered or were considered tropical rain<br />
forests. Therefore no special classification has been done on forest area except on mangroves.<br />
Closed forest is defined as an area under forestry or no land use, spanning more than 0.5<br />
ha; with trees higher than 5 m and a canopy cover of more than 40%, or trees able to reach these<br />
thresholds in situ. Open forest is defined as area under forestry or no land use, spanning more<br />
than 0.5 ha; with trees higher than 5 m and a canopy cover between 10% and 40%, or trees able to<br />
reach these thresholds in situ.<br />
B.Data Source<br />
All of the data utilized for the development of this indicator originate from <strong>Myanmar</strong> Forest<br />
Department and summarize in the following technical paper:<br />
Forest Department and Food and Agriculture Organization (2004), “A study on forest resources<br />
and land use changes in the Tanintharyi Division, southern part of <strong>Myanmar</strong>”, unpublished<br />
technical paper, Yangon.<br />
C.Geographic Area / Population Coverage<br />
The data utilized for the construction of the indicator is limited to the extent of the<br />
southernmost Tanintharyi Division of <strong>Myanmar</strong>. However this Division, with a total area of<br />
77,119.61 km2., is representative of all tropical rain forests in the Union of <strong>Myanmar</strong>, i.e. tropical<br />
rain forests only occur in the Tanintharyi Division.<br />
D.Temporal Coverage<br />
The data and the indicator are representative of changes in tropical forest areas between 1990<br />
and 2000.<br />
E.Methodology and Frequency of Coverage<br />
The Forest Department aims to monitor forest cover change in the Tanintharyi Division on a<br />
continuous basis, depending upon the availability of remote sensing data. However the present<br />
data, in the form of a change matrix, is the first of its kind.<br />
F.Methodology of Data Manipulation<br />
The assessment of forest cover and land use between 1990 and 2000 has been implemented<br />
using remote sensing techniques. Two sets of multi-temporal satellite scenes (seven Landsat 5<br />
and Landsat 7 images for each year) have been digitally interpreted using ground-truths taken on<br />
various surveys of the area in the past by the Forest Department, including aerial photographs.<br />
A digital method of change assessment (the first time for <strong>Myanmar</strong>) has been performed. The<br />
classified information has been overlaid in GIS with both civil administrative boundaries and forest<br />
administrative boundaries. Change matrixes are the best from of expressing land use and habitat<br />
loss. However, to simplify calculation, only major types of land class (habitat class) have been<br />
analyzed. They are Closed Forest and Open Forest (almost most of them are tropical ever greens),<br />
Mangrove Forests (coastal habitat), Agriculture and Scrub and Grasslands<br />
130
Qualitative inFormation<br />
A.Strength and Weakness (data level)<br />
This kind of change matrix information is available only when such a project exists. The Forest<br />
Department should be performing this kind of monitoring work in a routine manner in a prefixed<br />
period (every 5 or 10 years) on other States and Divisions also.<br />
B.Reliability, Accuracy, Robustness, Uncertainty (data level)<br />
The indicator provides information as to where the changed habitats are going. The strength<br />
and weakness lies in the resolution of the satellite (here 30-meter resolution). At least two seasonal<br />
scenes are needed for each temporal period. However due to financial limitations and cloud-cover,<br />
this change analysis makes the use of only one season (summer time) for all 1990 and 2000<br />
datasets.<br />
C.Future Work Required (for data level and indicator level)<br />
Digital images of 1975 should be acquired from NASA archives. Current status on the effects<br />
of oil palm plantation developments should be studied using 2005 satellite data. Biodiversity<br />
information and corridor mapping etc. should be performed together with these exercises.<br />
SupportinG data taBleS, GraphS and mapS<br />
Figure 1: loss of tropical rain Forest area in tanintharyi division – 1990-2000<br />
square kilometer<br />
30,000<br />
25,000<br />
20,000<br />
15,000<br />
10,000<br />
5,000<br />
-<br />
1,990 2000<br />
Tropical rain forest area Degrated forest area<br />
Rain forest cover Degrated forest cover<br />
131<br />
35%<br />
30%<br />
25%<br />
20%<br />
15%<br />
10%<br />
5%<br />
0%<br />
forest cover as % of total land
table 1a: land cover change matrix in tropical rainforest area in tanintharyi<br />
division – 1990 and 2000<br />
2000 Km 2<br />
1999 Km 2<br />
closed<br />
Forest<br />
degraded<br />
Forest<br />
mangrove agriculture Water<br />
body<br />
132<br />
Scrub<br />
& Grass<br />
land<br />
Sand &<br />
Beach<br />
Grand<br />
total of<br />
1990<br />
Closed<br />
Forest<br />
17,820 6,350 - 77 - 357 - 24,603<br />
Degraded<br />
Forest<br />
- 8,438 - 212 - 1,170 - 9,821<br />
Mangrove - 164 2,379 142 164 61 - 2,909<br />
Agriculture - - - 1,124 - - - 1,124<br />
Water - - - - 36,127 24 - 36,152<br />
Scrub &<br />
Grass Land<br />
- - - 228 - 2,220 - 2,448<br />
Sand &<br />
Beach<br />
- - - - - - 63 63<br />
Grand Total<br />
of 2000<br />
17,820 14,953 2,379 1,603 36,291 4,012 63 77,120<br />
Source: Forest Department and Food and Agriculture Organization, 2004<br />
table 1b: rate of change in tropical Forest area in tanintharyi division – 1990-2000<br />
land<br />
use and<br />
habitat<br />
Square<br />
Kilometer<br />
1990 2000 net changes<br />
% of total<br />
Square<br />
Kilometer<br />
% of total<br />
Square<br />
Kilometer<br />
% changed<br />
Closed Forest 24,603 31.90% 17,820 23.11% (6,783) -27.57%<br />
Degraded<br />
Forest<br />
9,821 12.73% 14,953 19.39% 5,132 52.26%<br />
Mangrove 2,909 3.77% 2,379 3.08% (531) -18.24%<br />
Agriculture 1,124 1.46% 1,603 2.08% 478 42.53%<br />
Water 36,152 46.88% 36,291 47.06% 139 0.39%<br />
Scrub & Grass<br />
Land<br />
2,448 3.17% 4,012 5.20% 1,565 63.93%<br />
Sand & Beach 63 0.08% 63 0.08% - 0.00%<br />
TOTAL 77,120 100.00% 77,120 100.00%<br />
Source. Forest Department and Food and Agriculture Organization, 2004
map 1: land cover map of tanintharyi division in 1990<br />
Source: Forest Department and Food and Agriculture Organization, 2004<br />
133
map 2: land cover map of tanintharyi division in 2000<br />
Source: Forest Department and Food and Agriculture Organization, 2004<br />
134
map 3: change detection map of tanintharyi division between 1990 and 2000<br />
Source: Forest Department and Food and Agriculture Organization, 2004<br />
135
Summary<br />
A.Policy Reference<br />
1.Purpose:<br />
The purpose of the indicator is to estimate the changes of tropical rainforest and habitat<br />
losses particularly in Tanintharyi Division, in the southern part of the country where it is known as<br />
being one of the last strongholds of Southeast Asian tropical rainforests.<br />
2.Relevance to Environment Planning and Management:<br />
Finding land uses where natural habitats have to give way for development will enable sound<br />
land use planning and solve conflicts essential for management.<br />
3.Linkage to Other Indicators:<br />
The indicator may relate to other indicators of forest cover changes, land degradation, threat<br />
to coastal areas (mangrove forests turned into water means coastal bank erosion) etc.<br />
4.Targets:<br />
None applicable, as of the year of assessment.<br />
5.International Environment Treaties:<br />
Many international agreements cover forests and biodiversity conservation. <strong>Myanmar</strong> is<br />
supported to maintain or increase their forested areas, and discouraged to strongly reduce their<br />
forest lands. Specific forest agreements would include the Non-Legally Binding Authoritative<br />
Statement of Principles for a Global Consensus on the Management, Conservation and Sustainable<br />
Development of All Types of Forests [the Forest Principles of the United Nations Conference<br />
on Environment and Development (UNCED)]; and the International Tropical Timber Agreement.<br />
Many other international agreements deal with forests within the context of natural resources and<br />
environment conservation, for example Convention on International trade in Endangered Species<br />
(CITES), Convention on the Conservation of Wetlands of International Importance (Ramsar<br />
Convention), Convention on Biological Diversity, Convention on Climate Change, Convention<br />
to Combat Desertification. In addition, ASEAN agreements on sustainable natural resource<br />
management have been established.<br />
B.Analysis<br />
As can be observed from Figure 1 and Maps 1-3, the area of rainforests (closed forest) in<br />
Tanintharyi Division declined from 24603 km2 or 31.9% of the division area to 17,820 km2 or<br />
23.1% of the division area by year 2000. This translates to a 28% loss of tropical rain forest over<br />
the 10-year period (see Table 1b) and there was very little observed loss, if not a gain, in the period<br />
prior to 1990. The accelerated rate of deforestation, including the decline of tropical rain forests, is<br />
highly coincident with the 1988 open market economy and the competition from other land uses.<br />
The loss of 6,783 km2 tropical rain forest is counter-balanced by a 4,772 km2 increase in<br />
the area of degraded forest which increased from 9,820 km2 in 1990 to 14,592 km2 in 2000 (see<br />
Table 1b). The transition from tropical rain forest to degraded forest is even higher than this in the<br />
land use change matrix and in fact 6,350 km2 were lost from closed forest to degraded forest.<br />
Given the closure of all forest concessions along the Thai-<strong>Myanmar</strong> border in 1992-1993, the loss<br />
of tropical forests in Tanintharyi Division is highly suspect of illegal logging activities. Palm oil<br />
plantations may also be a contributing factor.<br />
Owing to the fact that deforestation rate at the national level (1989 to 1998) was 1.2% per<br />
annum, the loss of tropical rainforest in the Tanintharyi Division at the rate of 2.8% per annum<br />
(1990 – 2000) is relatively high. With the growing tendency in expansion of palm oil and rubber<br />
plantation in the region, there is increasing pressure on loss of habitat.<br />
136
Indicator ID<br />
Indicator Name<br />
Greater mekong Subregion<br />
indicator Fact Sheet<br />
dataBaSe inFormation<br />
Year of <strong>Assessment</strong> 2005<br />
Type of Indicator Pressure<br />
Frequently Asked Question (FAQ)<br />
Priority Concern Threats to Biodiversity<br />
Geographic Area Union of <strong>Myanmar</strong><br />
Magnitude & Trend High and Increasing<br />
Key Message<br />
137<br />
Loss of Mangroves in the Delta Forest Reserves<br />
- 1924 to 2001<br />
How serious is the loss of mangrove forests in<br />
places like the Delta Forest Reserve?<br />
Historically, delta mangroves have been subject<br />
to expansion of paddy cultivation and charcoal<br />
production since 1924. Only 44% of total<br />
mangrove forest in 1924 remained in 2001.<br />
Commercial shrimp farming became popular in<br />
the post-1990s and the loss of mangrove habitat<br />
peaked in 2001 when another 35,836 hectares<br />
of mangroves disappeared. This is equivalent to<br />
24% of total mangrove forest in the year 2000.<br />
Therefore, the pressure on biological diversity of<br />
mangrove ecosystem is high and increasing.
technical inFormation<br />
A.Definition<br />
This indicator attempts to track the change or loss of mangrove forest cover in nine delta<br />
forest reserves of the Ayeyarwady delta of <strong>Myanmar</strong>.<br />
Mangrove forests are the characteristic littoral plant formations of tropical and subtropical<br />
sheltered coastlines. Generally mangroves are trees and bushes growing below the high water level<br />
of spring tides. Their root systems are thus regularly inundated with saline water, even though<br />
it may be diluted due to freshwater surface run-offs and only flooded once or twice a year. Its<br />
ecosystems are very unique and very rich both in flora and fauna. Reserved Forest means land<br />
constituted as “reserved forest” under Forest Law (1992) which is property of the Government and<br />
in such forest, most of the activities are prohibited unless allowed.<br />
B.Data Source<br />
Data employed in this indicator are provided by the Remote Sensing and Geographical<br />
Information System (RS/GIS) Section of Forest Department based on their study carried out in<br />
2003 for the assessment on Forest Cover Changes in Ayeyarwaddy Delta Forest.<br />
C.Geographic Area / Population Coverage<br />
This indicator is only representative of nine delta Forest Reserves in Bogalay and Latputa<br />
Townships of Ayeyarwady Division with the total land coverage of 253,018 ha in the lower part of<br />
the country.<br />
D.Temporal Coverage<br />
The indicator is representative of trends in Delta mangrove areas in the years of 1924, 1954,<br />
1974, 1980, 1983, 1990, 1995, 2000, and 2001.<br />
E.Methodology and Frequency of Coverage<br />
Forest Department monitors and updates the delta mangrove database regularly, as remote<br />
sensing data becomes available.<br />
F.Methodology of Data Manipulation<br />
1924, 1954, 1983 data are from aerial photography interpretation. 1974 data is from Landsat<br />
MSS, and the rest are digital interpretations of Landsat TM. All interpretation data are put into GIS<br />
and the areas are calculated using one forest administrative boundary GIS database for a total land<br />
area of 253,018 ha.<br />
138
Qualitative inFormation<br />
A.Strength and Weakness (data level)<br />
The indicator provides a historical timeline trend of mangrove forest coverage in Ayeyarwaddy<br />
Delta for a period of more than 80 years. However, the indicator only represents the status of larger<br />
mangrove areas in the lower part of the country and mangrove habitats elsewhere along the coastal<br />
areas and outside of the studied forest reserve areas in Ayeyarwaddy delta were are not included<br />
for the analysis.<br />
B.Reliability, Accuracy, Robustness, Uncertainty (data level)<br />
Reliability is high since mangrove cover is an easily disguisable feature using remote sensing<br />
techniques. All the interpretations and interpreters have been supported by intensive ground-truths.<br />
C.Future Work Required (for data level and indicator level)<br />
Further updating of the existing database as well as extending of the study for mangrove area<br />
in Rakhine and Tanintharyi Coasts are desirable. It should also develop for matrix changed data to<br />
correlate the land use changes within the given land categories.<br />
Hectares<br />
SupportinG data taBleS, GraphS and mapS<br />
Figure 1: loss of mangrove in delta Forest reserves - 1924-2001<br />
300,000<br />
250,000<br />
200,000<br />
150,000<br />
100,000<br />
50,000<br />
-<br />
1924 1954 1974 1980 1983 1990 1995 2000 2001<br />
139<br />
Mangrove Cultivation Others
year<br />
table 1: loss of mangrove in delta Forest reserves - 1924-2001<br />
mangrove<br />
Forest (ha)<br />
cultivation (ha) others (ha)<br />
140<br />
total 9 Forest<br />
reserve area<br />
(ha)<br />
1924 253,018 - - 253,018<br />
1954 234,510 18,508 - 253,018<br />
1974 231,042 21,921 55 253,018<br />
1980 181,060 69,217 2,741 253,018<br />
1983 182,363 54,869 15,786 253,018<br />
1990 164,417 85,463 3,138 253,018<br />
1995 161,014 90,763 1,241 253,018<br />
2000 147,775 101,708 3,536 253,018<br />
2001 111,939 140,581 498 253,018<br />
Source. Forest Department 2005
Summary<br />
A.Policy Reference<br />
1.Purpose:<br />
The purpose of this indicator is to examine the changes of mangrove forest in the Delta Forest<br />
Reserves and thereby to review the loss of mangrove habitat in general by highlighting the level of<br />
threat on biological diversity as a whole.<br />
2.Relevance to Environment Planning and Management:<br />
This indicator is relevant to the conservation of an important wetland ecosystem as well<br />
as rehabilitation of degraded coastal areas for natural disaster prevention and fishery resource<br />
management.<br />
3.Linkage to Other Indicators:<br />
The indicator is linked to other indicators such as forest cover, land use changes, percentage<br />
of protected area system and percentage of permanent forest estate.<br />
4.Targets:<br />
In preparation for the national action plan for combating desertification in <strong>Myanmar</strong> in<br />
compliance with UNCCD, Ayeyarwaddy delta is selected as an important site for conservation<br />
priority. However, there are no specific targets established for this indicator.<br />
5.International Environment Treaties:<br />
Many international agreements cover forests and biodiversity conservation. <strong>Myanmar</strong> is<br />
supported to maintain or increase their forested areas, and discouraged to strongly reduce their<br />
forest lands. Specific forest agreements would include the Non-Legally Binding Authoritative<br />
Statement of Principles for a Global Consensus on the Management, Conservation and Sustainable<br />
Development of All Types of Forests [the Forest Principles of the United Nations Conference on<br />
Environment and Development (UNCED)]; and the International Tropical Timber Agreement.<br />
Many other international agreements deal with forests within the context of natural resources<br />
and environment conservation, for example the Convention on International trade in Endangered<br />
Species (CITES), Convention on the Conservation of Wetlands of International Importance (Ramsar<br />
Convention), Convention on Biological Diversity, Convention on Climate Change and Convention<br />
to Combat Desertification. In addition, ASEAN agreements on sustainable natural resource<br />
management have been established.<br />
B.Analysis<br />
As can be observed from Figure 1 and Table 1, mangrove forests in the Delta Forest Reserve<br />
have declined at an alarming rate from 253,018 ha in 1924 to 111,939 ha in 2001. Only 44% of the<br />
original mangroves remain. The increase in the area of rice cultivation during the past 25 years is<br />
probably the main contributing factor. The cultivated area is now more than half the total reserve<br />
area. Fuelwood extraction for charcoal production has also been a contributing factor in the 1980s<br />
but was banned in the post-1990s. Shrimp farming is now the main contributing factor for the loss<br />
of mangrove forest in the delta area. Habitat loss peaked in 2001 with the loss of 35,836 ha within<br />
one year, equivalent to 24% of total mangrove forest area in 2000.Therefore, the loss of mangrove<br />
habitat is accelerating at an alarming rate and its magnitude has been high and increasing.<br />
141
Indicator ID<br />
Indicator Name<br />
Greater mekong Subregion<br />
indicator Fact Sheet<br />
dataBaSe inFormation<br />
Year of <strong>Assessment</strong> 2005<br />
Type of Indicator Response<br />
Frequently Asked Question (FAQ)<br />
Priority Concern Threats to Biodiversity<br />
Geographic Area Union of <strong>Myanmar</strong><br />
Impact & Trend Low but Consistent<br />
Key Message<br />
142<br />
Percentage of Protected Area Over Total Land<br />
Area 1918 - 2004<br />
To what extent is biodiversity being safeguarded<br />
and preserved by the System of Protected Areas?<br />
The system of protected areas in <strong>Myanmar</strong><br />
has steadily increased since 1996. By 2004, it<br />
accounts for 7.24% of total land area. Thus the<br />
government response to biodiversity conservation<br />
is consistent but total coverage of system is low<br />
when compared to that of other GMS countries,<br />
i.e. Cambodia (32%), Thailand (27.5%) and Lao<br />
PDR (14%).
technical inFormation<br />
A.Definition<br />
This indicator attempts to track the amount of natural biodiversity area under legal protection<br />
tracked over time; it is expressed as a percentage of the Protected Area System area over the total<br />
area of the country.<br />
PAS (Protected Area System) means all national parks, game parks, mountain parks,<br />
bird sanctuaries etc. declared as PAS areas under “Protection of Wildlife and Wild Plants and<br />
Conservation of Natural Areas Law”, enacted in June 1994.<br />
B.Data Source<br />
All of the data utilized for the development of this indicator originate from the <strong>Myanmar</strong> Forest<br />
Department (FD).<br />
C.Geographic Area / Population Coverage<br />
The protected areas system data utilized for the development of this indicator are<br />
representative of all protected areas in the Union of <strong>Myanmar</strong> as a whole and based on a total land<br />
area of 67,658,000 ha.<br />
D.Temporal Coverage<br />
The indicator is representative of trends in protected areas system since its inception in 1918<br />
until the year 2004.<br />
E.Methodology and Frequency of Coverage<br />
The Forest Department updates PAS areas on a continuous basis.<br />
F.Methodology of Data Manipulation<br />
Total PAS areas (including proposed areas to show the current efforts) are expressed as a<br />
percentage of total land area assuming a total land area of 67,658,000 ha.<br />
Qualitative inFormation<br />
A.Strength and Weakness (data level)<br />
The indicator provides explicit general information about the status of biodiversity<br />
conservation in <strong>Myanmar</strong>. A historical timeline trend is also observable for percentage change in<br />
the protected area system. However, it does not give the change of status of habitats with each PAS<br />
area.<br />
B.Reliability, Accuracy, Robustness, Uncertainty (data level)<br />
The records of the Forest Department are considered highly reliable, within the limits of<br />
accuracy of their accounting system for protected areas.<br />
C.Future Work Required (for data level and indicator level)<br />
There will be a requirement to update the indicator and this fact sheet on a regular or annual<br />
basis. Also, the habitat status within each PAS should be monitored to analyze the effectiveness of<br />
the current PAS for biodiversity conservation. A study should also be initiated for the comparison of<br />
the PAS against the total area of critically important ecosystems.<br />
143
year<br />
SupportinG data taBleS, GraphS and mapS<br />
Figure 1: percentage of protected area over total land area – 1918-2004<br />
Thousand Hectares<br />
6,000<br />
5,000<br />
4,000<br />
3,000<br />
2,000<br />
1,000<br />
-<br />
1918<br />
1927<br />
1928<br />
1930<br />
1936<br />
1939<br />
1940<br />
1941<br />
1942<br />
1970<br />
1971<br />
1972<br />
144<br />
1982<br />
1985<br />
1988<br />
1989<br />
1993<br />
PAS Area Accumulated % PAS Accumulated<br />
table 1: percentage of protected area over total land area – 1918-2004<br />
paS area<br />
yearly<br />
established<br />
(1000 ha)<br />
accumulated<br />
area of paS<br />
(1000 ha)<br />
accumulated<br />
paS as % of<br />
total land<br />
1996<br />
1997<br />
2001<br />
2002<br />
2004<br />
no of paS<br />
yearly<br />
established<br />
8.0%<br />
7.0%<br />
6.0%<br />
5.0%<br />
4.0%<br />
3.0%<br />
2.0%<br />
1.0%<br />
0.0%<br />
Protected Area As % of Total Land<br />
no of<br />
accumulated<br />
paS<br />
1918 115.11 115 0.17% 3 3<br />
1927 4.92 120 0.18% 1 4<br />
1928 16.06 136 0.20% 1 5<br />
1930 1.61 138 0.20% 1 6<br />
1936 13.85 152 0.22% 1 7<br />
1939 0.44 152 0.22% 1 8<br />
1940 55.27 207 0.31% 1 9<br />
1941 26.94 234 0.35% 1 10<br />
1942 2.45 237 0.35% 1 11<br />
1970 0.09 237 0.35% 1 12<br />
1971 215.07 452 0.67% 1 13<br />
1972 20.59 472 0.70% 1 14<br />
1982 0.62 473 0.70% 1 15<br />
1985 64.23 537 0.79% 1 16<br />
1988 10.36 548 0.81% 1 17<br />
1989 172.62 720 1.06% 2 19<br />
1993 13.67 734 1.08% 1 20<br />
1996 413.72 1,148 1.70% 4 24<br />
1997 72.31 1,220 1.80% 2 26<br />
2001 301.54 1,521 2.25% 4 30<br />
2002 762.62 2,284 3.38% 5 35<br />
2004 2,617.19 4,901 7.24% 4 39<br />
Source: Nature and Wildlife Conservation Division, Forest Department 2005
habitat<br />
table 2: protected area by habitat type – 2004<br />
area extent of relevant<br />
paS (ha)<br />
145<br />
% of total paS<br />
Marine PAS 39,161 0.80%<br />
Terrestrial PAS 4,705,575 96.01%<br />
Wetland PAS 156,531 3.19%<br />
Grand Total 4,901,267 100%<br />
Source: Nature and Wildlife Conservation Division, Forest Department 2005<br />
table 3a: individual protected areas byyear of establishment and aerial extent - 2004<br />
no. name year<br />
1.<br />
2.<br />
3.<br />
4.<br />
5.<br />
6.<br />
7.<br />
8.<br />
9.<br />
10.<br />
11.<br />
12.<br />
13.<br />
14.<br />
Pidaung wildlife<br />
Sanctuary<br />
Shwe-U-Daung<br />
Wildlife Sanctuary<br />
Shwe-U-Daung<br />
Wildlife Sanctuary<br />
Pyin-O-Lwin Bird<br />
Sanctuary<br />
Moscos Islands<br />
Wildlife Sanctuary<br />
Kahilu Wildlife<br />
Sanctuary<br />
Taunggyi Bird<br />
Sanctuary<br />
Mulayit Wildlife<br />
Sanctuary<br />
Wethtikan Bird<br />
Sanctuary<br />
Shwesettaw<br />
Wildlife Sanctuary<br />
Chatthin Wildlife<br />
Sanctuary<br />
Kelatha Wildlife<br />
Sanctuary<br />
Thamihla Kyun<br />
Wildlife Sanctuary<br />
Htamanthi Wildlife<br />
Sanctuary<br />
Minwuntaung<br />
Wildlife Sanctuary<br />
areas General<br />
location<br />
acres Sq. miles<br />
1918 172,452.34 269.46 Kachin State<br />
1918 51,106.00 79.85 Mandalay Division<br />
1929 29,440 46 Shan State<br />
1918 31,443.2 49.13 Mandalay Division<br />
1927 12,153.6 18.99<br />
Taninthayi<br />
Division<br />
1928 39,673.6 61.99 Karen State<br />
1930 3,968 6.2 Shan State<br />
1936 34,233.6 53.49 Karen State<br />
1939 1,088 1.70 Magwe Division<br />
1940 136,576 213.4 Magwe Division<br />
1941 66,273 104 Sagaing Division<br />
1942 6,048 9.45 Mon State<br />
1970 217.6 0.34<br />
Ayeyarwady<br />
Division<br />
1971 531,456 830.4 Sagaing Division<br />
1972 50,873.6 79.49 Sagaing Division<br />
15. Hlawga Park 1982 1,540 2.41 Yangon Division<br />
16.<br />
Inlay Wetland Bird<br />
Sanctuary<br />
Moeyongyi<br />
1985 158,720 248 Shan State<br />
17. Wetland Bird<br />
Sanctuary<br />
1988 25,600 40 Bago Division
18.<br />
Alaungdaw<br />
Kathapa <strong>National</strong><br />
Park<br />
19.<br />
Popa Mountain<br />
Park<br />
20.<br />
Meinmahla Kyun<br />
Wildlife Sanctuary<br />
1993 33,776 52.78<br />
21.<br />
Lampi Island<br />
Marine N. Park<br />
1996 50,617.6 79.09<br />
22.<br />
Hkakaborazi<br />
<strong>National</strong> Park<br />
23.<br />
Loimwe Protected<br />
Area<br />
24.<br />
Parsar Protected<br />
Area<br />
25.<br />
Natmataung<br />
<strong>National</strong> Park<br />
26.<br />
Lawkananda<br />
Wildlife Sanctuary<br />
27.<br />
Indawgyi Wetland<br />
Wildlife Sanctuary<br />
28.<br />
Kyaikhtiyoe<br />
Wildlife Sanctuary<br />
29.<br />
Minsontaung<br />
Wildlife Sanctuary<br />
30.<br />
Hukaung Valley<br />
Wildlife Sanctuary<br />
31.<br />
Kyauk Pan Taung<br />
Wildlife Sanctuary<br />
32.<br />
Hponkanrazi<br />
Wildlife Sanctuary<br />
33.<br />
Rakhine Yoma<br />
Elephant Range<br />
Panlaung-pyadalin<br />
34. Cave Wildlife<br />
Sanctuary<br />
35.<br />
Maharmyaing<br />
Wildlife Sanctuary<br />
36.<br />
Lenya <strong>National</strong><br />
Park<br />
2002 436,480 682<br />
37.<br />
Taninthary<br />
<strong>National</strong> Park<br />
2002 640,000 1000<br />
38.<br />
Bumhpabum<br />
Wildlife Sanctuary<br />
Hukaung Valley<br />
39. Wildlife Sanctuary<br />
(extension)<br />
40.<br />
Taninthayi Nature<br />
Reserve<br />
2004 420,076.8 656.37<br />
Grand Total 10,647,296.89 18,923.898<br />
Source: Nature and Wildlife Conservation Division, Forest Department 2005<br />
1989 394,779.52 616.843 Sagaing Division<br />
1989 31,763.2 49.63 Mandalay Division<br />
146<br />
Ayeyarwady<br />
Division<br />
Taninthary<br />
Division<br />
1996 942,080 1472 Kachin State<br />
1996 10,585.6 16.54 Shan State<br />
1996 19,032.4 29.74 Shan State<br />
1997 178,560 279 Chin State<br />
1997 115.2 0.18 Mandalay Division<br />
2004 191,564.8 314.67 Kachin State<br />
2001 38,606 60.32 Mon State<br />
2001 5,584 8.725 Mandalay Division<br />
2004 1,574,400 2460 Kachin State<br />
2001 32,768 51.2 Chin State<br />
2001 668,160 1044 Kachin State<br />
2002 43,3843.2 677.88 Rakhine State<br />
2002 82,483.2 128.88 Shan State<br />
2002 291,680 455.75 Sagaing Division<br />
Taninthary<br />
Division<br />
Taninthary<br />
Division<br />
2004 460,160 716 Kachin State<br />
2004 3,813,120 5958 Kachin State<br />
Taninthayi<br />
Division
no. name Bio-unit<br />
1. Pidaung wildlife<br />
Sanctuary<br />
2. Shwe-U-Daung<br />
Wildlife Sanctuary<br />
Shwe-U-Daung<br />
Wildlife Sanctuary<br />
3. Pyin-O-Lwin Bird<br />
Sanctuary<br />
4. Moscos Islands<br />
Wildlife Sanctuary<br />
5. Kahilu Wildlife<br />
Sanctuary<br />
6. Taunggyi Bird<br />
Sanctuary<br />
7. Mulayit Wildlife<br />
Sanctuary<br />
8. Wethtikan Bird<br />
Sanctuary<br />
9. Shwesettaw Wildlife<br />
Sanctuary<br />
10. Chatthin Wildlife<br />
Sanctuary<br />
11. Kelatha Wildlife<br />
Sanctuary<br />
12. Thamihla Kyun<br />
Wildlife Sanctuary<br />
13. Htamanthi Wildlife<br />
Sanctuary<br />
14. Minwuntaung Wildlife<br />
Sanctuary<br />
table 3b: Key protected Species by protected area<br />
9 b. Terrestrial<br />
Between N 25º 15’ &<br />
25º 35’, Between E<br />
97º 14’ & 97º 20’<br />
10 b. Terrestrial<br />
Between N 23º 5’ &<br />
22º 57’, Between E<br />
99º 5’ & 96º 22’<br />
10 b. Terrestrial 22º<br />
00’ N & 96º 30’E<br />
Key Species<br />
protected<br />
Elephant, Gaur,<br />
Banteng, Sambar,<br />
Tiger, Leopard, Bear.<br />
Rhinoceros,<br />
Elephant, Gaur,<br />
Banteng, Sambar,<br />
Serow, Tiger Bear.<br />
Barking deer,<br />
Pheasant<br />
4. Island marine Barking deer,<br />
Sambar, Swiftlet<br />
4. Terrestrial 17º 3’<br />
N & 97º 6’ E<br />
10 b. Terrestrial 20º<br />
45’ N & 97º 04’E<br />
10 a. Terrestrial 16º<br />
7’ N & 98º 30’ E<br />
9 a. Wetland 20º 00’<br />
N & 96º 30’E<br />
9 a. Terrestrial 20º<br />
12’ N & 94º 35’E<br />
9 a. Terrestrial 23º<br />
36’ N & 95º 32’ E<br />
4. Terrestrial 17º 13’<br />
N & 97º 6’ E<br />
4. Marine 15º 5’ N &<br />
94º 17’ E<br />
9 b. Terrestrial 25º<br />
26’ N & 95º 37’ E<br />
9 a. Terrestrial 22º 2’<br />
N & 95º 58’ E<br />
15. Hlawga Park 4. Terrestrial 17º 01’<br />
N & 98º 05’ E<br />
Rhinoceros, Serow,<br />
Mouse deer, Hog<br />
deer<br />
147<br />
management<br />
Status<br />
Managed under<br />
Nature and Wildlife<br />
Conservation<br />
Division<br />
Managed under<br />
Nature and Wildlife<br />
Conservation<br />
Division<br />
Managed under<br />
Forest Department<br />
Managed under<br />
Forest Department<br />
Managed under<br />
Forest Department<br />
Avifauna Managed under<br />
Forest Department<br />
Barking deer, Tiger,<br />
Leopard<br />
Managed under<br />
Forest Department<br />
Wetland birds Managed under<br />
Forest Department<br />
Eld’s deer, Sambar,<br />
Barking deer, Gaur<br />
Eld’s deer, Sambar,<br />
Barking deer<br />
Managed under<br />
Nature and Wildlife<br />
Conservation<br />
Division<br />
Managed under<br />
Nature and Wildlife<br />
Conservation<br />
Division<br />
Serow, Avifauna Managed under<br />
Forest Department<br />
Marine turtle Managed under<br />
Forest Department<br />
Rhinoceros,<br />
elephant, Gaur, Tiger<br />
Barking deer,<br />
Avifauna<br />
Enclosed wildlife<br />
park. Sambar,<br />
Barking deer, Hog<br />
deer, Eld’s deer,<br />
mythun, migratory<br />
birds<br />
Managed under<br />
Nature and Wildlife<br />
Conservation<br />
Division<br />
Managed under<br />
Forest Department<br />
Managed under<br />
Nature and Wildlife<br />
Conservation<br />
Division<br />
remark<br />
Protected Areas<br />
- / -<br />
Protected Areas<br />
Notification No.<br />
188/28 (1-9-1928)<br />
- / -<br />
- / -<br />
Protected Areas<br />
Notification No.<br />
275/39 (1-9-1939)<br />
- / -<br />
Protected Areas<br />
Notification No.<br />
210/40 (1-9-1940)<br />
Protected Areas<br />
Notification No.<br />
177/41 (1-9-1941)<br />
Protected Areas<br />
Protected Areas<br />
Notification No.<br />
289/70 (1-12-1970)<br />
Protected Areas<br />
Notification No.<br />
31/74<br />
Protected Areas<br />
- / -
16. Inlay Wetland Bird<br />
Sanctuary<br />
17. Moeyongyi Wetland<br />
Bird Sanctuary<br />
18. Alaungdaw Kathapa<br />
<strong>National</strong> Park<br />
10 b. Wetland /Lake<br />
Between N 19º 46’ &<br />
20º 38’, Between E<br />
96º 47’ & 97º 6’<br />
4. Wetland reservoir<br />
17º 34’ N & 96º 35’E<br />
9 a. Terrestrial 22º<br />
30’ N & 94º 20’E<br />
19. Popa Mountain Park 9 a. Terrestrial 95º<br />
15’ E & 20º 53’ N<br />
20. Meinmahla Kyun<br />
Wildlife Sanctuary<br />
21. Lampi Island Marine<br />
N. Park<br />
22. Hkakaborazi <strong>National</strong><br />
Park<br />
23. Loimwe Protected<br />
Area<br />
24. Parsar Protected<br />
Area<br />
25. Natmataung <strong>National</strong><br />
Park<br />
26. Lawkananda Wildlife<br />
Sanctuary<br />
27. Indawgyi Wetland<br />
Wildlife Sanctuary<br />
28. Kyaikhtiyoe Wildlife<br />
Sanctuary<br />
29. Minsontaung Wildlife<br />
Sanctuary<br />
4. Marine 16º 05’ N &<br />
95º 18’E<br />
7 b. Marine Between<br />
N 10º 41.5’ & 10º<br />
95.3’ Between E 98º<br />
4.9’ & 98º 18.3’<br />
H d. Terrestrial 28º<br />
05’ N & 97º 44’E<br />
10 b. Terrestrial E<br />
99º 45’, N 21º 8’<br />
10 a. Terrestrial E<br />
99º 53’, N 20º 29’<br />
9 c. Terrestrial E 94º<br />
00’, N 21º 12’<br />
9 a. Terrestrial E 94º<br />
47’, N 21º 15’<br />
9 a. Wetland/ Lake<br />
Between N 24º 56’ &<br />
25º 24’, Between E<br />
96º 0’ & 96º 39’<br />
4. Terrestrial<br />
Between N 17º 24’ &<br />
17º 34’, Between E<br />
97º 01’ & 97º 10’<br />
9 a. Terrestrial E 95º<br />
43’, N 21º 28’<br />
Wetland and<br />
migratory bird<br />
148<br />
Managed under<br />
Nature and Wildlife<br />
Conservation<br />
Division<br />
Migratory birds Managed under<br />
Nature and Wildlife<br />
Conservation<br />
Division<br />
Elephant, Tiger,<br />
Leopard, Gaur,<br />
Sambar, Serow, bear<br />
Barking deer,<br />
Leopard,<br />
Geomorphologic<br />
features<br />
Mangrove crocodiles,<br />
birds<br />
Coral reefs,<br />
Mousedeer and<br />
Salon ethnic culture<br />
Takin, Musked deer,<br />
Red goral, Black<br />
barking deer<br />
Tiger, Bear, Pangolin,<br />
Pheasant<br />
Jungle fowl, Chinese<br />
pangolin<br />
Gaur, Serow, Goral<br />
and Avifauna<br />
Avifauna, Cultural<br />
diversity<br />
Elephant, Tiger,<br />
Sambar deer,<br />
Leopard, Bear,<br />
Serow, Gaur<br />
Tiger, Goral, Gaur,<br />
Sambar, Monkey<br />
Barking deer, Rabbit,<br />
Dhole, Reptiles,<br />
Land tortoise, Wild<br />
cat, Snakes<br />
Managed under<br />
Nature and Wildlife<br />
Conservation<br />
Division<br />
Managed under<br />
Nature and Wildlife<br />
Conservation<br />
Division<br />
Managed under<br />
Nature and Wildlife<br />
Conservation<br />
Division<br />
Managed under<br />
Forest Department<br />
Managed under<br />
Forest Department<br />
Managed under<br />
Forest Department<br />
Managed under<br />
Forest Department<br />
Managed under<br />
Nature and Wildlife<br />
Conservation<br />
Division<br />
Managed under<br />
Nature and Wildlife<br />
Conservation<br />
Division<br />
Managed under<br />
Nature and Wildlife<br />
Conservation<br />
Division<br />
Managed under<br />
Nature and Wildlife<br />
Conservation<br />
Division<br />
Managed under<br />
Nature and Wildlife<br />
Conservation<br />
Division<br />
Protected Areas<br />
Notification No.<br />
15/85 (30-1-1985)<br />
Protected Areas<br />
Notification No.<br />
93/88 (22-4-1988)<br />
Protected Areas<br />
Notification No.<br />
31/89 (1-1-1989)<br />
Protected Areas<br />
Protected Areas<br />
Notification No.<br />
91/93 (5.1.1993)<br />
Protected Areas<br />
Notification No.<br />
40/96 (20.8.1996)<br />
Protected Areas<br />
Notification No. 3/96<br />
(30.1.1996)<br />
Protected Areas<br />
Notification No. 2/96<br />
(30.1.1996)<br />
Protected Areas<br />
Notification No. 4/96<br />
(30.1.1996)<br />
Proposed Protected<br />
Areas Notification<br />
No. 6/97 (23.7.1997)<br />
Protected Areas<br />
Protected Areas<br />
Notification No.<br />
39/2004 (9.8.2004)<br />
Protected Areas<br />
Notification No.<br />
37/2001 (6.7.2001)<br />
Protected Areas<br />
Notification No.<br />
14/2001(22.3.2001)
30. Hukaung Valley<br />
Wildlife Sanctuary<br />
31. Kyauk Pan Taung<br />
Wildlife Sanctuary<br />
32. Hponkanrazi Wildlife<br />
Sanctuary<br />
33. Rakhine Yoma<br />
Elephant Range<br />
34. Panlaung-pyadalin<br />
Cave Wildlife<br />
Sanctuary<br />
35. Maharmyaing<br />
Wildlife Sanctuary<br />
9 b. Terrestrial E 97º<br />
41’, N 26º 17’<br />
9 c. Terrestrial<br />
Between N 21º 19’ &<br />
21º 24’, Between E<br />
92º 59’ & 93º 4’<br />
9 b. Terrestrial E 97º<br />
43’, N 27º 30’<br />
4. Terrestrial E 94º<br />
30’, N 17º 31’<br />
10 b. Terrestrial E<br />
96º 28’, N 21º 10’<br />
9 a. Terrestrial<br />
Between N 22º 50’ &<br />
23º 45’, Between E<br />
94º 15’ & 95º 00’<br />
36. Lenya <strong>National</strong> Park 7 b. Terrestrial<br />
Between N 10º 48’ &<br />
99º 20’, Between E<br />
98º 49’ & 99º 20’<br />
37. Taninthary <strong>National</strong><br />
Park<br />
38. Bumhpabum Wildlife<br />
Sanctuary<br />
39. Hukaung Valley<br />
Wildlife Sanctuary<br />
(extension)<br />
40. Taninthayi Nature<br />
Reserve<br />
5 a. Terrestrial E 97º<br />
00’, N 12º 02’<br />
9 b. Terrestrial E 97º<br />
31’, N 26º 29’<br />
Elephant, Leopard,<br />
Tiger, Gaur, Sambar,<br />
Bear, Wildboar,<br />
Serow<br />
Seraw, Goral,<br />
Sambar, Leopard,<br />
Clouded leopard,<br />
Wild cats, Barking<br />
deer, Wildboar<br />
Barking deer,<br />
Avifauna, Red Goral,<br />
Gibbon, Wild dogs,<br />
Mangooses<br />
Elephant, Gaur,<br />
Leopard, Jackal,<br />
Bear<br />
Elephant, Tiger,<br />
Leopard, Gaur,<br />
Banteng, Golden cat,<br />
Clouded leopard,<br />
Serow, Gibbon<br />
Sambar, Wildboar,<br />
Banteng, Feline,<br />
Gibbon, Wild dogs,<br />
Mangooses<br />
Tapir, Elephant,<br />
Monkeys, Barking<br />
deer, Sambar,<br />
Wildboar, Bear,<br />
Mouse deer, Wild<br />
cats, Pangolin,<br />
Lizards, Birds, Tiger<br />
Sambar, Barking<br />
deer, Serow, Goral,<br />
Leopard, Wild<br />
elephant, Birds, Tiger<br />
Elephant, Gaur,<br />
Serow, Deer Spp:,<br />
Clouded leopard,<br />
Golden cat, Jackal,<br />
Goral, Mancaques,<br />
Civets, Bear,<br />
Leopard, Pheasant,<br />
Hornbills<br />
Elephant, Leopard,<br />
Tiger, Gaur, Sambar,<br />
Bear, Wild Boar,<br />
Serow<br />
Gurney’s Pitta, Tiger,<br />
Elephant, Tapir<br />
Source: Nature and Wildlife Conservation Division, Forest Department 2005<br />
149<br />
Managed under<br />
Nature and Wildlife<br />
Conservation<br />
Division<br />
Managed under<br />
Nature and Wildlife<br />
Conservation<br />
Division<br />
Managed under<br />
Nature and Wildlife<br />
Conservation<br />
Division<br />
Managed under<br />
Nature and Wildlife<br />
Conservation<br />
Division<br />
Managed under<br />
Nature and Wildlife<br />
Conservation<br />
Division<br />
Managed under<br />
Nature and Wildlife<br />
Conservation<br />
Division<br />
Managed under<br />
Nature and Wildlife<br />
Conservation<br />
Division<br />
Managed under<br />
Nature and Wildlife<br />
Conservation<br />
Division<br />
Managed under<br />
Nature and Wildlife<br />
Conservation<br />
Division<br />
Managed under<br />
Nature and Wildlife<br />
Conservation<br />
Division<br />
Managed under<br />
Nature and Wildlife<br />
Conservation<br />
Division<br />
Protected Areas<br />
Notification No.<br />
34/2004 (3.6.2004)<br />
Proposed<br />
Protected Areas<br />
Notification No.<br />
17/2001(18.4.2001)<br />
Protected Areas<br />
Notification No.<br />
47/2001(21.8.2001)<br />
Protected Areas<br />
Notification No.<br />
21/2002 (5.2.2002)<br />
Protected Areas<br />
Notification No.<br />
20/2002(18.5.2002)<br />
Proposed<br />
Protected Areas<br />
Notification No.<br />
18/2002(15.3.2002)<br />
Proposed Protected<br />
Areas Notification<br />
No. 21/2002<br />
(18.3.2002)<br />
Proposed Protected<br />
Areas Notification<br />
No.19/2002<br />
(18.3.2002)<br />
Protected Areas<br />
Notification No.<br />
40/2004 (9.8.2004)<br />
Proposed Protected<br />
Areas Notification<br />
No. 7/2004<br />
(1.3.2004)<br />
Proposed Protected<br />
Areas Notification<br />
No. 31/2004<br />
(10.5.2004)
Figure 2:Wildlife Sanctuaries and national parks – 2004<br />
150
Summary<br />
A.Policy Reference<br />
1.Purpose:<br />
This indicator represents the extent to which areas important for conserving biodiversity,<br />
cultural heritage, scientific research (including baseline monitoring), recreation, natural resource<br />
maintenance, and other values, are protected from incompatible uses.<br />
2.Relevance to Environment Planning and Management:<br />
Protected areas are an essential tool for ecosystem conservation, with functions going well<br />
beyond the conservation of biological diversity. As such, they are one of the building blocks of<br />
sustainable development.<br />
3.Linkage to Other Indicators:<br />
This indicator is linked to other indicators, which have implications for land and resource use.<br />
These would include: land use change, wood harvesting intensity, forest area, ratification of global<br />
agreements, etc.<br />
4.Targets:<br />
The present <strong>Myanmar</strong> forest policy clearly declares 10 % should be under the Protected<br />
Area System for nature conservation. The UN suggests that under The 1991 Caring for the<br />
Earth: A Strategy for Sustainable Living establishes a target of 10% protected area for each<br />
major ecological region for countries by 2000. A similar target was agreed to by the 5th World<br />
Congress on <strong>National</strong> Parks and Protected Areas in 1992. Both targets reflect recognition that<br />
representation of ecosystem diversity is more meaningful than a flat percentage of the country’s<br />
area.<br />
5.International Environment Treaties:<br />
The following international treaties and agreements relate to the concern of PAS cover;<br />
• nternational Tropical Timber Agreement for promotion of “Sustainable Forest Management”<br />
• Convention on Biological Diversity (CBD) for forest flora and fauna conservation<br />
• Convention on International Trade in Endanger Species (CITES) for efficient forest protection<br />
effective to conserving endanger species<br />
• Convention on the Conservation of Wetlands of International Importance (Ramsar Convention)<br />
for contextual protection of forest ecosystem<br />
• Convention on Climate Change for forest environmental conservation<br />
• Convention to Combat Desertification for natural resource conservation<br />
B.Analysis<br />
As illustrated in Figure 1 and Table 1, the system of protected areas when it was formally<br />
established by Wildlife Protection Law in 1994 did not include much more than 1% of the total<br />
land area. As of 1993, the system included 20 individual protected areas but, with the exception<br />
of Pidaung Wildlife Sanctuary and Alaungdaw Kathapa <strong>National</strong> Park, their overall area was not<br />
significant. Six additional protected areas were added in 1996/97 bringing the total to 1.8% of<br />
total land area. Another 9 were added in 2001/2002 bringing the total to 3.4 % of the total land<br />
area.<br />
In 2004 notification was given to add another three protected areas, including the. Tanintharyi<br />
Nature Reserve and Hu-kaung Valley Wildlife Sanctuary (extension) in the northern forest complex<br />
area where biodiversity is extremely rich. This will extend the system to 39 protected areas<br />
equivalent to 7.2% of total land area, or approximately 4.9 million hectares (PAS Extension Area is<br />
not counted as a separate protected area).<br />
151
There are currently no targets directly associated with protected areas. However, the <strong>National</strong><br />
Forest Policy which was proclaimed in 1995 has set an indirect target to have a forest area<br />
equivalent to 5% of the total land area under the system of protected areas (MOF, 1995) 1 . The<br />
Forestry Master Plan (2001/2002 – 2030/31) has also adjusted this target for 10 % in the<br />
long-term (MOF, 2001), while considering 5% for short-term implementation. These short term and<br />
long-term targets are to be achieved by the budget year 2005/2006 and 2017/2017 respectively<br />
(MOF, 2001). Therefore, the present coverage of protected area has already met the short-term<br />
target. However, it is notable that currently the establishment of protected area is concentrated<br />
on conserving forest-based habitats (96%) and there are only a few areas for protecting wetland<br />
(0.8%) and marine habitats (3.2%) (See Table 2). In the meantime, it is found that protected<br />
area as a percentage of total land has been higher in other GMS countries; e.g. 32% in Cambodia<br />
(2002) 2 , 27.5% in Thailand (2004) 3 and 14% in Lao PDR (1999). Therefore, the response in<br />
biodiversity conservation is consistent in term of expanding PAS areas yearly, but the magnitude of<br />
this indicator is low comparing to other GMS countries.<br />
152
Indicator ID<br />
Indicator Name<br />
Greater mekong Subregion<br />
indicator Fact Sheet<br />
dataBaSe inFormation<br />
Year of <strong>Assessment</strong> 2005<br />
Type of Indicator State<br />
Frequently Asked Question (FAQ)<br />
Priority Concern Land Degradation<br />
Geographic Area Union of <strong>Myanmar</strong><br />
153<br />
Vulnerable Farm Area as a Percentage of Total<br />
Cultivated Area - 1998<br />
To what extent is agriculture land vulnerable to<br />
soil erosion?<br />
State & Trend Average with Undetermined Trend<br />
Key Message<br />
From RS/GIS data for 1998, it was found that<br />
10% of total cultivated land throughout the<br />
country is vulnerable to serious soil erosion.<br />
Regions such as Shan, Sagaing and Chin have the<br />
largest extent of vulnerable farming area at 1.6,<br />
1.1 and 0.8 million acres respectively. However,<br />
agriculture land use in Chin, Kayah and Kayin<br />
States is more vulnerable as the percentage of<br />
vulnerable farmland over total cultivated area<br />
is highest among others accounting for 76%,<br />
31% and 24% respectively. Since data are only<br />
available for one year, the trend of the indicator<br />
is undetermined. However, the percentage of<br />
vulnerable farming area is neither high nor low<br />
and that level of land degradation is considered to<br />
be on average.
technical inFormation<br />
A.Definition<br />
This indicator tracks the total extent of vulnerable farming area of sub-administrative areas<br />
of the country, which are known as “State and Division”. (Division is the area where the majority<br />
of people living are dominantly Bamar whereas the area with the various ethnic groups is referred<br />
to as State). It is expressed in acres. Vulnerable farming area is meant for the cultivated land<br />
where susceptibility to soil erosion is higher in decreasing soil productivity. If the farmland being<br />
located at or higher than 1000 feet above sea level with an underlying slope of 10 degree and<br />
above, susceptibility to soil erosion is high and defined as vulnerable farming area. (According to<br />
slope classification, the area with an underlying slope of 10 degree and above is already steeper in<br />
inducing severe soil erosion if the land is open for agriculture and farming – also available data is<br />
limited itself only for two slope classes, 5 degrees and 10 degrees and above.)<br />
B.Data Source<br />
The data utilized for the development of this indicator originate from the Remote Sensing and<br />
Geographical Information System (RS/GIS) Section of Forest Department.<br />
C.Geographic Area / Population Coverage<br />
The data and the indicator are representative of vulnerable farm area for the Union of<br />
<strong>Myanmar</strong> as a whole.<br />
D.Temporal Coverage<br />
Data on vulnerable farm area are only available for 1998.<br />
E.Methodology and Frequency of Coverage<br />
Originally, land use and land cover of the whole country was based on the data of remote<br />
sensing and geographical information system (RS/GIS) that was derived from 30 meters resolution<br />
image of Landsat TM for the year 1998.<br />
Digital Elevation Model (DEM) that was used for defining sloping classes and upland area was<br />
based on the existing model developed by NASA in 90 meters resolution.<br />
F.Methodology of Data Manipulation<br />
By overlaying RS/GIS data, land cover classifications for forest cover and cultivated area were<br />
developed for two sloping classes (5 degrees and 10 degrees and above) versus two altitudinal<br />
levels (below and above 1000 feet). From this development, it excerpted the upland cultivated<br />
area which is located at equal to or higher than 1000 feet above sea level and with a slope of 10<br />
degrees or above.<br />
154
Qualitative inFormation<br />
A.Strength and Weakness (data level)<br />
The indicator is useful in estimating the farmland of various sub-administrative areas<br />
vulnerable to soil erosion; it also provides a picture of the degree of land degradation in these<br />
sub-administrative areas in terms of the percent coverage of vulnerable farmland against total<br />
cultivated land. The main weakness of the data and the indicator is that it does not provide a trend<br />
over time.<br />
B.Reliability, Accuracy, Robustness, Uncertainty (data level)<br />
It is possible that the use of coarse scale DEM is unable to detect some agriculture land<br />
underlying above 10˚ slope if landscape is changed with higher variation within a 90 m interval.<br />
There is the possibility of other types of land use having been included in delineated cultivated<br />
land as the use of RS/GIS data was specifically for classifying forest cover and detecting other land<br />
use and land cover was broadly done.<br />
C.Future Work Required (for data level and indicator level)<br />
Better Remote Sensing Data and Digital Elevation Model should be further applied for<br />
improving data accuracy. Agriculture land use and land cover should be also well defined with<br />
intensive ground truth data. All information should be made available for time series coverage for<br />
better analysis on the trend of vulnerable farming. In addition, other indicators like “Top soil loss”<br />
and Level of Soil Erosion Susceptibility” should be developed for better describing the State of<br />
Land Degradation.<br />
SupportinG data taBleS, GraphS and mapS<br />
Figure 1:vulnerable Farming area as a percentage of total cultivated area - 1998<br />
Thousand acres<br />
9,000<br />
8,000<br />
7,000<br />
6,000<br />
5,000<br />
4,000<br />
3,000<br />
2,000<br />
1,000<br />
-<br />
Kachin<br />
Kayah<br />
Kayin<br />
Chin<br />
Sagaing<br />
Taninthayi<br />
Bago<br />
Magway<br />
State & Division<br />
Vulnerable Farming Area Total Cultivated Land % of Vulnerable Farm Land<br />
155<br />
Mandalay<br />
Mon<br />
Rakhine<br />
Yangon<br />
Shan<br />
Ayeyarwaddy<br />
80%<br />
70%<br />
60%<br />
50%<br />
40%<br />
30%<br />
20%<br />
10%<br />
0%<br />
Percent as of Total<br />
Cultivated Land
table 1:vulnerable Farming area as a percentage of total cultivated area - 1998<br />
no. State & division<br />
area (acres)<br />
cultivated land<br />
underlying with<br />
slope 10 degree<br />
& above<br />
156<br />
total cultivated<br />
land<br />
vulnerable<br />
Farm as % of<br />
total cultivated<br />
area<br />
1 Kachin 178,691 2,347,450 7.6%<br />
2 Kayah 155,063 494,200 31.4%<br />
3 Kayin 311,080 1,284,920 24.2%<br />
4 Chin 824,932 1,087,240 75.9%<br />
5 Sagaing 1,124,869 8,179,010 13.8%<br />
6 Taninthayi 17,610 276,752 6.4%<br />
7 Bago 31,904 4,423,090 0.7%<br />
8 Magway 72,461 5,436,200 1.3%<br />
9 Mandalay 317,084 5,179,216 6.1%<br />
10 Mon 10,824 973,574 1.1%<br />
11 Rakhine 65,992 1,606,150 4.1%<br />
12 Yangon 0.00 1,927,380 0.0%<br />
13 Shan 1,617,559 8,132,061 19.9%<br />
14 Ayeyarwaddy 68,122 6,204,681 1.1%<br />
Union Total 4,796,192 47,551,924 10.1%<br />
Source: Remote Sensing and Geographical Information System Section, FD (2005)
table 1b:total land extent in acres of administrative townships (t/S) with upland area<br />
of 1000 Feet above Sea level<br />
State or<br />
division<br />
area of t/S<br />
with 75 % &<br />
above upland<br />
coverage<br />
area of t/S<br />
with 50 - 74<br />
% upland<br />
coverage<br />
157<br />
area of t/S<br />
with 25 - 49<br />
% upland<br />
coverage<br />
area of<br />
t/S with<br />
less than 25<br />
% upland<br />
coverage<br />
Grand total<br />
(acres)<br />
Ayeyarwady<br />
Division<br />
264,402 2,371,708 2,636,110<br />
Bago Division 1,685,005 5,680,930 7,365,935<br />
Chin State 5,483,988 3,616,867 9,100,855<br />
Kachin State 10,314,138 9,207,604 3,157,747 516,695 23,196,184<br />
Kayah State 2,411,986 486,796 2,898,782<br />
Kayin State 924,425 2,454,674 2,987,803 1,146,968 7,513,870<br />
Magway Division 790,734 1,649,916 2,778,195 5,475,339 10,694,184<br />
Mandalay Division 776,649 1,556,016 3,545,948 3,169,855 9,048,469<br />
Mon State 2,764,032 2,764,032<br />
Rakhine State 878,950 3,776,497 3,561,516 8,216,963<br />
Sagaing Division 3,820,481 4,978,412 6,990,089 5,442,227 21,231,210<br />
Shan State 29,185,995 716,603 1,303,723 31,206,320<br />
Tanintharyi<br />
Division<br />
1,643,746 2,735,684 7,096,513 11,475,943<br />
Yangon Division 375,104 375,104<br />
Grand Total<br />
(acres)<br />
53,708,396 27,189,585 27,921,369 38,904,612 147,723,961<br />
Source: Remote Sensing and Geographical Information System Section, Forest Department 2005
table 1c: number of administrative townships (t/S) with upland area of 1000 Feet<br />
above Sea level<br />
State or<br />
division<br />
Ayeyarwady<br />
Division<br />
area of t/S<br />
with 75 %<br />
& above<br />
upland<br />
coverage<br />
area of t/S<br />
with 50 - 74<br />
% upland<br />
coverage<br />
158<br />
area of t/S<br />
with 25 - 49<br />
% upland<br />
coverage<br />
area of<br />
t/S with<br />
less than 25<br />
% upland<br />
coverage<br />
1 5<br />
Grand total<br />
& percent of<br />
upland t/S<br />
over total<br />
townships<br />
6<br />
(23%)<br />
Bago Division 3 14 17 (61%)<br />
Chin State 7 2 9 (100%)<br />
Kachin State 8 6 3 1 18 (100%)<br />
Kayah State 6 1 7 (100%)<br />
Kayin State 1 2 2 2 7 (100%)<br />
Magway Division 2 3 5 14 24 (96%)<br />
Mandalay Division 2 3 7 11 23 (35%)<br />
Mon State 8 8 (8%)<br />
Rakhine State 1 3 8 12 (57%)<br />
Sagaing Division 4 5 9 8 26 (70%)<br />
Shan State 43 1 1 45 (82%)<br />
Tanintharyi<br />
Division<br />
1 1 8<br />
10<br />
(100%)<br />
Yangon Division 1 1 (25%)<br />
Grand Total 73 25 34 81 213 (66%)<br />
Source: Remote Sensing and Geographical Information System Section, Forest Department (2005)<br />
erosion class<br />
(tolerable)<br />
table 2: changes in area Susceptible to Soil erosion in<br />
chindwin Watershed – 1990 to 2000<br />
erosion rate<br />
(ton/acre/year)<br />
area Susceptible to Soil erosion (km2)<br />
1990 2000<br />
Very low 15 4,799 36,429<br />
Source: Remote Sensing and Geographical Information System Section, Forest Department (2005)
Figure 2: distribution of Shifting cultivation above 10% Slope in myanmar<br />
159
Summary<br />
A.Policy Reference<br />
1.Purpose:<br />
The purpose of this indicator is to better understand the level of vulnerability that agriculture<br />
land use is currently facing in terms of the percentage of total cultivated areas susceptible to<br />
severe soil erosion.<br />
2.Relevance to Environment Planning and Management:<br />
The scenario of potential land degradation by this indicative value could form the basis in<br />
developing a national action plan for conservation priority and investment for combating land<br />
degradation.<br />
3.Linkage to Other Indicators:<br />
This indicator is linked to the indicators such as forest cover, land use and land cover change,<br />
annual soil loss and percentage of land rehabilitation.<br />
4.Targets:<br />
None currently applicable to this indicator.<br />
5.International Environment Treaties:<br />
The UN Convention on Combating Desertification is directly relevant in the context of<br />
conserving degraded land. Currently, three regions (State and Division), namely Dry Zone,<br />
Ayeyarwaddy Delta and Northern Shan State, are selected as priority area for reducing the land<br />
degradation.<br />
B.Analysis<br />
Either partially or wholly, 213 townships accounting for 66% of total administrative townships<br />
in <strong>Myanmar</strong> are sharing the upland area within its administrative boundary. Except in Yangon,<br />
Mandalay, Ayeyarwaddy and Mon, more than half of the total administrative townships appear<br />
as upland townships in all States and Divisions (Table 1c). Among these upland townships,<br />
approximately more than 50% of total territory has belonged to denser upland areas (Table 1b). As<br />
there is a higher proportion of denser upland areas, the degree of risk associated with soil erosion<br />
is relatively high for the country if land use in upland areas of these townships is not properly<br />
developed and managed.<br />
According to RS/GIS data for 1998, total vulnerable farming area, the cultivated area<br />
underlying with a slope of 10 degrees and above in those upland townships, was found to be<br />
4.8 million acres (Table 1a). A larger extent of vulnerable farming area existed in Shan State<br />
(1.6 million acres), Sagaing Division (1.1 million acres) and Chin State (0.8 million acres). They<br />
were followed by Mandalay Division, Kayin State, Kachin State and Kayah State with moderately<br />
extensive area of vulnerable farming at 0.32, 0.31, 0.18 and 0.16 million acres respectively. In<br />
comparing vulnerable farming area with total cultivated area in those States and Division, a higher<br />
percentage of vulnerable farming area were found in Chin State (76%), Kayah State (31%), Kayin<br />
State (24%) and Shan State (20%). As total cultivated area is proportionately large in Sagaing<br />
Division and Mandalay Division, the percentage of total cultivated land under vulnerable farming<br />
had decreased to 14% and 6% respectively in those regions; thought the total extent of vulnerable<br />
farming area was large. As a whole, the data show that 10% of total cultivated land throughout the<br />
country is vulnerable to a higher risk of soil erosion.<br />
160
At present, attention has been paid to Shan and Chin States for implementing soil<br />
conservation but this indicator has elaborated the need for conservation priority as well in Kayah,<br />
Kayin, Kachin and Sagain because of the relatively higher percentage of vulnerable farming area<br />
and its total extent. From the study conducted for “Soil Loss in Chindwin Watershed” where<br />
territory is shared with the administrative areas of Kachin, Sagain and Chin, it was found that the<br />
total area tolerable to severe soil erosion has increased seven fold from 4,799 km2 in 1990 to<br />
36,429 km2 in 2002 because of rapid deterioration in natural vegetation coverage. (Table 2). As all<br />
of these administrative areas within Chindwin Watershed have been associated with a higher extent<br />
and percentage of vulnerable farming area as stated earlier, a causal link between vulnerable<br />
farming coverage and soil erosion has been very marked, indicating serious land degradation. Due<br />
to the deficiency in time series data, the trend of the indicator is not observable (undetermined),<br />
but percentage of vulnerable farming area (10% of total cultivated land) is considered to be neither<br />
small nor high. Even this percentage is likely to be increased if better RS/GIS data is employed in<br />
detecting it. Therefore, state of land degradation in <strong>Myanmar</strong> is to be rated as “average”.<br />
161
Indicator ID<br />
Greater mekong Subregion<br />
indicator Fact Sheet<br />
dataBaSe inFormation<br />
Indicator Name Growth in Upland Population - 1980 to 2000<br />
Year of <strong>Assessment</strong> 2005<br />
Type of Indicator Pressure<br />
Frequently Asked Question (FAQ)<br />
Priority Concern Land Degradation<br />
Geographic Area Union of <strong>Myanmar</strong><br />
Magnitude & Trend Medium and Steady<br />
Key Message<br />
162<br />
How has growth in upland population affected<br />
land degradation?<br />
From 1980 to 2000, the upland population grew<br />
by 6.8 million people. As of 2000, the upland<br />
population reached 21 million people accounting<br />
for 42% of the total national population. There<br />
was only a slight increase in population growth<br />
rate between 1980 to 1990 and 1990 to 2000.<br />
Hence the stress on land degradation by the<br />
upland population has risen because of existing<br />
population size and its growth, but the degree<br />
of pressure is still medium and steady since no<br />
significant rise of population was observed.
technical inFormation<br />
A.Definition<br />
This indicator attempts to track the rate of change in the population of townships within states<br />
that are either partially or fully occupied by upland areas.<br />
Upland area is further defined as the area where topographically altitudes are equal or higher<br />
than 1000 feet above sea level. It is also assumed that the majority of the populations residing<br />
in the upland areas are engaged in livelihoods that rely upon agriculture, fuel wood or such land<br />
related activities.<br />
B.Data Source<br />
This indicator was developed based on population data from the Department of Population<br />
and geomorphologic data from the Remote Sensing and Geographical Information System Section<br />
of the Forest Department.<br />
C.Geographic Area / Population Coverage<br />
This indicator is based on an approximation of the upland population is <strong>Myanmar</strong> using the<br />
township fabric to approximate populations that are considered as upland. The result therefore is<br />
an approximation of the upland population for the Union of <strong>Myanmar</strong> as a whole.<br />
D.Temporal Coverage<br />
The data and the indicator as based on 10-year population estimates starting in 1980 and<br />
ending in year 2000.<br />
E.Methodology and Frequency of Coverage<br />
The 10-year population estimates provided by the Department of Population are based on the<br />
1983 population census. The Digital Elevation Model (DEM) utilized to identify upland townships is<br />
a one-time elevation model developed by the US <strong>National</strong> Atmosphere and Satellite Agency (NASA).<br />
F.Methodology of Data Manipulation<br />
An administrative boundary map was overlaid on a three-dimensional geomorphologic map<br />
of the country by using Remote Sensing and Geographical Information System tools in order to<br />
define the upland area. Upland area as a percentage of total township area was then calculated for<br />
all upland townships. This upland percentage of each township was further used as a multiplier in<br />
estimating upland population based on the total population within the administrative boundary of<br />
each township. The net change in upland population was also calculated for two studied periods,<br />
the years 1980 to 1990 and the years 1990 to 2000. For each period, the percentage change in<br />
population was calculated based on the population in the initial year of the studied period.<br />
163
population growth rate<br />
35.0%<br />
30.0%<br />
25.0%<br />
20.0%<br />
15.0%<br />
10.0%<br />
5.0%<br />
0.0%<br />
Kachin<br />
Kayah State<br />
Qualitative inFormation<br />
A.Strength and Weakness (data level)<br />
The indicator gives the general trend of population growth in upland townships which have<br />
influence on the condition of the land resource by their expansion and exploitation for livelihood<br />
subsistence. However, the estimation of the upland population is derived from the percentage of<br />
upland area within the administrative boundary of the respective townships and there might be<br />
variations in the actual population. On the other hand, not necessarily all the people living in an<br />
upland area may cause degradation of nearby land resources.<br />
B.Reliability, Accuracy, Robustness, Uncertainty (data level)<br />
The population estimates are based on a population census conducted 20 years ago;<br />
demographic trends may therefore be assumed.<br />
C.Future Work Required (for data level and indicator level)<br />
An effort should be made to provide population figures closer to the real situation. If<br />
possible, population data should be provided for the village tract level in order to stress the upland<br />
population data coinciding with RS/GIS’s map development, in scaling down the administrative<br />
area up to village tract level based on all available spatial data.<br />
SupportinG data taBleS, GraphS and mapS<br />
Figure 1: Growth in upland population – 1980-2000<br />
Kayin State<br />
Chin State<br />
Sagaing Division<br />
Taninthayi Division<br />
164<br />
Bago Division<br />
population grow ht rate for 1980 to 1990 population grow ht rate for 1990 to 2000<br />
Magway Division<br />
Mandalay Division<br />
Mon State<br />
Rakhin State<br />
Shan State<br />
Ayeyarwaddy
table 1: upland population Growth rate versus vulnerable Farming area<br />
no. State & division<br />
population Growth rate vulnerable farm<br />
area as % of<br />
1980-1990 1990-2000 total cultivated<br />
land<br />
1 Kachin State 12.60% 13.56% 7.61%<br />
2 Kayah State 32.67% 32.56% 31.38%<br />
3 Kayin State 5.96% 6.35% 24.21%<br />
4 Chin State 13.49% 14.92% 75.87%<br />
5 Sagaing Division 3.39% 4.37% 13.75%<br />
6 Taninthayi Division 4.73% 4.96% 6.36%<br />
7 Bago Division 1.50% 1.56% 0.72%<br />
8 Magway Division 3.41% 3.64% 1.33%<br />
9 Mandalay Division 5.89% 5.46% 6.12%<br />
10 Mon State 0.37% 0.38% 1.11%<br />
11 Rakhin State 0.76% 0.83% 4.11%<br />
12 Yangon Division - - -<br />
13 Shan State 26.30% 21.41% 19.89%<br />
14 Ayeyarwaddy 0.44% 0.48% 1.10%<br />
Source: Adapted from Department of Population’s data by RS/GIS Section, Forest Department 2004<br />
165
State &<br />
division<br />
table 2: upland population and Growth rate 1980-2000<br />
population<br />
1980<br />
population<br />
1990<br />
population<br />
2000<br />
166<br />
population<br />
change<br />
1980-1990<br />
population<br />
change<br />
1990-2000<br />
change<br />
rate<br />
1980-<br />
1990<br />
change<br />
rate<br />
1990-<br />
2000<br />
Kachin 861,013 1,054,686 1,310,248 108,449 143,002 12.60% 13.56%<br />
Kayah State 153,997 206,499 276,686 50,314 67,242 32.67% 32.56%<br />
Kayin State 1,004,020 1,224,254 1,511,865 59,869 77,724 5.96% 6.35%<br />
Chin State 358,057 411,775 479,988 48,287 61,437 13.49% 14.92%<br />
Sagaing<br />
Division<br />
3,658,005 4,350,468 5,418,064 123,898 190,246<br />
3.39%<br />
4.37%<br />
Taninthayi<br />
Division<br />
863,006 1,088,562 1,388,086 40,838 53,942<br />
4.73%<br />
4.96%<br />
Bago<br />
Division<br />
3,636,015 4,309,742 5,146,514 54,433 67,376<br />
1.50%<br />
1.56%<br />
Magway<br />
Division<br />
3,080,004 3,770,933 4,674,609 104,910 137,374<br />
3.41%<br />
3.64%<br />
Mandalay<br />
Division<br />
8,197 10,467 12,906 483 571<br />
5.89%<br />
5.46%<br />
Mon State 7,347 9,289 11,853 27 36 0.37% 0.38%<br />
Rakhin State 4,794 5,696 6,879 36 47 0.76% 0.83%<br />
Yangon<br />
Division<br />
785,134 971,148 942,727 - -<br />
0.00%<br />
0.00%<br />
Shan State 2,305 2,747 3,326 606 588 26.30% 21.41%<br />
Ayeyarwaddy 7,984 9,539 11,577 35 46 0.44% 0.48%<br />
Union 14,429,878 17,425,805 21,195,328 592,185 799,631 4.10% 4.59%<br />
Source: Modified from Department of Population’s data by RS/GIS Section, Forest Department (2004)
Summary<br />
A.Policy Reference<br />
1.Purpose:<br />
The purpose of the indicator is to better understand the current pressure of population in<br />
upland areas which has a strong influence on the expansion of agriculture land. Unsustainable<br />
methods of land use such as slash and burn farming are used in upland areas where the degree<br />
of land degradation may be higher in comparison to lowland areas.<br />
2.Relevance to Environment Planning and Management:<br />
The indicator is directly relevant to local agriculture planning as well as to integrated<br />
watershed management in securing sustainable local food security.<br />
3.Linkage to Other<br />
The indicator links to indicators like “Vulnerable farming area” and “Forest cover” as a<br />
pressure on forest resource of upland area, “Per capita land available per person” and “Area of<br />
shifting cultivation”.<br />
B.Analysis<br />
As of 2000, the upland population nationwide was 21 million accounting for almost 42% of<br />
the total population. There was increase of 3.7 and 6.7 million people in comparison to 1990 and<br />
1980, respectively. It represented change rates of 4.1% for the former period of 1980 to 1990 and<br />
of 4.6% for the latter period of 1990 to 2000. There is only a slight increase of population change<br />
rate during these two periods. (see Table 2).<br />
In calculation of the population change rate for sub-administrative areas, it was found that the<br />
areas where vulnerable farming areas are proportionately higher, had a higher population growth<br />
rate. For example, there were population change rates of around 3% per annum in Kayah State,<br />
2.1% per annum in Shan State, 1.4 % per annum in Chin State and 1.3% per annum in Kachin<br />
Sate. As the national average is 2% per annum for the whole population, the population change<br />
rates these upland areas is considered to be relatively high. Except in Shan State, the general trend<br />
of these population change rates had been slightly increasing between the two periods of from<br />
1980 to 1990 and from 1990 to 2000.<br />
Population increases in those upland areas might be leading to over exploitation of natural<br />
resource. Unsustainable methods of agriculture practiced in steeper upland areas by local people<br />
for their subsistent livelihood may cause land degradation. Nevertheless, the population change<br />
rate in upland area was on average as a whole, though there were some cases of higher increase in<br />
some regions; the level of stress is generally considered as “Medium” and “Steady”.<br />
167
Indicator ID<br />
Indicator Name<br />
Greater mekong Subregion<br />
indicator Fact Sheet<br />
dataBaSe inFormation<br />
Year of <strong>Assessment</strong> 2005<br />
Type of Indicator Response<br />
Frequently Asked Question (FAQ)<br />
Priority Concern Land Degradation<br />
Geographic Area Union of <strong>Myanmar</strong><br />
Impact & Trend Low and Intermittent<br />
Key Message<br />
168<br />
Land Rehabilitated as a Percent age of Area Sown<br />
to Crops - 1974 to 2002<br />
What has been the impact of land rehabilitation<br />
programs?<br />
Approximately 3 million acres of agriculture land<br />
were covered by annual conservation activity of<br />
Ministry of Agriculture and Irrigation. Despite<br />
the fact that the area of rehabilitated agriculture<br />
land increased from 1974 to 2002, the trend is<br />
descending when compared to total crop sown<br />
area, of which annual growth has outpaced<br />
that of land rehabilitation. As only 10% of<br />
total crop sown area is annually rehabilitated<br />
on average, the response in combating land<br />
degradation is low but the magnitude of the effort<br />
is considered “intermittent” due to increasing<br />
conservation programs and initiatives underway<br />
for implementation in recent years by various<br />
agencies.
technical inFormation<br />
A.Definition<br />
This indicator tracks the success achieved in implementing land rehabilitation programs by<br />
measuring the percentage of agriculture land brought under the various conservation measures<br />
as a percentage of total crop sown area throughout the country. Crop sown area is defined as the<br />
total cumulative area brought under cultivation from all the crops that are cultivated on a particular<br />
farm. Conservation measures include the following activities.<br />
Contour bund is a cross sectional physical barrier along the contour line of the sloping<br />
agriculture land in order to slow down the water run off from the above during the rain. Either<br />
earthen soil or rock or other concrete materials might be used for constructing contour bunds.<br />
Terrace is leveling of sloping area of cultivated land for farming with lesser degree of soil<br />
erosion.<br />
Wind break is planting tree or shrub or perennial vegetation closer to farming area. Planting<br />
tree around the boundary of cultivated land is also included.<br />
SALT is meant for sloping agriculture land technology and it is growing the mixture of<br />
perennial vegetation and annual crop along the contour of steeper sloping agriculture land.<br />
E.M/Organic Farming is growing annual crops or vegetables by utilizing compost or green<br />
manure or Effective Micro-organisms, which are media added to organic fertilizer to produce<br />
healthy plant growth without affecting the physical and chemical properties of the soil in the longterm.<br />
Flood protection is constructing dyke or making embankment in order to prevent the farming<br />
areas from seasonal flooding, water inundating and saline water intrusion by the regular tides.<br />
B.Data Source<br />
Data from the Department of Agriculture Planning are a major source for developing this<br />
indicator.<br />
C.Geographic Area / Population Coverage<br />
Data cover for the conservation areas undertaken by the Ministry of Agriculture and Irrigation<br />
throughout the whole country.<br />
D.Temporal Coverage<br />
The temporal coverage of this indicator is from 1975 to 2002.<br />
E.Methodology and Frequency of Coverage<br />
Annually implemented areas under the various conservation activities of Ministry of<br />
Agriculture and Irrigation were counted as total rehabilitated areas of agriculture land for<br />
respective years. Data were only given for representative years of 1974 and 1984 in the earlier<br />
temporal coverage before it was consecutively compiled for 14 years from 1989 to 2002.<br />
F.Methodology of Data Manipulation<br />
Total rehabilitated area is a sum of all areas under different conservation activities. Percentage<br />
of rehabilitated area is calculated based on total crop sown acres throughout the country.<br />
169
Qualitative inFormation<br />
A.Strength and Weakness (data level)<br />
This indicator provides time series data of implementation status and coverage in combating<br />
land degradation by different soil conservation activity, particularly rehabilitating the agriculture<br />
area for better land quality. However, this is only for rehabilitation activities of the agencies<br />
related to agriculture development and conservation areas under other agencies and nongovernmental<br />
organization are not included. Again, this only indicates the implemented area under<br />
land rehabilitation or soil conservation and is not necessarily meant to indicate the quality of<br />
rehabilitation and success in restoring the ecology or land quality.<br />
B.Reliability, Accuracy, Robustness, Uncertainty (data level)<br />
As data were based on the accomplishment of physical implementation, the reliability of the<br />
indicator is seemingly high.<br />
C.Future Work Required (for data level and indicator level)<br />
Data related to conservation by other agencies should be collected and integrated into this<br />
indicator. If possible, successfully rehabilitated areas should be enumerated as well and compared<br />
with annual vulnerable farming areas in order to determine the recovery of total degraded land.<br />
Thousand acres<br />
SupportinG data taBleS, GraphS and mapS<br />
Figure 1: rehabilitated area as a percentage of total area Sown to crops<br />
45,000<br />
40,000<br />
35,000<br />
30,000<br />
25,000<br />
20,000<br />
15,000<br />
10,000<br />
5,000<br />
-<br />
1974-75<br />
1984-85<br />
1989-90<br />
1990-91<br />
1991-92<br />
1992-93<br />
1993-94<br />
1994-95<br />
170<br />
1995-96<br />
Total Rehabilitated Acre Total Crop Sow n Area % of Rehabilitated Area<br />
1996-97<br />
1997-98<br />
1998-99<br />
1999-00<br />
2000-01<br />
2001-02<br />
2002-03<br />
14.00<br />
12.00<br />
10.00<br />
8.00<br />
6.00<br />
4.00<br />
2.00<br />
0.00<br />
Percent of total sown acre
table 1: rehabilitated area as a percentage of total area Sown to crops<br />
years<br />
total agriculture<br />
land rehabilitated<br />
(thousand acres)<br />
171<br />
total crop Sown<br />
area (thousand<br />
acres)<br />
rehabilitated<br />
agriculture land<br />
as % of total crop<br />
Sown area<br />
1974-75 2,893 23,474 12.32<br />
1984-85 2,852 25,984 10.98<br />
1989-90 3,085 24,344 12.67<br />
1990-91 3,113 25,024 12.44<br />
1991-92 3,132 25,426 12.32<br />
1992-93 3,132 27,200 11.51<br />
1993-94 3,150 28,134 11.20<br />
1994-95 3,130 30,005 10.43<br />
1995-96 3,126 31,837 9.82<br />
1996-97 3,123 30,422 10.26<br />
1997-98 3,260 30,336 10.34<br />
1998-99 3,173 32,882 9.49<br />
1999-00 3,185 36,582 8.55<br />
2000-01 3,331 38,178 8.34<br />
2001-02 3,797 39,153 8.12<br />
2002-03 3,405 39,896 7.99<br />
Source: Department of Agriculture Planning , 2005<br />
years<br />
table 2:total area under various conservation activities (thousand acres)<br />
contour<br />
Bund<br />
terrace<br />
Wind<br />
Break<br />
Salt<br />
e.m/<br />
organic<br />
Farming<br />
Flood<br />
protection<br />
total<br />
conservation<br />
area<br />
1974-75 0.00 16.00 0.00 0.00 0.00 2,877 2,893<br />
1984-85 0.00 33.00 0.00 0.00 0.00 2,819 2,852<br />
1989-90 0.00 67.00 0.00 0.00 0.00 3,018 3,085<br />
1990-91 0.00 70.00 0.00 0.00 0.00 3,043 3,113<br />
1991-92 0.00 60.00 0.00 0.00 0.00 3,072 3,132<br />
1992-93 0.00 64.00 0.00 0.00 0.00 3,068 3,132<br />
1993-94 0.00 65.00 1.00 0.01 0.00 3,084 3,150<br />
1994-95 0.06 65.00 1.11 0.02 0.00 3,064 3,130<br />
1995-96 0.04 66.04 1.51 0.04 0.00 3,058 3,126<br />
1996-97 0.07 66.04 0.45 0.06 0.00 3,056 3,123<br />
1997-98 15.06 68.05 1.83 0.08 123.41 3,052 3,260<br />
1998-99 0.07 71.10 1.60 0.09 53.46 3,047 3,173<br />
1999-00 3.05 75.13 1.78 0.10 56.44 3,049 3,185<br />
2000-01 23.04 77.02 1.65 0.09 145.60 3,084 3,331<br />
2001-02 7.05 81.08 1.15 0.12 619.05 3,089 3,797<br />
2002-03 10.02 85.07 0.70 0.13 217.03 3,092 3,405<br />
Note: SALT is for Sloping Agriculture Land Technology and E.M is for Effective Micro-organism<br />
Source: Department of Agriculture Planning 2005
Summary<br />
A.Policy Reference<br />
1.Purpose:<br />
The purpose of the indicator is to examine the present level of performance in combating land<br />
degradation and to focus on its limitation in addressing the issue.<br />
2.Relevance to Environment Planning and Management:<br />
The indicator is relevant to land use planning and effective land resource management<br />
including the integrated management of critical watershed.<br />
3.Linkage to Other Indicators:<br />
The indicator may link to other indicators such as Vulnerable farming area, Upland Population,<br />
Habitat loss and Expenditure on Natural Resource Management.<br />
4.Targets:<br />
Three priority areas, namely, Shan Plateau, Dry Zone and Ayeyarwaddy Mangrove area, are<br />
currently selected for conservation investment in combating land degradation (UNCCD related<br />
national action plan). According to the Highland Farmland Reclamation Plan (2003 – 2007) under<br />
the Ministry of Agriculture and Irrigation, the target is set to reclaim 111,900 acres of permanent<br />
sloping agriculture land for rehabilitating 223,816 acres of slash and burn area within the period<br />
from 2003 to 2007 in Eastern and Northern Shan State and Chin State (“Magnificent <strong>Myanmar</strong><br />
1988-2003”, Ministry of Information, Yangon, 2004, pp:68).<br />
5.International Environment Treaties:<br />
The United Nations Convention on Combating Desertification (UNCCD) is relevant to this<br />
indicator.<br />
B.Analysis<br />
In addressing the issues of soil erosion and decline of soil fertility as far as land degradation<br />
is concerned for agriculture land, land rehabilitation activities undertaken by Ministry of Agriculture<br />
and Irrigation are promotion of terracing, contour bund making, introducing SALT, extension on<br />
the use of Organic Fertilizer and prevention of farmland from seasonal flooding and saline water<br />
intrusion. As shown in Figure 1 and Table 1, the total area implemented by these conservation<br />
activities has been gradually increasing over time. In 2003, the total area of land rehabilitated<br />
was 3.4 million acres. In comparison to 1989, it was a slight increase of 0.3 million acres and<br />
roughly accounted for 10%. In fact, spatial coverage of land rehabilitation was extensive mainly<br />
due to larger effective farming area under flood protection measures of multipurpose irrigation<br />
development scheme and if excluded, the annual conservation area for soil erosion control and<br />
soil fertility improvement became merely around 0.1 to 0.3 million acres per annum during the<br />
recent years from 1997 to 2002, except for 2001. Implementation of these activities in 2002 was<br />
relatively higher and covered an area of approximately 0.7 million acres because of increased<br />
coverage of the organic farming area. (see Table 2).<br />
In order to understand the present coverage of annual conservation area over all the required<br />
agriculture land, the area under various soil conservation activities was compared with the total<br />
crop sown area of the whole country for calculating the percentage of land rehabilitation. Despite<br />
it not being ideal to use total crop sown area for calculating land rehabilitation coverage, it is<br />
justifiable in terms of the need of all cultivated land in improving soil fertility for sustaining crop<br />
productivity. As seen in Figure 1, the percentage of land rehabilitated over crop-sown area has<br />
been oscillating around ten and declining gradually since 1989, although there is an increase in<br />
the total conservation area annually. This low figure shows that the progress presently made by<br />
land rehabilitation is lower than annual growth of agriculture expansion. If agriculture expansion<br />
is taking place in the area where susceptibility to soil erosion or land degradation is higher, there<br />
might be a situation where the increase in vulnerable farmland exceeds the capacity to take action<br />
annually to conserve soil and the fertility of agriculture land. However, there is more attentions<br />
and initiatives by different Ministries on conservation and this indicator is thus rated as ‘Low and<br />
Intermittent”.<br />
172
Indicator ID<br />
Indicator Name<br />
Greater Mekong Subregion<br />
Indicator Fact Sheet<br />
DATABASE INFORMATION<br />
Year of <strong>Assessment</strong> 2005<br />
Type of Indicator State<br />
Frequently Asked Question (FAQ)<br />
Priority Concern Water Resources<br />
Geographic Area Union of <strong>Myanmar</strong><br />
173<br />
Percentage Population with Access to Safe<br />
Drinking Water - 1995 to 2003<br />
What percentage of the population of <strong>Myanmar</strong><br />
has access to safe drinking water?<br />
State & Trend On Average and Improving<br />
Key Message<br />
The percentage of the population with access to<br />
safe drinking water supply has increased from<br />
59.7% to 80% within the 8-year period from 1995<br />
to 2003. By the year 2003, a higher percentage<br />
is found in urban areas (92.1%) than in rural area<br />
(74.4%). According to the available data for the<br />
year 2000, the percentage of the population with<br />
access to safe water supply in GMS countries<br />
ranged from 30% to 80%,in which <strong>Myanmar</strong> was<br />
reported as 71%. The “State” of the drinking<br />
water resource in <strong>Myanmar</strong> is thus on average<br />
with an improving trend.
TECHNICAL INFORMATION<br />
A. Definition<br />
This indicator is to track the people’s access to water supply by measuring the percentage of<br />
the population covered by safe drinking water supply system throughout the country.<br />
B. Data Source<br />
The data for development of this indicator are based on Multiple Indicator Cluster Surveys<br />
(MICS) that were the series of assessment conducted by the Ministry of Health in collaboration<br />
with UNICEF and WHO.<br />
C. Geographic Area / Population Coverage<br />
The data and the indicator are representative of access to safe drinking water for the<br />
population of the Union of <strong>Myanmar</strong> as a whole.<br />
D. Temporal Coverage<br />
The temporal coverage of the indicator is from 1995 to 2003.<br />
E. Methodology and Frequency of Coverage<br />
The Ministry of Health conducts periodical nationwide assessments of water supply and<br />
sanitation. To 2003, four assessments have been carried out in 1995, 1997, 2000 and 2003. The<br />
percentage of the population with access to safe drinking water is calculated from the number of<br />
household residents connected to various supply sources which are considered safe for drinking<br />
water<br />
purposes.<br />
F. Methodology of Data Manipulation<br />
The figures are quoted directly as published by the quoted source and have not been<br />
manipulated in any way for the purpose of this indicator development.<br />
QUALITATIVE INFORMATION<br />
A. Strength and Weakness (data level)<br />
The indicator is indicative of the general coverage of existing water supply systems in terms of<br />
numbers of people with access to those supplied sources which are considered to be safe for<br />
drinking. However, it does not provide information about how the water supplied by these sources is<br />
made safer and meets the drinking water quality standard.<br />
B. Reliability, Accuracy, Robustness, Uncertainty (data level)<br />
Reliability of the data is depending on the soundness of methodology applied by the<br />
nation-wide assessment which is presently unknown in detail during EPA.<br />
C. Future Work Required (for data level and indicator level)<br />
It is expected that Multiple Indicator Cluster Survey will continue in the future for providing<br />
vital health statistics including safe water supply and sanitation coverage. The indicator and the<br />
fact sheet should therefore be updated once new and more recent information becomes available<br />
from the Ministry of Health.<br />
174
Region<br />
SUPPORTING DATA TABLES, GRAPHS AND MAPS<br />
Figure 1: Percentage of Household Residents with Access to<br />
“Safe and Convenient” Drinking Water Supply – 1995-2003<br />
Table 1: Percentage of Household Residents with Access to<br />
“Safe and Convenient” Drinking Water Supply – 1995-2003<br />
175<br />
Percentage<br />
1995 1997 2000 2003<br />
<strong>National</strong> 59.7 66.0 71.5 78.8<br />
Urban 78.1 87.9 89.2 92.1<br />
Rural 49.6 59.9 65.8 74.4<br />
Source: Multiple Indicator Cluster Survey, Ministry of Health, 2003
Different sources of water supply<br />
Figure 2: Percentage of Household Residents by<br />
Source of Water Supply – 1995-2003<br />
Table 2: Percentage of Household Residents by<br />
Source of Water Supply – 1995-2003<br />
176<br />
Percentage as of Total Population<br />
1995 1997 2000 2003<br />
Piped water to household 9.3 4.8 6.7 15.4<br />
Public standpipe/tap 8.8 6.9 6.6 7.3<br />
Tube well 15.6 22.6 23.9 22.4<br />
Protected dug well/pond/rain/bottle water 29.7 37.1 33.7 33.7<br />
Unprotected well/ pond/ stream/ river 36.6 29.6 29.1 21.2<br />
Source: Multiple Indicator Cluster Survey, Ministry of Health, 2003
SUMMARY<br />
A. Policy Reference<br />
1. Purpose:<br />
This indicator aims to understand the extent to which existing water resources are made<br />
available for safer drinking use and human consumption.<br />
2. Relevance to Environment Planning and Management:<br />
This is relevant to national health planning for better coverage of safer water supply in<br />
reducing the risk of water borne diseases. It is also useful for increasing the efficiency of<br />
integrated water resource management for sustainable use of existing water resources.<br />
3. Linkage to Other Indicators:<br />
This indicator is linked to indicators such as Investment in Water Supply and Percentage<br />
Change in Population.<br />
4. Targets:<br />
The national health policy sets target on fuller access for all citizens to safe drinking water<br />
and it is expected to achieve by implementing the national action plan during the period from<br />
2000/2001 to 2009/2010.<br />
Under the Millennium Development Goals, to which <strong>Myanmar</strong> is party, the target is to halve, by<br />
2010, the percentage of the population without access to safe potable water.<br />
5. International Environment Treaties:<br />
The Millennium Development Goals are directly relevant in guiding the national policy to<br />
improve fuller access of the whole population to safe drinking water.<br />
B. Analysis<br />
As observed in Figure 1, the population access to safe drinking water is improving over time.<br />
Within the eight years study period, from 1995 to 2003, coverage of safer water supply increased<br />
by 20% nationally to achieve 80% access of the population to safe drinking water by 2003.<br />
Improvement had been taking place both in rural and urban areas during this period. Access to<br />
safe drinking water in rural areas was merely 50% in 1995 but it had increased to 74.4% in 2003.<br />
Likewise, total coverage of safe drinking water supply system in urban areas had increased to<br />
92.1% in 2003 from 78.1% in 1995. (see Table 1).<br />
Table 2 shows the percentage change in the use of different sources that supply safe drinking<br />
water. Among them, the use of protected open dug wells and ponds are proportionately highest<br />
followed by the use of tube wells. Notably piped water supply connections to households have also<br />
increased over time and 15.4% of the total population had access to this source by 2003. The<br />
population with water supplied by public stand pipe had slightly decreased from 8.8% to 7.3%<br />
during that period. The policy target set for safe drinking water is to have fuller access of all people<br />
by year 2010.<br />
As the present level of safe water supply coverage is already 80% with progressive increases,<br />
it is considered that the state of water supply for drinking purpose is an improving trend and on<br />
average as compared to other GMS countries. (As of 2000, <strong>Myanmar</strong> (71.5%), Cambodia (30%),<br />
(58%), Thailand (80%), Viet Nam (56%) and Yunnan PRC (75%), according to “Asian Development<br />
Bank (2004), “Greater Mekong Region – Atlas of the Environment”, Manila, pp:193”.<br />
177
Indicator ID<br />
Greater Mekong Subregion<br />
Indicator Fact Sheet<br />
DATABASE INFORMATION<br />
Indicator Name Population Growth - 1985 to 2015<br />
Year of <strong>Assessment</strong> 2005<br />
Type of Indicator Pressure<br />
Frequently Asked Question (FAQ)<br />
Priority Concern Water Resources<br />
Geographic Area Union of <strong>Myanmar</strong><br />
Magnitude & Trend High and Increasing<br />
Key Message<br />
178<br />
How has population growth affected the<br />
proportion of the population with access to safe<br />
drinking water?<br />
There will be a population of 62 millions by the<br />
year 2015 and improving access to safe drinking<br />
water supply will be required for another 20<br />
million people than the safe water supply coverage<br />
in 2003. There is a need to improve water supply<br />
yearly for 4 million people and it is far above what<br />
was annually achieved in the past to improve<br />
access of 2.5 million peoples to safe water supply.<br />
Therefore, population pressure has been<br />
increasing in imposing higher stress on supplying<br />
safe drinking water to all.
TECHNICAL INFORMATION<br />
A. Definition<br />
This indicator tracks the increase in total population, both rural and urban areas for the period<br />
from 1985 to 2015. It is expressed in thousands of persons per year.<br />
B. Data Source<br />
The Statistical Yearbooks of Central Statistical Organization for the years 1992, 1997 and<br />
2003 are the main sources of the data employed in the development of this indicator.<br />
C. Geographic Area / Population Coverage<br />
The data and the indicator are representative of both rural and urban population growth for<br />
the Union of <strong>Myanmar</strong> as a whole.<br />
D. Temporal Coverage<br />
The temporal coverage of this indicator is for the budget years from 1985 to 2015.<br />
E. Methodology and Frequency of Coverage<br />
The total population of different administrative area of States and Divisions are given in<br />
referenced statistical yearbooks for 1985 to 2002 consecutively. The rural and urban populations<br />
for those State and Division were only given for 1983 census year.<br />
F. Methodology of Data Manipulation<br />
Ratios of rural and urban population to total population were calculated for all States and Divisions<br />
based on 1983 census data. Applying these ratios, rural and urban populations of States and<br />
Divisions were further calculated based on State and Division. Total Population figures were given<br />
for 1985 to 2002. Linear projections were applied to estimate the population from 2003 to 2015.<br />
QUALITATIVE INFORMATION<br />
A. Strength and Weakness (data level)<br />
There is an advantage in estimating the total population of rural and urban areas up to the<br />
year 2015. However, this is based on the assumption that similar population growth rural and<br />
urban population ratios are applicable for all the years, although they are variable annually<br />
B. Reliability, Accuracy, Robustness, Uncertainty (data level)<br />
As the latest population census for the whole country was in 1983, the population given in<br />
referenced statistical year books might show greater variation than the actual population. Thus,<br />
data employed in this indicator were uncertain in capturing the real situation.<br />
C. Future Work Required (for data level and indicator level)<br />
Am attempt should be made to collect population data closer to the actual situation. Alternatively,<br />
the population data collected by the Government Affairs Department and local administrative<br />
bodies should be inter-exchangeable with those data from the Department of Population to<br />
compare the results and capture the more accurate trend.<br />
Apart from this indicator, other indicators like per capita water consumption should be<br />
developed for understanding the pressure on drinking water resources.<br />
179
Year<br />
SUPPORTING DATA TABLES, GRAPHS AND MAPS<br />
Figure 1: Current and Projected Rural and Urban Population – 1985-2015<br />
Table 1: Current and Projected Rural and Urban Population – 1985-2015<br />
Urban Population<br />
(1000’s)<br />
180<br />
Rural Population<br />
(1000’s)<br />
Total<br />
(1000’s)<br />
1985 9,140 27,933 37,073<br />
1986 9,324 28,476 37,800<br />
1987 9,512 29,029 38,541<br />
1988 9,703 29,594 39,297<br />
1989 9,891 30,143 40,034<br />
1990 10,083 30,703 40,786<br />
1991 10,278 31,274 41,552<br />
1992 10,477 31,856 42,333<br />
1993 10,681 32,435 43,116<br />
1994 10,880 33,042 43,922<br />
1995 11,083 33,661 44,744<br />
1996 11,283 34,282 45,565<br />
1997 11,487 34,915 46,402<br />
1998 11,953 36,207 48,160<br />
1999 12,201 36,932 49,133<br />
2000 12,479 37,646 50,125<br />
2001 12,738 38,400 51,138<br />
2002 13,002 39,169 52,171<br />
2003 13,040 39,347 52,387<br />
2004 13,265 40,005 53,270
2005 13,491 40,663 54,154<br />
2006 13,716 41,321 55,037<br />
2007 13,941 41,980 55,921<br />
2008 14,167 42,638 56,804<br />
2009 14,392 43,296 57,688<br />
2010 14,617 43,954 58,571<br />
2011 14,842 44,612 59,455<br />
2012 15,068 45,270 60,338<br />
2013 15,293 45,928 61,221<br />
2014 15,518 46,587 62,105<br />
2015 15,744 47,245 62,988<br />
Source: Statistical Yearbooks, CSO 1992, 1997 & 2003<br />
State and<br />
Division<br />
Table 2a: Estimated Rural Population (000’s) by<br />
State and Division – 1995-2002<br />
1995 1996 1997 1998 1999 2000 2001 2002<br />
181<br />
Rural<br />
Population<br />
Ratio<br />
Kachin 901 918 936 977 998 1,019 1,041 1,063 0.779<br />
Kayah 173 177 181 192 198 204 210 216 0.738<br />
Kayin 1,125 1,148 1,170 1,210 1,235 1,261 1,287 1,314 0.834<br />
Chin 379 385 391 398 404 410 416 423 0.854<br />
Sagaing 4,294 4,377 4,462 4,641 4,740 4,667 4,768 4,871 0.861<br />
Tanintharyi 927 948 969 1,011 1,036 1,060 1,085 1,111 0.764<br />
Bago 3,774 3,839 3,904 4,004 4,074 4,144 4,216 4,290 0.805<br />
Magway 3,515 3,580 3,647 3,802 3,882 3,964 4,047 4,132 0.848<br />
Mandalay 4,368 4,457 4,547 4,734 4,839 5,096 5,209 5,324 0.735<br />
Mon 1,604 1,641 1,679 1,746 1,788 1,831 1,874 1,920 0.718<br />
Rakhine 2,149 2,186 2,222 2,309 2,351 2,394 2,438 2,482 0.851<br />
Yangon 1,629 1,655 1,682 1,765 1,804 1,843 1,883 1,924 0.318<br />
Shan 3,531 3,587 3,643 3,740 3,800 3,860 3,921 3,983 0.787<br />
Ayeyarwady 5,292 5,385 5,480 5,678 5,785 5,893 6,004 6,117 0.851<br />
Union Total 33,661 34,282 34,915 36,207 36,932 37,646 38,400 39,169 0.752<br />
Note: Rural population ratio is based on 1983 census.<br />
Source: Statistical Yearbooks, CSO 1992, 1997 & 2003
State and<br />
Division<br />
Table 2b: Estimated Urban Population (000’s) by<br />
State and Division 1995-2002<br />
1995 1996 1997 1998 1999 2000 2001 2002<br />
182<br />
Urban<br />
Population<br />
Ratio<br />
Kachin 256 261 266 277 283 289 295 301 0.221<br />
Kayah 61 63 65 69 71 73 75 77 0.263<br />
Kayin 224 228 233 241 246 251 256 261 0.166<br />
Chin 65 66 67 68 69 70 71 72 0.146<br />
Sagaing 691 704 718 746 763 751 767 784 0.139<br />
Tanintharyi 287 293 300 313 320 328 336 344 0.236<br />
Bago 913 928 944 968 985 1,002 1,020 1,037 0.195<br />
Magway 630 642 654 682 696 711 726 741 0.152<br />
Mandalay 1,576 1,608 1,641 1,708 1,746 1,839 1,880 1,922 0.265<br />
Mon 629 643 658 684 700 717 735 752 0.282<br />
Rakhine 375 381 388 403 410 418 425 433 0.149<br />
Yangon 3,497 3,555 3,613 3,791 3,873 3,958 4,044 4,132 0.682<br />
Shan 955 970 986 1,012 1,028 1,044 1,061 1,078 0.213<br />
Ayeyarwady 924 940 956 991 1,009 1,028 1,048 1,067 0.149<br />
Union Total 11,083 11,283 11,487 11,953 12,201 12,479 12,738 13,002 0.248<br />
Note: Rural population ratio is based on 1983 census.<br />
Source: Statistical Yearbooks, CSO 1992, 1997 & 2003
SUMMARY<br />
A. Policy Reference<br />
1. Purpose:<br />
The purpose of the indicator is to see on how likely the population increase is challenging and<br />
influencing the mandate of water for all by the year 2015.<br />
2. Relevance to Environment Planning and Management:<br />
The indicator is relevant for adjusting the national health plan and water vision to improve the<br />
access of all citizens to safe drinking water in line with the Millennium Development Goals.<br />
3. Linkage to Other Indicators:<br />
This indicator is linked to ‘Percentage of Population with Access to Safe Drinking Water Supply”<br />
and “Per capita water consumption”.<br />
B. Analysis<br />
In Figure 1, a linear growth of rural and urban population is observed. As projected in Table 1,<br />
the total population by 2015 will be 62 million people and it is an increase of about 16% of the 2005<br />
population within the next decade. Until 2003, the percentage of the population with access to safe<br />
drinking water was 80%, equivalent to 42 million people approximately. For the wider access of all<br />
people to water supply by 2015, there are 20 millions more people to be covered by improved water<br />
supply in forthcoming years. On average, annually improved access to safe water supply should be a<br />
minimum of 4 million people by expansion of the water supply infrastructure across the country. For<br />
the last eight years from 1995 to 2003, the annual achievement was only 2.5 million people in<br />
improving their access to water supply. Therefore, the present level of population growth is above the<br />
level of what was annually able to accomplish an improvement of water supply. As population increase<br />
in rural areas is higher than that of urban areas, conceivably there will be more stresses in<br />
improving rural water supply for all rural people. Accounting for these facts, the population pressure<br />
on safe drinking water supply has been high and increasing.<br />
183
Indicator ID<br />
Indicator Name<br />
Greater Mekong Subregion<br />
Indicator Fact Sheet<br />
DATABASE INFORMATION<br />
Year of <strong>Assessment</strong> 2005<br />
Type of Indicator Response<br />
Frequently Asked Question (FAQ)<br />
Priority Concern Water Resources<br />
Geographic Area Union of <strong>Myanmar</strong><br />
184<br />
Expenditure on Drinking Water Supply - 1997 to<br />
2003<br />
To what extent has expenditure on drinking water<br />
supply had an impact on access to safe drinking<br />
water?<br />
Impact & Trend Significant and Consistent<br />
Key Message<br />
The real value of expenditure on safe drinking<br />
water supply has been consistently increased over<br />
time since 1998. As household residents covered<br />
by safe drinking water supply increased to 80% of<br />
the total population by the year 2003, the<br />
response in improving access to safe drinking<br />
water is consistent with a significant allocation of<br />
more financial resources.
TECHNICAL INFORMATION<br />
A. Definition<br />
This indicator tracks the expenditure made in real terms (at constant prices) by concerned<br />
government departments for improving access to safe drinking water supply throughout the<br />
country.<br />
B. Data Source<br />
For urban water supply, data were obtained from the Department of Development Affairs<br />
(DDA), Mandalay City Development Committee (MCDC) and Yangon City Development Committee<br />
(YCDC). For rural water supply, data were obtained from Water Resource Utilization Department<br />
(WRUD) and the Department of Development Affairs (DDA).<br />
DDA. 2005. Data related to the development of environmental indicator for national<br />
performance assessment. Submission to <strong>National</strong> Commission for <strong>Environmental</strong> Affairs, by<br />
Department of Development Affairs, Reference Letter No: 282/Nga-07/Sa-Ya-Kha (46) dated 9<br />
February, 2005, Yangon.<br />
YCDC. 2005. Data related to the development of environmental indicator for national performance<br />
assessment. Submission to <strong>National</strong> Commission for <strong>Environmental</strong> Affairs, by Yangon City<br />
Development Committee, Reference Letter No: 109/01 (322)/Sa-tha-ka dated 8 February, 2005,<br />
Yangon.<br />
MCDC. 2005. Data related to the development of environmental indicator for national<br />
performance assessment. Submission to <strong>National</strong> Commission for <strong>Environmental</strong> Affairs, by<br />
Mandalay City Development Committee, Reference Letter No: 1001/11/Ya-tha-ya (0234) dated 10<br />
March 2005, Yangon.<br />
WRUD. 2005. Data related to the development of environmental indicator for national<br />
performance assessment. Submission to <strong>National</strong> Commission for <strong>Environmental</strong> Affairs, by Water<br />
Resource<br />
Utilization Department, Ministry of Agriculture and Irrigation, the Government of the Union of<br />
<strong>Myanmar</strong>, Reference Letter No: Sa-ma-ka (4)/280 (055/2005) dated 10 February 2005, Yangon.<br />
C. Geographic Area / Population Coverage<br />
The data and the indicator are representative of all expenditure for water supply for the Union<br />
of <strong>Myanmar</strong> as a whole.<br />
D. Temporal Coverage<br />
Expenditure data utilized for this indicator are for the budget years of 1997-98 to 2002-2003.<br />
The budget year is normally started from 1 April of given calendar year and ended at 31 March of<br />
the year followed.<br />
E. Methodology and Frequency of Coverage<br />
Annually recorded financial expenditures of concerned departments were the basis for<br />
calculating financial investment for safe drinking water supply. This expenditure was given in<br />
nominal value at the prevailing price level of the respective budget years.<br />
F. Methodology of Data Manipulation<br />
By using the Consumer Price Index (CPI) of the Central Statistical Organization, real<br />
expenditure was calculated at 1997 base year’s constant price level. Financial expenditure of DDA<br />
and WRUD was summed for the figures of investment in rural water supply, whereas the respective<br />
expenditure of DDA, MCDC and YCDC were treated as investment in urban water supply.<br />
185
QUALITATIVE INFORMATION<br />
A. Strength and Weakness (data level)<br />
This indicator provides the financial investment of government agencies for safe drinking water<br />
supply. Financial investment by private sector and other institutions such as United Nations<br />
organizations and international non-governmental organizations were not fully accounted in the<br />
total amount of the investment.<br />
B. Reliability, Accuracy, Robustness, Uncertainty (data level)<br />
Reliability is high as data were based on actual financial expenditure data of the departments<br />
concerned. However, the accuracy of real investment made available for safe drinking water supply<br />
will be less as the contribution and investment of the private sector and international organization<br />
are not accounted for in the estimation. The robustness of the data also relies on the similarity of<br />
the Consumer Price Index (CPI) to the real situation of price inflation.<br />
C. Future Work Required (for data level and indicator level)<br />
Investment data related to private sector and international organization should be integrated<br />
into the estimation and percentage of GDP spent on investing for water supply should also be<br />
calculated.<br />
SUPPORTING DATA TABLES, GRAPHS AND MAPS<br />
Figure 1: Expenditure on Drinking Water Supply – 1997-2003<br />
186
Year<br />
Table 1: Expenditure on Drinking Water Supply – 1997-2003<br />
Investment for Urban Water<br />
Supply<br />
(Million Kyat)<br />
Investment for Rural<br />
Water Supply<br />
(Million Kyat)<br />
187<br />
Total Investment for Safe<br />
Drinking Water Supply<br />
(Million Kyat)<br />
Consumer Price Index<br />
(1997 = 100)<br />
1997 481 139 620 100.00<br />
1998 414 27 440 130.09<br />
1999 538 111 650 150.44<br />
2000 545 258 803 147.85<br />
2001 436 200 635 198.86<br />
2002 425 264 688 314.41<br />
2003 614 380 994 338.62<br />
Source: Compiled from Table 2a and Table 2b, with CPI adjustment<br />
Table 2a: Nominal Value of Expenditure by Department for<br />
Rural Water Supply (Million Kyat)<br />
Year<br />
Water Resource Utilization<br />
Department<br />
Department of Development<br />
Affairs<br />
Total Expenditure<br />
1997 138.51 0.02 138.53<br />
1998 33.96 0.88 34.84<br />
1999 79.66 87.64 167.30<br />
2000 132.05 250.13 382.18<br />
2001 - 397.44 397.44<br />
2002 - 829.76 829.76<br />
2003 - 1,286.41 1,286.41<br />
Source: WRUD (2005) & DDA (2005)<br />
Year<br />
Table 2b: Nominal Value of Expenditure by Department for<br />
Urban Water Supply (Million Kyat)<br />
Department of Development<br />
Affairs<br />
Mandalay City Development<br />
Committee<br />
Yangon City Development<br />
Committee<br />
1997 106 76 300 481<br />
1998 99 108 331 538<br />
1999 263 37 510 810<br />
2000 220 110 475 805<br />
2001 245 141 480 866<br />
2002 393 242 699 1,335<br />
2003 1,068 169 841 2,078<br />
Source: YCDC (2005), DDA (2005) & MCDC (2005)<br />
Total
SUMMARY<br />
A.Policy Reference<br />
1.Purpose:<br />
This indicator analyzes the aspect of financial strengthening on improving the access of<br />
people to safe water supply.<br />
2.Relevance to Environment Planning and Management:<br />
This indicator is relevant to <strong>National</strong> Health Policy and <strong>National</strong> Health Planning for better<br />
coverage of safe drinking water supply in reducing the incidents of water borne diseases.<br />
3.Linkage to Other Indicators:<br />
This indicator is linked to indicators like Expenditure on Overall <strong>Environmental</strong> Conservation<br />
and Management, and per capita expenditure on health care.<br />
4.Targets:<br />
Except for the budgetary framework and plan of Departments concerned, there is no national<br />
target set for total investment made available for total improvement in a fuller coverage of water<br />
supply.<br />
5.International Environment Treaties:<br />
Millennium Development Goals and International Water Vision are indirectly related to<br />
increasing financial resource for improving access to safe water supply.<br />
B.Analysis<br />
By using the consumer price index, the nominal value of expenditure by respected government<br />
agencies (as given in Table 2a and 2c) were converted into total investment available for both rural<br />
and urban water supply at 1997 constant price level (as given in Table 1). Based on table 1, the<br />
trend of real value of total investment in water supply was shown in Figure 1. According to Table 1,<br />
the total investment in 2003 increased to 994 million kyat, equivalent to almost 160% of 1997’s<br />
investment level. More investment was made in urban water supply than in rural water supply.<br />
Apparently, a higher increase in the nominal value of investment was made in the years 2001,<br />
2002 and 2003, but a higher rare of inflation caused the real investment value to be lower in 2001<br />
and 2003 than in 2000. However, as observed in Figure 1, real values of total investment for water<br />
supply generally showed an upward trend during the period of 1997 to 2003. As the percentage of<br />
population with access to safe drinking water increased from 60% to 80% in those years, the<br />
performance in improving the status of water resource for drinking is to be rated as a significant<br />
and consistent response to this environmental concern.<br />
188
Indicator ID<br />
Indicator Name<br />
Greater Mekong Subregion<br />
Indicator Fact Sheet<br />
DATABASE INFORMATION<br />
Year of <strong>Assessment</strong> 2005<br />
Type of Indicator State<br />
Frequently Asked Question (FAQ)<br />
Priority Concern Water Resources<br />
Geographic Area Union of <strong>Myanmar</strong><br />
State & Trend Average and Improving<br />
Key Message<br />
189<br />
Irrigated Area as a Percentage of Irrigable Area<br />
- 1997 to 2002<br />
How effectively have national water resources been<br />
utilized for agricultural irrigation?<br />
Impressively water storage capacity in government<br />
dams for agriculture has shown a 27-fold increase<br />
since 1988 by constructing more dams and<br />
irrigation facilities. However, around 50% of these<br />
increased water volumes in those reservoirs were<br />
made available for irrigation during 1997 to 2002.<br />
Thus the current state of water resource used for<br />
agriculture is on average with improving trend.
TECHNICAL INFORMATION<br />
A. Definition<br />
This indicator tracks the efficiency of irrigation dams within the irrigation network. It is expressed<br />
as a percentage of irrigated agriculture land to irrigable area of the dams constructed by<br />
Government’s Irrigation Department.<br />
Irrigated agriculture lands are the occupied areas for cultivation of annual crops under the<br />
irrigation of Government dams.<br />
Irrigable areas are the cultivated areas where the irrigation systems of existing dams (government<br />
constructed) could supply water to the extent possible for annual crop production.<br />
B. Data Source<br />
The data from the Irrigation Department are used in the development of this indicator.<br />
ID. 2005. Data pertaining to environmental indicator development for national performance<br />
assessment. Submission to the <strong>National</strong> Commission for <strong>Environmental</strong> Affairs by Irrigation<br />
Department, Ministry of Agriculture and Irrigation, the Government of the Union of <strong>Myanmar</strong>,<br />
Reference Letter No: 1868/201 Sa-Ma-Ka dated 8 February, 2005, Yangon.<br />
C. Geographic Area / Population Coverage<br />
The data and the indicator are representative of the irrigated area of the Union of <strong>Myanmar</strong> as<br />
a whole.<br />
D. Temporal Coverage<br />
The data employed for the construction of this indicator covers the period from 1997 to 2002.<br />
E. Methodology and Frequency of Coverage<br />
Data were based on the Statistics of the Irrigation Department. Consecutively they cover six<br />
budget years which normally start on 1 April of a given calendar year and end on 31 March of the<br />
following year.<br />
F. Methodology of Data Manipulation<br />
In calculating the ratio, the irrigated area is divided by the irrigable area of respective years<br />
and it is expressed as the percentage of total irrigable area.<br />
QUALITATIVE INFORMATION<br />
A. Strength and Weakness (data level)<br />
This indicator provides the observable trend of the supply of water resources from constructed<br />
dams to cultivated land within the existing irrigation system and network. However, the data are<br />
only for government constructed dams and do not include dams constructed and owned by the<br />
community and private sector.<br />
B. Reliability, Accuracy, Robustness, Uncertainty (data level)<br />
The robustness of the indicator value is dependent on the accuracy of the data for the actual<br />
irrigated area, which is difficult to collect in the field for all irrigation systems.<br />
C. Future Work Required (for data level and indicator level)<br />
The indicator should also calculate irrigated ratio for private irrigation system, which is not<br />
covered by this indicator for the time being. In addition, annually irrigated water volume should<br />
be further calculated based on this data set for understanding the nature of water consumption,<br />
shortage and sufficiency for agriculture use.<br />
190
SUPPORTING DATA TABLES, GRAPHS AND MAPS<br />
Figure 1: Ratio of Irrigated Area to Irrigable Area - 1997/98 to 2002/03<br />
Table 1: Ratio of Irrigated Area to Irrigable Area – 1997/98 to 2002/03<br />
Year Irrigable Area (acres) Irrigated Area (acres)<br />
191<br />
Ratio of Irrigated to<br />
Irrigable Area<br />
1997-98 1,107,000 474,185 43%<br />
1998-99 1,210,000 457,449 38%<br />
1999-2000 1,358,000 527,784 39%<br />
2000-2001 1,332,000 739,466 56%<br />
2001-2002 1,375,000 750,476 55%<br />
2002-2003 1,498,000 794,724 53%<br />
Source: Irrigation Department – ID (2005)
Table 2: Maximum Storage Capacity of Water<br />
Volume in Government Dams<br />
Period No. of Dams Available Water Volume (Acre Feet)<br />
before 1948 10 78,744<br />
1948 - 1961/62 31 188,675<br />
1962/63 - 1973/74 52 363,404<br />
1974/75 - 1987/88 65 1,894,672<br />
1989 - 90 67 2,778,772<br />
1990 - 91 70 2,802,219<br />
1991 - 92 74 2,812,059<br />
1992 - 93 80 2,828,311<br />
1993 - 94 88 2,881,422<br />
1994 - 95 97 3,095,568<br />
1995 - 96 108 3,913,831<br />
1996 - 97 118 4,160,541<br />
1997 - 98 125 4,717,398<br />
1998 - 99 133 5,097,345<br />
1999 - 2000 143 5,795,906<br />
2000 - 2001 151 5,948,313<br />
2001 - 2002 163 9,847,113<br />
Source: Irrigation Department – ID (2005)<br />
Figure 2: Maximum Storage Capacity of Water<br />
Volume in Government Dams<br />
192
SUMMARY<br />
A. Policy Reference<br />
1. Purpose:<br />
The purpose of this indicator is to measure the efficiency of the current irrigation system in<br />
making water resource available for agriculture use.<br />
2. Relevance to Environment Planning and Management:<br />
The indicator is useful for planning and management of water resources effectively for irrigation<br />
purpose .It is also relevant to land use planning for sustainable agriculture development.<br />
3. Linkage to Other Indicators:<br />
None specific.<br />
4. Targets:<br />
Once dams are constructed, it is expected that all irrigable areas within their established irrigation<br />
networks are to be irrigated fully for agriculture purpose as planned and designed. Therefore, the<br />
target related to this indicator is an irrigated area of 100% of the total irrigable area.<br />
B. Analysis<br />
Figure 1 presents the observable trend of irrigation coverage within the established irrigation<br />
system and network. Irrigated farming area as a percentage of total irrigable area has increased<br />
during the period from 1997 to 2002. It indicates the increased coverage in effective irrigated area<br />
under the existing irrigation system of the Irrigation Department. The data revealed that the ratio<br />
of irrigated area was only 43% of the total irrigable area in 1997 and it declined to 38% and 39%<br />
in 1998 and 1999 respectively. However, the situation improved from 2000 to 2002 by increasing<br />
the coverage of irrigated area to above 50%.<br />
In fact, there has been a strong policy support and commitment in increasing water availability<br />
for agriculture since 1989. As a result, the numbers of dams constructed have been increased and<br />
storage capacity of water for agriculture has also been impressively increased. By the end of the<br />
budget year 2001-2002, the maximum capacity of water storage in government dams was almost<br />
10 million acre feet and it was 27 times higher than before 1989 (Table 2 and Figure 2). Alongside<br />
its increase in water availability, it is equally important that water should be conveyed from dam to<br />
all irrigable area as planned for efficient and effective utilization of the water resource for<br />
agriculture.<br />
However, the efficiency of water supply from the dam is dependent on many factors such as<br />
annual precipitation received, better maintenance of canal and off-take structure, minimizing water<br />
leakage, balancing water demand by suitable cropping system, and farmers’ participation in water<br />
distribution, maintenance and management. Failure in one of these factors might be associated<br />
with lesser irrigation coverage.<br />
Despite the irrigated farming area as a percentage of total irrigable area showing an increase<br />
during the years from 1998 to 2000, it has been leveling around 50% since 2000. Thus the current<br />
state of water resource for agriculture is on average with a stabilizing trend in terms of managing<br />
agriculture water use efficiently.<br />
193
Indicator ID<br />
Greater Mekong Subregion<br />
Indicator Fact Sheet<br />
DATABASE INFORMATION<br />
Indicator Name Irrigated Crop Sown Area - 1985 to 2002<br />
Year of <strong>Assessment</strong> 2005<br />
Type of Indicator Pressure<br />
Frequently Asked Question (FAQ)<br />
Priority Concern Water Resources<br />
Geographic Area Union of <strong>Myanmar</strong><br />
Magnitude & Trend High and Steady<br />
Key Message<br />
194<br />
What is the level of stress caused by irrigated<br />
annual cropping on the efficient use of agriculture<br />
water?<br />
The irrigated area accumulated by multiple<br />
cropping doubled from 3 to 6 million acres during<br />
the period from 1985 to 2002. More than 70%<br />
of these areas were sown for paddy for which<br />
water consumption is high. There is a causal link<br />
between a stress to supply water for all irrigable<br />
areas and increasing acreage of irrigated crop<br />
sown area, especially multiple cropping of<br />
paddy. As the trend in encouraging the multiple<br />
cropping of the paddy is to be continued, the<br />
pressure on efficient water use for agriculture<br />
will remain high and steady at present and in<br />
the future.
TECHNICAL INFORMATION<br />
A. Definition<br />
This indicator tracks the growth in the total crop sown areas under irrigation. Crop sown area<br />
is defined as the sum of all cultivated land areas that is subjected to multiple cropping within an<br />
agriculture calendar. The agriculture water demand of the crop sown area gives a measure of the<br />
total volume of water required to meet the irrigation needs of all the crops that are sown/grown<br />
over a piece of land. It is expressed as thousand acres per year.<br />
B. Data Source<br />
The Statistical Yearbook for the year 2003 of Central Statistical Organization is the main<br />
source for the data employed in the development of this indicator.<br />
C. Geographic Area / Population Coverage<br />
The indicator represents the situation of crop-sown area under irrigation across the whole<br />
country.<br />
D. Temporal Coverage<br />
Temporal coverage of this indicator is for the budget years from 1985 to 2002.<br />
E. Methodology and Frequency of Coverage<br />
The total irrigated area under annual crop multiplication was given for all circumstances under<br />
any types of irrigation systems either government or private. For the earlier period, data were only<br />
represented for the years 1985 and 1990 as it was compiled at five yearly intervals.<br />
F. Methodology of Data Manipulation<br />
The percentage of annually irrigated paddy sown area is calculated based on the total crop<br />
sown area of the respective budget year.<br />
QUALITATIVE INFORMATION<br />
A. Strength and Weakness (data level)<br />
The indicator provides the comparable trend of increased intensity of cropping under<br />
improved irrigation as well as the likelihood of increased water demand by crop sown, particularly<br />
growing paddy. An indicative value is given for all crop-sown areas under the irrigation systems of<br />
both government (Irrigation Department and Water Resource Utilization Department) and private<br />
sector. It only generalized the scenario in analyzing the causal link of this indicator to “State<br />
indicator, which focused on the efficiency in conveying the agriculture water from government<br />
constructed dams to all irrigable areas within established irrigation networks.<br />
B. Reliability, Accuracy, Robustness, Uncertainty (data level)<br />
There is a possibility of error at the data level since the compilation of the crop-sown area is<br />
dependent on manual methods of data collection at the field level.<br />
C. Future Work Required (for data level and indicator level)<br />
Data should be separately collected for the crop-sown area affected by different irrigation<br />
schemes under the Irrigation Department and Water Resource Utilization Department in order to<br />
analyze the different conditions. The average volume of water consumed by annually sown crops<br />
should also be calculated for better irrigation management in adjusting the crop-water<br />
requirement.<br />
195
SUPPORTING DATA TABLES, GRAPHS AND MAPS<br />
Figure 1: Irrigated Crop Sown Area and Percentage<br />
of Irrigated Paddy Sown Area<br />
Table 1: Irrigated Crop Sown Area (thousand acres) and Percentage of<br />
Irrigated Paddy Sown Area<br />
Year<br />
Total Irrigated<br />
Area<br />
Total Irrigated<br />
Crop Sown<br />
Area<br />
Irrigated Paddy<br />
Sown Area<br />
196<br />
Irrigated Sown<br />
Area of Other<br />
Food Crop<br />
Irrigated Sown<br />
Area of Other<br />
Non Food<br />
Crop<br />
% Paddy Sown<br />
Area<br />
1985-86 2,616 3,024 2,119 890 15 70%<br />
1990-91 2,479 2,871 2,148 707 17 75%<br />
1995-96 4,341 5,292 4,365 908 19 82%<br />
1996-97 3,846 4,610 3,793 796 21 82%<br />
1997-98 3,933 4,750 3,848 867 35 81%<br />
1998-99 4,182 5,140 3,937 1,175 28 77%<br />
1999-00 4,550 5,799 4,493 1,274 32 77%<br />
2000-01 4,720 6,021 4,609 1,381 31 77%<br />
2001-02 4,906 6,239 4,578 1,629 32 73%<br />
2002-03 4,619 6,198 4,559 1,609 31 74%<br />
Source: Statistical Yearbook, CSO 2003
SUMMARY<br />
A.Policy Reference<br />
1.Purpose:<br />
The purpose of this indicator is to capture the tendency in level of demand on agriculture<br />
water by type of crop sown and irrigated area accumulated by annual crop multiplication.<br />
2.Relevance to Environment Planning and Management:<br />
This is relevant for better management in supplying water for irrigation efficiently and<br />
effectively to all irrigable areas within established network.<br />
3.Linkage to Other Indicators:<br />
This indicator is linked to indicators such as “the ratio of irrigated area to all irrigable area”<br />
and “the percentage of irrigated area over total agriculture land”.<br />
B.Analysis<br />
As observed in Figure 1, there is an upward trend of irrigated crop-sown area during the studied<br />
period. Although total irrigated crop-sown area in 1990 was lower than that of 1985, the irrigated<br />
area accumulated by annual crop multiplication has been expanded significantly from 1995. By<br />
2002, it reached 6.2 million acres approximately, an almost two fold increase since the early 1990s<br />
(Table 1). The total area affected by irrigation also increased as well during the same period.<br />
Obviously, this was due to significant increases in the number of dams constructed after the<br />
country adopted the open market economy since 1988 and the national policy focused on tapping<br />
the water resource potential for agriculture. It was also found that the ratio of irrigated crop-sown<br />
area to irrigated area was gradually higher and almost 134% in 2002 by indicating the higher<br />
cropping intensity with increasing use of available water. The available water was essentially used<br />
for growing paddy for which the crop-water requirement is higher than for other crops-In<br />
conjunction with a policy of self-sufficiency of rice locally; an attempt has been made to multiple<br />
crop of paddy as much as possible within a given cropping calendar.<br />
The water requirement for successful paddy growing is as high as 5 acre feet per acre of paddy<br />
field and the estimated water consumption in 2002-2003 was around 23 million acre feet for 4.5<br />
million acres of paddy growing area across the country. As the irrigated area under the<br />
government’s irrigation system was about one third of total irrigated area of the whole country,<br />
probably 7.6 million acre feet of agriculture water are required for irrigating paddy-growing areas<br />
under the government’s irrigation scheme in which two agencies, namely; Water Resource<br />
Utilization Department and Irrigation Department, are involved. For irrigation department alone,<br />
the best-estimated water consumption by paddy will not be less as 5 million acres feet as irrigation<br />
coverage by the Water Resource Utilization Department was lesser than 40% of total irrigated area<br />
under the government scheme in 2001-2002.<br />
Maximum capacity of water storage in the dams of Irrigation Department is approximately 10<br />
million acre feet and water consumption by paddy was already above 50% of water available from<br />
existing infrastructure. Taking into account the possible variations in annual precipitation,<br />
maintenance of irrigation network and over utilization of irrigated water, this consumption level<br />
might be higher in certain circumstances. In this situation, current acreage of irrigated paddy sown<br />
area has already created a stress with higher water consumption unable to irrigate all irrigable<br />
areas within the established network. Therefore, the efficiency of irrigation is very much influenced<br />
by increasing acreage of paddy-sown area. In other words, the more the paddy was sown, the lesser<br />
the irrigable areas were irrigated. According to Table 1, total sown acre for paddy under irrigation<br />
throughout the country was above 80% of total irrigated crop sown area for years 1995, 1996 and<br />
1997. However, this decreased to below 80% in later years and the percentage of irrigated paddy<br />
sown area for 2002 was 74%. As it is observed that the ratio of irrigated area to irrigable area was<br />
around 50% since the year 2000, the decline in percentage of irrigated paddy sown acre stabilized<br />
the trend of irrigation efficiency. Nevertheless, the trend in encouraging the multiple cropping of<br />
paddy is to be continued and the level of stress by irrigated crop sown area for efficient use of<br />
agriculture water is going to be higher as usual in the future. Thus, this indicator is rated as High<br />
and Steady.<br />
197
Indicator ID<br />
Indicator Name<br />
Greater Mekong Subregion<br />
Indicator Fact Sheet<br />
DATABASE INFORMATION<br />
Year of <strong>Assessment</strong> 2005<br />
Type of Indicator Response<br />
Frequently Asked Question (FAQ)<br />
Priority Concern Water Resources<br />
Geographic Area Union of <strong>Myanmar</strong><br />
198<br />
Expenditure on Irrigation Management - 1992 to<br />
2004<br />
How has expenditure on irrigation management<br />
improved efficiency in agriculture water management?<br />
Impact & Trend On Average and Consistent<br />
Key Message<br />
At 1992 constant price level, the real value of<br />
expenditure on irrigation management has been<br />
consistently increased since 2000 and the level<br />
of spending in 2004 is as high as 200% of the<br />
1992 level. As slightly over the half of the total<br />
irrigable area could be irrigated so far as shown<br />
in the “state” indicator, increased expenditure in<br />
irrigation management has only made a modest<br />
improvement in the average efficiency of<br />
agriculture water utilization.
TECHNICAL INFORMATION<br />
A. Definition<br />
This indicator tracks the expenditure for irrigation management by the Irrigation Department<br />
(ID). It is expressed in millions kyat per annum. Expenditure on irrigation management includes all<br />
the money spent for personnel, operational and maintenance, administration, surveying, research<br />
and training, whereas expenditures on irrigation development tracks the cost of constructing dams<br />
and irrigation networks.<br />
B. Data Source<br />
The data utilized for the construction of this indicator originate from the Irrigation Department<br />
of the Ministry of Agriculture.<br />
ID. 2005. Data pertaining to environmental indicator development for national performance<br />
assessment. Submission to <strong>National</strong> Commission for <strong>Environmental</strong> Affairs by Irrigation<br />
Department, Ministry of Agriculture and Irrigation, the Government of the Union of <strong>Myanmar</strong>,<br />
Reference Letter No:1868/201 Sa-Ma-Ka, dated 8 February 2005, Yangon.<br />
C. Geographic Area / Population Coverage<br />
The data and the indicator are representative of most major irrigation management<br />
expenditures for the Union of <strong>Myanmar</strong> as a whole.<br />
D. Temporal Coverage<br />
The indicator is based on expenditure figures for government fiscal years 1992-1993 to<br />
2004-2005. The fiscal or budget year begins on 1 April and ends on 31March.<br />
E. Methodology and Frequency of Coverage<br />
Annual expenditure is differentiated by the different nature of the expenditure items including<br />
personnel, operation and maintenance, administration, survey and investigation, research and<br />
training and dam construction.<br />
F. Methodology of Data Manipulation<br />
Investment for agriculture water supply is calculated by summing the expenditure incurred for<br />
dam construction and irrigation management. Expenditure incurred in Irrigation Management was<br />
based on the financial expenditure of the Irrigation Department spent on Personnel, Operation and<br />
Maintenance, Surveying, Research and Training and Administration. The cost of dam construction<br />
is treated as the cost of irrigation development. The Consumer Price Index of the Central<br />
Statistical Organization was used for estimating real value of the expenditure at the constant price<br />
of 1992 base year.<br />
QUALITATIVE INFORMATION<br />
A. Strength and Weakness (data level)<br />
This indicator is helpful in examining the rationale of financing better irrigation management<br />
which is equally important as irrigation development in order to maintain the efficiency in water<br />
distribution<br />
and supply as planned and designed. Due to the lack of data, this only indicates the financial<br />
response of the Irrigation Department for irrigation efficiency and it does not address the situation<br />
of other irrigation systems under the Water Resource Utilization Department and Private sector.<br />
B. Reliability, Accuracy, Robustness, Uncertainty (data level)<br />
Reliability is high as the data were based on actual financial expenditure reports of the<br />
department concerned.<br />
C. Future Work Required (for data level and indicator level)<br />
Data related to the irrigation management of Water Resource Utilization Department should<br />
be also integrated in the analysis.<br />
199
Year<br />
SUPPORTING DATA TABLES, GRAPHS AND MAPS<br />
Figure 1: Expenditure on Irrigation Management<br />
at 1992 Constant Prices - 1992-2004<br />
Table 1a: Expenditure on Irrigation Management at 1992<br />
Constant Price as Percentage of Total Investment for<br />
Agriculture Water Supply by Irrigation Department<br />
Irrigation<br />
Management<br />
(Million Kyat)<br />
Dam Construction<br />
(Million Kyat)<br />
Total Investment in<br />
Agriculture Water<br />
Supply (Million<br />
Kyat)<br />
200<br />
Consumer<br />
Price Index<br />
(1992 =100)<br />
Percentage of expenditure<br />
on Irrigation<br />
Management to total<br />
investment<br />
1992-93 443 520 962 100 46%<br />
1993-94 334 693 1,028 134 33%<br />
1994-95 365 1,439 1,804 164 20%<br />
1995-96 344 2,428 2,772 199 12%<br />
1996-97 406 2,384 2,790 239 15%<br />
1997-98 383 2,020 2,403 245 16%<br />
1998-99 549 1,561 2,109 319 26%<br />
1999-00 600 1,918 2,519 369 24%<br />
2000-01 893 2,591 3,484 363 26%<br />
2001-02 830 1,839 2,669 488 31%<br />
2002-03 545 1,680 2,224 772 24%<br />
2003-04 1,013 2,241 3,253 831 31%<br />
2004-05 1,010 2,837 3,847 964 26%<br />
Source: Irrigation Department, ID (2005)
Table 1b: Nominal Value of Total Investment in Agriculture Water<br />
Supply by Irrigation Department (Million Kyat) - 1992/93 to 2004/05<br />
Year<br />
Irrigation Management<br />
Million Kyat (a)<br />
Dam Construction (or) Irrigation<br />
Development Million Kyat<br />
201<br />
Total Investment in Irrigation for<br />
Agriculture Million Kyat<br />
1992-93 443 520 962<br />
1993-94 447 926 1,373<br />
1994-95 597 2,353 2,950<br />
1995-96 686 4,838 5,524<br />
1996-97 970 5,702 6,672<br />
1997-98 941 4,956 5,897<br />
1998-99 1,751 4,982 6,733<br />
1999-00 2,216 7,082 9,298<br />
2000-01 3,240 9,403 12,643<br />
2001-02 4,050 8,975 13,025<br />
2002-03 4,204 12,959 17,163<br />
2003-04 8,415 18,620 27,036<br />
2004-05 9,734 27,358 37,092<br />
Note: (a) is total expenditure of Table 1c.<br />
Source: Irrigation Department, ID (2005)<br />
Table 1c: Nominal Value of Total Expenditure on Irrigation Management by<br />
Irrigation Department (Million Kyat) - 1992/93 to 2004/05<br />
Year Personnel<br />
Operation and<br />
Maintenance<br />
Administration<br />
Survey & Investigation<br />
Research and<br />
Training<br />
Total Expenditure<br />
1992-93 110 281 42 4 6 443<br />
1993-94 146 247 41 5 7 447<br />
1994-95 150 371 58 9 9 597<br />
1995-96 155 415 84 17 15 686<br />
1996-97 165 685 93 15 13 970<br />
1997-98 169 501 249 10 12 941<br />
1998-99 172 1,040 506 20 13 1,751<br />
1999-00 172 1,348 635 45 17 2,216<br />
2000-01 754 1,678 730 30 49 3,240<br />
2001-02 761 2,466 766 30 28 4,050<br />
2002-03 776 2,589 764 40 35 4,204<br />
2003-04 786 6,473 897 192 68 8,415<br />
2004-05 1,651 6,823 1,100 100 60 9,734<br />
Source: Irrigation Department, ID (2005)
SUMMARY<br />
A. Policy Reference<br />
1. Purpose:<br />
This indicator serves to analyze the relationship between financial allocation for irrigation<br />
management and the efficiency in irrigation for better water supply and coverage.<br />
2. Relevance to Environment Planning and Management:<br />
The indicator is relevant to local agriculture development and cropping management for rationale<br />
use of water resource and irrigation efficiency. As careless development in irrigation is strongly<br />
affecting fresh water biodiversity and fishery resources, this indicator is useful in focusing attention<br />
on the need for effective natural resource management and environmental conservation.<br />
3. Linkage to Other Indicators:<br />
This indicator is linked to indicators like Expenditure on <strong>Environmental</strong> Management and Land<br />
Degradation in the sense of flood control by constructed dams and weirs.<br />
B. Analysis<br />
Based on the data of Table 1a, Figure 1 illustrates the trends of expenditure on irrigation<br />
management, dam construction and percentage of expenditure on irrigation management to overall<br />
investment of Irrigation Department for agriculture water supply. Tables 1b and 1c were supportive<br />
data for deriving the expenditure on irrigation management at the 1992 constant price, as given in<br />
Table 1. As shown in Figure 1, there was again a rising trend of irrigation management expenditure<br />
following its decline from 1992 to 1997. By the budget year of 2004-05, the current level of<br />
spending on irrigation management was as high as 200% of the 1992 level. It is observed that<br />
proportionately financial allocation was made more available for improvement in irrigation<br />
management, alongside the sharper increases in investment for construction of new dams.<br />
During the period from 1992 to 2004, the percentage of expenditure for irrigation management of<br />
the total investment of the Irrigation Department for agriculture water supply has fluctuated<br />
ranging from 12% to 45% (see Table 1). To increase the irrigated area, it appears that attempts<br />
made to expand irrigation by constructing new dams are more important than improving the<br />
efficiency of the existing irrigation system.<br />
As the irrigated area as a percentage of the total irrigable area oscillated around 50% since<br />
2000, little improvement could be made by this level of expenditure increase for better efficiency in<br />
expansion of irrigation coverage within the established irrigation facility and network. There is still<br />
considerable scope for improving and approaching the 100% efficiency target so that the current<br />
level of response to selected environmental concern is on average with consistent trend in managing<br />
the agriculture water resource effectively and efficiently.<br />
202
Indicator ID<br />
Indicator Name<br />
Greater Mekong Subregion<br />
Indicator Fact Sheet<br />
DATABASE INFORMATION<br />
Year of <strong>Assessment</strong> 2005<br />
Type of Indicator State<br />
Frequently Asked Question (FAQ)<br />
203<br />
Percentage Solid Waste Collected in Yangon City<br />
- 1983 to 2004<br />
How much of the generated waste in Yangon city<br />
is being collected?<br />
Priority Concern Inadequate Solid Waste Management<br />
Geographic Area Union of <strong>Myanmar</strong><br />
State & Trend Relatively Poor and Stabilizing<br />
Key Message<br />
The rate of solid waste collection increased in<br />
Yangon City from 54% in 2000 to 80% in 2004<br />
whereas it declined from 28% in 1998 to 24%<br />
in 2003 for all urban areas of the whole country,<br />
except Yangon and Mandalay cities. With the<br />
mixture of progress, data uncertainty and the<br />
need for meeting the policy target of “Green and<br />
Clean City”, it is considered that the performance<br />
on selected environmental concern is stabilizing<br />
at an unspectacular collection rate. As collection<br />
rates of other GMS’s countries are higher than<br />
that of <strong>Myanmar</strong>, the level of solid waste<br />
collection is relatively poor.
TECHNICAL INFORMATION<br />
A. Definition<br />
This indicator attempts to track the volume of solid waste collected daily by official means<br />
from the point of production such as residential area, communal dump and market. This is<br />
compared with total estimated municipal solid waste generated and the unit of the measurement is<br />
given as a percentage. Municipal solid waste is defined as “non gaseous and non-liquid waste that<br />
result from the daily activities of community’s residential and commercial sector within the given<br />
administrative urban area.<br />
B. Data Source<br />
The following are sources of information for the data employed in this indicator:<br />
YCDC. 2005. Data related to environmental indicator development. Submission of Pollution<br />
Control and Cleansing Department/Yangon City Development Committee to <strong>National</strong> Commission<br />
for <strong>Environmental</strong> Affairs. Reference Letter No.109/01(322)/Sa-tha-ka, Dated 8 February 2005<br />
Yangon.<br />
Yamauchi, Hisashi. and Sato, Shinsuke. 2001. Related solid waste data of Yangon City for<br />
2000. Daw Khin Win; Quoted in “Final <strong>Report</strong> on Planning and Techniques for Solid Waste Disposal<br />
in Yangon City, the Union of <strong>Myanmar</strong>”, Japan International Cooperation Agency (JICA) and<br />
Yangon City Development Committee (YCDC), Yangon.<br />
Khin Maung. 1995. Solid Waste Management at the City of Yangon for Sustained Urban<br />
Development. Technical paper presented in <strong>National</strong> Conference on <strong>Environmental</strong> Management<br />
organized by <strong>National</strong> Commission for <strong>Environmental</strong> Affairs (NCEA) in cooperation with Hanns<br />
Seidel Foundation – 28-30 August 1995, NCEA/HSF DOC.No.15, Yangon.<br />
Solid waste collection data of State and Division were extracted from the annual progress<br />
reports of the Department of Development Affairs for 1998 and 2003.<br />
C. Geographic Area / Population Coverage<br />
Solid waste data for Yangon capital is for the population living in the townships within the<br />
administrative area of Yangon city. Data coverage for States and Divisions is only for those<br />
administrative areas of urban townships within respective States and Divisions. The waste data<br />
for Yangon and Mandalay cities are not included in State-wide and Division-wide urban solid waste<br />
management data.<br />
D. Temporal Coverage<br />
For solid waste management in Yangon, the temporal coverage of the data is for four<br />
representative years during the period 1983 to 2004. The representative years within this period<br />
are 1983, 1990, 2000 and 2004. For solid waste disposal for urban area of States and Divisions,<br />
data only cover two years, 1998 and 2003.<br />
E. Methodology and Frequency of Coverage<br />
Solid waste disposal in Yangon for different representative years were based on different<br />
sources that had different methodology in estimating it as described below:<br />
• 2004 waste collection data was according to an estimation made by concerned agency<br />
(PCCD/YCCD) based on the compilation of operational records.<br />
• 2000 waste collection data was according to an estimation made by concerned agency<br />
(PCCD/YCCD) based on their special study undertaken on solid waste management with the<br />
assistance of Japanese International Coordination Agency<br />
204
• 1983 and 1990 Disposal data was derived from “official report of U Khin Maung, former head of<br />
PCCD/YCDC.” (see below section)<br />
Solid waste collection for urban areas of States and Divisions were based on the compilation of<br />
monthly progress reports submitted by township’s DDA to head office of DDA in Yangon. From the<br />
reports received, data were only derived for 1998 and 2003.<br />
F. Methodology of Data Manipulation<br />
The percentage of solid waste collection was based on the ratio of solid waste collected to<br />
total solid waste generated. In the case of Yangon city, the total amount of waste generated for<br />
1983 and 1990 was calculated by multiplying the city population of those periods by per capita<br />
solid waste generation, which was derived from the available data set, as explained in the fact sheet<br />
for “Solid Waste Generation”. By the same token, the same method was applied for estimating solid<br />
waste generation for urban areas of States and Divisions. As data for solid waste collection of both<br />
Yangon city and States and Divisions were available from respective reports, they were directly used<br />
for calculating the percentage of solid waste collection.<br />
QUALITATIVE INFORMATION<br />
A. Strength and Weakness (data level)<br />
The indicator provides the trend of solid waste management in Yangon City for the past 20<br />
year period. In addition, the trend of solid waste management in all urban areas other than<br />
Yangon and Mandalay cities is comparable amongst the States and Divisions for the two different<br />
time frames between 1998 and 2003 to improve further. These data for solid waste management<br />
for the whole country can provide a general for understanding of the current state. However,<br />
interpolated data for solid waste generation based on these assumptions might be limited for<br />
revealing the real situation.<br />
B. Reliability, Accuracy, Robustness, Uncertainty (data level)<br />
The reliability of the indicative value is overwhelmed by the accuracy of the estimated<br />
population figures and per capita solid waste generation. As there are higher gaps and differences<br />
in estimated population figures of various sources, the inaccuracy of the indicative value might be<br />
higher. Robustness of secondary data for solid waste collection is also dependent on the<br />
soundness of the waste monitoring system and data management of the respective authorities,<br />
which is unknown at the time when <strong>Environmental</strong> <strong>Performance</strong> <strong>Assessment</strong> (EPA), was carried out.<br />
C. Future Work Required (for data level and indicator level)<br />
For the sake of higher accuracy in the indicative value, obtaining the real figures of population<br />
data is essential. Strong and systematic solid waste monitoring will be required in collecting the<br />
data regularly for the amounts of solid waste collected, disposed, recycled and treated by various<br />
means.<br />
205
Year<br />
SUPPORTING DATA TABLES, GRAPHS AND MAPS<br />
Figure 1: Percentage of Solid Waste Collection in Capital Yangon<br />
Table 1a: Solid Waste Collection and Disposal at Capital Yangon<br />
Solid Waste Generated<br />
(ton/day)<br />
206<br />
Solid Waste Collected &<br />
Disposed (ton/day)<br />
% of Disposed waste to<br />
total generated waste<br />
1983 1,018 a 400 b 39%<br />
1991 1,346 c 564 b 42%<br />
2000 d 1,457 787 54%<br />
2003/04 e 1,435 1,150 80%<br />
(a) – estimated based on per capita waste generation equal to 1991 level<br />
(b) – Khin Maung (1995), Published Departmental Paper of Yangon City Development Committee<br />
(c) – interpolated data based on Khin Maung (1995)<br />
(d) – JICA & YCDC (2001), Unpublished Study <strong>Report</strong> on Planning and Techniques for Solid Waste Disposal in Yangon<br />
City<br />
(e) – YCDC official data submittal to NCEA, Ref.No:100/01(322)/Sa-Tha-Ka, Dated February 8, 2005<br />
Source: YCDC (2005), JICA & YCDC quoted in Yamauchi, Hisashi. and Sato, Shinsuke. (2001) and Khin Maung (1997)
Solid Waste Management Year 2003/04<br />
Total Waste Generated (ton/day) 1435<br />
Total Waste Collected & Disposed 1150<br />
Percent of wasted disposed as of total waste generated 80%<br />
Total waste by uncontrolled landfill (ton/day) 1149.5<br />
Percent of landfill operation as of total waste disposed 99.96%<br />
Total incinerated waste (ton/day) 0.5<br />
Percent of incinerated waste as of total waste disposed 0.04%<br />
Estimated waste recycled (ton/day) 143<br />
Percent of solid waste recycled as of total waste generated 10%<br />
Source: YCDC (2005)<br />
Table 1b: Supplemental Data Related to Solid Waste<br />
Management in Capital Yangon<br />
Figure 2: Percentage of Solid Waste Collection and Disposal At Urban<br />
Area of State and Division (without Capital Yangon and Mandalay City)<br />
207
Table 2: Solid Waste Collection in Urban Area of State and Division<br />
(without Capital Yangon and Mandalay City)<br />
States & Divisions<br />
Waste Generated (ton/year) Waste Disposed (ton/year) Waste Disposal %<br />
1998 2003 1998 2003 1998 2003<br />
Kachin 38,735 47,919 9,575 12,125 25% 25%<br />
Kayah 7,251 8,678 2,900 2,200 40% 25%<br />
Kayin 24,831 31,704 7,142 4,846 29% 15%<br />
Chin 10,310 12,137 750 218 7% 2%<br />
Sagain 101,042 113,205 38,656 15,647 38% 14%<br />
Tanintharyi 59,733 70,204 12,829 14,444 21% 21%<br />
Bago 137,159 151,294 47,642 39,487 35% 26%<br />
Magway 75,713 84,616 22,333 29,615 29% 35%<br />
Mandalay 108,206 130,561 47,409 47,172 44% 36%<br />
Mon 84,873 95,990 4,279 14,049 5% 15%<br />
Rakhine 56,589 63,697 6,120 3,831 11% 6%<br />
Yangon 69,349 88,138 32,886 19,402 47% 22%<br />
Shan 135,336 162,100 32,134 56,728 24% 35%<br />
Ayeyarwaddy 123,296 135,548 23,105 30,450 19% 22%<br />
Union Total 1,032,423 1,195,791 287,759 290,213 28% 24%<br />
Source: Annual <strong>Report</strong>s of Department of Development Affairs - DDA (1998 & 2003)<br />
208
SUMMARY<br />
A. Policy Reference<br />
1. Purpose:<br />
The purpose of this indicator is to examine the current level of solid waste management and<br />
its efficiency in managing the urban environment.<br />
2. Relevance to Environment Planning and Management:<br />
This is relevant for improving or maintaining of the efficient services in urban solid waste<br />
management. In the context of the <strong>National</strong> Health policy, this indicator is useful for showing the<br />
reduction of environmental health risk and associated impacts on public health. This is also<br />
important aspect for sustainable urban development planning and management.<br />
3. Linkage to Other Indicators:<br />
The indicator is linked to other social, economic and environmental indicators such as Waste<br />
generation, Waste recycling, <strong>Environmental</strong> Protection expenditure and Green House Gases<br />
Emission from Solid Waste.<br />
4. Targets:<br />
There are no quantitative target set for this indicator. However the campaign of “Green and<br />
Garbage Free City” prescribes a qualitative target for the best achievement in solid waste collection<br />
and disposal.<br />
B. Analysis<br />
From the data available as shown in Table 1a and Figure 1, it is observed that the total<br />
volume of solid waste daily collected in Yangon Capital were 400 tons/day in 1983, 564 tons/day<br />
in 1990, 787 tons/day in 2002 and 1150 tons/day in 2003-2004. As total solid waste daily<br />
generated were 1018 tons/day, 1346 tons/day, 1457 tons/day and 1435 tons/day respectively, the<br />
percentage of solid waste disposed was calculated as 39% in 1983, 42% in 1991, 54% in 2000<br />
and 80% in 2003. Although it is not perfect, solid waste management in Yangon has been gradually<br />
making progress in better collection. In fact, this is an average rate for the whole city and the actual<br />
percentage of solid waste collection varies from one sub-urban unit to another – for example, the<br />
collection rate is higher in down-town area while it might be lower in sub-urban and satellite<br />
townships.<br />
Currently, the collected wastes are hauled into waste dumping sites, which are located in the<br />
surroundings of the city. These sites are known to be for uncontrolled dumping but recent data<br />
from PCCD/YCDC has indicated that almost 99.96% of total amount of transported waste are<br />
daily land filled. It is also reported that half a ton per day of waste, particularly from hospitals, is<br />
incinerated equivalent to 0.04% of total disposal (see Table 1b). Due to data deficiency, the actual<br />
percentage of recycling from solid waste could not be verified but it is estimated that at least 10%<br />
of total solid waste generated are collected by private collectors and used for production of raw<br />
materials for cottage industries in Yangon.<br />
From the annual report of the Department of Development Affairs, the amounts of municipal<br />
waste collected annually were given for urban areas of all State and Division, except for Yangon and<br />
Mandalay Capital, in Table 2. It was found that 9 out of 14 states and divisions have lower<br />
collection rates in 2003 in comparison to 1989. Improved collection rates were only observed in<br />
Magwe Division, Shan State, Mon Division and Ayeyarwady Division. The situation in Kachin State<br />
and Tanintharyi Division was unchanged. For the whole country, the percentage of solid waste<br />
collection in 2003 has decreased to 24% from 28% of 1998 (see Figure 2).<br />
209
From these figures for Yangon Capital and State and Division, there is definitely a need to improve<br />
the current level of solid waste management for better collection and disposal as well as for<br />
systematic and sanitary treatment of the waste collected. With the mixture of progress in solid<br />
waste disposal and the need of quality assurance in treating collected waste, it is appropriate to<br />
remark that the State of solid waste management in <strong>Myanmar</strong> is stabilizing in general. Owing to<br />
the fact that solid waste collection in other GMS countries is found to be almost 100 % in Bangkok<br />
(Thailand) and 76% in the major cities of Viet Nam, the level of solid waste collection in <strong>Myanmar</strong><br />
is considered to be relatively poor. However, improvement in data collection and analysis is required<br />
for generating systematic and consistent technical information related to solid waste management<br />
in order of understanding the real “State” of the sector concerned.<br />
210
Indicator ID<br />
Indicator Name<br />
Greater Mekong Subregion<br />
Indicator Fact Sheet<br />
DATABASE INFORMATION<br />
Year of <strong>Assessment</strong> 2005<br />
Type of Indicator Pressure<br />
Frequently Asked Question (FAQ)<br />
211<br />
Municipal Solid Waste Generated in Yangon City<br />
- 1983 to 2004<br />
What is the magnitude and trend of solid waste<br />
generated in Yangon Municipality?<br />
Priority Concern Inadequate Solid Waste Management<br />
Geographic Area Union of <strong>Myanmar</strong><br />
Magnitude & Trend Medium and Steady<br />
Key Message<br />
By 2003/2004, the daily amount of solid waste<br />
generated in Yangon City was about 1435 tons per<br />
day and 6% higher than that of the 1991 level but<br />
slightly lower than that of 2000. Therefore, solid<br />
waste generation is steady in <strong>Myanmar</strong> and the<br />
level of pressure is medium as the daily amount<br />
of solid waste of about 1,400 ton falls well within<br />
the range of about 100 tons/day in Vientiane,<br />
Lao PDR to 6000 tons in Bangkok.
TECHNICAL INFORMATION<br />
A. Definition<br />
This indicator attempts to track the amount of solid waste generated per person per day (per<br />
capita solid waste generated) as well as the daily amount of municipal solid waste generated in<br />
Yangon. Municipal solid waste is defined as “non gaseous and non-liquid waste that result from the<br />
daily activities of community’s residential and commercial sector within the given administrative<br />
urban area”. The generation of municipal solid waste is derived from the production of waste on a<br />
weight basis at the point of production. It is measured in Tons per day. For per capita solid waste<br />
generated the unit of measurement in kilogram per person per day.<br />
B. Data Source<br />
The following are sources of data for development of this indicator:<br />
Population Related Data<br />
Immigration and Manpower Department.1986. Rangoon City – 1983 Population Census. Ministry of<br />
Home and Religious Affairs, the Socialist Republic of the Union of Burma, Rangoon.<br />
DOP.2005. Amendment of Population Data in EPA <strong>Report</strong>. Submission of Department of Population<br />
to <strong>National</strong> Commission for <strong>Environmental</strong> Affairs, Reference Letter No: 300/15 (0011)/ La-Pa-Na<br />
Dated 31 October 2005, Yangon.<br />
CSO. 2002. Statistical Yearbook 2002. Central Statistical Organization, the Government of the<br />
Union of <strong>Myanmar</strong>, Yangon.<br />
Solid Waste Related Data<br />
YCDC. 2005. Data related to environmental indicator development for national performance<br />
assessment. Submission to NCEA by Pollution Control and Cleansing Department of Yangon City<br />
Development Committee, Reference Letter No: 109/01(322)/Sa-Tha-Ka dated 8 February 2005<br />
Yangon.<br />
Khin Maung. 1995. Solid Waste Management at the City of Yangon for Sustained Urban<br />
Development. Technical paper presented in <strong>National</strong> Conference on <strong>Environmental</strong> Management<br />
organized by <strong>National</strong> Commission for <strong>Environmental</strong> Affairs (NCEA) in cooperation with Hanns<br />
Seidel Foundation – 28-30 August 1995, NCEA/HSF DOC.No.15, Yangon.<br />
Yamauchi, Hisashi. and Sato, Shinsuke. 2001. Related solid waste data of Yangon City for<br />
2000, Daw Khin Win; Quoted in “Final <strong>Report</strong> on Planning and Techniques for Solid Waste Disposal<br />
in Yangon City, the Union of <strong>Myanmar</strong>”, Japan International Cooperation Agency (JICA) and Yangon<br />
City Development Committee (YCDC), Yangon<br />
C. Geographic Area / Population Coverage<br />
The indicator data is focused on solid waste generation in the capital city of Yangon; however<br />
the fact sheet includes supplemental data for waste generation for the Union of <strong>Myanmar</strong> as a<br />
whole.<br />
D. Temporal Coverage<br />
For Yangon city, waste generation data is for the period 1983-84 to 2003/04. For State and<br />
Division waste generation, solid waste generation in 1998 is compared with that of 2003.<br />
E. Methodology and Frequency of Coverage<br />
In the case of Yangon Capital, existing data only allows for the analysis of situations in four<br />
different years 1983, 1991, 2000 and 2003-04 within 20 years interval from 1983/84 to 2003/04.<br />
The rate of solid waste generation and daily-generated amount for budget year 2003 and 2004<br />
were according to the official estimation made by concerned government department, Pollution<br />
Control and Cleansing<br />
Department (PCCD) of Yangon City Development Committee (YCDC), based on their sampling<br />
data and owned analysis. For 2000, generation rate and total daily amount were directly<br />
212
from a previous report made by YCDC together with Japan International Cooperation Agency (JICA)<br />
for the study of “Planning and Technique for Solid Waste Management in Yangon. For 1991 and<br />
1983, the rate of solid waste generation was calculated as stated below in “Data Manipulation”<br />
based on data obtained from published data of U Khin Maung, former head of PCCD/YCDC. When<br />
calculation was made for estimating the annual amount of solid waste generated in State and<br />
Division, the situations of Yangon and Mandalay Cities were excluded. Their situation is not<br />
comparable with the data obtained from Department of Development Affairs, which is an agency<br />
responsible for solid waste management in urban areas of all State and Division other than those<br />
cities. The population figures, which are crucial for calculating solid waste generation, are obtained<br />
from many sources using different methodology and frequency of coverage. Yangon city population<br />
for 1983 is excerpted from the national census report and data for 1991, 2000 and 2003/04 were<br />
based on data of Department of Population (DOP). Urban Populations of State and Division<br />
(without Yangon and Mandalay City Population) are also obtained from estimations by the DOP.<br />
F.Methodology of Data Manipulation<br />
From the report of Khin Maung (1995), the rate of solid waste generation for 1991 was calculated<br />
by tracing back data available for the percentage of daily collection and total collected amount of<br />
solid waste. An assumption was made for 1983 that the rate of solid waste generation was same as<br />
that of 1991. The calculation was not made for 2000 and 2003/04 as data were available from the<br />
concerned department and report.<br />
For estimating the solid waste generation rate of State and Division, the rate of per capita solid<br />
waste generation for the 2000 level of Yangon Capital was used as referenced data. Adjustment was<br />
then made for each State and Division by discounting the referenced rate with the differences/<br />
variations they have in monthly average household expenditure, which is hereby assumed as a basic<br />
determinant for the level of household garbage daily produced, compared to the level of Yangon<br />
Capital.<br />
213
QUALITATIVE INFORMATION<br />
A. Strength and Weakness (data level)<br />
This indicator is useful in determining the workload and nature of solid waste management to<br />
be tackled effectively and efficiently for sustainable urban environment. However, it is expensive and<br />
difficult to measure. Seasonal variation may also exist in waste density and volume due to the effect<br />
of differences in storage method and change in moisture content.<br />
B. Reliability, Accuracy, Robustness, Uncertainty (data level)<br />
As many assumptions were utilized in developing this indicative value, its reliability will be<br />
subject to a closer degree of association of these assumptions to the real situation, which is<br />
currently unknown due to a lack of basic data. The robustness of the data will be enhanced when<br />
the following conditions are met:<br />
Time series data of waste generation collected by PCCD/YCDC has been maintained punctually and<br />
improved statistically for several years. Actual population figures have been known for suburban<br />
areas of studied Towns and Capitals.<br />
C.Future Work Required (for data level and indicator level)<br />
Time series data should be maintained by the concerned department for statistically<br />
improving the data consistency and relevancy as far as solid waste generation rate is concerned. If<br />
data could be analyzed for the suburban areas or various urban centers, this will be helpful for<br />
realizing the nature of complexity in waste generation by different activities. The composition of<br />
generated waste should be also studied punctually from time to time in order to understand the<br />
relationship between the waste generated and the change of consumption patterns. This will be<br />
helpful for developing further strategy on waste minimization and waste collection method.<br />
Collaboration should be also made among the concerned agencies for consolidating the official<br />
figures of the urban population, not only for the purpose of solid waste management but also for<br />
other purposes of sustainable urban development.<br />
214
SUPPORTING DATA TABLES, GRAPHS AND MAPS<br />
Figure 1: Municipal Solid Waste Generated in Yangon City 1983-2004<br />
Table 1a: Daily Generated Solid Waste by Type in Yangon City<br />
Particular 1983 1991 2000 2003/04<br />
Per Capita Solid Waste Generation - Kg/person/day 0.405 0.405 0.395 0.312<br />
Households waste generated - ton/day 1,018 1,206 895 n.a.<br />
Commercial waste generated - ton/day n.a. n.a. 167 n.a.<br />
Market waste generated - ton/day n.a. 20 216 n.a.<br />
Street waste generated - ton/day n.a. n.a. 85 n.a.<br />
Other wastes unspecified & generated - ton/day n.a. 120 94 n.a.<br />
Total amount of solid waste generated - ton/day 1,018 1,346 1,457 1,435<br />
Note: YCDC = Yangon City Development Committee, JICA = Japanese International Cooperation Agency, n.a. = not<br />
available<br />
• Data for the years 2000 and 2003-2004 were directly quoted from JICA & YCDC Study, and data provided by YCDC to<br />
<strong>National</strong> Commission for <strong>Environmental</strong> Affairs (NCEA) for environmental indicator development.<br />
• Data for 1991 and 1983 were derived based on YCDC quoted in Khan Muang (1995). It was assumed that there were<br />
same rates of Per capita solid waste generation for 1983 and 1991. Total amount of solid waste daily generated was<br />
calculated by multiplying per capita solid waste generation into urban population of respective years – 2.51 million (1983)<br />
and 2.98 million (1991).<br />
Source: Immigration and Manpower Department (1986), YCDC quoted in Khan Muang (1995), Dawn Khan Win quoted in Yamauchi,<br />
Hibachi & Sato, Shinseki (2001), YCDC (2005) and DOP (2005)<br />
215
No Township District<br />
Table 1b: Calculated Solid Waste Generation<br />
Rate from Available Data for 1991<br />
Amount of<br />
Solid Waste<br />
Collection in<br />
1991 (ton/day)<br />
Collected Solid<br />
Waste As % of<br />
Daily Generation<br />
216<br />
solid waste<br />
generation in<br />
1991 kg/day<br />
Urban<br />
Population<br />
in 1991<br />
Per capita<br />
generation<br />
kg/cap/day<br />
1 Thingangyun East 9 13% 69,231 230,101 0.30<br />
2 North Oakkalapa<br />
3 South Oakkalapa<br />
East 6 8% 75,000 226,317 0.33<br />
East 21 unknown 21,000 217,263- unknown<br />
4 South Dagon East no service unknown - unknown<br />
5 North Dagon East no service unknown - unknown<br />
6 East Dagon East no service unknown - unknown<br />
7 Thaketa East 4 6% 66,667 228,830 0.29<br />
8 Dawbon East 9 unknown 9,000 59,233 unknown<br />
9 Mingalar East<br />
10 Tarmwe East 29 50% 58,000 142,159 0.41<br />
11 Yankin East 14 unknown 14,000 97,979<br />
12 Dagon Seikan<br />
(E/Dagon)<br />
East no service unknown - unknown<br />
13 Bo-ta-htaung East 21 100% 21,000 58,279 0.36<br />
14 Pazundaung East 20 100% 2,000 46,004 0.43<br />
15 Lanmadaw West 23 100% 23,000 49,391 0.47<br />
16 Lathar West 15 100% 15,000 36,825 0.41<br />
17 Pabedan West 30 100% 30,000 49,700 0.60<br />
18 Kyauk-ta-da West 28 100% 28,000 44,617 0.63<br />
19 Kamayut West 19 50% 38,000 89,122 0.43<br />
20 Hlaing West 16 29% 55,172 203,530 0.27<br />
21 Mayangone West 15 28% 53,571 180,916 0.30<br />
22 Ahlone West 9 50% 18,000 61,466 0.29<br />
23 Sanchaung West 25 75% 33,333 81,643 0.41<br />
24 Dagon West 12 50% 24,000 42,128 0.57<br />
25 Kyee Myin<br />
Daing<br />
West 22 50% 44,000 82,827 0.53<br />
26 Bahan West 30 50% 60,000 121,050 0.50<br />
27 Seikkan West 3 unknown 3,000 6,262 unknown<br />
28 Mingalardon North no service unknown 147,759 unknown<br />
29 Hlaing-tharyar<br />
30 Shwe Pyi<br />
Thar<br />
North no service unknown - unknown<br />
North unknown unknown - unknown<br />
31 Insein North 13 19% 68,421 262,346 0.26<br />
32 Dala South no service unknown 64,212 unknown<br />
33 Seikgyi-khanaung-to<br />
South no service unknown 18,247 unknown
Sum of per capita solid waste daily generation for 20 townships 8.10<br />
Average rate of waste generation - kg/cap/day in 1990/91 0.405<br />
Note: Per capita solid waste generation rate was backward calculated based on information available for percentage of<br />
solid waste collection amount of solid waste daily collected and urban population in respective townships of Yangon City.<br />
Source: YCDC quoted in Khin Maung (1995), DOP (2005)<br />
Figure 2: Volume of Solid Waste Generated in Urban Area of State &<br />
Division – 1998 and 2003 (excluding Yangon and Mandalay City)<br />
217
Table 2a: Figure 2: Volume of Solid Waste Generated in Urban Area of State<br />
& Division – 1998 and 2003 (excluding Yangon and Mandalay City)<br />
State/Division<br />
Urban Population a Household Waste Generation<br />
1998 2003<br />
218<br />
Rate b<br />
(kg/person/day)<br />
1998<br />
(ton/year)<br />
2003<br />
(ton/year)<br />
Kachin 309,527 382,913 0.343 38,735 47,919<br />
Kayah 81,924 98,043 0.242 7,251 8,678<br />
Kayin 180,353 230,274 0.377 24,831 31,704<br />
Chin 89,223 105,033 0.317 10,310 12,137<br />
Sagain 953,316 1,068,070 0.290 101,042 113,205<br />
Tanintharyi 379,856 446,445 0.431 59,733 70,204<br />
Bago 1,208,730 1,333,291 0.311 137,159 151,294<br />
Magway 835,200 933,412 0.248 75,713 84,616<br />
Mandalay 1,346,590 1,624,789 0.220 108,206 130,561<br />
Mon 827,698 936,119 0.281 84,873 95,990<br />
Rakhine 509,466 573,456 0.304 56,589 63,697<br />
Yangon 481,004 611,324 0.395 69,349 88,138<br />
Shan 1,094,324 1,310,744 0.339 135,336 162,100<br />
Ayeyarwaddy 1,221,413 1,342,780 0.277 123,296 135,548<br />
Union Total 9,518,624 10,996,693 1,032,423 1,195,791<br />
Note:<br />
(a) –.Urban population is received from Department of Population (2005). Yangon and Mandalay City Population are<br />
excluded from estimation for Urban Population in Yangon and Mandalay Division<br />
(b) – is meant for per capita solid waste generation as calculated in Table 2b. It is also assumed that there was the same<br />
rate of solid waste generation between 1998 and 2003.
Administrative<br />
Districts<br />
Figure 3: Typical Composition of Solid Waste in<br />
Capital Yangon 2003/04<br />
Table 3: Population in Yangon City 1983 to 2003/04<br />
1983 (Census) 1991 (DOP) 2000 (DOP) 2003/04 (DOP)<br />
Eastern Yangon 1,212,233 1,437,085 1,942,989 n.a.<br />
Western Yangon 885,271 1,049,477 986,408 n.a.<br />
Northern Yangon 345,959 410,105 817,694 n.a.<br />
Southern Yangon 69,560 82,459 107,348 n.a.<br />
Yangon City Total 2,513,023 2,979,126 3,854,439 4,111,524<br />
Note: n.a. = not available. Census = <strong>National</strong> Population Census of 1983 quoted in Immigration and Manpower<br />
Department (1986), DOP = Department of Population.<br />
Source: Immigration and Manpower Department (1986) and DOP (2005).<br />
219
SUMMARY<br />
A. Policy Reference<br />
1. Purpose:<br />
The main purpose of this indicator and this fact sheet is to better understand the level of<br />
workload that urban authorities are facing in managing solid waste effectively in their municipal<br />
area.<br />
2.Relevance to Environment Planning and Management:<br />
Generation of waste as an indicator is intimately linked to the level of economic activity in the<br />
country. It is also an indication of the patterns of consumption of raw materials. Wealthier<br />
economies tend to produce more waste. The reduction in the volume of waste generated is an<br />
indication of changes in consumption patterns with respect to raw materials and increase in<br />
recycling and reuse.<br />
3.Linkage to Other Indicators:<br />
This indicator is intimately linked to other socio-economic and environmental indicators<br />
especially those related to income-level and economic growth. Those would include; rate of growth<br />
of urban population, gross domestic products (GDP) per capita, waste disposal and waste<br />
recycling.<br />
4.Targets:<br />
There is currently no quantitative target set in reduction of solid waste generation in <strong>Myanmar</strong>.<br />
5. International Environment Treaties:<br />
No international agreements exist for reduction in solid waste production.<br />
B. Analysis<br />
From the best available data, the total amount of solid waste daily generated by Yangon<br />
Capital and the respective rate of solid waste generation per capita per day are shown in figure 1<br />
and table 1. According to data provided by Pollution Control and Cleansing Department PCCD of<br />
Yangon City Development Committee (YCDC) for year 2003/04, the volume of solid waste daily<br />
generated has been reduced to 0.312 kg/ person/day from 0.395 kg/person/day in year 2000 and<br />
0.4 kg/person/day in both 1991 and 1983.<br />
It seems that the increases in GDP growth and per capita income during the last decade have not<br />
resulted in an increase in the volume of waste generated by a change in the pattern of individual<br />
consumption. The recent strenuous effort of PCCD in collecting taxes on domestic waste<br />
management might have led urban dwellers to minimize waste generation. Due to the lack of data,<br />
these facts and their correlation are not analyzed further in the EPA.<br />
Despite the reduction in per capita waste generation, the total amount of waste daily generated in<br />
Yangon Capital has increased as the urban population has grown. Within twenty years, the<br />
daily-generated waste amount has increased from 1018 tons per day in 1983 to 1,435 tons per day<br />
in 2003/04, an increase of almost 29%l.<br />
As can be observed in Figure 3, typical compositions of solid waste are governed by bio-degradable<br />
materials such as paper and textiles (7%), and food refuse (77%). Due to a lack of data, a trend in<br />
changes of waste composition could not be observed during the EPA.<br />
An estimation of per capita solid waste generation for State and Division was also given in Table<br />
2b. By using the percentage of the variation in household expenditure level in comparison to the<br />
Yangon level, solid waste generation was derived for each and every State and Division based on<br />
per capita daily waste generation of Yangon Capital. Then, total amount of municipal solid waste<br />
generated per year was calculated in Table 2a for all State and Division excluding data for urban<br />
220
area of Yangon and Mandalay Capitals. As shown in Figure 2, it is observed that Mandalay, Shan,<br />
Sagaing, Bago and Ayeyarwady are the areas where the highest volumes of solid waste were<br />
generated among the sub-national administrative units of <strong>Myanmar</strong>. Similar to Yangon Capital, the<br />
total amount of solid waste generated by year 2003 is higher than that of year 1998.<br />
As seen in both case of Yangon City and other States and Divisions, the trend of solid waste<br />
generation has been steadily increasing and creating consistent pressure on solid waste<br />
management. Nevertheless, the level of pressure appears to be medium in comparison with other<br />
GMS countries because solid waste generation was found to be 104 tons/day in Vientiane/Lao PDR<br />
(1998) and nearly 6000 tons/day in Bangkok (1998).<br />
221
Indicator ID<br />
Indicator Name<br />
Greater Mekong Subregion<br />
Indicator Fact Sheet<br />
DATABASE INFORMATION<br />
Year of <strong>Assessment</strong> 2005<br />
Type of Indicator Response<br />
Frequently Asked Question (FAQ)<br />
222<br />
Expenditure on Solid Waste Management in<br />
Yangon City 1994 – 2004<br />
How effectively have financial resources been<br />
utilized in improving solid waste management in<br />
Yangon?<br />
Priority Concern Inadequate Solid Waste Management<br />
Geographic Area Union of <strong>Myanmar</strong><br />
Impact & Trend Average and Consistent<br />
Key Message<br />
At the 1994 constant price level, financial<br />
management for solid waste management in<br />
Yangon city has been significantly improved within<br />
the last ten years in terms of allocating more<br />
financial resources (4.5 times the 1994 level) and<br />
effort made in collecting more revenue from waste<br />
collection and disposal for better financial<br />
viability. However, the rate of solid waste<br />
collection is still modest level and there is a room<br />
to improve its collection, disposal and treatment.<br />
Thus, the response to selected environmental<br />
concerns is seen to be average by this indicator.
TECHNICAL INFORMATION<br />
A. Definition<br />
This indicator attempts to track the amount of expenditure annually spent by Yangon City<br />
Development Committee for managing solid waste management effectively in Yangon city. Unit of<br />
measurement is the value of money in Kyat at the constant price of 1994’s base year.<br />
The expenditure on urban solid waste management is the amount of money spent on the provision<br />
of public services for solid waste management by concerned authority, Pollution Control and<br />
Cleansing Department of Yangon City Development Committee.<br />
Solid waste management is the generic term for planning, implementation, supervision and<br />
monitoring of the activities related to collection, disposal, recycling and treatment of municipal solid<br />
waste. The following are definitions for different categories of expenditure.<br />
Capital Investment – this is expenditure incurred for purchasing of heavy machinery, equipment,<br />
transportation facility and for developing the sites and premises for waste disposal, dumping, land<br />
filling, incineration and treatment.<br />
Waste Operation – this is mostly related to the cost incurred for hiring daily waged labor for waste<br />
collection and cleansing the road. The cost spent for fueling of transport facility is also included.<br />
Personnel – this is mainly for the payment of salary and remuneration to permanent staffs appointed<br />
for solid waste operation and management<br />
Administration – this is the cost related to running the office and documentation.<br />
Maintenance and other – this is related to the cost of maintaining the facility, equipment and<br />
transportation facilities of solid waste management including the money spent for miscellaneous<br />
items.The following are definitions for different categories of revenue.<br />
Revenue from household waste – this is the sum of taxes collected from every residential households<br />
of the administrative urban area on a monthly basis for collecting household waste.<br />
Revenue from commercial waste – this is the sum of both taxes and charges for collection and<br />
disposal of waste from commercial activities and enterprises such as restaurant, shops, hotels and<br />
markets.<br />
Revenue from Hospital waste and others - this is the sum of charges for collection of waste from<br />
hospital and medical clinic. The charges for special collections requested by customers are also<br />
included.<br />
B. Data Source<br />
The overall budget and revenue data for 1994 to 1999 were received from a previous report<br />
from a joint study done by the Japanese International Cooperation Agency and Pollution Control and<br />
Cleansing Department (PCCD) of Yangon City Development Committee. The annual budget/<br />
expenditure with the break down for itemized categories from 2000 to the most recent budget year<br />
of 2003-04 were obtained from the reference data submitted by PCCD to the <strong>National</strong><br />
Commission for <strong>Environmental</strong> Affairs (NCEA) of <strong>Myanmar</strong> for the use in EPA exercise. The<br />
reference data for consumer price index were based on the <strong>National</strong> Statistical Yearbooks (1997,<br />
2002) of Central Statistical Organization (CSO) of <strong>Myanmar</strong>. City Population data were<br />
obtained from Department of Population (Ref:300/15(0011)/La-Pa-Na dated October 31 2005).<br />
C. Geographic Area / Population Coverage<br />
The data and the indicator only cover the expenditure of the concerned municipal authority for<br />
Yangon City.<br />
223
D. Temporal Coverage<br />
The figure for total expenditure applies only to the period from 1994 to 1999. The expenditure<br />
with break down category applies to the year 2000 to the recent budget year of 2003/2004.<br />
E. Methodology and Frequency of Coverage<br />
The expenditure data are for the period of budget year, which start from 1 April to 31 March<br />
of the incoming year. The value of the expenditure is calculated by the prevailing price level of the<br />
respective budget year.<br />
F. Methodology of Data Manipulation<br />
The expenditure is converted into nominal value by using the 1994 constant price level which<br />
was derived from the reference data of CSO’s consumer price index based on the 1985-86 constant<br />
price level. Net cash flow was also calculated by subtracting the total expenditure from the total<br />
revenue of respective years.<br />
QUALITATIVE INFORMATION<br />
A. Strength and Weakness (data level)<br />
The indicator provides the scenario of financial resource actually available and committed<br />
for solid waste management over time by taking into consideration its inflated value. When it is<br />
compared with the amount of revenue generated from solid waste management, financial viability<br />
could be analyzed for efficiency and adequacy of urban solid waste management in the long-term.<br />
However, the data do not support fully for the analysis of expenditure incurred for important<br />
operations of solid waste collection, disposal, transportation and treatment. As data are only<br />
available for Yangon city, it limits the understanding of the overall national responses to solid waste<br />
management throughout the country.<br />
B. Reliability, Accuracy, Robustness, Uncertainty (data level)<br />
Since the data are compiled from precise information of financial reports, their accuracy and<br />
reliability is considered to be high.<br />
C.Future Work Required (for data level and indicator level)<br />
For comprehensive analysis, the data for Yangon City should be broken down into important<br />
solid waste management operations such as waste collection, disposal, transportation and<br />
treatment. The data from the Department of Development Affairs should be also collected for the<br />
expenditure incurred by respective township municipal authorities across all States and Divisions.<br />
224
SUPPORTING DATA TABLES, GRAPHS AND MAPS<br />
Figure 1a: Annual Revenue and Expenditure of Solid Waste Management<br />
in Capital Yangon at 1994 Constant Price Level (Million Kyat)<br />
Figure 1b: Level of Financial Subsidy (Net Cash Flow of Expenditure<br />
versus Revenue) for Solid Waste Management in Capital Yangon<br />
(at 1994 Constant Price Level) (Million Kyat)<br />
225
Table 1a. Annual Revenue and Expenditure for Solid<br />
Waste Management in Capital Yangon (Million Kyat)<br />
Year Annual Expenditure Annual Revenue<br />
226<br />
Consumer Price Index at<br />
1994 Price Level<br />
1994 69.3 57.5 100.000<br />
1995 100.8 100.7 121.842<br />
1996 126.9 99.7 146.243<br />
1997 189.8 219.6 150.045<br />
1998 250.2 229.8 195.193<br />
1999 299.3 271.5 225.733<br />
2000 433.0 313.0 221.843<br />
2001 668.9 374.2 298.378<br />
2002 1094.9 588.3 471.756<br />
2003/04 1208.9 983.6 401.519<br />
Source: Yangon City Development Committee (2005), Statistical Yearbooks 1997 and 2002<br />
Table 1b. Annual Revenue and Expenditure of Solid Waste Management in<br />
Capital Yangon at 1994 Constant Price Level (Million Kyat)<br />
Year Annual Expenditure Annual Revenue Net Cash Flow<br />
1994 69.3 57.5 -11.8<br />
1995 82.7 82.6 0.0<br />
1996 86.8 68.2 -18.6<br />
1997 126.5 146.4 19.9<br />
1998 128.2 117.8 -10.4<br />
1999 132.6 120.3 -12.3<br />
2000 195.2 141.1 -54.1<br />
2001 224.2 125.4 -98.8<br />
2002 232.1 124.7 -107.4<br />
2003/04 301.1 245.0 -56.1<br />
Source: Yangon City Development Committee (2005)
Figure 2a: Percentage Change in Expenditure and<br />
Revenue to Year 2000 Level<br />
Figure 2b: Itemized Expenditure in Solid Waste Management of<br />
Capital Yangon (at 1994 Constant Price Level – Million Kyat)<br />
227
Table 2a: Itemized Expenditure on Solid Waste Management in<br />
Capital Yangon (at 1994 Constant Price Level - Million Kyat)<br />
No. Expenditure Item 2000 2001 2002 2003/04<br />
A Capital investment in facility 0.0 9.9 8.6 0.0<br />
B Waste Operation 40.3 47.8 128.6 187.4<br />
C Personnel 103.1 125.9 57.4 72.9<br />
D Administration 30.7 25.4 14.2 21.0<br />
E Maintenance and Others 21.0 15.3 23.2 19.8<br />
F Total Expenditure 195.2 224.2 232.1 301.1<br />
G Percent changed as of year 2000<br />
level<br />
Source: Yangon City Development Committee (2005)<br />
100% 15% 19% 54%<br />
Table 2b: Itemized Expenditure on Solid Waste<br />
Management in Capital Yangon (Million Kyat)<br />
No. Expenditure Item 2000 2001 2002 2003/04<br />
A Capital investment in facility 0 29.45 40.75 0<br />
B Waste Operation 89.44 142.7 606.81 752.46<br />
C Personnel 228.83 375.56 270.87 292.68<br />
D Administration 68.1 75.65 67.01 84.21<br />
E Maintenance and Others 46.63 45.54 109.43 79.51<br />
Total Expenditure 433 668.9 1094.87 1208.86<br />
Source: Yangon City Development Committee (2005)<br />
Table 2c: Revenue by Sources from Solid Waste Management in<br />
Capital Yangon (at 1994 Constant Price Level – Million Kyat)<br />
No. Revenue Item 2000 2001 2002 2003/04<br />
A Household Waste (1.0 - 2.-0 Kyat/<br />
day)<br />
B Commercial Waste (200 - 225000<br />
Kyat/,month)<br />
C Hospital Waste (600 - 150000 Kyat/<br />
month)<br />
43.5 31.7 20.9 24.9<br />
69.1 57.3 73.8 166.4<br />
n.a. 4.2 2.8 3.4<br />
D Others 28.6 32.2 27.3 50.3<br />
E Total Revenue 141.1 125.4 124.7 245.0<br />
F Percent changed as of year 2000<br />
level<br />
100% -11% -12% 74%<br />
Source: Yangon City Development Committee (2005)<br />
228
Figure 2b: Revenue by sources in Solid Waste Management of<br />
Capital Yangon (at 1994 Constant Price Level – Million Kyat)<br />
Table 2d: Revenue by Sources from Solid Waste<br />
Management in Capital Yangon (Million Kyat)<br />
No. Revenue Item 2000 2001 2002 2003/04<br />
A Household Waste (1.0 - 2.-0 Kyat/<br />
day)<br />
B Commercial Waste (200 - 225000<br />
Kyat/,month)<br />
C Hospital Waste (600 - 150000 Kyat/<br />
month)<br />
96.42 94.64 98.43 99.81<br />
153.19 170.99 348.17 668.15<br />
229<br />
n.a. 12.41 13.01 13.85<br />
D Others 63.36 96.18 128.69 201.81<br />
Total Revenue 312.97 374.22 588.3 983.62<br />
Source: Yangon City Development Committee (2005)<br />
Table 3: Cost Recovery and Subsidiary on Per Unit Solid Waste Collected<br />
No. Description 2000 2001 2002 2003/04<br />
A Total Revenue 312.97 374.22 588.30 983.62<br />
B Total Expenditure 433.00 668.90 1094.87 1208.86<br />
C Net Financial Flow -120.03 -294.68 -506.57 -225.24<br />
D Consumer Price Index at Year 1994<br />
Constant Price<br />
E Net Financial Flow at Year 1994 Constant<br />
Price<br />
F Total collected and disposed solid<br />
waste (ton/year)<br />
G Subsidiary cost per collected waste<br />
(kyat/ton)<br />
Source: Yangon City Development Committee (2005)<br />
221.843 298.378 471.756 401.519<br />
-54.106 -98.761 -107.380 -56.097<br />
142,400 n.a. n.a. 419,750<br />
(379.96) n.a. n.a. (133.64)
Table 4. Level of Solid Waste Management in Capital Yangon<br />
No. Particular 1983 1990 2000 2003/04<br />
A Total City Population 2,513,023 2,921,521 3,854,439 4,111,524<br />
B Total solid waste collected (ton/day) 400 564 787 1150<br />
C No of sanitation worker for manual<br />
waste collection<br />
D No of urban dwellers per sanitation<br />
worker (persons)<br />
1700 4170 3266 4,469<br />
1,478 701 1,180 1029<br />
E Solid waste to be handled by one<br />
worker (ton/worker/day)<br />
0.235 0.135 0.241 0.257<br />
F Maximum Waste Handling Capacity<br />
by Facility (ton/day)<br />
450 800 979 1150<br />
Source: Yangon City Development Committee quoted in Khin Maung (1995), Yamauchi, Hisashi. and Sato, Shinsuke. (2001), Yangon City<br />
Development Committee (2005), and DOP (2005)<br />
230
SUMMARY<br />
A.Policy Reference<br />
1.Purpose:<br />
The main purpose of this indicator is to give an indication of the type and level of service<br />
that the city authority provides for waste management and the relative importance that it attaches<br />
to waste management in relation to other services. It is also an indication of the efficiency of the<br />
waste<br />
collection services.<br />
2.Relevance to Environment Planning and Management:<br />
This is an important factor in determining the commitment toward sustainable urban<br />
development and improving environmental safety net of citizens in accordance with the national<br />
health policy. If waste is not handled properly, there is a significant level of deterioration in public<br />
health and the living environment which results in a loss in productivity and reduced economic<br />
output.<br />
3.Linkage to Other Indicators:<br />
This indicator is linked to GDP per capita, other environmental protection expenditure, and<br />
those associated with the generation, disposal, and recycling of waste.<br />
B.Analysis<br />
Although there is no quantifiable policy target set for solid waste management in <strong>Myanmar</strong>, the<br />
overriding statement of the goal for “Green City and Free Garbage” may well serve as a target to<br />
keep the best service of solid waste management by the concerned authority. How far<br />
commitments have been made in terms of allocating financial resources to achieve this goal has<br />
been the focus of this EPA for reviewing the performance related to solid waste management.<br />
Because of data deficiency, only Yangon has been studied.<br />
The nominal value of annual expenditure and revenue were available for the period from 1994 to<br />
the budget year of 2003/2004 (Table 1a) and they were converted into the nominal value at the<br />
1994 constant price level by using the consumer price index of Central Statistical Organization.<br />
As observed in Table 1b, financial allocation has been annually made more available to solid waste<br />
management in Yangon Capital. Total expenditure for 1994 was merely 69 million kyats but it<br />
reached to 300 million kyats in 2003. It is almost four and half fold higher than the expenditure<br />
level of 1994. An especially sharper increase of budget expenditure occurred after year 2000. In<br />
the mean time, the level of revenue annually collected has been raised from 58 million kyats in<br />
1994 to 245 million kyats in 2003, although there were slightly fluctuations in some years during<br />
the same period. It indicates the increased efficiency in the collection of revenue by the concerned<br />
department of PCCD/YCDC in recent years. Therefore, as shown in Figure 2a, revenue collected in<br />
2003 is 74% higher than that of 2000 level whereas gradual rises of expenditure in comparison to<br />
the 2000 level were 15% in 2001, 19% in 2002 and 54% in 2003. By keeping the trend of<br />
revenue above the expenditure, the best expectation would be that financial subsidiary for solid<br />
waste management could be reduced to an acceptable level for enhancing the capacity of the<br />
concerned agency to manage solid waste adequately. This will be an important aspect for financial<br />
viability of solid waste management because subsidizing all the time as observed in figure 1b may<br />
be disadvantageous to the management resources in the long term.<br />
The nature of expenditure is further analyzed in the EPA with the data available for the<br />
expenditure incurred for the various cost items during the period of 2000 to 2003/04 budget year.<br />
As of the 1994 constant price level (as shown in Table 2a), the operation cost for waste handling<br />
(labor wages for<br />
231
collection and disposal) had been constantly increasing while the administrative cost was almost<br />
stable without much change and personnel cost for permanent technical and operational staffs<br />
has declined. There was no capital expenditure incurred for infrastructure development and facility<br />
improvement in year 2000 and 2003/04. Only a few million kyats had been spent for this purpose<br />
in 2001 and 2002. In other words, total expenditure has been mostly incurred for waste collection<br />
and the cost of waste treatment was minimal. As the preferred trend should reverse this situation,<br />
more investment should be made available to solid waste management for reducing the<br />
environmental impact from solid waste. However, it should be recognized that increased spending<br />
on reinforcing the work force for improving efficiency in waste collection has been made by<br />
recruiting more staff to 4,469 employees in year 2003, whereas the total number of employed<br />
sanitary wage staff were 1700, 4170 and 3266 persons for 1983, 1990 and 2000 respectively<br />
(Table 4).However, it has not helped to reduce the work load of each sanitary worker for better<br />
efficiency in manual collection of waste, although the number of urban residents per one labor<br />
becomes less in recent years. The minimal amount of solid waste one waste collector has to handle<br />
daily was 0.257 tons in 2003/04 in comparison to 0.235 tons in 1983, 0.135 tons in 1990 and<br />
0.241 tons in 2000.From the data available, the revenue by sources at the 1994 constant price<br />
level was given for year 2000 to 2003/04 in Table 2c. There are four main sources of revenue;<br />
namely - (a) revenue from collection of household waste at the rate ranging from 1 to 2 kyat per<br />
day, (b) revenue from collection of commercial waste at the rate ranging from 200 to 225,000 kyat<br />
per month,<br />
(c) revenue from collection of hospital waste at a rate ranging from 600 to 150,000 kyat per<br />
month, and (d) revenue from other sources. As observed in Figure 2b, outstanding performance<br />
has been seen in the collection of revenue from commercial waste collection and disposal with the<br />
sharper rise of revenue amount at a nominal price level to 245 million kyats in 2003/04 from 141<br />
million kyats in 2000. With the due diligence of the concerned authority (PCCD/YCDC), improvement<br />
in revenue generation has reduced the financial burden of subsidizing solid waste management<br />
to 56 million kyats in 2003 from 107 million kyats in 2002. In comparison, a subsidy of only<br />
134 kyats per ton of collected waste was required by the year 2003, in comparison to 380 kyats<br />
per ton in 2000.In summary the response over environmental concern in inadequate solid waste<br />
management has improved in recent year in terms of allocating more financial resources and<br />
enhancing financial viability conducive to increased solid waste collection rate. Therefore, there is a<br />
consistent trend in responding to selected environmental concerns, although the level of<br />
performance is rankedaverage as the present rate of solid waste collection is at a modest level and<br />
there is room to improve further in the collection and sanitary treatment of collected and disposed<br />
wastes.<br />
232
Indicator ID<br />
Greater Mekong Subregion<br />
Indicator Fact Sheet<br />
DATABASE INFORMATION<br />
Indicator Name TSP Concentrations in Yangon City 1998 - 2000<br />
Year of <strong>Assessment</strong> 2005<br />
Type of Indicator State<br />
Frequently Asked Question (FAQ)<br />
233<br />
What is the level of air pollution in urban areas<br />
created by motor vehicles?<br />
Priority Concern Mobile Source Air Pollution<br />
Geographic Area Union of <strong>Myanmar</strong><br />
State & Trend Relatively Poor with Undetermined Trend<br />
Key Message<br />
From different research studies for different<br />
temporal coverage, the concentration of Total<br />
Suspended Particulate (TSP) matter was higher<br />
in Yangon than the WHO standard. The same<br />
situation was also observed in the measurement<br />
of Lead (Pb) and SO2. Therefore, the “State of<br />
mobile source air pollution” in Yangon city is<br />
relatively poor. However, the trend of this indicator<br />
is not observable as there is a lack of data and no<br />
measurement on a regular basis.
TECHNICAL INFORMATION<br />
A. Definition<br />
This indicator attempts to track the level of ambient air concentration in Yangon city in terms<br />
of measuring the concentration of Total Suspended Particulate (TSP) matter.<br />
Ambient air concentration is, by general definition, the concentration of a hazardous pollutants<br />
or radioactive material in the atmosphere measured at remote locations, as against being directly<br />
measured from the point of release. It is here specific to the measurement of:<br />
• Sulfur dioxide (a pollutant when fossil fuels containing sulfur are burned),<br />
• Lead (a product of combustion from motor vehicles using leaded gasoline)<br />
• Total Suspended Particulate Matter – TSP (fine solid and liquid particles dispersed in the<br />
atmosphere from combustion processes, industrial activities, or natural sources and small enough<br />
to be inhaled and affect the respiratory tract).<br />
The measurements are given in microgram per cubic meter (µ/m3) for TSP and Lead. For SO 2 ,<br />
parts per million (ppm) is used in this indicator development.<br />
B. Data Source<br />
A research project of the Department of Atomic Energy under Ministry of Science and<br />
Technology undertaken during the period 1998-2000 is the only source for Total Suspended<br />
Particulate matter and Pb concentrations in ambient air. The data for SO 2 concentrations were obtained<br />
from the postgraduate study of the Chemistry Department, Yangon University.<br />
Wai Zin Oo. 2001. Air Pollution Monitoring Using Nuclear Related Analytical Techniques.<br />
Department of Atomic Energy, Ministry of Science and Technology, the Government of the Union of<br />
<strong>Myanmar</strong>, Yangon.<br />
Saw Kalayar. 2000. Sulphur Dioxide in Yangon City Area Near Chaung Wa. M.Sc. Thesis,<br />
Department of Chemistry, Yangon University, Yangon.<br />
C. Geographic Area / Population Coverage<br />
Geographically, data has only covered the selected sites of Yangon Capital. For the<br />
measurement of TSP and lead concentration, the sites covered by the study are some urban<br />
centers and suburban areas of the city where traffic used to be congested. SO 2 was measured in<br />
the Chaungma area around Bayintnaung Road, the suburban area of Hlaing township which was<br />
near to industrial locations with a high vehicle density of trucks.<br />
Different temporal coverage exist for different air pollutants as follows:<br />
• Sulphur dioxide – from January 1999 to April 2000<br />
• TSP – from 1998 to 1999 and selectively, November 2000<br />
• Lead – from 1997 to 1999<br />
D. Methodology and Frequency of Coverage<br />
By using a nuclear related method of X-ray Fluorescence Analysis Technique, Radiation<br />
Monitoring Laboratory of the Department of Atomic Energy measured the mass concentration in<br />
aerosols and total suspended particulate matter at selected sites of Yangon city for different<br />
temporal coverage as mentioned earlier.<br />
In measuring SO 2 , the following methods were employed by the research study:<br />
• Toxic Gas Detector (Model – p-81930-04, Cole – Parmer International, USA)<br />
• Hydrogen Peroxide Method (air sample trapped into impinger and titration in the laboratory)<br />
• Iodine Method (air sample trapped into impinger and titration in the laboratory).<br />
• Fuchsin or Roasaniline Method (air sample trapped into impinger and titration in the lab)<br />
E. Methodology of Data Manipulation<br />
No data manipulation was performed for TSP and lead concentration. Only averaging of the<br />
different results by four different laboratory methods for the measurement of SO 2 was done for the<br />
monthly average data of 1998 and 1999 in this fact sheet.<br />
234
QUALITATIVE INFORMATION<br />
A. Strength and Weakness (data level)<br />
The data and the indicator provide a general indication of air pollution level in the ambient air<br />
of Yangon city. Because of different temporal coverage and sites for measuring air pollutants, it is<br />
difficult to collate all the data consistently in analyzing air pollution level in Yangon city. In addition,<br />
shorter temporal coverage of each research study limits the time trend analysis of the air pollution<br />
level.<br />
B. Reliability, Accuracy, Robustness, Uncertainty (data level)<br />
By technical supervision and the research methodology employed, each research study for the<br />
measurement of different air pollutants had generated reliable results and research findings with<br />
relatively higher accuracy. However, vehicle emissions might not necessarily be the sole reason for<br />
causing the concentration of TSP matter in Yangon and possibly it might be also linked to the construction<br />
industry that was growing contemporarily.<br />
C. Future Work Required (for data level and indicator level)<br />
More systematic and consistent data collection on ambient air concentration for all important<br />
parameters of air pollutants is seriously required to monitor the ambient air quality in Major cities,<br />
at least Yangon and Mandalay.<br />
SUPPORTING DATA TABLES, GRAPHS AND MAPS<br />
Figure 1a: Annual Average of Total Suspended Particulate<br />
(TSP) Matter in the Capital Yangon<br />
235
Figure 1b: Average Monthly Total Suspended Air Particulate<br />
(TSP) Matter in the Capital Yangon<br />
Table 1a: Average Monthly Total Suspended Air Particulates<br />
(TSP) in Aerosols in Yangon<br />
Month 1998 1999 2000<br />
January 117 123 -<br />
February 105 111 -<br />
March 128 145 -<br />
April 150 132 -<br />
May 183 99 -<br />
June 84 75 -<br />
July 77 60 -<br />
August 60 76 -<br />
September 87 144 -<br />
October 110 150 -<br />
November 140 141 82<br />
December 160 137 -<br />
Annual Average 117 116 82<br />
Source: Department of Atomic Energy, Ministry of Science and Technology, 2001<br />
236
Table 1b: Total Suspended Particulate Measurement in<br />
Yangon, November, 2000<br />
No Site for Measuring Air Pollutant Coarse µg/m 3 Fine µg/m 3 Total Suspended Particulate Matter<br />
µg/m 3<br />
1 Thamine 64.28 19.78 84.06<br />
2 Hling thar yar 20.34 7.72 28.06<br />
3 Down-town 31st street 39.00 19.13 58.13<br />
4 South Dagon Industrial Zone 60.30 19.55 79.85<br />
5 Yankin (SITE 1, 2 & 3) 58.83 29.70 88.53<br />
6 Bahna - Shwe Gon Daing – Junction 58.85 30.60 89.45<br />
7 Theinbhyu - Bogyoke Rd. Junction 79.80 39.20 119.00<br />
8 Kanbe - Kabaraye Site 1, 2 & 3 69.54 36.05 105.59<br />
Average TSP 81.58<br />
Source: Department of Atomic Energy, Ministry of Science and Technology, 2001<br />
Figure 2: Mass Concentration in Aerosols in the Capital Yangon<br />
237
Figure 3: Monthly Average of Sulfur Dioxide Concentration in Selected<br />
Sampling Sites in the Capital Yangon<br />
Table2: Monthly Average of Sulfur Dioxide Concentration<br />
(microgram per cubic meter) in Selected Sampling<br />
Sites in the Capital Yangon<br />
Month 1999 2000<br />
January 10.80 10.91<br />
February 9.21 9.36<br />
March 8.13 8.05<br />
April 6.40 7.46<br />
May 5.24 -<br />
June 3.57 -<br />
July 2.35 -<br />
August 1.04 -<br />
September 2.10 -<br />
October 2.88 -<br />
November 5.48 -<br />
December 8.10 -<br />
Annual Average 5.44 8.94<br />
Source: Saw Kalayar, 2000<br />
238
SUMMARY<br />
A. Policy Reference<br />
1. Purpose:<br />
The purpose of this indicator is to better understand the ambient air quality of a major city,<br />
Yangon, and the nature of air pollution linked to vehicle emission.<br />
2. Relevance to Environment Planning and Management:<br />
This is relevant to monitoring of environmental quality. As the <strong>National</strong> Health Policy is clearly<br />
stated about reducing the environmental health hazard for all citizens, air pollution monitoring and<br />
control are essential in improving environmental quality.<br />
3. Linkage to Other Indicators:<br />
This indicator is linked to other indicators such as Car Equivalent Unit, Automotive Fuel Sold/<br />
consumption and Ambient Air Quality of NOx and CO emission.<br />
4. Targets:<br />
No target exists yet as there is no national standard for ambient air quality. However,<br />
international standards such as the World Health Organization’s (WHO) annual mean limits are<br />
applied in comparing the results. According to the “Second ASEAN State of the Environment<br />
<strong>Report</strong> 2000” (published by the ASEAN Secretariat in 2001), WHO’s annual mean limits for TSP<br />
and SO2 are 100 and 50 microgram per cubic meter respectively.<br />
5. International Environment Treaties:<br />
There is no direct international environmental treaty linking mobile source air pollution for<br />
necessary action, however, the “UN Framework on Climate Change Convention” is linked with the<br />
monitoring of Greenhouse Gases.<br />
B. Analysis<br />
There is a serious lack of data for determining the situation of mobile source air pollution in<br />
the major cities of <strong>Myanmar</strong>. However, an attempt was made during the EPA to compile the best<br />
available data from secondary sources for generalizing the current state of ambient air<br />
concentration in Yangon Capital.<br />
According to the data collected from various sampling points of urban center (Botataung Pagoda<br />
Road and Kanbe, Kanber Aye Pagoda Road) in 1998, 1999 and 2000, annual average of Total<br />
Suspended Particulate matter (TSP) was above the level of the WHO standard of 100 µg/m 3 (see<br />
figure 1a). As shown in figure 1b, the level of TSPM was seasonally varied and in general, it was<br />
high during mid summer (April and May) and early winter (November and December). A 24 hours<br />
average level of TSPM in different sampling points of Yangon capital was given in Table 1b for the<br />
period of November 2000 and data reveal that Theinphyu Road, Shwe Gon Daing Junction, Kanber<br />
Aye road, Yankin and Thamine junction were the locations where relatively high TSP levels were<br />
observed.<br />
From the same source of data, measurement of mass concentration in Aerosols at Yangon Capital<br />
were further analyzed. Especially, annual average of lead concentrations in 1997, 1998 and 1999<br />
ranged from 0.3 to 0.5 µg/m3. As the WHO standard is 0.5 to 1 µg/m3 (<strong>National</strong><br />
<strong>Environmental</strong> Engineering Research Institute, 1996, pp: 7 ), it is approaching the acceptable limit.<br />
Notably, gradual rises in “Ca” and “K” were observed for all studied years – 1997 to 1999. (See<br />
Figure 2)<br />
239
Data related to SO2 concentration in selected survey sites of suburban residential areas (around<br />
Bayint Naung Road, Hlaing Townhship) were also obtained from a postgraduate study at Yangon<br />
University. The data were limited for providing a trend line as measurements were only taken for<br />
the whole year of 1999 and partially for 2000. Nevertheless, it provides the scenario of seasonal<br />
trends in SO2 concentrations. Monthly average concentrations for all methods of measurement<br />
were highest during the month of January (10.8 ppm) with a gradual decline to the lowest level of<br />
1.04 ppm in the rainy season (August). The annual average was 5.44 ppm for 1999 which is higher<br />
than the acceptable limit – WHO standard for SO2 annual mean limit is 50 µg/m 3 or 0.02 ppm<br />
according to references quoted in 2nd ASEAN State of Environment <strong>Report</strong> 2000. (See Figure 3<br />
and Table 2).<br />
Taking into consideration the results from the available measurements as far as mobile source<br />
air pollution is concerned, ambient air concentration in terms of TSP, Lead and SO 2 approached<br />
to above the acceptable limits as standardized by international organizations and neighboring<br />
countries. Therefore, the current state of mobile source air pollution in major cities of <strong>Myanmar</strong><br />
is relatively poor in comparison to the international standard. However, the trend of this indicator<br />
is not observable as there is a lack of data deficiency for the regular measurement of ambient air<br />
concentrations.<br />
240
Indicator ID<br />
Indicator Name<br />
Greater Mekong Subregion<br />
Indicator Fact Sheet<br />
DATABASE INFORMATION<br />
Year of <strong>Assessment</strong> 2005<br />
Type of Indicator Pressure<br />
Frequently Asked Question (FAQ)<br />
241<br />
Car Equivalent Unit per km2 for Major<br />
Cities - 1999 to 2004<br />
Has air pollution been aggravated by increased<br />
vehicle population in major cities?<br />
Priority Concern Mobile Source Air Pollution<br />
Geographic Area Union of <strong>Myanmar</strong><br />
Magnitude & Trend Medium and Increasing<br />
Key Message<br />
From 1999 to 2004, total car equivalent unit per<br />
square kilometer steadily increased from 1,463 to<br />
1674 units in Yangon and from 545 to 759 units<br />
in Mandalay. Net increase in CEU per square<br />
kilometer within this period is equivalent to 13%<br />
of the 1999 level in Yangon and 39% in<br />
Mandalay. Thus, the level of pressure on mobile<br />
source air pollution in <strong>Myanmar</strong> is increasing<br />
and medium in terms of the notable increases in<br />
vehicular density in major cities.
TECHNICAL INFORMATION<br />
A. Definition<br />
This indicator attempts to track the number of Car Equivalent Units within a square kilometer<br />
of major urban area in Yangon and Mandalay City.<br />
Car Equivalent Unit (CEU) is the measurement of the different type of vehicles by its engine power<br />
and automotive fuel consumption equivalent to a car with normal engine power and average<br />
consumption level of automotive fuel. As recommended by the Road Transport Administration<br />
Department, default values of multiplier coefficient are used for conversion of different vehicle type<br />
to CEU and currently applied values are as below:<br />
• 1 saloon/van (avg. engine capacity – 1500cc) is equal to 1 CEU<br />
• 1 light tuck (avg. engine capacity – 2000cc) is equal to 1.3 CEU<br />
• 1 truck (avg. engine capacity – 4500cc) is equal to 2.5 CEU<br />
• 1 passenger bus (avg. engine capacity – 4500cc) is equal to 2.5 CEU<br />
• 1 motor cycle (avg. engine capacity – 125cc) is equal to 0.2 CEU<br />
• 1 tri-wheel (avg. engine capacity – 800cc)is equal to 0.65 CEU<br />
• 1 trawler-gee (avg. engine capacity – 1000cc) is equal to 1.3 CEU<br />
• 1 (other) vehicle is equal to 2 CEU<br />
Major urban area includes the townships of the city which are the commercially active urban center<br />
or the major residential areas adjacent to the urban center.<br />
B.Data Source<br />
Data for total registered car are obtained from the Road Transport Administration Department.<br />
The data related to major urban areas of Yangon and Mandalay are based on Yangon City Map of<br />
Yangon City Development Committee (2003) and from the source of Mandalay District’s Government<br />
Affair Department (2004). The Energy Planning Department (EDP) has also provided data related to<br />
the total volume of fuel sold (motor spirit and high-speed diesel) for the transportation sector.<br />
EPD. 2005. Energy Data Related to Indicator Development for <strong>National</strong> <strong>Performance</strong> <strong>Assessment</strong>.<br />
Submission to <strong>National</strong> Commission for <strong>Environmental</strong> Affairs, by Energy Planning Department,<br />
Ministry of Energy, the Government of the Union of <strong>Myanmar</strong>, Ref Letter No: 116/1/G dated 19<br />
April 2005, Yangon<br />
GAD. 2004. Local Data of Mandalay District. Internal document of Mandalay District’s Government<br />
Affairs Department, Ministry of Home Affairs, the Government of the Union of <strong>Myanmar</strong>,<br />
Mandalay. RTAD. 2005. Data Related to Indicator Development for <strong>National</strong> <strong>Performance</strong><br />
<strong>Assessment</strong>. Submittal to <strong>National</strong> Commission for <strong>Environmental</strong> Affairs, by Road Transport<br />
Administration Department, Ministry of Transport, the Government of the Union of <strong>Myanmar</strong>, Ref<br />
Letter No: Katha-912/05/13, dated 2 February 2005, Yangon<br />
YCDC. 2003. Township Maps and Data on Yangon City. Yangon City Development Committee, Yangon.<br />
C.Geographic Area / Population Coverage<br />
The data utilized for the construction of this indicator are representative of mobile source<br />
pollution for Yangon and Mandalay cities.<br />
D.Temporal Coverage<br />
The temporal coverage of the data applied is an indicator for 1998 to 2004.<br />
242
E. Methodology and Frequency of Coverage<br />
Total numbers of vehicle registered is acquired from the list of annually registered vehicle at<br />
the Road Transport Administration. The data for all states and divisions are summarized by various<br />
category of vehicle such as saloon, ban, truck, light truck, passenger bus, tri-wheel, motor cycle,<br />
trawler-gee and others. These vehicles were categorized by type of fuel they used such as High<br />
Speed Diesel (HSD) and Motor Spirit (MS). However, these data were only available for Yangon and<br />
Mandalay Cities.<br />
Automotive fuel sold is a compilation from annual sale record of High Speed Diesel and Motor<br />
Spirit by concerned agency of the Energy Planning Department.<br />
F. Methodology of Data Manipulation<br />
By using a multiplier coefficient, different categories of vehicles registered are converted into<br />
CEU for both Yangon and Mandalay. As potential emission level of the High Speed Diesel used<br />
Vehicle is higher than that of Motor Spirit used Vehicle, a conversion factor is used again in<br />
converting Diesel vehicle equivalent to Motor spirit Vehicle. The assumption for the conversion<br />
factor using standard practice is that 1 diesel vehicle is equal to 1.2 Motor Spirit vehicles in terms<br />
of capacity of consuming energy and emitting smoke. After all vehicles are converted into<br />
Motor-Spirit Type Vehicle Equivalent Unit, a further calculation divided CEU by the total extent<br />
of the major urban area, which is the sum of the aerial extent of townships considered as major<br />
urban areas within Yangon and Mandalay cities according to the definition above.<br />
QUALITATIVE INFORMATION<br />
A. Strength and Weakness (data level)<br />
The indicator provides an indicative value for determining the level of vehicular density that is<br />
comparable from one urban area to another in examining the level of potential risk associated with<br />
mobile source air pollution alongside the studied period. However, there are approximately 100,000<br />
departmental vehicles that were not registered under the Road Transport Administration<br />
Department. Therefore, the indicative value could not absolutely cover the whole situation. Using<br />
the total extent of the major urban area in the calculation may also limit the value for optimal<br />
comparison of vehicular density among the areas where the area of the road network may not<br />
necessarily be same.<br />
B. Reliability, Accuracy, Robustness, Uncertainty (data level)<br />
The indicator is highly reliable and accurate as data used in the indicator are based on an<br />
officially precise record of vehicle registration. Robustness will only be affected by the degree of<br />
soundness in the assumption of the “conversion coefficient” for CEU.<br />
C. Future Work Required (for data level and indicator level)<br />
Detailed vehicular information such as engine type, age, capacity, accessories for emission<br />
control, etc., should be recorded and compiled for all vehicle registered. This will enhance the<br />
understanding of the relationship between vehicle density and the associated risk of pollution by<br />
emissions.<br />
243
Year<br />
Total CEU in<br />
Yangon<br />
Table 1a: Car Equivalent Unit of Per Unit Urban<br />
Area of Capital Yangon and Mandalay<br />
Total CEU in<br />
Mandalay<br />
Yangon Urban<br />
Area (Sq-Km)<br />
244<br />
Mandalay Urban<br />
Area (Sq-Km)<br />
CEU per Sq-Km in<br />
Yangon<br />
CEU per Sq-Km<br />
in Mandalay<br />
1999 189,907 57,527 129.78 105.57 1,463 545<br />
2000 189,593 58,666 129.78 105.57 1,461 556<br />
2001 192,533 60,804 129.78 105.57 1,484 576<br />
2002 199,655 62,227 129.78 105.57 1,538 589<br />
2003 204,924 64,966 129.78 105.57 1,579 615<br />
2004 217,233 80,139 129.78 105.57 1,674 759<br />
Source: Road Transport Administration Department 2005, Yangon City Development Committee 2003 and Mandalay District’s Govern<br />
ment Affairs Department 2004.<br />
SUPPORTING DATA TABLES, GRAPHS AND MAPS<br />
Figure 1: Car Equivalent Unit Per Square Kilometer<br />
of Capital Yangon and Mandalay
Area<br />
Table 1b: Total Number of Registered Vehicle in Yangon and<br />
Mandalay City (HSD+MS)<br />
Type of<br />
Vehicle<br />
1999 2000 2001 2002 2003 2004<br />
Yangon City Saloon Ban 100,090 101,385 101,725 104,905 110,106 116,441<br />
Light Truck 13,866 13,747 13,880 14,059 11,706 12,205<br />
Truck 8,975 8,127 8,260 8,525 8,268 8,694<br />
Passenger<br />
Bus<br />
8,528 9,010 9,405 9,618 9,670 9,930<br />
Others 4,665 4,761 5,480 6,460 7,159 7,550<br />
Motorcycle 29,536 23,775 14,643 7,844 3,728 3,476<br />
Tri-wheel - - - - - -<br />
Trawler Jeep 67 92 504 1,002 1,896 2,700<br />
Total 165,727 160,897 153,897 152,413 152,533 160,996<br />
Mandalay Saloon Ban 26,162 26,997 28,262 28,339 28,983 27,797<br />
City<br />
Light Truck 1,648 2,104 2,201 2,226 2,248 2,232<br />
(south/<br />
north)<br />
Truck<br />
Passenger<br />
Bus<br />
3,559<br />
2,047<br />
2,855<br />
1,951<br />
2,872<br />
1,819<br />
2,849<br />
1,740<br />
2,885<br />
1,746<br />
2,878<br />
1,721<br />
Others 267 683 767 854 902 930<br />
Motorcycle 51,654 50,978 52,320 57,428 63,124 139,264<br />
Tri-wheel 650 503 396 274 251 243<br />
Trawler Jeep475 1,124 1,489 1,723 2,073 2,789<br />
Total 86,462 87,195 90,126 95,433 102,212 177,854<br />
Note: HSD = High Spirit Diesel, MS = Motor Spirit<br />
Source: Road Transport Administration Department, 2005<br />
245
Area<br />
Type of<br />
Vehicle<br />
Table 1c: Total Number of Registered Vehicle in<br />
Yangon and Mandalay City (HSD)<br />
1999 2000 2001 2002 2003 2004<br />
Yangon City Saloon Ban 18,587 19,310 19,988 20,984 24,296 26,611<br />
Light Truck 7,850 7,806 8,082 8,412 8,570 9,403<br />
Truck 6,266 5,885 6,079 6,428 7,162 8,101<br />
Passenger<br />
Bus<br />
4,230 5,027 5,550 6,116 7,090 7,403<br />
Others 4,215 4,315 5,032 6,047 6,704 7,098<br />
Motorcycle - - - - - -<br />
Tri-wheel - - - - - -<br />
Trawler Jeep 67 92 504 962 1,275 2,700<br />
Total 41,215 42,435 45,235 48,949 55,097 61,316<br />
Mandalay Saloon Ban 3,850 4,284 4,483 4,754 5,360 5,617<br />
City<br />
(south/ north)<br />
Light Truck 1,117 1,513 1,571 1,587 1,629 1,637<br />
Truck 3,173 2,685 2,718 2,700 2,748 2,744<br />
Passenger<br />
Bus<br />
890 886 883 893 933 935<br />
Others 218 603 673 755 802 831<br />
Motorcycle - - - - - -<br />
Tri-wheel - - - - - -<br />
Trawler Jeep 475 1,123 1,489 1,723 2,073 2,789<br />
Total 9,723 11,094 11,817 12,412 13,545 14,553<br />
Note: HSD = High Spirit Diesel<br />
Source: Road Transport Administration Department, 2005<br />
246
Table 1d: Total Number of Registered Vehicles in<br />
Yangon and Mandalay City (MS)<br />
Area Type of Vehicle 1999 2000 2001 2002 2003 2004<br />
Yangon City Saloon Ban 81,503 82,075 81,737 83,921 85,810 89,830<br />
Light Truck 6,016 5,941 5,798 5,647 3,136 2,802<br />
Truck 2,709 2,242 2,181 2,097 1,106 593<br />
Passenger Bus 4,298 3,983 3,855 3,502 2,580 2,527<br />
Others 450 446 448 413 455 452<br />
Motorcycle 29,536 23,775 14,643 7,844 3,728 3,476<br />
Tri-wheel - - - - - -<br />
Trawler Jeep - - - 40 621 -<br />
Total 124,512 118,462 108,662 103,464 97,436 99,680<br />
Mandalay<br />
Saloon Ban 22,312 22,713 23,779 23,585 23,623 22,180<br />
City<br />
Light Truck 531 591 630 639 619 595<br />
(south/<br />
north)<br />
Truck<br />
Passenger Bus<br />
386<br />
1,157<br />
170<br />
1,065<br />
154<br />
936<br />
149<br />
847<br />
137<br />
813<br />
134<br />
786<br />
Others 49 80 94 99 100 99<br />
Motorcycle 51,654 50,978 52,320 57,428 63,124 139,264<br />
Tri-wheel 650 503 396 274 251 243<br />
Trawler Jeep - 1 - - - -<br />
Note: MS = Motor Spirit<br />
Total 76,739 76,101 78,309 83,021 88,667 163,301<br />
Source: Road Transport Administration Department, 2005<br />
247
Table 1e: Car Equivalent Unit of MS Equivalent HSD<br />
Vehicle in Yangon and Mandalay City<br />
Area<br />
Type of<br />
Vehicle<br />
1999 2000 2001 2002 2003 2004<br />
Yangon City Saloon Ban 22,304 23,172 23,986 25,181 29,155 31,933<br />
Light Truck 12,246 12,177 12,608 13,123 13,369 14,669<br />
Truck 18,798 17,655 18,237 19,284 21,486 24,303<br />
Passenger<br />
Bus<br />
12,690 15,081 16,650 18,348 21,270 22,209<br />
Others 10,116 10,356 12,077 14,513 16,090 17,035<br />
Motorcycle - - - - - -<br />
Tri-wheel - - - - - -<br />
Trawler Jeep 105 144 786 1,501 1,989 4,212<br />
Total 76,259 78,585 84,344 91,949 103,359 114,361<br />
Mandalay Saloon<br />
City<br />
Ban<br />
4,620 5,141 5,380 5,705 6,432 6,740<br />
(south/<br />
north) Light Truck 1,743 2,360 2,451 2,476 2,541 2,554<br />
Truck 9,519 8,055 8,154 8,100 8,244 8,232<br />
Passenger<br />
Bus<br />
2,670 2,658 2,649 2,679 2,799 2,805<br />
Others 523 1,447 1,615 1,812 1,925 1,994<br />
Motorcycle - - - - - -<br />
Tri-wheel - - - - - -<br />
Trawler Jeep 741 1,752 2,323 2,688 3,234 4,351<br />
Total 19,816 21,413 22,571 23,459 25,175 26,676<br />
Note: HSD = High Spirit Diesel, MS = Motor Spirit<br />
Source: Road Transport Administration Department, 2005<br />
248
Table 1f: Car Equivalent Unit of MS Vehicles in<br />
Yangon and Mandalay City<br />
Area<br />
Type of<br />
Vehicle<br />
1999 2000 2001 2002 2003 2004<br />
Yangon City Saloon Ban 81,503 82,075 81,737 83,921 85,810 89,830<br />
Light Truck 7,821 7,723 7,537 7,341 4,077 3,643<br />
Truck 6,773 5,605 5,453 5,243 2,765 1,483<br />
Passenger<br />
Bus<br />
10,745 9,958 9,638 8,755 6,450 6,318<br />
Others 900 892 896 826 910 904<br />
Motorcycle 5,907 4,755 2,929 1,569 746 695<br />
Tri-wheel - - - - - -<br />
Trawler Jeep - - - 52 807 -<br />
Total 113,649 111,008 108,189 107,706 101,565 102,872<br />
Mandalay Saloon Ban<br />
City<br />
(south/<br />
22,312 22,713 23,779 23,585 23,623 22,180<br />
north)<br />
Light Truck 690 768 819 831 805 774<br />
Truck 965 425 385 373 343 335<br />
Passenger<br />
Bus<br />
2,893 2,663 2,340 2,118 2,033 1,965<br />
Others 98 160 188 198 200 198<br />
Motorcycle 10,331 10,196 10,464 11,486 12,625 27,853<br />
Tri-wheel 423 327 257 178 163 158<br />
Trawler Jeep - 1 - - - -<br />
Total 37,711 37,253 38,232 38,767 39,791 53,462<br />
Note: HSD = High Spirit Diesel, MS = Motor Spirit<br />
Source: Road Transport Administration Department, 2005<br />
249
Area<br />
Table 1g: Total Car Equivalent Unit of Both MS & HSD<br />
Vehicles in Yangon and Mandalay City<br />
Type of<br />
Vehicle<br />
1999 2000 2001 2002 2003 2004<br />
Yangon City Saloon Ban 103,807 105,247 105,723 109,102 114,965 121,763<br />
Light Truck 20,067 19,901 20,145 20,464 17,446 18,311<br />
Truck 25,571 23,260 23,690 24,527 24,251 25,786<br />
Passenger<br />
Bus<br />
23,435 25,039 26,288 27,103 27,720 28,527<br />
Others 11,016 11,248 12,973 15,339 17,000 17,939<br />
Motorcycle 5,907 4,755 2,929 1,569 746 695<br />
Tri-wheel 0 0 0 0 0 0<br />
Trawler Jeep 105 144 786 1553 2796 4212<br />
Total 189,907 189,593 192,533 199,655 204,924 217,233<br />
Mandalay Saloon Ban<br />
City<br />
26,932 27,854 29,159 29,290 30,055 28,920<br />
(south/<br />
north)<br />
Light Truck<br />
Truck<br />
2,433<br />
10,484<br />
3,129<br />
8,480<br />
3,270<br />
8,539<br />
3,306<br />
8,473<br />
3,346<br />
8,587<br />
3,327<br />
8,567<br />
Passenger<br />
Bus<br />
5,563 5,321 4,989 4,797 4,832 4,770<br />
Others 621 1,607 1,803 2,010 2,125 2,192<br />
Motorcycle 10,331 10,196 10,464 11,486 12,625 27,853<br />
Tri-wheel 423 327 257 178 163 158<br />
Trawler Jeep 741 1,753 2,323 2,688 3,234 4,351<br />
Total 57,527 58,666 60,804 62,227 64,966 80,139<br />
Note: HSD = High Spirit Diesel, MS = Motor Spirit<br />
Source: Road Transport Administration Department, 2005<br />
250
Table 2a: Major Urban Areas of the Capital Yangon<br />
No. District Township Extent mile2 2 Major Urban Area<br />
Extent km<br />
Km2 1 East Yangon Botadaung 0.92 2.38 2.38<br />
2 East Yangon Dagon/Port 32.97 85.40<br />
3 East Yangon Dawpon 1.02 2.64<br />
4 East Yangon E/Dagon 35.15 91.03<br />
5 East Yangon Mingalataungnyunt 1.96 5.06 5.06<br />
6 East Yangon N/Dagon 10.15 26.28<br />
7 East Yangon N/Okkalapa 10.91 28.26<br />
8 East Yangon Pazundaung 0.39 1.01 1.01<br />
9 East Yangon S/Dagon 30.55 79.11<br />
10 East Yangon S/Okkalapa 2.97 7.70<br />
11 East Yangon Tamwe 1.85 4.79 4.79<br />
12 East Yangon Tharketa 5.02 13.01<br />
13 East Yangon Thingangyun 4.44 11.50<br />
14 East Yangon Yankin 1.94 5.03 5.03<br />
East Yangon Total 140.24 363.21 18.28<br />
15 Northern Yangon Hlaingthaya 26.01 67.37<br />
16 Northern Yangon Insein 13.52 35.02<br />
17 Northern Yangon Mingadon 41.14 106.55<br />
18 Northern Yangon Shwepyithar 15.21 39.39<br />
Northern Yangon Total 95.88 248.33 29.11<br />
19 South Yangon Dala 10.93 28.31<br />
20 South Yangon Seikkyikanaungto 2.26 5.85<br />
South Yangon Total 13.19 34.16<br />
21 West Yangon Ahlone 1.40 3.63 3.63<br />
22 West Yangon Bahan 3.41 8.84 8.84<br />
23 West Yangon Dagon 4.50 11.65 11.65<br />
24 West Yangon Hlaing 5.29 13.70 13.70<br />
25 West Yangon Kamaryut 2.40 6.22 6.22<br />
26 West Yangon Kyauktada 0.25 0.65 0.65<br />
27 West Yangon Kyi-myin-daing 2.16 5.59 5.59<br />
28 West Yangon Lanmadaw 0.54 1.41 1.41<br />
29 West Yangon Lathar 0.31 0.81 0.81<br />
30 West Yangon Mayangone 9.78 25.34 25.34<br />
31 West Yangon Pabedan 0.29 0.76 0.76<br />
32 West Yangon Sanchaung 0.96 2.47 2.47<br />
33 West Yangon Seik-kan 0.51 1.32 1.32<br />
West Yangon Total 31.81 82.39<br />
Grand Total 281.12 728.09 129.78<br />
Source: Yangon City Development Committee, 2003<br />
251
Table 3: Automotive Fuel Sold in <strong>Myanmar</strong><br />
Year Motor Spirit - MS (million gallons) High Speed Diesel - HSD (million gallons) Total Fuel (million gallons)<br />
1998 90 152 242<br />
1999 90 146 237<br />
2000 99 146 245<br />
2001 89 150 239<br />
2002 95 189 284<br />
2003 109 170 280<br />
2004 91 119 210<br />
Source: Energy Planning Department 2005<br />
Table 2b: Major Urban Areas of Mandalay<br />
No. District Township MCDC 2003 (Sq-mile) MCDC 2003 (Sq-km)<br />
252<br />
Major Urban Area<br />
(Sq-km)<br />
1 Mandalay Aung Myay Thar Zan 11.03 28.57 28.57<br />
2 Mandalay Chan Aye Thar San 5.05 13.08 13.08<br />
3 Mandalay Mahar Aung Myay 5.72 14.81 14.81<br />
4 Mandalay Chan Mya Thar Si 9.07 23.49 23.49<br />
5 Mandalay Pyi Gyi Ta Gon 9.89 25.61 25.61<br />
Total 40.76 105.57 105.57<br />
Source: Mandalay District’s Government Affairs Department, 2004<br />
Figure 2: Automotive Fuel Sold in <strong>Myanmar</strong>
SUMMARY<br />
A. Policy Reference<br />
1. Purpose:<br />
This indicator estimates the level of potential risk that major cities are facing in mobile source<br />
air pollution.<br />
2. Relevance to Environment Planning and Management:<br />
The indicator is useful for better urban planning and transportation management in which<br />
mobile source air pollution could be well controlled and regulated.<br />
3. Linkage to Other Indicators:<br />
The indicator could be linked to “Automotive Fuel Sold or Consumption”, and “Ambient Air<br />
Concentration” and “CO2 emission” for better analyzing of atmospheric pollution and global<br />
warming.<br />
B. Analysis<br />
Figure 1 provides the trend of Car Equivalent Unit per square kilometer of Yangon and<br />
Mandalay Cities, which is based on the equivalent capacity of all vehicles to Motor Spirit type<br />
Vehicle in emitting air pollutants. Associated data with figure 1 are given in Table 1a that were<br />
derived from following Tables 1b, 1c, 1d, 1e, 1f, and 1g. Major urban areas of Yangon and<br />
Mandalay are given in Table 2a and 2b. Data related to automotive fuel sold are given in Table 3 and<br />
the trend is illustrated in figure 2.<br />
As shown in Figure 1, trends of vehicular density in term of CEU per square kilometer are stable<br />
and rising in both Yangon and Mandalay during the years from 1999 to 2004. In fact, the total<br />
numbers of vehicles in Yangon city declined since 2000, though there was a slight increase in 2004<br />
(Table 1b). This decline was only due to a sharper decrease in numbers of the motor spirit type<br />
vehicle (Table 1c). However, increases in the number of diesel vehicles during the same period<br />
made the total CEU gradually higher in Yangon (Table 1g). In the case of Mandalay, there were<br />
continuous increases in the total number of both diesel and motor spirit vehicles from 1999 to<br />
2004, except for a decrease of motor spirit vehicles in 2000 (1d).<br />
As the import of cars was opened in the early 1990s but has been strictly regulated again in late<br />
1990s, only importing high spirit diesel vehicles was common in Yangon after 1999. Meanwhile,<br />
many old cars (motor spirit type) were sold out or moved to other parts of the country so that the<br />
total number of vehicles was reduced over time in Yangon. In 2004, the government allowed the<br />
official registration of the motor cycles that were imported from neighboring countries across the<br />
border. This explained the sharper increase in the number of total vehicles in Mandalay in 2004.<br />
Although vehicle population and CEU per square kilometer in both Yangon and Mandalay increased,<br />
it is noticeable that volumes of automotive fuel (High Spirit Diesel and Motor Spirit) sold for<br />
vehicles, which had an increased trend during the years from 1998 to 2001, has been declining<br />
since 2002 (Figure 2). Automotive fuel is sold to the vehicle owner based on a quota set by the<br />
government and amount of quota per vehicle is higher in Yangon than in Mandalay. Therefore, the<br />
risk of air pollution from mobile source has been greater in Yangon than in Mandalay because of<br />
the higher density of CEU per square kilometer and the relatively higher consumption level of<br />
automotive fuel.<br />
Within the six year period from 1999 to 2004, the net increase in CEU per square kilometer<br />
compared to the 1999 level is 13% in Yangon and 39% in Mandalay. As this magnitude is neither<br />
low nor high, the level of pressure on air pollution in major cities of <strong>Myanmar</strong> is medium with a<br />
steadily increasing trend.<br />
253
Indicator ID<br />
Greater Mekong Subregion<br />
Indicator Fact Sheet<br />
DATABASE INFORMATION<br />
Indicator Name Percentage of Vehicles Inspected - 1998 to 2004<br />
Year of <strong>Assessment</strong> 2005<br />
Type of Indicator Response<br />
Frequently Asked Question (FAQ)<br />
254<br />
How effective have vehicular inspections been<br />
in regulating the level of pollution from motor<br />
vehicles?<br />
Priority Concern Mobile Source Air Pollution<br />
Geographic Area Union of <strong>Myanmar</strong><br />
Impact & Trend Low and Intermittent<br />
Key Message<br />
From 1998 to 2004, annually inspected vehicles<br />
as a percentage of total vehicles registered in<br />
<strong>Myanmar</strong> have fluctuated within the range of<br />
84 to above 90% at the national level. However,<br />
manual inspections on vehicle emission level and<br />
lack of national air quality standards and an<br />
environmental monitoring institute have<br />
compounded the low and intermittent response<br />
in controlling vehicle emissions in major cities,<br />
although there are increasing levels of air<br />
pollutants as seen in the “State” indicator.
TECHNICAL INFORMATION<br />
A. Definition<br />
This indicator attempts to track the numbers of vehicles inspected as a percentage of total<br />
numbers of vehicle registered in <strong>Myanmar</strong>. The unit of measurement is given as percentage per<br />
annum.<br />
B. Data Source<br />
The Annual record of Road Transport Administration Department is the main source of data<br />
for this indicator.<br />
RTAD. 2005. Data Related to Indicator Development for <strong>National</strong> <strong>Performance</strong> <strong>Assessment</strong>.<br />
Submission to <strong>National</strong> Commission for <strong>Environmental</strong> Affairs, by Road Transport<br />
Administration Department, Ministry of Transport, the Government of the Union of <strong>Myanmar</strong>, Ref<br />
Letter No: Katha-912/05/13, dated 2 February 2005, Yangon.<br />
C. Geographic Area / Population Coverage<br />
Data are available for vehicle inspection in all States and Divisions (Sub-administrative area of<br />
the country) covering the whole country.<br />
D. Temporal Coverage<br />
The data and the indicator cover the period from 1998 to 2004.<br />
E. Methodology and Frequency of Coverage<br />
The original data provided for the number of total vehicles annually registered and the total<br />
number of vehicles annually inspected under the Road Transport Administration Department upon<br />
the renewal of the vehicle license.<br />
F. Methodology of Data Manipulation<br />
The percentage of vehicles inspected was calculated from the total number of vehicles registered.<br />
QUALITATIVE INFORMATION<br />
A. Strength and Weakness (data level)<br />
This indicator provides the trend of vehicular inspection for all sub-administrative units of the<br />
country as well as for the whole country. However, it could not further analyze the level of<br />
inspection versus type of vehicle and ownership.<br />
B. Reliability, Accuracy, Robustness, Uncertainty (data level)<br />
Since data were sourced from annual official records of renewing vehicle license, the reliability<br />
and accuracy of the data are high.<br />
C. Future Work Required (for data level and indicator level)<br />
The official record of inspection should be categorized by type of vehicle (in terms of type of<br />
petrol used and engine power) and ownership for better analysis. As smoke detecting devices are<br />
increasingly used and on-road smoke inspection is undertaken, the number of vehicles failing to<br />
meet the inspection standard should be also recorded to be included in the annual report.<br />
255
SUPPORTING DATA TABLES, GRAPHS AND MAPS<br />
Table 1a: Percentage of Vehicles Annually Inspected<br />
State/Division 1998 1999 2000 2001 2002 2003 2004<br />
Yangon 103.8% 93.6% 97.0% 99.8% 102.7% 95.5% 102.1%<br />
Mandalay 69.4% 72.8% 78.6% 85.1% 85.3% 81.0% 87.6%<br />
Pegu 95.0% 114.6% 86.7% 96.5% 84.6% 80.5% 92.0%<br />
Sagaing 90.7% 92.3% 95.4% 88.4% 79.9% 80.6% 93.6%<br />
Shan 81.9% 140.5% 76.6% 89.1% 84.3% 86.2% 84.4%<br />
Mon 69.7% 76.5% 72.4% 83.5% 77.0% 82.8% 89.3%<br />
Magwe 100.0% 97.4% 100.6% 101.6% 88.6% 83.4% 89.0%<br />
Tanintharyi 52.6% 100.5% 41.4% 67.0% 51.4% 63.5% 72.7%<br />
Ayeyarwaddy 89.5% 87.1% 94.4% 87.3% 74.2% 68.2% 86.5%<br />
Kachin 73.2% 73.4% 64.6% 75.8% 76.5% 71.8% 90.7%<br />
Karin 105.5% 126.8% 76.2% 91.1% 75.3% 76.5% 89.2%<br />
Rakhine 92.6% 98.7% 110.5% 92.7% 88.8% 86.7% 93.7%<br />
Chin 75.5% 108.3% 112.1% 90.8% 107.5% 100.8% 80.9%<br />
Karah 74.6% 107.6% 74.3% 87.4% 78.7% 82.9% 87.2%<br />
Total 87.9% 93.8% 84.9% 90.9% 88.5% 85.2% 90.1%<br />
Source: Road Transport Administration Department , 2005<br />
Figure 1: Vehicles Annually Inspected As a<br />
Percentage of Total Registered Vehicles<br />
256
Figure 2: Number of Vehicles Registered and Inspected<br />
Table 1b:Total Number of Vehicles Annually Registered<br />
State/Division 1998 1999 2000 2001 2002 2003 2004<br />
Yangon 171,550 165,727 160,897 153,897 152,413 152,533 160,996<br />
Mandalay 95,740 104,379 108,285 113,924 121,821 129,686 262,563<br />
Pegu 12,138 16,188 18,044 18,171 19,127 19,524 58,589<br />
Sagaing 15,285 17,208 20,699 24,056 25,581 25,973 99,276<br />
Shan 39,704 46,094 52,150 54,692 59,557 63,245 148,196<br />
Mon 15,225 17,662 16,924 16,300 16,745 16,898 39,887<br />
Magwe 8,836 10,111 11,504 13,116 14,593 15,717 50,232<br />
Tanintharyi 16,832 20,054 20,931 19,581 17,818 16,879 36,716<br />
Ayeyarwaddy 6,249 7,942 9,185 10,549 12,645 13,942 41,182<br />
Kachin 8,977 10,480 11,911 12,141 12,404 12,814 36,333<br />
Karin 3,255 3,783 3,654 3,811 3,774 3,740 11,494<br />
Rakhine 1,857 2,077 2,507 2,766 2,952 3,032 9,398<br />
Chin 335 324 330 336 361 380 886<br />
Karah 1,620 1,929 1,813 1,827 1,901 1,987 4,593<br />
Total 397,603 423,958 438,834 445,167 461,692 476,350 960,341<br />
Source: Road Transport Administration Department , 2005<br />
257
Table 1c: Total Number of Vehicles Annually Inspected<br />
State/Division 1998 1999 2000 2001 2002 2003 2004<br />
Yangon 178,009 155,087 156,149 153,567 156,599 145,706 164,365<br />
Mandalay 66,469 75,952 85,082 96,967 103,903 105,101 230,084<br />
Pegu 11,535 18,547 15,639 17,529 16,174 15,712 53,930<br />
Sagaing 13,860 15,891 19,748 21,255 20,446 20,932 92,901<br />
Shan 32,505 64,744 39,959 48,729 50,216 54,535 125,065<br />
Mon 10,613 13,517 12,256 13,605 12,896 13,995 35,613<br />
Magwe 8,838 9,846 11,578 13,327 12,929 13,112 44,712<br />
Tanintharyi 8,847 20,149 8,674 13,125 9,166 10,721 26,702<br />
Ayeyarwaddy 5,590 6,914 8,674 9,207 9,380 9,502 35,623<br />
Kachin 6,571 7,689 7,695 9,206 9,483 9,205 32,964<br />
Karin 3,434 4,795 2,784 3,473 2,840 2,860 10,252<br />
Rakhine 1,719 2,051 2,771 2,564 2,622 2,628 8,803<br />
Chin 253 351 370 305 388 383 717<br />
Karah 1,209 2,076 1,347 1,596 1,496 1,647 4,005<br />
Total 349,452 397,609 372,726 404,455 408,538 406,039 865,736<br />
Source: Road Transport Administration Department , 2005<br />
258
SUMMARY<br />
A. Policy Reference<br />
1. Purpose:<br />
The purpose of this indicator is to understand the level of measures undertaken in regulating<br />
the vehicular emissions at the point of source for controlling air pollution from automobiles.<br />
2. Relevance to Environment Planning and Management:<br />
This is relevant to urban environmental planning and management for controlling urban air<br />
quality. It is also useful for urban transportation development and management.<br />
3. Linkage to Other Indicators:<br />
The indicator is linked to indicators like “Car Equivalent Unit per Square Kilometer of Major<br />
Cities and “Ambient Air Concentration”.<br />
4. Targets:<br />
According to the Motor Vehicle Law enacted in 1989, all vehicles in <strong>Myanmar</strong> are bound to<br />
annual inspection and renewal of vehicle license. Otherwise, quotas will not be issued for<br />
purchasing petrol from government petrol station, which is the only one source for supplying<br />
automotive fuel.<br />
B. Analysis<br />
According to Table 1a, annually inspected vehicles as a percentage of total registered vehicles<br />
throughout the country fluctuated within the range of 84% to 90% during the period from 1998 to<br />
2004 (see Figure 1). A wider range of vehicle inspection has been observed in the areas such as<br />
Yangon and Mandalay Divisions where around half of total vehicles nation-wide are registered; for<br />
example, inspection in Yangon remained above 90% while there was a lower degree of inspection in<br />
Mandalay from 70 to 88% during the same period. A higher movement of vehicles from one<br />
location to another registration area and change in ownership might be the major reason for the<br />
lower percentage of inspection and registration.<br />
Tables 1b and 1c show data related to the calculation of the percentage of vehicle inspections.<br />
From these tables, it is notable that the number of vehicles annually registered has been steadily<br />
increasing at the national level, although there is some variation in some of the sub-administrative<br />
area, States and Divisions. For instance, total vehicles annually registered in Yangon Division have<br />
gradually decreased during 1999 to 2003 although increased in 2004. In contrast, Mandalay<br />
Division, in the central part of <strong>Myanmar</strong>, has steadily increased in total registered vehicles since<br />
1998. Until the end of 2004, experienced staff of the Road Transport Administration Department<br />
visually inspected the vehicle emissions for the renewal of the vehicle license and only a few digital<br />
smoke detectors were introduced in early 2005 for inspection in Yangon. Besides, ASEAN standard<br />
on vehicle emissions was recently introduced in <strong>Myanmar</strong> and is in the l early stage of enforcing<br />
the vehicle inspection in accordance with the adopted standard. The lack of national air quality<br />
standards and an environmental monitoring institute is also one of the reasons for weakening the<br />
tighter control on vehicle emissions. Therefore, these factors have compounded in evaluating the<br />
response as low and intermittent in managing the air pollution from mobile sources.<br />
259
Indicator ID<br />
Greater Mekong Subregion<br />
Indicator Fact Sheet<br />
DATABASE INFORMATION<br />
Indicator Name GHGs Emission in CO 2 Equivalent - 1990 to 2005<br />
Year of <strong>Assessment</strong> 2005<br />
Type of Indicator Pressure<br />
Frequently Asked Question (FAQ)<br />
Priority Concern Climate Change<br />
Geographic Area Union of <strong>Myanmar</strong><br />
Magnitude & Trend Low but Increasing<br />
Key Message<br />
260<br />
What is the level of GHG emissions in <strong>Myanmar</strong><br />
attributing to Global Warming?<br />
Total net GHGs emissions in CO 2 equivalent has<br />
consistently increased from 41,500 in 1994 to<br />
62,000 Gg in 2005. The agriculture and energy<br />
sectors are the major sources for total GHGs<br />
emission while the Forestry sector is the major net<br />
sink of CO 2 . the current emission level<br />
(1.1 metric ton per person) is relatively low<br />
compared to other GMS countries like Thailand,<br />
Yunnan (PRC) and Viet Nam.
TECHNICAL INFORMATION<br />
A. Definition<br />
This indicator attempts to track the amount of Green House Gases emissions in <strong>Myanmar</strong>.<br />
Green House Gases are the chemical gases that cause global warming at varying degree depending<br />
on their concentration and life horizon in the atmosphere and their heat absorptive capacities. The<br />
main GHGs are carbon dioxide (CO 2 ), methane (CH 4 ), nitrous oxide (N2 0 ).<br />
Emission of GHGs is the national anthropogenic emissions of carbon dioxide, methane and nitrous<br />
oxide. It is measured in gigagrams (Gg) (1 Gg is equal to 1000 metric ton) of CO 2 equivalent in<br />
which methane and nitrous oxide are also converted by using Global Warming Potentials (GWP).<br />
Emissions of these gases are estimated based on activity data from fuel combustion, fugitive fuel<br />
emissions, industrial processes (particular reference to CO 2 emission from Cement production in<br />
<strong>Myanmar</strong>), agriculture, forestry and land use change and waste.<br />
B. Data Source<br />
The Country <strong>Report</strong> on Asia Least-Cost Greenhouse Gas Abatement Strategy (ALGAS) for<br />
<strong>Myanmar</strong> is the main source of data employed in the fact sheet. The ALGAS project was a regional<br />
project conducted from 1995 to 1998 with funding from the Asian Development Bank, Global<br />
<strong>Environmental</strong> Facility and United Nations Development Programme. <strong>Myanmar</strong> was covered by the<br />
project and the <strong>National</strong> Commission for <strong>Environmental</strong> Affairs was the national counterpart agency<br />
(NCA) in <strong>Myanmar</strong>. A <strong>National</strong> Technical Experts (NTE) team was formed with staff from the<br />
Ministry of Agriculture and Irrigation, Ministry of Forestry, Ministry of Electric Power and Ministry<br />
of Livestock Breeding and Fishery. NTE closely worked together with the International Consultant<br />
for carrying out the national inventory on Green House Gases Emission. An abatement strategy<br />
was also part of the study for mitigating measures.<br />
In addition to the ALGAS report, the <strong>National</strong> Statistical Year Books for 1997 and 2002 were also<br />
used for compilation of some data for extrapolation.<br />
C. Geographic Area / Population Coverage<br />
The data and the indicator are indicative of GHG emissions for the Union of <strong>Myanmar</strong> as a<br />
whole.<br />
D. Temporal Coverage<br />
Temporal coverage is from base year 1990 to year 2005.<br />
E. Methodology and Frequency of Coverage<br />
During the ALGAS study, data from various departments and national statistics were utilized in<br />
developing base year inventory and thereby forecasting it up to the year 2020 for every decade. By<br />
using actual data for 1990, 1991 and 1992, a base year inventory was estimated. For the<br />
estimation of years 2000, 2010 and 2020, firstly a projection was made on growth of Gross<br />
Domestic Products and Population. Then growth of each sectors contributing to sources and sink<br />
of GHGs was interpolated. From this projection, respective values of parameters and variables<br />
related to the emission of various GHG were further calculated. Total Net Green House Gases in<br />
term of Carbon Dioxide equivalent was summed by the emission values of all GHGs estimated in<br />
the study.<br />
Calculations of CO 2 equivalents were based on Global Warming Potentials (GWPs) of 21 for CH 4<br />
and 310 for N 2 O. NOx and CO are not included since GWPs have not been developed for these<br />
gases.<br />
261
F Methodology of Data Manipulation<br />
Original data in ALGAS report were only given for base year 1990 and projected years of 2000,<br />
2010 and 2020. For the continuous period of 1990 to 2005, the required data were interpolated<br />
from these original data sets with the additional adjustment as necessary and possible as stated<br />
below; For Energy Combustion & Fugitive related emissions, data were only given for base year<br />
1990 and year 2020. Based on this figure, an annually increased rate was calculated and<br />
straight-line method was employed in filling the data from 1992 to 2005.<br />
For Industrial process related emissions, cement production data were obtained from Statistical<br />
Year Books for the period of 1990 to 2005 consecutively. The rate used in estimation of CO2<br />
emission on each ton of cement production is 0.5 ton.<br />
For emissions related to agriculture, forestry and land use, original data were only available for<br />
1990, 2000, 2010 and 2020. Annual increments in emissions were calculated for each 10 year<br />
interval and a straight line method was employed for filling the figures in the gap years.<br />
For emission from waste, data was only provided for the 1990 base year. Using projected<br />
population figures for 2000 and 2010, the annual incremental rates of emission were derived for<br />
each 10 years intervals – first decade from 1991 to 2000 and second decade from 2001 to 2010.<br />
With these incremental rates, gap years were filled by the straight line method.<br />
In addition to CO2 equivalent, CO2 emissions alone were also calculated based on the relevant data<br />
from gross energy consumption and industrial process (ALGAS report). For the sake of<br />
calculating per capita carbon dioxide emission, population data were mainly obtained from<br />
Statistical Year books of 1997 and 2002. For those gap years in 2003, 2004 and 2005, an annual<br />
population growth rate of 2.02% was used in the estimation.<br />
QUALITATIVE INFORMATION<br />
A. Strength and Weakness (data level)<br />
This indicator has advantages in comparing the level of GHGs emission among the countries<br />
attributing to global warming. However, it does not provide an understanding of the relationship<br />
between its absolute value and climate change that the country is presently facing. Besides, this is<br />
an extrapolated estimation of GHGs emission and not necessarily the GHGs atmospheric<br />
concentration of the country.<br />
B. Reliability, Accuracy, Robustness, Uncertainty (data level)<br />
Many technical assumptions were used in the original analysis of ALGAS study for estimating<br />
GHGs emission and inventory. There are many uncertainties on per unit GHGs emission rates<br />
of related activity for sourcing and sinking these gases. This weakens the robustness of the data;<br />
particularly emissions estimated for agriculture, land use and forestry sectors in which greater<br />
spatial diversity and ecological complexity have existed. In projections for year 2000, 2010 and<br />
2020 based on 1990 inventory, the reliability of the estimation depends on the projected sectoral<br />
growths that were determined by estimated GDP growth rate and projected population. Estimated<br />
emission figures for gap years may also have less accuracy because they were derived from ALGAS<br />
inventory base year and projected years by straight line method rather than calculating from actual<br />
sectoral performance in sourcing and sinking of GHGs alongside its growth changes in respected<br />
years.<br />
C. Future Work Required (for data level and indicator level)<br />
As base year inventory on green house gases was established well for year 1990 level,<br />
estimations should be further carried out for gap years between 1991 to 2005 by using actual<br />
sectoral performance in sourcing and sinking of GHGs instead of the straight line estimation made<br />
in this assessment.<br />
262
Year<br />
Figure 1: GHG Net Emission in CO 2 Equivalent (million tons)<br />
Table 1: Projected Emission of Green House Gases<br />
(Million Ton of CO 2 Equivalent)<br />
Energy Combustion &<br />
Fugitive<br />
Industrial<br />
Process<br />
Agriculture<br />
263<br />
Forestry & Land<br />
use change<br />
Waste CO 2 Equivalent Total<br />
1990 6.09 0.20 39.20 -6.66 2.69 41.5<br />
1991 6.48 0.22 40.08 -6.54 2.74 43.0<br />
1992 6.87 0.24 40.95 -6.43 2.79 44.4<br />
1993 7.27 0.20 41.82 -6.32 2.84 45.8<br />
1994 7.66 0.25 42.70 -6.20 2.89 47.3<br />
1995 8.06 0.26 43.57 -6.09 2.95 48.7<br />
1996 8.45 0.25 44.44 -5.98 3.00 50.2<br />
1997 8.84 0.24 45.31 -5.87 3.05 51.6<br />
1998 9.24 0.17 46.19 -5.75 3.10 52.9<br />
1999 9.63 0.18 47.06 -5.64 3.15 54.4<br />
2000 10.03 0.21 47.94 -5.52 3.21 55.9<br />
2001 10.42 0.19 48.57 -5.36 3.27 57.1<br />
2002 10.81 0.19 49.20 -5.21 3.32 58.3<br />
2003 11.21 0.19 49.83 -5.05 3.38 59.6<br />
2004 11.60 0.19 50.46 -4.89 3.44 60.8<br />
2005 12.00 0.19 51.09 -4.73 3.50 62.0<br />
2010 13.97 0.18 54.23 -3.94 3.80 68.2<br />
2020 17.91 0.18 62.73 -2.39 4.47 82.9<br />
Source: ALGAS <strong>Myanmar</strong> <strong>Report</strong> by ADB/GEF/UNDP/NCEA, 1998
Table 2: Greenhouse Inventory for 1990 Base Year – Gigagram (Gg)<br />
Sources and<br />
Sinks<br />
Total (Net)<br />
<strong>National</strong><br />
Emissions<br />
CO 2<br />
Emissions<br />
CO 2<br />
Removals Net CO 2 CH 4 N 2 O NO x CO<br />
264<br />
CO 2<br />
Equivalent<br />
% CO 2<br />
Equivalent<br />
67,078.3 72,988 -5,909.8 2,134.11 8.4 71.5 1,119.7 41,500 100<br />
1.All Energy<br />
(Fuel<br />
Combustion&<br />
Fugitive)<br />
3,311.8 33,11.8 119.8 0.8 71.0 1,095.5 6,086.1 14.67<br />
A. Fuel Combustion<br />
3,311.8 111,.546 0.8 71.0 1,095.5 5,913.1<br />
1.Energy and<br />
Transformation<br />
Industries<br />
1,414.3 0.04 0.005 3.8 0.45 1,416.6<br />
2.Industry 528.3 528.3<br />
3.Transport 1,005.0 0.16 0.008 9.87 54.84 1,010.8<br />
4.Commer-cial<br />
institutional<br />
5.Residential<br />
234.16 0.022 0.0008 0.22 0.14 234.87<br />
6.Traditional<br />
Biomass<br />
Burned for<br />
Energy<br />
111.31 0.82 56.94 1,040.0 2,591.7<br />
7.Others<br />
(please specify)<br />
130 0.018 0.0011 0.18 0.04 130.72<br />
B. Fugitive Fuel<br />
Emissions<br />
8.24 173.04<br />
1.Oil and<br />
Natural Gas<br />
Systems<br />
7.8 163.8<br />
2.Coal Mining 0.44 9.24<br />
2.Industrial Processes<br />
180.44 180.44 180.44 0.43<br />
A. Cement<br />
Production<br />
B. Others<br />
(please specify)<br />
180.44 180.44<br />
3.Agriculture 1,767.7 6.7 0.4478 24.18 39,202 94.47<br />
A. Enteric Fermentation<br />
396.22 8,320.6<br />
B. Manure<br />
Management<br />
43.58 915.2<br />
C. Rice Cultivation<br />
1,327 27,867<br />
D. Agricultural<br />
Soils<br />
NE 6.7 NE NE 2,077<br />
E. Prescribed<br />
Burning of<br />
Savannas<br />
0.88 0.01 0.39 23.17 21.58
F. Field Burning<br />
of Agricultural<br />
Residues<br />
G. Others<br />
(please specify)<br />
0.05 0.0016 0.0578 1.0182 1.54<br />
4.Land use<br />
Change and<br />
Forestry<br />
63,586 72,988 -9,402 118.67 0.82 -6655.7 16.04<br />
A. Changes in<br />
Forest & Other<br />
Woody Biomass<br />
Stocks<br />
46,698<br />
B. Forest and<br />
Grassland<br />
Conversion<br />
63,586<br />
C. Abandonment<br />
of Managed<br />
Lands<br />
26,290<br />
D. On Site<br />
Burning of<br />
Forest<br />
118.67 0.82<br />
5.Waste 127.925 2,686.4 6.47<br />
A. Solid Waste<br />
Disposal on<br />
Land<br />
123.72 2,598.1<br />
B. Wastewater<br />
Treatment<br />
3.25 68.25<br />
C. Others<br />
(please specify)<br />
Bunker Fuel<br />
Emissions (if<br />
available)<br />
0.955 20.06<br />
265
SUMMARY<br />
A. Policy Reference<br />
1. Purpose:<br />
The purpose of this indicator is to measure the level of major anthropogenic emissions<br />
affecting global warming.<br />
2. Relevance to Environment Planning and Management:<br />
Such emissions are largely influenced by a country’s energy use and production systems, its<br />
industrial structure, its transportation system, its agriculture and forestry sectors and the<br />
consumption patterns of the population. Sudden changes in emission levels indicate the system’s<br />
inefficiency in managing these sectors for maintaining a desirable balance between economic<br />
growth and environmental resources and its carrying capacity. Therefore, adaptive environmental<br />
planning and management is required to stabilize the emission level as well as to improve the<br />
efficiency of related sectors adjusting to overall economic growth toward the sustainable<br />
development goals.<br />
3. Linkage to Other Indicators:<br />
This indicator is closely linked to many other socio-economic and environmental indicators, for<br />
example, GDP per capita growth rate, annual energy consumption per capita, forest cover,<br />
environmental protection expenditure, and expenditure on air pollutions abatement.<br />
4. Targets:<br />
Currently there is no target set for <strong>Myanmar</strong> to reduce its emission level.<br />
5. International Environment Treaties:<br />
Primarily it relates to The United Nations Framework Convention on Climate Change and Kyoto<br />
Protocol.<br />
B. Analysis<br />
As can be observed from Figure 1, net GHG emissions in CO 2 equivalent were estimated at<br />
approximately 41,500 Gg in the 1990 base year. These were projected to increase to 55,900 Gg in<br />
year 2000, 68,200 Gg in 2010 and 82,900 Gg by 2020. The agriculture sector, mainly from rice<br />
cultivation, is by far the largest emitter of GHGs in <strong>Myanmar</strong>. It accounted for 94% of the overall<br />
emissions in 1990 and is expected to dominate throughout 2020, at a somewhat reduced rate. The<br />
energy sector is in second place but the magnitude of the emissions is dwarfed by that of the<br />
agriculture sector. The burning of fuelwood is the major contributing factor in the energy sector.<br />
Emissions from industrial process and waste, both existing and projected, are minimal.<br />
It can also be observed from Table 1 that forestry and land use change is a net sink of GHGs<br />
according to 1990 inventory and future projections. In the base year, the net removal was 6,655 Gg<br />
but this figure was estimated to decline to 2,400 Gg by 2020. This however was based on a<br />
deforestation rate of 218,800 ha per year, through to 2020. The actual deforestation rate in the<br />
1990s was closer to 400,000 ha per year and it is possible that the sink effect may have<br />
disappeared but the turn of the new millennium.<br />
It is also noted from the baseline inventory that in terms of pure CO 2 emissions, <strong>Myanmar</strong> was a<br />
net sequester, i.e. the country absorbed more CO2 gases that it generated. The growing stock in the<br />
forest and the abandonment of marginal lands compensated for all the CO 2 emissions of all the<br />
other sectors. The amounts are also significant. Approximately 67,100 Gg of CO 2 were emitted;<br />
approximately 73,000 Gg were removed. The balance of 5,900 Gg is subtracted from the other<br />
gases in the CO -equivalent equation. (See Table 2).<br />
266
Most of the other CO 2-equivalent emissions are the result of rice cultivation. In the 1990 base year,<br />
approximately 27,900 Gg of CO 2 -equivalent were emissions from rice cultivation in the form of CH4<br />
(methane) gases. 1,327 Gg of methane gases originated from rice cultivation which,<br />
translated to CO 2 -equivalent (factor is 21), results in 27,900 Gg of CO 2 -equivalent gases.<br />
The overall contribution from rice cultivation is unlike that of any of the other GMS countries. There<br />
is a valid reason for this. For <strong>Myanmar</strong>, the rate applied in calculating methane emissions was<br />
developed from the results of actual field measurements and the rate is approximately three times<br />
the magnitude of what UNFCCC recommends as a default value. The large difference in the rate is<br />
partially explained by the use of organic manure applied to the rice crop.<br />
The UNFCCC early estimate on the excess pressure on the planet is in the order of 37 million Gg.<br />
That figure can be said to be the excess that the planet cannot withstand without undergoing<br />
climate change. Obviously <strong>Myanmar</strong>’s 41,500 Gg share of the excess 37-million Gg problem is<br />
marginal. On a per capita basis and using year 2005 estimates and for emissions and population,<br />
the ratio is approximately 1.1 metric ton per person.<br />
The current estimated emission level (1.1 metric ton per person) is relatively low comparing to<br />
other GMS countries like Thailand, Yunnan (PRC) and Viet Nam; the per capita rate is also low by<br />
international standards. However, the trend and the pressure is expected to increase as methane<br />
gases from rice cultivation continue to rise and as the CO 2 sink from the growing biomass<br />
tdisappears.<br />
267
Indicator ID<br />
Indicator Name<br />
Greater Mekong Subregion<br />
Indicator Fact Sheet<br />
DATABASE INFORMATION<br />
Year of <strong>Assessment</strong> 2005<br />
Type of Indicator Response<br />
Frequently Asked Question (FAQ)<br />
Priority Concern Climate Change<br />
Geographic Area Union of <strong>Myanmar</strong><br />
268<br />
GHG Emission Over Per Unit Value of Gross<br />
Domestic Products - 1990 to 2002<br />
How efficiently have GHGs emissions being<br />
regulated in the pace of GDP growth?<br />
Impact & Trend Non-Comparable with Undetermined Trend<br />
Key Message<br />
GHGs emission per unit of GDP probably declined<br />
during the 1990s. The absence of an up-to-date<br />
GHG emission inventory makes it impossible to<br />
establish a trend and provide a reliable<br />
assessment.
TECHNICAL INFORMATION<br />
A. Definition<br />
This indicator attempts to track degree of GHG emission intensity or the amount of green<br />
house gases (GHGs) emission for every increase in per unit value of GDP. GHGs Emission Intensity<br />
is the ratio that total net emission of Green House Gases (GHG) in CO2 Equivalent is divided by<br />
total value of gross domestic products. It is expressed in Kilogram of CO2 per Kyat (Kg CO2 /Kyat).<br />
GHGs are the chemical gases that cause global warming to a varying degree depending on their<br />
concentration and life horizon in the atmosphere and their heat absorptive capacities. The main<br />
GHGs are carbon dioxide (CO2 ), methane (CH4 ), nitrous oxide (N2O). GHG emissions are national anthropogenic emissions of CO2 , CH4 and N2O. They are measured in<br />
gigagram (Gg) (1 Gg is equal to 1000 metric ton) of CO2 equivalent in which methane and nitrous<br />
oxide are also converted by using Global Warming Potentials (GWP). Emissions of these gases are<br />
estimated based on activity data from fuel combustion, fugitive fuel emissions, industrial processes<br />
(particular reference to CO2 emission from Cement production in <strong>Myanmar</strong>), agricultur<br />
B. Data Source<br />
The Country <strong>Report</strong> on Asia Least-Cost Greenhouse Gas Abatement Strategy (ALGAS) for<br />
<strong>Myanmar</strong> is the main source of data employed in the fact sheet. The ALGAS project was a regional<br />
project conducted from 1995 to 1998 with the funding of the Asian Development Bank, Global<br />
<strong>Environmental</strong> Facility and United Nations Development Programme. <strong>Myanmar</strong> was covered by the<br />
project and <strong>National</strong> Commission for <strong>Environmental</strong> Affairs was the national counterpart agency<br />
(NCA) in <strong>Myanmar</strong>. The <strong>National</strong> Technical Experts (NTE) team was formed with the staffs from<br />
Ministry of Agriculture and Irrigation, Ministry of Forestry, Ministry of Electric Power and Ministry<br />
of Livestock Breeding and Fishery. NTEs closely worked together with the international consultant<br />
for carrying out the national inventory on Green House Gases Emission. Abatement strategy was<br />
also part of the study for mitigating measures.<br />
In addition to the ALGAS report, the <strong>National</strong> Statistical Year Books for year 1997 and 2002 were<br />
also used for the data of Gross Domestic Products.<br />
C. Geographic Area / Population Coverage<br />
The data and the indicator are representative of GHG emissions for the Union of <strong>Myanmar</strong> as<br />
a whole.<br />
D. Temporal Coverage<br />
Temporal coverage is from base year 1990 to year 2002.<br />
269
E. Methodology and Frequency of Coverage<br />
During the ALGAS study, data from various departments and national statistics were utilized in<br />
developing base year inventory and thereby forecasting it up to for 2000, 2010 and 2020. By using<br />
actual data for 1990, 1991 and 1992, base year inventory was estimated. For the estimation of<br />
year 2000, 2010 and 2020, firstly a projection was made on growth of Gross Domestic Products<br />
and Population. Then growth of each sectors contribution to source and sink of GHGs was<br />
interpolated. From this projection, respective values of parameters and variables related to the<br />
emission of various GHG were further calculated. Net Green House Gases in terms of Carbon<br />
Dioxide equivalent was summed by the emission values of all major GHGs estimated in the<br />
study. Calculations of CO 2 equivalents were based on Global Warming Potentials (GWPs) of 21 for<br />
CH 4 and 310 for N 2 O. NOx and CO are not included since GWPs have not been developed for these<br />
gases. Energy consumption data were also obtained from the section of energy sector assessment<br />
in the ALGAS <strong>Myanmar</strong> <strong>Report</strong>. It was originally estimated based on primary energy consumption<br />
in traditional energy used, total commercial used and hydro-electricity energy used.<br />
The values of Gross Domestic Products for 1990 to 2001 were given in <strong>National</strong> Statistical Books<br />
of 1997 and 2002. They were calculated at 1985-86 constant price level.<br />
F. Methodology of Data Manipulation<br />
Original data in the ALGAS report were only given for the base year 1990 and projected years<br />
2000, 2010 and 2020. Emission data for gap years for the period of 1990 to 2001 were<br />
interpolated from each 10 years interval of original data set by the straight line method. However,<br />
data for industrial process were updated with the data from Statistical Year Book, particular<br />
reference to cement production. By the same token, energy consumption was also interpolated<br />
from the original data set of the ALGAS report. Then total energy consumption and total net GHGs<br />
emission in CO 2 equivalent were divided by total values of GDP for the same period for calculation<br />
of the respective intensity level. As original data of GDP values for 2001 and 2002 were based on<br />
2000-01 constant producer price level, they were converted into 1985-86 constant price level by<br />
using the consumer price index given in CSO 1989, 1993, 1997 and 2003.<br />
270
QUALITATIVE INFORMATION<br />
A. Strength and Weakness (data level)<br />
The data and the indicator are indicative of the amount of Green House Gases emitted per<br />
amount of income generated by the country’s economy. This is powerful in understanding the<br />
current level of management in mitigating the global warming by reducing its emission level while<br />
pursuing the higher economic growth with better distribution simultaneously for sustainable<br />
development. However, it should be noted that the value of GDP as a denominator in the<br />
calculation is associated with a sensitive fluctuation of price level for all goods and services. If<br />
increased GDP value is due to price level increase in related goods and services when they were<br />
produced, it is hard to explain the performance level in reducing GHGs with higher productivity and<br />
resource utilization. Moreover, annual GDP values available from national statistics are given in the<br />
local currency of Kyat and an indicative value of GHGs emission intensity becomes less usable for<br />
global and regional comparison.<br />
B. Reliability, Accuracy, Robustness, Uncertainty (data level)<br />
The reliability of data is influenced by the following conditions, which were unlikely to occur<br />
during the study done so far in estimation of Green House Gases Emission in <strong>Myanmar</strong>.<br />
• Capturing the actual growth rate of GDP in real US Dollar terms by using Purchasing Power<br />
Parity(PPP).<br />
• Comprehensiveness of secondary sectoral data in line with GDP growth for forecasting the growth<br />
of related activity that emits GHGs.<br />
• Comprehensiveness of ecological data (chemical, thermal and nutrient flow) for those diverse<br />
ecosystems existing throughout the country to estimate the associated biomass production and<br />
rate of GHGs emission from each related activity and performance.<br />
• Soundness of existing technical knowledge and reference to the nature of emission and emission<br />
rate associated with various production systems and ecosystem interactions.<br />
C. Future Work Required (for data level and indicator level)<br />
In addition to the improvements undertaken in accordance with the influencing factors<br />
suggested in the above section for better accuracy, the recalculation of this indicator could have<br />
been closer to the real situation.<br />
271
Year<br />
SUPPORTING DATA TABLES, GRAPHS AND MAPS<br />
Figure 1: GHG Emission Intensity to Gross Domestic Products<br />
Table 1: Energy Intensity and GHG Emission Intensity to GDP<br />
GDP at 1985-86<br />
Constant Price<br />
(million Kyat)**<br />
Gross Energy<br />
Consumption<br />
(million kgoe)*<br />
272<br />
GHGsCO2<br />
Equivalent Total<br />
Emission (million<br />
tonnes)*<br />
Energy Intensity<br />
per GDP (kgoe/<br />
kyat)<br />
GHGs Emission<br />
per GDP (kg<br />
CO2/kyat)<br />
1990 50,260 10,462 41.5 0.21 0.83<br />
1991 49,933 10,727 43.0 0.21 0.86<br />
1992 54,757 10,992 44.4 0.20 0.81<br />
1993 58,064 11,257 45.8 0.19 0.79<br />
1994 62,406 11,522 47.3 0.18 0.76<br />
1995 66,742 11,787 48.7 0.18 0.73<br />
1996 71,042 12,052 50.2 0.17 0.71<br />
1997 75,123 12,317 51.6 0.16 0.69<br />
1998 79,460 12,582 52.9 0.16 0.67<br />
1999 88,157 12,847 54.4 0.15 0.62<br />
2000 100,275 13,113 55.9 0.13 0.56<br />
2001 144,499 14,076 57.1 0.10 0.39<br />
2002 100,533 15,039 58.3 0.15 0.58<br />
Note: * = interpolated from ALGAS <strong>Myanmar</strong>, 1998, ** = GDP for 2001 and 2002 were given in 2000-01 constant producer<br />
price level and converted for the value at 1985-86 constant price level to be consistent with other GDP values. Consumer<br />
Price Index given in Statistical Year book of 1989, 1993, 1997 & 2003 were used for estimation<br />
Source: ADB & et al and CSO, 1989, 1993, 1997, 2003
Table 2: Data Employed in ALGAS Study for Projection of GDP Growth<br />
Rate and Share of Major Sectors in Relation to Estimated GHGs Emissions<br />
Year<br />
Agriculture (% as<br />
of GDP)<br />
Industry (% as of<br />
GDP)<br />
273<br />
Service (% as of<br />
GDP)<br />
Others (% as of<br />
GDP)<br />
Annual GDP<br />
Growth Rate<br />
1990 38.7 8.7 16.5 36.1 2.8 %<br />
1995 37.1 9.4 18.0 35.5 6.9 %<br />
2000 35.6 10.1 17.3 37.0 6.2 %<br />
2005 34.0 10.8 18.1 37.0 6.5 %<br />
2010 32.6 11.5 18.5 37.4 6.8 %<br />
2015 31.1 12.2 18.9 37.8 7.1 %<br />
2020 29.6 12.9 19.3 38.2 7.4 %<br />
Source: ADB & et al, 1998
SUMMARY<br />
A. Policy Reference<br />
1. Purpose:<br />
This indicator is useful for assessing the efficiency of performance in boosting the national<br />
income in relation to the reduction in green house gases emitted.<br />
2. Relevance to Environment Planning and Management:<br />
This indicative value is relevant in readjusting of currently level of performance in both<br />
economic and environmental management for improving efficiency in reducing its emission level as<br />
well as in striving to attain desirable economic growth and income.<br />
3. Linkage to Other Indicators:<br />
For a comprehensive understanding and analysis, this indicator could be used together with<br />
such indicators as GDP per capita growth rate, per capita rate of GHGs emission, GHGs emission<br />
per total energy consumption and environmental protection expenditure.<br />
4. Targets:<br />
Currently there is no target relevant to this indicator.<br />
5. International Environment Treaties:<br />
Primarily it relates to The United Nations Framework Convention on Climate Change and Kyoto<br />
Protocol.<br />
B. Analysis<br />
From Figure 1, it has been found that the combination of the two trends has been associated<br />
with the indicative value of GHG emission per unit value of GDP given in Table 1. It was a steadily<br />
descending trend during the period of 1990 to 2000 but fell markedly in 2001 and increased in<br />
2002. The rapid decrease in the value of the indicator in the year 2001 appears to reflect an<br />
unexpected increase in the value of GDP in that year (the ALGAS model assumed a growth rate of<br />
6.8% for 2000 whereas in reality the GDP growth rate was nearly double of this amount at 13.7%<br />
- see Table 2) rather than necessarily demonstrating a suddenly improving performance by GHG<br />
emitters. This increase illustrates one of the pitfalls of relaying on assumed rather than actual<br />
values of indicators assessing performance.<br />
In general, a steadily descending trend of the indicator value is desirable as it suggests that the<br />
energy potentially giving rise to GHG emissions is being produced with increasing efficiency. In the<br />
case of <strong>Myanmar</strong>, there are signs that the indicator values may be declining but the absence of<br />
fresh (post-1990) estimates of GHG emissions makes it impossible to say with confidence what the<br />
recent trend has been.<br />
274
ENVIRONMENTAL<br />
PERFORMANCE ASSESSMENT IN<br />
MANDALAY CITY<br />
Background<br />
1. Mandalay is in the central region of <strong>Myanmar</strong><br />
located at 21°58’ N 96°04’E, 716 km north of<br />
Yangon Capital. The city is bordered by the<br />
Ayeyarwaddy River at the west and connected to all<br />
parts of the country all year round by a<br />
transportation network. Mandalay is the capital of<br />
Mandalay Division and the second largest city in<br />
<strong>Myanmar</strong>. Because of its strategic location,<br />
Mandalay is economically active and fast becoming<br />
a major commercial and communication center<br />
with border trade routes to the People’s Republic of<br />
China (PRC) and India. Since <strong>Myanmar</strong>’s adoption<br />
of a market economy in 1988, Mandalay has seen<br />
rapid urbanization. Urban population has grown<br />
from 722,235 in 1994 to 875,252 in 2005 at a<br />
rate of 2.3 % per year (Mandalay’s Immigration<br />
and <strong>National</strong> Registration Department, 2005) and<br />
urban area to 117 square kilometer (km2) (Tun Kyi,<br />
U 2004). The municipal area of the city consists of<br />
five administrative townships: Aung Myay Tharzan,<br />
Chan Aye Tharzan, Maha Aung Mye, Chan Mya<br />
Tharzi and Pyi Gyi Tagon. Two<br />
myanmar<br />
national environmental<br />
performanCe assessment<br />
(epa) report<br />
Case study 1<br />
industrial zones have been established at the<br />
southern urban fringe of Mandalay City and<br />
approximately 1,131 factories, workshops and<br />
cottage industries are operating and providing<br />
employment to 11,412 persons (Mandalay’s District<br />
Peace and Development Council, 2005).<br />
2. This rapid urbanization in Mandalay city has led<br />
to increasing urban environmental concerns<br />
including solid waste, air pollution, water pollution<br />
and sustainable use of water resources. There are<br />
two main reasons for selecting Mandalay city as<br />
the case study:<br />
i) To raise awareness on environmental issues<br />
affecting Mandalay at local and national<br />
level in the <strong>National</strong> Commission for<br />
<strong>Environmental</strong> Affairs (NCEA), and<br />
ii) To initiate the process of environmental<br />
performance assessment (EPA) at the<br />
local level, introducing the concept,<br />
technique and methodology of EPA to the<br />
urban environmental authority of Mandalay<br />
City Development Committee (MCDC).<br />
3. The case study team comprised of the<br />
following members, collaborating with the<br />
authority of MCDC, particularly with technical staff<br />
of the Water and Sanitation Department. The team<br />
1 In the old capital of Burmese King, there is a palace surrounded by a moat and water from the moat was used in the past as a main source<br />
of water (drinking and domestic use) for urban dwellers. Some parts of township still rely on moat water for domestic use. Moat water is<br />
replenished by water coming from Sedawgyi Dam.<br />
2 Project was built with a loan from ADB ($15 million) and OPEC ($7 million ) with the government investment of MK323.135 million, (WSD/<br />
MCDC, 2005b).<br />
3 WSD/MCDC is a key authority for managing the urban water supply in Mandalay city with major responsibilities for (1) formulation of<br />
water supply policies, (2) preparing, allocating and controlling the budget for water supply, (3) supplying enough clean water to meet water<br />
demand, (4) controlling water quality, (5) billing and collection of water charges, (6) functioning and maintaining the existing water supply<br />
system, (7) formulation and execution of plans for improvement including extension of the existing water supply system and facilities, and (8)<br />
procuring pumps, pipes, equipments and materials supporting to water supply system. (Tun Kyi, U 2004)<br />
275
Map 1: Mandalay City<br />
276
conducted local visits in Mandalay City during the<br />
period of 17-24 July 2005.<br />
i) Daw Yin Yin Lay, Joint Secretary and<br />
Director of <strong>National</strong> Commission for Envi<br />
ronmental Affairs, <strong>National</strong> Focal Point of<br />
SEF II Project and Team leader of <strong>National</strong><br />
Technical Reviewer Team<br />
ii) Dr. Than Htut, Deputy Director,<br />
Occupational Health Unit, Department of<br />
Health and Technical Reviewer of <strong>National</strong><br />
Technical Reviewer Team<br />
iii) U Win Myo Thu, Domestic Consultant,<br />
<strong>Environmental</strong> Issues, SEF II Project<br />
iv) U Maung Maung Than, Domestic<br />
Consultant, <strong>Environmental</strong> Database, SEF II<br />
Project<br />
v) Daw Ye Ye Htwe, Head of Branch, <strong>National</strong><br />
Commission for <strong>Environmental</strong> Affairs<br />
vi) U Kyaw San Naing, Head of Branch,<br />
<strong>National</strong> Commission for <strong>Environmental</strong><br />
Affairs<br />
vii) U Aung Aung Lay, Head of Branch, <strong>National</strong><br />
Commission for <strong>Environmental</strong> Affairs<br />
4. Sustainable use of water resources has been<br />
selected as the environmental concern for the case<br />
study. As a signatory country to the Millennium<br />
Development Goals (MDG), it is also justifiable to<br />
examine the current performance at local level in<br />
realizing the national policy target of supplying<br />
safe drinking water to all citizens by the year 2015.<br />
2. <strong>Environmental</strong> <strong>Performance</strong> <strong>Assessment</strong> -<br />
Sustainable Use of Water Resource in Mandalay City<br />
2.1. Context<br />
5. Water is supplied in Mandalay city mainly by<br />
a network of piped water supply system, private<br />
wells and moat water . The piped water supply<br />
system was constructed during the period 1983<br />
to 1992 under the project Mandalay Water Supply<br />
Project, co-financed by ADB, OPEC and <strong>Myanmar</strong><br />
Economic Bank . The water source for the piped<br />
water supply system is ground water mainly drawn<br />
from tube well pumping stations along the banks<br />
of the Ayeyarwaddy River. The water drawn is<br />
conveyed to reservoir at No.1 Booster Pumping<br />
Station (BSP1) for distribution by a network of<br />
277<br />
pipes. Originally, 19 high yielding tube wells (16<br />
inches diameter and average depth of 450 feet)<br />
were constructed during the ADB funded project<br />
and the average pumping capacity of each tube<br />
well was approximately about 50,000 imperial<br />
gallons per hour. After ADB project, Water and<br />
Sanitation Department of Mandalay City<br />
Development Committee (WSD/MCDC) has been<br />
continuing to invest in subsequent years for<br />
improving and expanding the piped water<br />
supply system. To date, there are 32 tube wells<br />
with different pumping capacity in sourcing water<br />
to a distribution network of an existing system<br />
(WSD/MCDC 2005a) . However, the chlorination<br />
facility has not been functioning and some water<br />
losses have been noted during inspection of water<br />
meters.<br />
6. As only 60% of the city area is covered by the<br />
current piped water supply network (Tun Kyi,<br />
U 2004), residents living outside of existing pipe<br />
network have to rely on water sourced from tube<br />
wells dug by WSD/MCDC and international donor<br />
projects. There is no centralized water supply<br />
system for industrial water use and factory<br />
owners have to tap ground water through their<br />
own resources. In general, available water quality<br />
data suggests that water from tube wells is safe for<br />
drinking.<br />
2.2. State (Water Resource)<br />
7. A JICA study (2002-03) revealed that ground<br />
water abstraction in Mandalay city was 170,000<br />
cubic meters (m 3 ) per day against the 100,000<br />
m3 per day of natural recharge, leading to overex<br />
ploitation of ground water at rate 1.7 times higher<br />
than the level of water replenishment (JICA 2003,<br />
pp: 2-136). It further suggests that the maximum<br />
pumping rate should not exceed 2 times the natural<br />
recharge rate and private wells should be restricted<br />
in the natural recharge area. JICA’s study finding<br />
is also consistent with that of the 1997 UN study<br />
about severe water scarcity in Mandalay city. The<br />
study indicated that total water withdrawal (including<br />
agriculture, domestic and industrial use) is 106 %<br />
of available wa ter resource It has been found that<br />
water resources are severely strained even if water<br />
4 There are 28 tube wells with a pumping capacity of 45,000 gallons per hour. All of them except one tube well are functioning in pumping<br />
up the water for supply. Additionally there are 2 tube wells of 40,000 gallons per hour pumping capacity and another 2 tube wells of 35,000<br />
gallons per hour pumping capacity.<br />
5 According to a field study carried out by the Japanese International Cooperation Agency in 2003 (JICA, 2003)
withdrawal is just above 40% of available water<br />
resource; the situation in Mandalay city is thus<br />
already critical (Zaw Win, 2004 quoted in Irrigation<br />
Department 2005).<br />
8. The indicator ‘Percentage of Total Urban<br />
Population with Access to Piped Water Supply’ is<br />
selected for determining the state of safe water<br />
supply in Mandalay city. Water supply data were<br />
primarily sourced from WSD/MCDC whereas<br />
population data were obtained from Immigration<br />
and <strong>National</strong> Registration Department of Mandalay<br />
District. Temporal coverage is from 1994 to 2003.<br />
Indicator: Percentage of Total Urban Population with<br />
Access to Piped Water Supply 1994-2003<br />
9. This indicator tracks total urban population<br />
coverage of current piped water supply in Mandalay<br />
city. The population serviced by piped water supply<br />
was estimated by multiplying the total number of<br />
water meters installed in the city by the number<br />
of persons benefiting from each water distribution<br />
outlet at which water meter is installed. The<br />
assumption was made that on average, one water<br />
278<br />
distribution outlet would be supplying water to<br />
eight water users. Data on this indicator is given<br />
in Annex 1 and the percentage population coverage<br />
by piped water supply is shown in Figure 1.<br />
10. The target was to supply piped water to over<br />
90% of total residents living in the 4 old<br />
townships by 1988. This serves as the target for<br />
assessment in this EPA to evaluate the performance<br />
of improved access to safe drinking water.<br />
11. As seen in Annex 1a, total water meters in stalled<br />
in Mandalay city have gradually increased from<br />
43,183 in 1994 to 65,413 in 2003. Accordingly,<br />
the total population served has grown from<br />
345,464 in 1994 to 523,304 in 2003 (see Annex<br />
1b). Hence, approximately 77% of the planned<br />
target of access to safe water supply by the year<br />
2000 was met in 2003.<br />
12. Figure 1 also shows that the target of 90%<br />
population coverage by piped water supply are<br />
met or approached only in Chan Aye Thar Zan and<br />
Mahar Aung Mye townships and only modestly<br />
achieved in Aung Mye Thar Zan and Chan Aye<br />
Thar Zi townships with populations of 47% and<br />
32% of the total township population respectively,<br />
Figure 1: Percentage of Total Population with<br />
Access to a Piped Water Supply System<br />
Source: WSD/MCDC (2005a), MIMNRD (2005)<br />
6 These newly demarcated townships (after 1988) consist of the major urban areas of old townships, namely South East and South West<br />
townships.<br />
7 This township consists of former North West Township’s areas.<br />
8<br />
Some part of the former South East Township has recently appeared as a major area of the new satellite township of Chan Mya Tharzi.
in 2003. In the case of Aung Mye Tharzi, the local<br />
residents are still relying on moat water supply as<br />
an alternative. In the newly established satellite<br />
township of Pyi Gyi Tagon, only 11% of total<br />
township population has access to a piped water<br />
supply as technically it is less feasible for<br />
extending the piping network in this township.<br />
13. The overall population with access to a piped<br />
water supply in Mandalay city is 62% of the total<br />
city population. The population with access to<br />
either moat water supply or water supply from<br />
tube wells developed by WSD/MCDC in other<br />
township areas unconnected to existing piped<br />
water supply system, are not included.<br />
14. During the case study, attempts were made to<br />
calculate the per capita volume of water available<br />
from piped water supply system as a supplementary<br />
indicator for understanding the level of people with<br />
access to a sufficient quantity of water for their<br />
daily requirements. According to JICA’s 2002 study,<br />
the volume of daily water supplied by piped water<br />
systems for consumption is 18.282 million per<br />
day. At a service population of 510,064 in 2002<br />
(see Annex 1b), per capita availability of piped<br />
water was found to be 36 gallons per person per<br />
day approximately. Given that 30 gallons of water<br />
Year<br />
Maximum Water Yield<br />
(Million gallons per day)<br />
(a)<br />
Daily Water Production<br />
(Million gallons per day)<br />
(b)<br />
279<br />
per person per day is sufficient for daily consumption<br />
in Mandalay city (Tun Kyi, U 2005), the present per<br />
capita water volume available from piped water<br />
supply (as of 2002) is above the basic minimum<br />
need level, though it might have been declined<br />
over time. Due to a lack of data, the trend for this<br />
indicator could not be established.<br />
Suggested Rating: Average<br />
and Stabilizing<br />
Justification: Access to safe piped water supply in<br />
Mandalay city has been steadily improving with an<br />
average of service population of 62% of the total city<br />
population having such access, against a target of 90%<br />
population. More needs to be done to improve this<br />
access.<br />
2.3. Pressure (Water Resource)<br />
Indicator: Percentage Deficit in Groundwater<br />
Abstraction for Daily Water Supply 1996 - 2003<br />
15. Improved access to safe water supply is<br />
dependent upon the availability of raw water.<br />
Groundwater is a vital resource for water<br />
supply. The percentage deficit in groundwater<br />
Table 1: Deficit of Ground Water Abstraction for Daily Water Supply<br />
Daily Water deficit<br />
(Million gallons per day)<br />
(c)<br />
% of Water Deficit<br />
(d)<br />
1996 22.7 19.8 2.88 12.7%<br />
1997 24.8 21.6 3.24 13.0%<br />
1998 27.0 21.6 5.40 20.0%<br />
1999 29.2 23.4 5.76 19.8%<br />
2000 29.2 23.4 5.76 19.8%<br />
2001 31.1 25.0 6.08 19.6%<br />
2002 31.1 25.0 6.08 19.6%<br />
2003 33.0 26.2 6.80 20.6%<br />
Note: (a) = maximum water yield is calculated based on the assumption that groundwater is abstracted<br />
by pumping up all service tube wells on 24 hours service. (b) = daily water production is calculated<br />
based on daily operational record of tube wells of WSD/MCDC. (c) = Water deficit is obtained from the<br />
subtraction of daily water production from the maximum water yield that can be potentially abstracted<br />
on 24 hour a day basis as designed by established piped water supply system. (d) = water deficit as a<br />
percentage of total maximum yield.<br />
Source: WSD/MCDC (2005a)
abstraction for daily water supply needs is selected<br />
as the ‘pressure’ indicator, particularly within the<br />
service area of piped water supply network.<br />
16. This indicator tracks the existing level of water<br />
deficit as a percentage of the estimated volume<br />
of maximum water yield that could be abstracted<br />
from all service tube wells on 24 hours a day<br />
service. Water deficit was calculated by subtracting<br />
the actual water volume of daily production from<br />
the total estimated water volume of maximum<br />
yield. Then, it was divided by the maximum yield<br />
to calculate the percentage deficit. All data<br />
employed in this indicator were obtained from<br />
daily records of WSD/MCDC for the period 1996<br />
to 2003.<br />
17. As seen in Table 1 and Figure 2, water deficit<br />
has increased imposing pressure on daily water<br />
supply, rising from 2.88 million gallons per day<br />
in 1998 to 6.8 million gallons per day in 2003.<br />
280<br />
Key factors for this deficit include (i) insufficient<br />
electricity supply for pumping up the service tube<br />
wells continuously; (ii) reduced mechanical<br />
capacity for water pumps and (iii) declining<br />
groundwater resources.<br />
18. As overexploitation has been reported by<br />
various studies (JICA and UN), there might be a<br />
lower groundwater level in the aquifer and water<br />
pumps are unable to pump up the water at design<br />
capacity. Given that groundwater resources of<br />
Mandalay city are dependent upon natural<br />
recharge from the Ayeyarwaddy River and upper<br />
watershed (JICA, 2003 pp: 2-136), associated<br />
environmental degradation of these sources are<br />
also contributing to the declining groundwater<br />
level in Mandalay city. The situation might be<br />
also be aggravated if there is uncontrolled excessive<br />
pumping rate of private tube wells in natural<br />
recharge areas.<br />
Figure 2: Water Deficit for Water Supply<br />
Source: WSD/MCDC 2005a
Table 2: Expenditure on Water Supply by WSD/MCDC in Mandalay City<br />
Year<br />
Annual Expenditure<br />
on Water<br />
Supply (Kyat)<br />
Suggested Rating: High<br />
and increasing<br />
Justification: As of 2003, water shortage was at 20.6%<br />
of potential maximum yield having risen from 12.7 %<br />
in 1996. Declining groundwater resources is a key<br />
factor in this growing shortage and the trend seems to<br />
be worsening.<br />
2.4. Response (Water Resource)<br />
City Population<br />
Indicator: Expenditure Per Person on Water Supply<br />
as a Percentage of Per Capita GDP 1996-2003<br />
19. With growing population, more effort is<br />
required in extending and expanding water supply<br />
facilities and related infrastructure to improve<br />
Expenditure per<br />
person on Water<br />
Supply<br />
(Kyat/person)<br />
281<br />
Per capita GDP<br />
(Kyat/person)<br />
Expenditure per<br />
person on water suply<br />
as % of per capita GDP<br />
2001 - 02 141,002,695 821,914 172 91,795 0.19%<br />
2002 - 03 242,343,185 837,685 289 154,132 0.19%<br />
2003 - 04 168,657,025 842,330 200 179,177 0.11%<br />
2004 - 05 352,383,865 856,264 412 227,848 0.18%<br />
Source: WSD/MCDC 2005a, MNPD 2005, MIMNRD 2005<br />
Figure 3: Expenditure Per Person on Water Supply<br />
as % of Per capita GDP in Mandalay<br />
Source: WSD/MCDC 2005a, MNPD 2005, MIMNRD 2005<br />
access to safe drinking water. This is a matter<br />
of allocating more financial resources over time.<br />
Hence the indicator chosen is ‘expenditure per<br />
person on water supply as a percentage of per<br />
capita GDP’.<br />
20. This indicator tracks financial availability for<br />
improving water supply in Mandalay city in terms<br />
of annual spending level of WSD/MCDC on a per<br />
capita basis compared to per capita gross domestic<br />
product (GDP) of Mandalay district (most of the<br />
townships in this district are part of Mandalay<br />
municipal areas). The unit of this indicator is<br />
given as percentage of expenditure on water supply<br />
(kyat/person) over per capita GDP value. Data for<br />
expenditure on water supply were obtained from<br />
WSD/MCDC, while official data for per capita<br />
GDP value are provided by the <strong>National</strong> Planning<br />
Department of Mandalay district.
21. Population data have to be based on official<br />
population statistics of Immigration and <strong>National</strong><br />
Registration Department of Mandalay district for<br />
the period from 2001-2002 budget years to<br />
2004-2005 budget years.<br />
22. As observed in Table 2, expenditure on water<br />
supply has been increasing since 2001/2002. On<br />
a per capita basis, expenditure per person is found<br />
to be MK172 in 2001 and gradually increasing to<br />
MK289 and 412 respectively in 2002 and 2004.<br />
The spending level fell in 2003 compared to the<br />
previous year of 2002. Per capita GDP value has<br />
also increased from 91,795 to MK227,848 over the<br />
period from 2001 to 2004; resulting in a decline<br />
in expenditure per person on water supply from<br />
0.19% of per capita GDP in 2001 to 0.11% in<br />
2003 and 0.18% in 2004.<br />
23. Thus, Figure 3 illustrates the declining trend<br />
of expenditure on water supply as a percentage<br />
of Mandalay GDP. As a total annual expenditure of<br />
WSD/MCDC also included of the expenses of other<br />
activity like infrastructure development for water<br />
pollution control and treatment facility, the actual<br />
amount of financial resource available for improving<br />
water supply might be slightly lower than the calculation<br />
made here.<br />
Suggested Rating: Low<br />
and Sporadic<br />
Justification: Current spending levels on water supply at<br />
lower than one percent of per capita GDP is relatively<br />
low. A declining trend of expenditure indicates sporadic<br />
response in improving people’s access to safer drinking<br />
water supply.<br />
3. Conclusion<br />
24. Access to safe water 24. Access to safe water<br />
supply in Mandalay city has reached over 60% of<br />
the total population. However, it is notable that<br />
only 2 out of the total 5 administrative<br />
townships within the municipal area of Mandalay<br />
city are able to supply safe water to 90% o the<br />
total township population as planned. Besides,<br />
only 77% of the planned target in improving<br />
282<br />
people’s access to safe piped water supply was<br />
achieved by the year 2003/2004. The population<br />
has been increasing by 2.3% per year resulting in<br />
a water deficit in daily water production for<br />
sufficient supply.<br />
25. According to health statistics, the lower<br />
access to safe piped drinking water supply in Pyi<br />
Gyi Tagon Township has been associated with the<br />
trend (as seen in Figure 4) of a relatively higher<br />
prevalence of water borne diseases, which include<br />
Diarrhea, Dysentery, Para Typhoid and Viral<br />
Hepatitis. No significant sign of a declining trend<br />
in the average prevalence of these diseases is<br />
observed within the period 2001 to 2004<br />
(Department of Health, 2005).<br />
26. A consumer satisfaction survey that was<br />
carried out by JICA’s study in 2001 revealed that<br />
satisfaction with the current piped water supply<br />
system was found with 60% and 70% of the total<br />
respondents in Aung Mye Tharzan and Chan Aye<br />
Tharzan respectively, while it was 80% in Mahar<br />
Aung Mye and Chan Mya Tharzi (JICA 2003, pp:2-46).<br />
This indicates the need for improvement of<br />
performance in supplying safe water supply to<br />
water users.<br />
27. The existing level of financial allocation to<br />
increasing water supply networks is very low,<br />
especially for a growing population. Substantial<br />
financial resources will be required for achieving<br />
the goal of complete access to safe water in the<br />
Mandalay city.<br />
28. Total revenue from water supply at 1994 constant<br />
price level is given in Table 3 and it indicates the<br />
decline of revenue level from MK65.19 million in<br />
1995 to MK42.43 million in 2004. Total investment<br />
in piped water supply system was $22 million<br />
with an annual depreciation cost could be roughly<br />
$1 million per year for a 20-year service life of<br />
the system. At government official exchange rate<br />
of MK450 for one Foreign Exchange Certificate<br />
(1 US $) (JICA, 2003), this will be equivalent to<br />
MK450 million. If so, the current annual revenue<br />
level is ten times lower than annual depreciation<br />
of the existing water infrastructure. This weakens<br />
the financial recovery of the existing water supply<br />
system and consequently it affects the sustainable
use of water resources. Illegal use of piped water<br />
is highlighted by JICA’s study and measures will<br />
be needed to improve the efficiency of the whole<br />
system. Subsidy policy on water charging should<br />
be accordingly reviewed and changed as<br />
necessary. Commissioning of feasibility studies<br />
will be also required for promoting the private<br />
sector’s investment in urban water supply and<br />
developing an alternative source of water supply<br />
rather relying on groundwater, which is already<br />
under threat from overexploitation.<br />
Suggested Rating: 1 Star<br />
Justification: Increased population and water<br />
shortage has threatened the availability of safe water<br />
supply. Limited financial capacity makes the<br />
management of water resource challenging for realizing<br />
the national goal of improving citizens’ access to safer<br />
water supply on a sustainable basis.<br />
29. As this case study was carried out for the<br />
main purposes of introducing EPA and initiating<br />
its process at Mandalay city, the following<br />
suggestions are made for future conduct of EPA.<br />
i) An effort should be made to improve the<br />
data employed in this case study as they<br />
were collected and analyzed within the<br />
limitation of available time. There might<br />
be a data discrepancy on water<br />
production, distribution and supply.<br />
Financial data should be examined again<br />
for including all direct and indirect cost and<br />
income of water supply i.e. water charges<br />
on international hotels are not included in<br />
the analysis here.<br />
ii) A future EPA should also include other<br />
environmental concerns of inadequate<br />
solid waste management, mobile source<br />
air pollution and inland water pollution.<br />
It needs to consider that appropriate policy<br />
targets are set for managing the urban<br />
environment; for example, policy targets<br />
for future population coverage for water<br />
supply; effluent BOD level for discharging<br />
industrial and domestic water to natural<br />
water bodies; appropriate car equivalent<br />
units etc.<br />
283<br />
iii) Mandalay City Development Committee<br />
(MCDC) will remain the leading authority<br />
for future conduct of EPA in<br />
Mandalay city. For wider technical and<br />
social coverage, it will be also necessary to<br />
form an EPA team comprising of resource<br />
persons from other government agencies,<br />
university, private firms and local NGOs. It<br />
should also seek an opportunity to establish<br />
an information center for compiling<br />
available environmental information and<br />
baseline data. There should be<br />
collaboration with the <strong>National</strong><br />
Commissions for Environ mental Affairs for<br />
conducting EPAs in future.<br />
Reference<br />
ADB.1983. <strong>Report</strong> on Project Design for Mandalay<br />
City Water Supply. Prepared by Mandalay Water<br />
Supply Project Engineering Consultants for Asian<br />
Development Bank and Mandalay City<br />
Development Committee, Mandalay.<br />
CSO..2003. <strong>National</strong> Statistical Yearbook – 2003.<br />
Central Statistical Organization, the Government<br />
of the Union of <strong>Myanmar</strong>, Yangon.<br />
DHSHD.2004. Data provided for <strong>Environmental</strong><br />
<strong>Performance</strong> <strong>Assessment</strong>, submission of<br />
Department of Human Settlement and Housing<br />
Development to the <strong>National</strong> Commission for<br />
<strong>Environmental</strong> Affairs, Yangon.<br />
District Peace and Development Council,<br />
Mandalay. 2005. <strong>Report</strong>ing on Implementation<br />
Status of Developing Industrial Zones in<br />
Mandalay City. In Burmese. Mandalay. DOH.<br />
2005. Data sheets for Morbidity and Mortality of<br />
Diseases under <strong>National</strong> Surveillance in Mandalay<br />
Division by township, Department of Health, data<br />
shared to SEF II Mandalay case study, Mandalay.<br />
DOP. 2005.Amendment of Population Data in EPA<br />
<strong>Report</strong>. Submission of Department of Population<br />
to <strong>National</strong> Commission for <strong>Environmental</strong> Affairs,<br />
Reference Letter No: 300/15 (0011)/ La-Pa-Na.<br />
31 October.. Yangon. JICA. 2003.The Study on<br />
Water Supply System in Mandalay City and In<br />
the Central Dry Zone in the Union of <strong>Myanmar</strong>,<br />
Final <strong>Report</strong>, Volume II, Main <strong>Report</strong>, prepared by<br />
Kyowa Engineering Consultant Co. LTD and Pacific<br />
Consultants International Co. LTD for Japanese<br />
International Cooperation Agencies, Mandalay City
Annex 1a: No of Water Meters Installed in Townships of Mandalay City<br />
Year<br />
Aung Mye Thar<br />
Zan<br />
Chan Aye Thar<br />
Zan<br />
Ma Har Aung<br />
Mye<br />
284<br />
Chan Mya Thar<br />
Zi<br />
Pyi Gyi Ta Gon Total<br />
1994 8,637 17,273 17,273 - - 43,183<br />
1995 9,190 17,957 18,232 1,307 116 46,802<br />
1996 10,065 18,593 18,978 2,442 220 50,298<br />
1997 10,843 19,467 19,867 3,687 313 54,177<br />
1998 11,343 20,060 20,285 4,072 440 56,200<br />
1999 11,739 20,658 20,635 4,527 549 58,108<br />
2000 12,075 21,118 21,118 4,860 591 59,762<br />
2001 12,530 21,570 21,631 5,281 628 61,640<br />
2002 13,028 22,175 22,155 5,743 657 63,758<br />
2003 13,459 22,552 22,614 6,115 673 65,413<br />
Source: WSD/MCDC (2005)<br />
Year<br />
Aung Mye Thar<br />
Zan<br />
Annex 1b: Service Population by Piped<br />
Water Supply in Mandalay City<br />
Chan Aye Thar<br />
Zan<br />
Ma Har Aung<br />
Mye<br />
Chan Mya Thar<br />
Zi<br />
Pyi Gyi Ta Gon Total<br />
1994 69,093 138,186 138,186 - - 345,464<br />
1995 73,517 143,658 145,858 10,456 928 374,416<br />
1996 80,517 148,746 151,826 19,536 1,760 402,384<br />
1997 86,741 155,738 158,938 29,496 2,504 433,416<br />
1998 90,741 160,482 162,282 32,576 3,520 449,600<br />
1999 93,909 165,266 165,082 36,216 4,392 464,864<br />
2000 96,597 168,946 168,946 38,880 4,728 478,096<br />
2001 100,237 172,562 173,050 42,248 5,024 493,120<br />
2002 104,221 177,402 177,242 45,944 5,256 510,064<br />
2003 107,669 180,418 180,914 48,920 5,384 523,304<br />
Note: Assumption is made that one water meter may supply water to 8 persons.<br />
Source: WSD/ MCDC (2005)
Year<br />
Annex 1c: Township and Total Population of Mandalay City<br />
Aung Mye Thar<br />
Zan<br />
Chan Aye Thar<br />
Zan<br />
Ma Har Aung<br />
Mye<br />
285<br />
Chan Mya Thar<br />
Zi<br />
Pyi Gyi Ta Gon Total<br />
1994 194,860 182,161 169,435 132,285 43,494 722,235<br />
1995 198,199 185,841 172,366 134,008 44,246 734,660<br />
1996 201,596 189,595 175,347 135,753 45,012 747,303<br />
1997 205,051 193,425 178,381 137,521 45,790 760,168<br />
1998 208,625 197,332 181,465 138,333 46,582 772,337<br />
1999 212,139 201,318 184,604 142,686 47,387 788,134<br />
2000 215,774 205,385 187,798 144,543 48,207 801,707<br />
2001 220,562 212,447 191,971 147,753 49,181 821,914<br />
2002 225,456 214,593 196,231 151,032 50,373 837,685<br />
2003 226,706 215,783 197,319 151,870 50,652 842,330<br />
Source: NIMNRD (2005)<br />
Year<br />
Annex 1d: Percentage of Total Population with<br />
Access to Pipe Water Supply<br />
Aung Mye Thar<br />
Zan<br />
Chan Aye Thar<br />
Zan<br />
Ma Har Aung<br />
Mye<br />
Chan Mya Thar<br />
Zi<br />
Pyi Gyi Ta Gon Total<br />
1994 35% 76% 82% 0% 0% 48%<br />
1995 37% 77% 85% 8% 2% 51%<br />
1996 40% 78% 87% 14% 4% 54%<br />
1997 42% 81% 89% 21% 5% 57%<br />
1998 43% 81% 89% 24% 8% 58%<br />
1999 44% 82% 89% 25% 9% 59%<br />
2000 45% 82% 90% 27% 10% 60%<br />
2001 45% 81% 90% 29% 10% 60%<br />
2002 46% 83% 90% 30% 10% 61%<br />
2003 47% 84% 92% 32% 11% 62%<br />
Source: based on Annex 1b and 1c
Year<br />
Annex 2: Cases of Waterborne Diseases and Their<br />
Prevalence Per Thousand Population in Mandalay Year Diarrhea<br />
Diarrhea<br />
(no of case)<br />
Dysentery<br />
(no of case)<br />
Para Typhoid<br />
(no of case)<br />
286<br />
Viral Hepatitis<br />
(no of case)<br />
Total No.<br />
of Cases<br />
Population<br />
Prevalence<br />
per thousand<br />
population<br />
Aung Mye Thar Zan Township<br />
2001 197 3 0 0 200 220,562 0.9<br />
2002 201 43 1 3 248 225,456 1.1<br />
2003 239 50 0 2 291 226,706 1.3<br />
2004 386 45 0 0 431 230,456 1.9<br />
Chan Aye Thar Zan Township<br />
2001 381 226 0 2 609 212,447 2.9<br />
2002 260 206 15 0 481 214,593 2.2<br />
2003 332 215 0 0 547 215,783 2.5<br />
2004 400 122 0 0 522 219,352 2.4<br />
Mahar Aung Mye Township<br />
2001 391 114 0 14 519 191,971 2.7<br />
2002 371 135 0 0 506 196,231 2.6<br />
2003 262 75 0 0 337 197,319 1.7<br />
2004 214 49 0 1 264 200,584 1.3<br />
Chan Mye Thar Zi Township<br />
2001 186 81 1 8 276 147,753 1.9<br />
2002 211 57 0 1 269 151,032 1.8<br />
2003 117 60 0 0 177 151,870 1.2<br />
2004 235 55 0 0 290 154,382 1.9<br />
Pyi Gyi Tagon Township<br />
2001 250 84 2 3 339 49,181 6.9<br />
2002 280 114 3 6 403 50373 8.0<br />
2003 314 138 15 10 477 50,652 9.4<br />
2004 333 133 10 1 477 51,490 9.3<br />
Source: Morbidity and Mortality of Disease under <strong>National</strong> Surveillance in Mandalay Division by township, Department of Health 2005
Development Committee, Department of<br />
Development Affairs, Ministry of Progress of<br />
Border Areas and <strong>National</strong> Races and<br />
Development Affairs, the Government of the Union<br />
of <strong>Myanmar</strong>, Yangon.<br />
Mandalay City. 2005. Available: http://<br />
en.wikipedia.org/wiki/Mandalay<br />
MIMNRD.2005. Population data for Mandalay City,<br />
Immigration and <strong>National</strong> Registration Department<br />
of Mandalay District, official data shared to SEF II<br />
Mandalay case study. Mandalay.<br />
MNPD. 2005. Data on per capita GDP value of<br />
Mandalay Division, <strong>National</strong> Planning Department<br />
of Mandalay District, data shared to SEF II<br />
Mandalay case study, Mandalay.<br />
Tun Kyi,U. 2004.Mandalay City Water Supply<br />
System, unpublished departmental technical<br />
paper, Mandalay.<br />
287<br />
WSD/MCDC. 2005a. Data related to Water Supply<br />
and Sanitation, Water and Sanitation Department<br />
of Mandalay City Development Committee, data<br />
shared to SEF II Mandalay case study, Mandalay.<br />
WSD/MCDC.2005b. Data related to Water Supply<br />
and Water Pollution Control, Water and Sanitation<br />
Department of Mandalay City Development<br />
Committee In Burmese. Mandalay.<br />
Zaw Win. 2004. Agriculture Water Resource Study<br />
in <strong>Myanmar</strong> (Water Scarcity Variation in<br />
<strong>Myanmar</strong>), quoted in “Data related to<br />
<strong>Environmental</strong> <strong>Performance</strong> <strong>Assessment</strong>”,<br />
submission of Irrigation Department (2005) to<br />
<strong>National</strong> Commission for <strong>Environmental</strong> Affairs,<br />
the Government of the Union of <strong>Myanmar</strong>, Ref.<br />
No: 1868/201 – Sa-Ma-Ka. 15 February. Yangon.
Inle Lake are also unique. The local ethnic people,<br />
the Intha, are the majority population residing in<br />
the area. Flat-bottomed boats are used for daily<br />
commuting and Inthas propel these boats by foot<br />
rather than by hand, as a traditional way of rowing.<br />
Most people are engaged in fishing.<br />
4. Inthas are adept at hydroponic farming using<br />
floating islands of decayed grasses, reeds and<br />
marsh plants. The islands (locally known as<br />
yechan) are typically about 2 meter (m) wide and<br />
40 m long, but may be as large as 8 m by 100 m.<br />
Silt and clay alluvium from the Lake Bottom and<br />
weeds such as water hyacinth are used to<br />
augment the structure and fertility of these<br />
islands. By trimming these islands annually,<br />
Inthas continue floating gardening year-round by<br />
growing vegetables. As water is abundant for<br />
irrigation and organic matter is naturally enriched<br />
in the islands, floating gardening is very productive<br />
and economically beneficial. In recent years, a<br />
high yield variety of tomato was introduced from<br />
Thailand and Inle has become a major production<br />
area of tomatoes, supplying the whole country.<br />
5. Apart from fishing and hydroponics farming,<br />
textile cottage industries in the villages are also a<br />
key driver for the local economy and employment.<br />
The tourist industry is also booming in Inle Lake<br />
and tourist infrastructure such as hotels and<br />
resorts are being constructed. Inle has become<br />
a hub of socio-economic activity and an area of<br />
tremendous ecological value in the Southern Shan<br />
State.<br />
2. EnvironMEnTAl<br />
concErn AnD locAl<br />
iniTiATivE For inlE lAkE<br />
conSErvATion<br />
6. Increasing economic activities have raised<br />
environmental issues in Inle Lake. Due to rapid<br />
deforestation and slash and burn cultivation in the<br />
adjacent watershed, soil erosion is accelerating<br />
and transporting sediments to the lake. Combined<br />
with domestic effluent and increased use of<br />
fertilizer in floating gardens, sedimentation<br />
results in increasing the nutrient uploading in<br />
289<br />
the lake leading to Eutrophication (FD, 2001). The<br />
lake was 23 km long and 11 m wide in 1967 and<br />
had shrunk to 11 km long and 5 km wide in 1996<br />
(Khin Thant, 1967 and Thi Dar Win, 1996 quoted<br />
in Myint and Alan, 1999). Land reclamation for<br />
settlement and paddy cultivation are also reasons<br />
for the loss of the lake area. Moreover, household<br />
waste, effluent and increased uses of chemical<br />
in cottage industry and tomato cultivation are<br />
causes of the decline in water quality causing<br />
concerns about increased prevalence of water<br />
borne diseases (personal communication with<br />
local resident, 2005).<br />
7. The Government however has paid attention<br />
to conservation. Inle Wetland Wildlife Sanctuary<br />
(IWWS) was established by Forest Department in<br />
1985 and watershed conservation initiated by UN<br />
funded projects in late 1980s. Since 1992, under<br />
the guidance of the head of the State, policies<br />
have been laid down in reinforcing the<br />
conservation efforts by means of<br />
• law prohibiting expansion of human settle<br />
ments and floating gardens and controlling<br />
slash and burn cultivation and cutting of<br />
tree in upland watershed,<br />
• institutional strengthening of key agencies<br />
(Forest Department and Irrigation<br />
Department) for closer supervision, and<br />
• extensive reforestation and forest protection<br />
by Forest Department and removal of<br />
sediments and aquatic weed with drainage<br />
improvement in the lake by Irrigation<br />
Department.<br />
8. For effective monitoring and enhancing<br />
coordination among the agencies, Steering<br />
Committee of Inle Lake Conservation (SCOILC)<br />
has been set up since 1992 and is chaired by the<br />
Chairman of the Shan State Peace and<br />
Development Council (local authority of Shan<br />
State). Steering committee includes 15 different<br />
government organizations and State/Division level<br />
Officers-In-Charge of those agencies serve as<br />
members. Furthermore, township level supervision<br />
committees are also formed for supervision of<br />
conservation programs.<br />
13 According to a study by Department of Chemistry of Taunggyi University, the water of Inle lake is alkaline (pH ranging from 8.3 to 9.5)<br />
and its total hardness is higher than the natural range (90 -100 ppm). Pb, Cu, Cd and Hg were also recorded in the lake water and fish, but<br />
concentrations did not exceed the ranges of WHO permissible limits in terms of toxicity (Khin Mu et al., 2004). However, a larger scale of<br />
systematic research need to be carried out for determining water quality of Inle Lake because the studies conducted in the past were<br />
associated with too limited facilities and sampling size in order to be representative results of the water quality.
Sr.No Activity 1992/93 – 1999/00 2000/01 – 2004/05<br />
1.1<br />
1.2<br />
1.3<br />
1.4<br />
1.5<br />
1.6<br />
1.7<br />
1.8<br />
1.9<br />
2.1<br />
2.2<br />
2.3<br />
2.4<br />
2.5<br />
2.6<br />
3.1<br />
3.2<br />
Table 1: Progress of Conservation Activities in Inle<br />
lake and Watershed Area<br />
Establishment of Forest Reserve (acre)<br />
Natural Forest Management (acre)<br />
Community Forest (acre)<br />
Forest Plantation (acre)<br />
Agroforestry (acre)<br />
Multipurpose tree planting (seedling)<br />
Public Tree Planting (No)<br />
Contour bund (running feet) - FD<br />
Terrace (acre)<br />
Cross sectional Weir (no)<br />
Check Dam (no)<br />
Drainage Construction ( feet)<br />
Removal of sedimentation (cu-feet)<br />
Dredging of floating island (acre)<br />
Dredging of aquatic weed (acre)<br />
Distribution of Fruit Tree (seedling)<br />
Contour bunding (acre) - MAS<br />
290<br />
45,997<br />
4,000<br />
13,792<br />
13,940<br />
224<br />
-<br />
3,680,000<br />
140,000<br />
86<br />
6<br />
92<br />
-<br />
28,000,000<br />
406<br />
3,431<br />
120,000<br />
151<br />
697,336<br />
70,000<br />
10,000<br />
10,450<br />
-<br />
120,000<br />
68,600,000<br />
200,000<br />
-<br />
-<br />
-<br />
400,000<br />
52,500,000<br />
750<br />
600<br />
690,000<br />
2000<br />
Note: Sr.No 1.1 to 1.9 was implemented by FD – Forest Department while sr.no 2.1 – 2.6 and 3.1 – 3.2<br />
were undertaken by Irrigation Department and <strong>Myanmar</strong> Agriculture Service (MAS), respectively.<br />
Source: SCOILC (2005), pp:11-12 & 19-20<br />
9. With the objective of preventing Eutrophication<br />
and conserving Inle watershed, the steering<br />
committee has drawn plans for implementation of<br />
integrated conservation activities since 1992. The<br />
following is the progress to date of the<br />
implementation of these field activities.<br />
10. Recognizing the ecological importance of this<br />
area, Inle Lake was selected as case study. <strong>National</strong><br />
Coordination Committee of SEFII project, which<br />
is the <strong>National</strong> Commission for <strong>Environmental</strong><br />
Affairs (NCEA), formed a team comprising of the<br />
following members for conducting a case study<br />
at Inle Lake for two main objectives – (a). Enhancing<br />
awareness on national environmental policy and<br />
the process of environmental performance<br />
assessment (EPA) and (b). Strengthening local<br />
initiative by introducing the localized EPA system<br />
in response to global environmental concerns in<br />
which <strong>Myanmar</strong> is bounded to Millennium<br />
Development Goal (MDG) and United Nations<br />
Convention on Biological Diversity (UNCBD).<br />
Team member of Inle Lake Case Study<br />
1. Daw Htwe Nyo Nyo, Deputy Director,<br />
<strong>National</strong> Commission for <strong>Environmental</strong><br />
Affairs (NCEA) and <strong>National</strong> Coordinator of<br />
SEF II Project<br />
2. Dr.Than Htut, Deputy Director, Occupational<br />
Health Unit, Department of Health and<br />
Technical Reviewer of <strong>National</strong> EPA Team of<br />
SEF II Project<br />
3. U Myint Thein, Deputy Director, Settlements<br />
and Land Records Department (SLRD) and<br />
Member of <strong>National</strong> Coordination<br />
Committee of SEF II Project<br />
4. U Soe Win Maung, Assistant Director,<br />
Department of Agriculture Planning and<br />
Member of <strong>National</strong> Coordination<br />
Committee of SEF II Project.<br />
5. U Win Myo Thu: Domestic consultant for<br />
<strong>Environmental</strong> Issue, SEF II Project<br />
6. U Maung Maung Than: Domestic consultant<br />
for <strong>Environmental</strong> Database, SEF II Project<br />
7. U Sai Than Maung: Head of Branch,<br />
<strong>National</strong> Commission for <strong>Environmental</strong><br />
Affairs (NCEA)<br />
8. Daw Kyi Kyi Thant: Head of Branch,<br />
<strong>National</strong> Commission for <strong>Environmental</strong><br />
Affairs (NCEA)
9. U Than Htay: Park Warden of Inle Wetland<br />
Wildlife Sanctuary<br />
11. In collaboration with the Steering Committee of<br />
Inle Lake Conservation (SCOILC), the case study<br />
team led the exercise of prioritizing environmental<br />
concern, collecting data and analyzing the findings.<br />
The results of the EPA were also presented to the<br />
local authority (SCOILC)<br />
3. EnvironMEnTAl<br />
PErForMAncE<br />
ASSESSMEnT oF inlE lAkE<br />
12. There are a few environmental issues in Inle<br />
Lake and the adjacent watershed including Threat<br />
to Biodiversity, Forest Resource, Land Degradation,<br />
Water Resource and Inland Water Pollution.<br />
Among them, ‘Threat to Biodiversity’ was selected<br />
for conducting a case study because of its global<br />
importance and data availability for developing<br />
P-S-R indicators.<br />
3.1 State (Threat to Biodiversity)<br />
13. Inle Wetland Wildlife Sanctuary was established<br />
to protect the natural habitat of wetland ecosystem<br />
of flora and fauna species. In particular, priority<br />
was given to protection of migratory bird species<br />
and their habitat. Annual changes in migratory<br />
bird spp and population are an indicator of the<br />
state. ‘Average number of birds annually observed<br />
in Inle Wetland Area’ is chosen as a state<br />
indicator. This indicator tracks the variations in<br />
the annual average number of the bird population<br />
as well as number of bird species annually<br />
observed by the bird watching team of Inle<br />
Wetland Wildlife Sanctuary (IWWS). Daily routine<br />
records of the bird watching team for four<br />
consecutive survey years from 2001 to 2004 are<br />
main sources of data for developing this indicator<br />
and data cover for both migratory and residential<br />
species.<br />
Indicator: Average No. of Bird Annually Observed in<br />
Inle Wetland Area 2001-2004<br />
291<br />
14. Monthly estimates of bird population are<br />
drawn by the Bird Watching Center (BWC) in Inle<br />
Wetland Area through daily observations (Annex<br />
1a to 1d), and frequency of observation made<br />
in that particular month (Annex 2a & 2b). The<br />
monthly average numbers of the bird population<br />
throughout the year are again summed to obtain<br />
the annual average number of the observed bird<br />
population. From the lists of regular bird watching<br />
records, total numbers of bird species observed<br />
within a particular year are counted for both<br />
migratory and residential species.<br />
15. According to the data compiled in Table 3.1,<br />
it appears that annual average numbers of both<br />
migratory and residential bird population are<br />
increasing throughout the years from 2001 to<br />
2004, although there was a slight fall in 2004<br />
figures compared to 2003. As bird watching was<br />
only done for a few months in 2001, the annual<br />
average number of the bird population in that<br />
year might not be fully represented. An educated<br />
guess suggests that the actual observed bird<br />
population (migratory spp) might probably be<br />
around 5000 in 2001 if the year-round bird<br />
population were to be taken into account. Hence, it is<br />
reasonable to say that the annual average number<br />
of migratory bird population is fluctuating within<br />
the range of 5000 to 8000 from 2001 to 2004. A<br />
sign of improvement in the environmental situation<br />
is possibly indicated by the increasing trend of<br />
the bird population as shown in Figure 3.1. However,<br />
more systematic studies for a longer period will<br />
be required to establish this species enrichment<br />
in Inle wetland area. Similar to the bird population,<br />
species diversities of migratory and residential<br />
birds are also fluctuating as number of species<br />
annually observed change in the years studied.<br />
However it is notable, from the supplementary<br />
figures shown in Annex 3a and 3b, that seasonal<br />
patterns of bird population and species diversity<br />
(in major bird nesting areas of the lake) follow a<br />
consistent stable trend with slight variation during<br />
the study period from 2001 to 2004.<br />
14 Village tracts where most of the member villages in respected village tract lie within the location of marshland adjoining with water body<br />
and bottom of the adjacent hill partially.<br />
15 Village tracts where most of the member villages in respected village tract are located at the upland hill of Inle Lake and partially with<br />
valley plain in some area.<br />
16 Village tracts where most of the member villages in the respective village tract are mainly located, are inside the lake and separate from<br />
nearby marshland and upland area.
Table 3.1: Average no of Bird observed in inle Wetland Area<br />
Year Annual Average No Observed No of Species Observed<br />
Migratory bird Residential bird Migratory bird Residential bird<br />
2001 2,909 299 58 80<br />
2002 5,894 538 43 50<br />
2003 8,093 1,243 64 103<br />
2004 7,375 1,170 40 38<br />
Figure 3.1: Average no of Bird observed in inle Wetland Area<br />
Source: IWWS (2005)<br />
Suggested Rating: Relatively<br />
Good and Stabilizing<br />
Justification: Available data indicate that bird species<br />
are still present in a diverse state in terms of number<br />
of species annually observed. Observation of globally<br />
endangered spp of Sarus crane (Grus antigone) and<br />
their nesting place also confirm that the environmental<br />
situation of Inle Lake is relatively good. With slight varia<br />
tion, the seasonal pattern of bird population and species<br />
observation exhibit a stable trend in species diversity.<br />
3.2. Pressure (Threat to<br />
Biodiversity)<br />
16. <strong>Environmental</strong> sustainability of Inle lake has<br />
been threatened by habitat loss, water pollution<br />
and Eutrophication. An increasing population has<br />
compounded the acceleration of the environmental<br />
degradation process due to household waste,<br />
agricultural activity and cottage industries.<br />
Therefore, population density is selected as the<br />
‘pressure’ indicator. This indicator tracks the<br />
change of population per unit area of member<br />
village tracts of Inle Lake in Nyaung Shwe<br />
292<br />
Township and the wetland area as a whole. Data<br />
from Immigration and <strong>National</strong> Registration<br />
Department of Nyaung Shwe Township is used for<br />
development of this indicator and the unit of the<br />
indicator is given in population per square mile.<br />
Temporal coverage of the indicator is from 1995<br />
to 2005; however, data for 1990 and 1983 are<br />
also given for comparison purposes.<br />
Indicator (1): Population Density in Inle Lake 1983-2005<br />
17. In addition to population density of the<br />
whole lake, population densities in wetland<br />
village tracts, upland village tract and lake’s<br />
village tracts are given in Table 3.2 for<br />
understanding the existing population pressure<br />
patterns on lake ecosystem.<br />
18. As observed in Figure 3.2, population<br />
density in Inle lake is gradually increasing.<br />
Notably, population density in the lake’s village<br />
tracts is extremely high (1127 per square mile in<br />
2005) and above the average population density of<br />
the whole Inle wetland area (257 per square mile in<br />
2005). Increasing population density in the lake
Year<br />
Table 3.2: Population and Population Density in inle lake<br />
Wetland Village Tracts<br />
(265 sq-m)<br />
Upland Village Tracts<br />
(272 sq-m)<br />
293<br />
Village Tracts inside Lake<br />
(23 sq-m)<br />
The whole area of Inle<br />
Lake (560 sq-m)<br />
Population Density Population Density Population Density Population Density<br />
1983 56,916 215 27,448 101 21,169 937 105,533 188<br />
1990 62,871 237 32,427 119 22,541 998 117,839 210<br />
1995 67,101 253 35,866 132 23,516 1041 126,483 226<br />
1996 67,943 256 36,565 134 23,711 1050 128,219 229<br />
1997 68,785 259 37,264 137 23,906 1058 129,955 232<br />
1998 69,627 263 37,963 139 24,100 1067 131,690 235<br />
1999 70,469 266 38,662 142 24,294 1076 133,425 238<br />
2000 71,311 269 39,359 145 24,487 1084 135,157 241<br />
2001 72,152 272 40,056 147 24,680 1093 136,888 244<br />
2002 72,992 275 40,752 150 24,873 1101 138,617 248<br />
2003 73,831 279 41,448 152 25,066 1110 140,345 251<br />
2004 74,670 282 42,139 155 25,259 1118 142,068 254<br />
2005 75,504 285 42,837 157 25,452 1127 143,793 257<br />
Source: Immigration and <strong>National</strong> Registration Department (2005)<br />
Figure 3.2: Population Density by Type of village Tract in inle lake<br />
Note: Wetland VT = Village Tracts of Wetland Zone, Upland VT = Village Tracts of<br />
Upland Zone, Water VT = Village Tracts inside Inle Lake<br />
Source: Immigration and <strong>National</strong> Registration Department, (2005)
area indicates the growing human activity and<br />
associated environmental impacts.<br />
19. Population density in wetland village tracts is<br />
also found to be high, from 215 to 285 per square<br />
mile during the period of 1983 to 2005. It is also<br />
slightly higher than the average population density<br />
of the whole lake. As people living in both wetland<br />
and the lake’s village tracts are heavily reliant on<br />
livelihood activities such as fishing and floating<br />
gardens, the increasing population in these areas<br />
is imposing an imbalance on the lake’s ecosystem<br />
beyond its carrying capacity.<br />
Suggested Rating: High and<br />
Increasing<br />
Justification: Population density has been growing at<br />
an alarming rate in the villages in the wetland tracts. By<br />
2005, the population density there was four and half fold<br />
higher than the average density of the whole lake area<br />
(257 per square mile). This compares with the national<br />
population density average of 200 per square mile,<br />
Table 3.3: change of natural Habitat and other land use in inle Area<br />
Year<br />
Natural Habitat Area (Acre) Settlement & Agriculture Area (Acre) Total Lake area<br />
Open<br />
Water<br />
Marsh<br />
Land<br />
Sub-total<br />
Floating<br />
Garden<br />
294<br />
Settlement/<br />
Paddy<br />
Sub-total Acre<br />
As % of 1990’s<br />
level<br />
1990 12,368 12,242 24,610 9,786 23,929 33,714 58,325 100%<br />
2000 11,734 15,968 27,702 17,186 12,023 29,209 56,911 97.6%<br />
2003 15,289 16,322 31,611 11,067 13,178 24,246 55,857 95.8%<br />
Source: Developed from Remote Sensing Data of Forest Department by Maung Maung Than (2005)<br />
Indicator (2): Inle Lake Area As a Percentage of 1990s<br />
Total Area – 1990-2003<br />
20. Habitat loss is considered to be one of the<br />
pressures on biological diversity of Inle lake.<br />
Therefore, area changes of Inle lake are seen as a<br />
sign of habitat loss and chosen as the second<br />
pressure indicator. This indicator is developed<br />
based upon remote sensing and geographical<br />
information system (RS/GIS) data of Forest<br />
Department with ground verification by experienced<br />
local key-informants well versed in local land use. This<br />
indicator tracks habitat loss since 1990 in term<br />
of changes in the whole area of Inle lake.<br />
21. As shown in Table 3.3, the total area of Inle<br />
lake was 58,325 acres in 1990 and has reduced<br />
to 56,911 acres in 2000 and 55,857 acres in 2003.<br />
This reduction accounts for a 2.4% loss in area<br />
from 1990’s level to 2000 and 4.2% to 2003<br />
(see Figure 3.3) However, the natural habitat<br />
area, which includes the areas of both marshland<br />
and open water bodies, did not change and even<br />
slightly increased during the same period. This is<br />
a positive trend for wildlife protection as marshland<br />
and water bodies are important habitats of the<br />
species, particularly for migratory and residential<br />
birds. However, the quality of this marshland<br />
(vegetation density) and water bodies (chemical<br />
and physical properties) have not been assessed<br />
during the case study. The extent of human<br />
settlement and agriculture area (paddy in shore<br />
line and floating garden inside of lake) shrank<br />
from 33,714 acres in 1990 to 29,209 acres in<br />
2000 and 24,246 acres in 2003; representing a<br />
9468 acre net area loss in settlement and<br />
agriculture area of Inle lake in the past 15 years.<br />
This change has lead to a gain in natural habitat<br />
area (7000 acres) and total exclusion of 2468<br />
acres of land from vicinity of lake (as they appear<br />
as separate permanent land forms and are no<br />
longer associated with the seasonal inundation<br />
pattern of the lake).<br />
22. From the land use data compiled in Table 3.3,<br />
it appears that the law on restricting encroachment<br />
into natural habitat areas, is working, as the area<br />
of marshland and open water bodies have not<br />
been negatively affected. However, the settlement<br />
area has gradually reduced due to rise of<br />
floating garden within the vicinity of settlement<br />
and agricultural land use. In 2000 the settlement<br />
area declined to 12,023 acres from 23,929<br />
acres in 1990 while there was a sharp increase<br />
in floating garden area from 9,786 acres in 1990<br />
to 17,186 acres. Perhaps, local inhabitants were
Figure 3.3: inle lake Area as a Percentage of 1990s level<br />
Source: Developed from Remote Sensing Data of Forest Department by Maung Maung Than (2005)<br />
converting their residential area for the more<br />
productive use of floating gardens. This trend<br />
marginally reversed after 2000 because the floating<br />
garden area declined to 11,067 acres in 2003<br />
while settlement area increased to 13,178 acres.<br />
This might be related to the fact that the exploitation<br />
of wild floating islands from marshland by local<br />
people for making new floating gardens in their<br />
residential area, was tightly controlled and some<br />
area of the lake’s shore line were earmarked for<br />
paddy cultivation under the paddy promotion<br />
scheme for local food security. Therefore, land<br />
use intensification in the officially demarcated<br />
settlement and agriculture area is very high.<br />
On the other hand, although the total extent of<br />
natural habitat area remains stable with a slight<br />
increase, vegetation density of marshland seems<br />
to have deteriorated. As total area of settlement<br />
and agriculture land use constitutes 43% of total<br />
lake area, higher intensification of socio-economic<br />
activity in this vicinity implies the acceleration<br />
process of eutrophication and declining water<br />
quality, which, in turn, has an adverse impact on<br />
environmental stability and biodiversity of the<br />
precious wetland ecosystem.<br />
17 As of 2002/2003, the estimated national population was 52.17 million (CSO, 2003) and the total extent of the country is 261,228 square<br />
miles (CSO and DAP, 1999) so that the average population density for the whole country is calculated at 199.7 persons per square mile.<br />
295<br />
Suggested Rating: High<br />
and Increasing<br />
Justification: In the period from 1990 to 2005, 4.2%<br />
of total wetland area was lost. The loss accelerated<br />
after 2000 because 1.8% of total land was lost within<br />
the 3 years (2000 – 2003), equivalent to 0.6 % per<br />
annum. This is two and half times higher than the rate<br />
of loss registered during the period 1990 to 2000 of only<br />
0.24% per annum.<br />
3.3. Response (Threat to Biodiversity)<br />
23. The earlier response for biodiversity conservation<br />
in Inle lake to provide complete legal protection<br />
by notifying the lake area as wildlife sanctuary<br />
has since 1992 been extended to the adjacent<br />
watershed as well. Efforts have been made to<br />
strengthen the institutional capacity, extending<br />
the reforestation and soil conservation activities<br />
and improved law enforcement. As discussed<br />
earlier, prevention of encroachment into natural<br />
habitat area seems successful because the total<br />
extent of marshland and water bodies remains<br />
intact. However, destructive human activities are<br />
still reported such as man-made fire, illegal bird<br />
poaching and illicit exploitation and transportation<br />
of floating island for agriculture. To manage
Table 3.4: Actual and inflation Adjusted Annual Expenditure for Wildlife<br />
Conservation in Inle Wetland Area<br />
Year<br />
Expenditure on Personnel<br />
(Kyat)<br />
Annual<br />
Amount<br />
CPI<br />
Adjusted<br />
Expenditure on Operation<br />
(Kyat)<br />
Annual<br />
Amount<br />
CPI<br />
Adjusted<br />
296<br />
Total Expenditure (Kyat)<br />
Annual<br />
Amount<br />
CPI<br />
Adjusted<br />
Expenditure<br />
Per Acre<br />
Kyat/Acre<br />
1994 166,633 101,883 192,062 117,431 358,695 219,313 1.38 163.55<br />
1995 179,531 90,091 358,618 179,960 538,149 270,051 1.70 199.28<br />
1996 212,346 88,779 418,629 175,023 630,975 263,801 1.66 239.19<br />
1997 323,082 131,653 662,803 270,087 985,885 401,740 2.53 245.40<br />
2001 784,309 160,716 1,825,940 374,162 2,610,249 534,878 3.37 488.01<br />
2002 685,782 88,881 1,305,181 169,158 1,990,963 258,039 1.63 771.57<br />
2003 1,144,429 120,524 1,305,425 137,479 2,449,854 258,003 1.63 949.55<br />
Note: CPI = Consumer Price Index based on <strong>National</strong> Statistical Year Book, 2003<br />
Source: IWWS (2005), CSO 2003<br />
Table 3 .4: cPi Adjusted Expenditure on Wildlife<br />
Conservation in Inle Wetland Area<br />
Source: IWWS (2005)<br />
these issues, effective wildlife protection and<br />
conservation is required, for raising environmental<br />
awareness and education, patrolling and guarding,<br />
monitoring of species and habitat status, and<br />
promotion of community based nature conservation.<br />
In this respect, financial expenditure on wildlife<br />
conservation is selected as a response indicator to<br />
examine the capacity of financial resource made<br />
available for the pursuit of effective wildlife<br />
conservation. Annual financial reports of Inle<br />
Wetland Wildlife Sanctuary were the main sources<br />
of data for developing this indicator. Temporal<br />
coverage of this indicator was from budget year<br />
CPI<br />
1994 to 2003, but there are also some data gaps<br />
from 1998 to 2000.<br />
Indicator: Financial Expenditure on Wildlife Management<br />
1994-2003<br />
24. This indicator tracks the financial expenditure<br />
annually incurred by Inle Wetland Wildlife Sanctuary<br />
of Forest Department for managing wildlife<br />
protection and conservation activities in Inle lake<br />
area. The unit of indicator is Kyat per annum Annual<br />
expenditure of IWWS was adjusted by consumer<br />
price index (CPI) of <strong>National</strong> Statistical
Yearbook (2002) for estimating real value of<br />
expenditure available on wildlife management.<br />
Table 3.4: Actual and Inflation Adjusted Annual<br />
Expenditure for Wildlife Conservation in Inle<br />
Wetland Area<br />
25. From the inflation-adjusted figures, it is found<br />
that a steady increase in total expenditure on wildlife<br />
management has occurred until 2001 but dropped<br />
sharply in 2002 and 2003 reaching to a level lower<br />
than expenditure in 1995. This affected performance<br />
in some operations such as environmental education,<br />
species monitoring and patrolling, and fire protection.<br />
26. On an average, per acre expenditure on<br />
conservation throughout the study period was<br />
around MK1.6 per acre per annum except for the<br />
peak years in1997 and 2001.<br />
Suggested Rating: Low and<br />
Intermittent<br />
Justification: Financial allocations towards wildlife<br />
management have not been stable and actually<br />
declined. The current spending level of MK1.66 per acre<br />
per annum is not adequate to improve the<br />
environmental situation in Inle Lake.<br />
4. Conclusions<br />
27. Inle Lake is rich and diverse in migratory and<br />
residential bird species. However, this has been<br />
facing pressure of population increase and losses<br />
of lake area habitat at an alarming rate since 2000.<br />
Concerted efforts have been made in the past in<br />
strengthening institutional mechanisms, law<br />
enforcement and implementation of reforestation<br />
policies, waterway improvement, sedimentation<br />
control and species protection. Encroachment<br />
into the natural habitat area of Inle Wetland Wildlife<br />
Sanctuary has declined and the total extent of<br />
marshland and water bodies have not reduced<br />
since 1990, although the quality of these resources<br />
seemed to have declined under intensified human<br />
interventions and eutrophication of the lake. More<br />
attention needs to be paid to the reduced quality<br />
of the Inle Lake area.<br />
28. One of the greater concerns in environmental<br />
stability of Inle Lake is the carrying capacity<br />
of the ecosystem under growing population<br />
pressure and limited financial resources available<br />
for ecological conservation. Even if the financial<br />
allocation is increased, there is still a need for<br />
297<br />
developing appropriate strategies and protection<br />
measures in reducing the population pressure and<br />
diversification of socio-economic activities in the<br />
lake whilst still preserving the traditional socioculture<br />
value and securing livelihood improvement of<br />
people dependent upon the lake ecosystem. The<br />
EPA process introduced by SEF II project provides<br />
a good initiative in this direction. The following are<br />
some suggestions relevant for future conduct of<br />
an EPA locally at Inle Lake.<br />
i) Resources should be made available for<br />
continuing the present effort in<br />
species monitoring of not only migratory<br />
and residential birds but also other fauna<br />
and flora, especially endemic aquatic weeds<br />
and fish species. Technical assistance<br />
should be given to Inle Wetland Wildlife<br />
Sanctuary’s Office for the establishment of<br />
systematic databases in order to man<br />
age collected species data efficiently in spe<br />
cies monitoring as well as in environmental<br />
education material development.<br />
ii) Future EPAs should seek the use of compre<br />
hensive RS/GIS application. Not only should<br />
the extent of different land use be assessed<br />
but also the vegetation density and<br />
condition of different land uses should be<br />
examined.<br />
iii) Population density was developed for<br />
different locations of village tracts to<br />
examine the nature of population pressure<br />
that might be spatially varied. The<br />
categorization of village tracts into different<br />
land classes should be further improved.<br />
Any discrepancy in population data among<br />
government agencies should be reconciled.<br />
iv) Deforestation in the upper watershed is<br />
one of the major threats to eutrophication<br />
of Inle Lake, so indicators like change in<br />
forest cover of adjacent watershed should<br />
also be developed. Likewise, an attempt<br />
should also be made to record the<br />
sedimentation rate on a regular basis.<br />
v) Other environmental concerns like land<br />
degradation, sustainable use of water<br />
resource for drinking purpose, inland water<br />
pollution, toxic contamination and<br />
inadequate solid waste management are<br />
also relevant for the conduct of EPA in future.<br />
vi) Steering Committee of Inle Lake Conservation
is a likely candidate for conducting<br />
future EPA as it has been a local authority<br />
in setting policy and monitoring<br />
performance. Important technical<br />
agencies are also members of this<br />
committee and could provide assistance in<br />
the conduct of an EPA. For example,<br />
‘Settlements and Land Records Department<br />
of Shan State’ has facility and skills in<br />
information management and this is useful<br />
for development of an environmental<br />
database. Nevertheless, capacity building<br />
of all stakeholders is required for raising<br />
environmental awareness and efficiency in<br />
the future conduct of EPA.<br />
vii) Collaboration should be extended and<br />
strengthened between SCOILC and<br />
Taunggyi University as additional<br />
technical resources from the research work<br />
in the university can be very useful. If<br />
possible, Inle Resource Center should be<br />
established for pooling all resources and<br />
information available for environmental<br />
research, education and conservation<br />
initiative. Linkage should be also made with<br />
the <strong>National</strong> Commission for <strong>Environmental</strong><br />
Affairs (NCEA) and NGOs, which are working<br />
in the Inle Lake area.<br />
Suggested Rating: 2 Stars<br />
Justification: Biodiversity of Inle Lake is relatively stable<br />
and conservation initiatives are already in place. The<br />
policy objective of wildlife management in protecting<br />
natural habitats seems to have been met. Increasing<br />
pressure and limited resources pose a challenge to the<br />
current efforts. Taking into account these limitations,<br />
the recent performance in relation to the threats to Inle<br />
Lake’s ecosystem and its biodiversity seems to be<br />
moderately encouraging.<br />
References<br />
CSO.2003. <strong>National</strong> Statistical Yearbook. Central<br />
Statistical Organization, the Government of the<br />
Union of <strong>Myanmar</strong>, Yangon, pp:13.<br />
CSO and DAP.1999. Agriculture Statistics (1987<br />
– 88 to 1997 – 98). Central Statistical Organization<br />
and Department of Agriculture Planning, the<br />
Government of the Union of <strong>Myanmar</strong>, Yangon, pp:3.<br />
Fact Sheet.2002. List of Herpetofauna Specimen<br />
298<br />
from Shan State. Inlay Wildlife Sanctuary, Collected<br />
by <strong>Myanmar</strong> Project Field Team and California<br />
Academy of Science (CAS). Office file of Inle<br />
Wildlife Sanctuary Office, Nyaung Shwe.<br />
FCG.1992. <strong>Report</strong> on Socio-economic Study of<br />
Inle Lake Watershed. Pilot Watershed<br />
Management For Kinda Dam (UNDP/FAO:<br />
MYA/81/003), Forest Consultant Group, Yangon.<br />
FD & WCS.2005. Inlay Wetland Wildlife<br />
Sanctuary. Forest Department of the Union of<br />
<strong>Myanmar</strong> and Wildlife Conservation Society, New<br />
York.FD. 2001.Summary of Finding on<br />
<strong>Assessment</strong> of Inle Wetland Ecosystem. Assessors<br />
of U Theing Aung, U Than Htay, U Ko Pan, U Nay<br />
Myo Shwe, Khin Ma Ma Thwin, Simba Chan, Tony<br />
Sebastian, and Jon Davies Unpublished field<br />
report of In Le Wildlife Sanctuary Office, Forest<br />
Department of <strong>Myanmar</strong>, Nyaung Shwe.<br />
FD. 2005. Data provided for <strong>Environmental</strong><br />
<strong>Performance</strong> <strong>Assessment</strong>. Forest Department of<br />
<strong>Myanmar</strong>, Yangon.<br />
Htay Htay, Moe Moe Dwe & Myat Ommar Khin.<br />
2002. Some Invasive Fish Species and Their<br />
Status in Inle Lake. Unpublished research paper,<br />
Department of Zoology, Taunggyi University,<br />
Taunggyi.<br />
Immigration and <strong>National</strong> Registration<br />
Department .2005. Official data provided by<br />
Nyaungshwe Township’s Immigration and <strong>National</strong><br />
Registration Office for a case study on<br />
<strong>Environmental</strong> <strong>Performance</strong> <strong>Assessment</strong> of Inle<br />
Lake, Nyaungshwe.<br />
IUCN. 2004. Red List of IUCN”, International<br />
Union of Conserving Nature. Geneva.<br />
www.iucn.org<br />
IWWS.2005. Official data provided by Inle Wetland<br />
Wildlife Sanctuary of Forest Department for a<br />
case study on <strong>Environmental</strong> <strong>Performance</strong><br />
<strong>Assessment</strong> of Inle Lake, Nyaungshwe.<br />
Khin Lay Mu. 2004. Diversity and Seasonal<br />
Abundance: Distribution of Water Birds Around<br />
the Bird Watching Center of Inle Wetland Wildlife<br />
Sanctuary. Taunggyi University, unpublished<br />
research paper, Taunggyi.<br />
Khin Mu, Kyin Aye and Betty Win.2004. Study of<br />
Some Chemical Characteristics of Water from Inle<br />
Lake. Unpublished research paper, Department of<br />
Chemistry, Taunggyi University, Taunggyi.<br />
Khin Thant, Ma .1967. Fishes and fishing gear of<br />
Inle Lake. University Press, Rangoon: Quoted in
Myint Su and Alan D. Jassby .1999.Inle:A large<br />
<strong>Myanmar</strong> lake in transition, technical paper,<br />
Department of <strong>Environmental</strong> Science and Policy,<br />
University of California, Davis, California, USA.<br />
Maung Maung Than. 2005. Remote Sensing and<br />
GIS Data of Inle Lake using LANSAT and IKONOV<br />
Images of 1990, 2000 and 2003. Field<br />
operational data developed for a case study on<br />
<strong>Environmental</strong> <strong>Performance</strong> <strong>Assessment</strong> of Inle<br />
Lake, Nyaungshwe.<br />
Myint Su and Alan D. Jassby. 1999.Inle:A large<br />
<strong>Myanmar</strong> lake in transition. Technical paper,<br />
Department of <strong>Environmental</strong> Science and Policy,<br />
University of California, Davis, California, USA.<br />
Naing Zaw. 1990. <strong>Environmental</strong> Issues in<br />
Southeast Asia: State and Development River and<br />
Lakes – An Overview. In the workshop on The<br />
Environment and Economic Development in<br />
Southeast Asia, Institute of Southeast Asian<br />
Studies, Singapore.<br />
Personnel communication with local residents.<br />
2005. Interviews with local residents in Nyaung<br />
Shwe Township during the conduct of a case<br />
299<br />
study for Inle Lake <strong>Environmental</strong> <strong>Performance</strong><br />
<strong>Assessment</strong>, Nyaung Shwe .<br />
Personnel Communication with U Than Htay<br />
.2005. Officer In Charge of Inle Wildlife Sanctuary,<br />
Forest Department of <strong>Myanmar</strong>, Nyaung Shwe.<br />
SCOILC.2005. Progress <strong>Report</strong> on <strong>Environmental</strong><br />
Conservation activities within 20 miles radius of<br />
Inle Lake. Steering Committee of Inle Lake<br />
Conservation, Southern Shan State, Taunggyi.<br />
Thi Dar Win, Ma.1996. Floating island agriculture<br />
(ye-chan) of Inle Lake. M.A Thesis, Department of<br />
Geography, University of Yangon, Yangon: Quoted<br />
in Myint Su and Alan D. Jassby. 1999. Inle: A<br />
large <strong>Myanmar</strong> lake in transition. Technical paper,<br />
Department of <strong>Environmental</strong> Science and Policy,<br />
University of California, Davis, California, USA.<br />
WCMC. 1998. Freshwater Biodiversity. A<br />
Preliminary Global <strong>Assessment</strong>., World Conservation<br />
Monitoring Center.. A document prepared for the<br />
fourth meeting of the conference of the parties<br />
to the convention on Biological Diversity, 4-5 May<br />
1998, Bratislava, Slovakia.
Type Spp Common<br />
name<br />
Annex 1a: Total no of Bird observed in Bird Watching<br />
Center (BWC), Inle Wetland for Year 2001<br />
Observed Population (No)<br />
Jan Feb Mar Apr May Jun Jul Aug Sep Oct Nov Dec<br />
M Little Grebe 0 0 0 0 0 0 0 0 0 0 1 0<br />
R Little Cormorant<br />
0 0 0 18 0 0 36 0 0 0 2 2<br />
R Indian Shag 0 0 0 30 34 0 0 0 0 616 462 81<br />
R Purple Heron 0 0 0 1 0 0 1 0 0 0 0 6<br />
M Grey Heron 0 0 0 0 5 0 0 0 0 8 0 7<br />
R Indian Pond<br />
Heron<br />
0 0 0 4 1 0 0 0 0 10 23 6<br />
R Little Egret 0 0 0 115 351 0 34 0 0 5 1 1<br />
R Intermediate<br />
Egret<br />
0 0 0 5 77 0 1 0 0 24 14 20<br />
R Cattle Egret 0 0 0 26 7 0 0 0 0 0 0 0<br />
M Yellow Bitterns<br />
0 0 0 0 0 0 5 0 0 0 0 0<br />
M Spot-billed<br />
Duck<br />
0 0 0 1232 1751 0 0 0 0 1628 787 331<br />
M Cotton Pygmy-Goose<br />
0 0 0 0 121 0 0 0 0 0 0 0<br />
M Northern<br />
Pintail<br />
0 0 0 0 0 0 0 0 0 0 30 0<br />
M Lesser Whistling<br />
Duck<br />
0 0 0 4465 12123 0 2 0 0 2516 204 5844<br />
M Common<br />
Teal<br />
0 0 0 0 0 0 0 0 0 0 18 3<br />
M Eurasian<br />
Wigeon<br />
0 0 0 0 0 0 0 0 0 0 600 50<br />
M Garganey 0 0 0 0 0 0 0 0 0 0 0 1<br />
M Ruddy Shelduck<br />
0 0 0 0 0 0 0 0 0 0 0 1<br />
M Watercock 0 0 0 0 0 0 0 0 0 0 0 1<br />
M Ferruginous<br />
Pochard<br />
0 0 0 0 0 0 0 0 0 0 0 432<br />
M Asian Openbill<br />
Stork<br />
0 0 0 30 1 0 0 0 0 0 0 0<br />
M Pheasanttailed<br />
Jacana<br />
0 0 0 633 1817 0 0 0 0 0 0 0<br />
M Bronzewinged<br />
Jacana<br />
0 0 0 0 126 0 0 0 0 0 0 0<br />
R Common<br />
Moorhen<br />
0 0 0 0 2 0 0 0 0 0 0 19<br />
R Purple Swamphen<br />
0 0 0 29 289 0 0 0 0 23 10 5<br />
M Common<br />
Coot<br />
0 0 0 0 0 0 0 0 0 0 0 8<br />
300
Type Spp Common<br />
name<br />
Observed Population (No)<br />
Jan Feb Mar Apr May Jun Jul Aug Sep Oct Nov Dec<br />
M Common<br />
Snipe<br />
0 0 0 183 0 0 0 0 0 3 0 4<br />
M Brown-headed<br />
Gull<br />
0 0 0 0 0 0 0 0 0 0 3033 341<br />
M Herring Gull 0 0 0 0 0 0 0 0 0 0 0 11<br />
R Common<br />
Kingfisher<br />
0 0 0 0 0 0 0 0 0 0 14 6<br />
R White-throated<br />
Kingfisher<br />
0 0 0 0 0 0 4 0 0 0 1 3<br />
M Black -<br />
winged Stilt<br />
0 0 0 1560 73 0 0 0 0 0 0 10<br />
R Blue-tailed<br />
Bee-eater<br />
0 0 0 0 0 0 3 0 0 0 0 0<br />
R Black Kite 0 0 0 2 1 0 0 0 0 0 9 7<br />
R Brahminy<br />
Kite<br />
0 0 0 0 0 0 0 0 0 0 0 9<br />
R Black-shouldered<br />
Kite<br />
0 0 0 0 2 0 3 0 0 0 1 0<br />
R White Wagtail<br />
0 0 0 7 5 0 0 0 0 19 17 6<br />
R Yellow Wagtail<br />
0 0 0 50 0 0 0 0 0 0 1 0<br />
R Greater Coucal<br />
0 0 0 2 6 0 11 0 0 5 12 8<br />
R Black Drongo 0 0 0 11 5 0 0 0 0 33 12 5<br />
R House Crow 0 0 0 0 2 0 4 0 0 0 0 38<br />
R Jerdon’s<br />
Bushchat<br />
0 0 0 0 0 0 0 0 0 0 0 1<br />
R Pied Bushchat<br />
0 0 0 0 0 0 0 0 0 0 0 1<br />
R Baya Weaver 0 0 0 0 0 0 1 0 0 0 0 0<br />
R Brown Prinia 0 0 0 0 0 0 1 0 0 0 0 0<br />
M Cinnamon<br />
Bittern<br />
0 0 0 0 0 0 4 0 0 0 0 0<br />
M Black Bittern 0 0 0 0 0 0 3 0 0 0 0 0<br />
M Chinese<br />
Pond Heron<br />
0 0 0 0 0 0 5 0 0 0 3 0<br />
M1 Unknow<br />
(Black Duck)<br />
0 0 0 0 0 0 0 0 0 0 4 0<br />
Source: Total IWWS Population (2005)<br />
Observed<br />
8403 16799 118 4890 5259 7268<br />
301
Type Spp<br />
Common<br />
name<br />
Annex 1b: Total no of Bird observed in Bird Watching<br />
Center (BWC), Inle Wetland for Year 2002<br />
Observed Population (No)<br />
Jan Feb Mar Apr May Jun Jul Aug Sep Oct Nov Dec<br />
M Little<br />
Grebe<br />
0 0 0 0 9 0 0 0 0 0 0 0<br />
R Little Cormorant<br />
233 117 0 54 3 0 39 170 471 230 2 815<br />
R Indian<br />
Shag<br />
112 327 239 44 22 28 12 120 258 117 124 16<br />
R Purple<br />
Heron<br />
9 32 4 11 5 1 1 2 4 9 4 19<br />
M Grey<br />
Heron<br />
9 149 76 0 0 0 0 0 0 50 0 4<br />
R Blackcrowned<br />
Night<br />
Heron<br />
0 0 0 0 0 0 0 0 0 3 0 0<br />
R Indian<br />
Pond<br />
Heron<br />
2 0 0 1 0 10 2 24 17 33 9 66<br />
R Little<br />
Egret<br />
0 0 1 6 4 8 4 0 1 0 3 0<br />
R Intermediate<br />
Egret<br />
31 30 27 28 53 0 5 1 15 11 28 44<br />
M Yellow<br />
Bittern<br />
0 0 0 0 1 0 12 45 16 1 0 2<br />
M Spotbilled<br />
Duck<br />
890 2521 978 1132 155 23 221 6 1479 2292 3146 4304<br />
M Cotton<br />
Pygmy-<br />
Goose<br />
4 0 50 19 0 0 77 0 0 0 0 12<br />
M Northern<br />
Pintail<br />
9 2062 1297 0 0 0 0 0 0 2 74 693<br />
M Lesser<br />
Whistling<br />
Duck<br />
94 1096 1000 5263 1767 0 25 88 126 4061 6627 6200<br />
M Common<br />
Teal<br />
0 0 0 0 20 0 0 0 0 0 0 616<br />
M Garganey 921 3966 2597 0 0 0 0 0 600 3786 4635 12500<br />
M Ruddy<br />
Shelduck<br />
0 1 12 27 0 0 0 0 0 0 10 234<br />
M Ferruginous<br />
Pochard<br />
907 1173 594 14 0 0 0 0 0 580 2991 2466<br />
M Baer’s<br />
Pochard<br />
113 70 31 0 0 0 0 0 0 6 0 0<br />
302
Type Spp<br />
Common<br />
name<br />
Observed Population (No)<br />
Jan Feb Mar Apr May Jun Jul Aug Sep Oct Nov Dec<br />
M Falcated<br />
Teal<br />
0 0 0 0 0 0 0 0 0 0 0 216<br />
M Pheasant-tailed<br />
Jacana<br />
2 107 41 66 26 0 6 0 5 3 8 485<br />
R Common<br />
Moorhen<br />
48 97 85 132 49 18 40 0 0 75 89 911<br />
R Purple<br />
Swamphen<br />
0 0 0 1 6 13 1 7 12 35 13 348<br />
M Common<br />
Coot<br />
2 0 0 0 0 0 0 0 0 0 8 207<br />
M Marsh<br />
Sandpiper<br />
0 0 0 0 0 0 0 0 0 0 0 41<br />
M Common<br />
Snipe<br />
0 4 16 20 0 0 0 0 0 28 12 7<br />
M Brownheaded<br />
Gull<br />
2439 2054 1520 21 22 0 0 0 0 17 440 5835<br />
M Herring<br />
Gull<br />
11 15 22 0 0 0 13 0 0 0 0 2<br />
R Common<br />
Kingfisher<br />
11 0 6 1 0 0 0 10 11 16 6 16<br />
R Whitethroated<br />
Kingfisher<br />
1 2 1 0 0 0 0 32 12 30 8 16<br />
M Blackwinged<br />
Stilt<br />
0 2334 3472 4200 9 0 0 14 0 0 0 0<br />
R Green<br />
Bee-eater<br />
0 0 0 0 0 1 21 14 22 0 0 0<br />
R Black Kite 11 5 3 0 0 0 0 0 1 3 3 0<br />
R Brahimy<br />
Kite<br />
9 11 2 7 0 0 0 0 0 19 11 57<br />
R Blackshouldered<br />
Kite<br />
1 0 1 0 0 0 1 0 0 3 3 3<br />
R White<br />
Wagtail<br />
10 12 2 0 0 0 0 0 10 18 26 16<br />
R Yellow<br />
Wagtail<br />
2 0 0 1 0 0 0 0 1 0 4 60<br />
R Greater<br />
Coucal<br />
12 17 5 32 16 4 24 34 21 21 8 18<br />
R Black<br />
Drongo<br />
16 6 7 42 0 0 0 0 4 119 9 76<br />
303
Type Spp<br />
Common<br />
name<br />
Observed Population (No)<br />
Jan Feb Mar Apr May Jun Jul Aug Sep Oct Nov Dec<br />
R Redwhiskered<br />
Bulbul<br />
0 0 0 0 0 0 0 0 3 0 0 0<br />
R Jerdon’s<br />
Bushchat<br />
0 0 0 0 0 0 0 0 0 0 0 5<br />
R Common<br />
Myna<br />
0 0 0 0 0 0 8 9 8 9 0 0<br />
R Whitevented<br />
Myna<br />
0 0 0 0 0 0 0 38 0 0 0 0<br />
R Barn<br />
Swallow<br />
0 0 27 54 0 0 12 80 63 1745 2 574<br />
R House<br />
Crow<br />
0 0 0 0 0 0 49 69 2 14 0 32<br />
M Cinnamon<br />
Bittern<br />
0 0 0 0 1 0 8 5 0 0 0 0<br />
R Common<br />
Stonechat<br />
7 13 17 2 0 0 0 1 6 19 3 30<br />
M Black Bittern<br />
0 0 0 1 0 0 0 3 0 0 0 0<br />
R Scalybreasted<br />
Munia<br />
0 0 0 0 0 0 24 38 0 1 0 2<br />
M Green<br />
Sandpiper<br />
0 0 0 0 0 0 0 0 0 0 20 7<br />
M Indian<br />
Skimmer<br />
0 0 0 0 0 0 0 0 0 0 0 18<br />
M Barheaded<br />
Goose<br />
0 0 0 0 0 0 0 0 0 0 0 2<br />
M Common<br />
Shelduck<br />
0 0 0 0 0 0 0 0 0 0 0 2<br />
M1 Redcrested<br />
Pochard<br />
0 1 1 0 0 0 0 0 0 0 0 4<br />
M Common<br />
Sandpiper<br />
0 0 0 0 0 0 0 0 0 0 0 12<br />
M Ruddybreasted<br />
Crake<br />
0 0 0 0 0 0 0 0 0 0 0 9<br />
M1 Pratincole 0 0 0 0 0 0 0 0 0 0 0 11<br />
R Comb<br />
Duck<br />
6 0 0 0 0 0 0 0 0 0 0 0<br />
M Common<br />
Pochard<br />
0 85 41 0 0 0 0 0 0 0 0 0<br />
304
Type Spp<br />
Common<br />
name<br />
M Gadwall 0 5 0 0 0 0 0 0 0 0 0 0<br />
R Blur-tailed<br />
Bee-eater<br />
0 0 0 0 0 0 29 109 47 3 0 0<br />
R Redwattled<br />
Lapwing<br />
0 0 0 0 0 0 0 0 0 2 0 0<br />
R Longtailed<br />
Shrike<br />
0 0 0 0 0 0 0 0 0 0 1 1<br />
M Great<br />
Blackheaded<br />
Gull<br />
0 0 1 0 0 0 0 0 0 0 0 0<br />
M1 Unknown<br />
Black<br />
Duck<br />
0 0 0 0 0 0 0 0 0 1 0 0<br />
Total 5922 16312 12176 11179 2168 106 634 919 3215 13362 18327 37014<br />
Source: IWWS (2005)<br />
Observed Population (No)<br />
Jan Feb Mar Apr May Jun Jul Aug Sep Oct Nov Dec<br />
305
Type Spp<br />
Common<br />
name<br />
Annex 1b: Total no of Bird observed in Bird<br />
Watching Center (BWC), Inle Wetland for Year 2002<br />
Observed Population (No)<br />
Jan Feb Mar Apr May Jun Jul Aug Sep Oct Nov Dec<br />
M Little<br />
Grebe<br />
0 0 0 0 9 0 0 0 0 0 0 0<br />
R Little Cormorant<br />
233 117 0 54 3 0 39 170 471 230 2 815<br />
R Indian<br />
Shag<br />
112 327 239 44 22 28 12 120 258 117 124 16<br />
R Purple<br />
Heron<br />
9 32 4 11 5 1 1 2 4 9 4 19<br />
M Grey<br />
Heron<br />
9 149 76 0 0 0 0 0 0 50 0 4<br />
R Blackcrowned<br />
Night<br />
Heron<br />
0 0 0 0 0 0 0 0 0 3 0 0<br />
R Indian<br />
Pond<br />
Heron<br />
2 0 0 1 0 10 2 24 17 33 9 66<br />
R Little<br />
Egret<br />
0 0 1 6 4 8 4 0 1 0 3 0<br />
R Intermediate<br />
Egret<br />
31 30 27 28 53 0 5 1 15 11 28 44<br />
M Yellow<br />
Bittern<br />
0 0 0 0 1 0 12 45 16 1 0 2<br />
M Spotbilled<br />
Duck<br />
890 2521 978 1132 155 23 6 1479 2292 3146 4304<br />
M Cotton<br />
Pygmy-<br />
Goose<br />
4 0 50 19 0 0 77 0 0 0 0 12<br />
M Northern<br />
Pintail<br />
9 2062 1297 0 0 0 0 0 0 2 74 693<br />
M Lesser<br />
Whistling<br />
Duck<br />
94 1096 1000 5263 1767 0 25 88 126 4061 6627 6200<br />
M Common<br />
Teal<br />
0 0 0 0 20 0 0 0 0 0 0 616<br />
M Garganey 921 3966 2597 0 0 0 0 0 600 3786 4635 12500<br />
M Ruddy<br />
Shelduck<br />
0 1 12 27 0 0 0 0 0 0 10 234<br />
M Ferruginous<br />
Pochard<br />
907 1173 594 14 0 0 0 0 0 580 2991 2466<br />
M Baer’s<br />
Pochard<br />
113 70 31 0 0 0 0 0 0 6 0 0<br />
M Falcated<br />
Teal<br />
0 0 0 0 0 0 0 0 0 0 0 216<br />
306
Type Spp<br />
Common<br />
name<br />
Observed Population (No)<br />
Jan Feb Mar Apr May Jun Jul Aug Sep Oct Nov Dec<br />
M Pheasant-tailed<br />
Jacana<br />
2 107 41 66 26 0 6 0 5 3 8 485<br />
R Common<br />
Moorhen<br />
48 97 85 132 49 18 40 0 0 75 89 911<br />
R Purple<br />
Swamphen<br />
0 0 0 1 6 13 1 7 12 35 13 348<br />
M Common<br />
Coot<br />
2 0 0 0 0 0 0 0 0 0 8 207<br />
M Marsh<br />
Sandpiper<br />
0 0 0 0 0 0 0 0 0 0 0 41<br />
M Common<br />
Snipe<br />
0 4 16 20 0 0 0 0 0 28 12 7<br />
M Brownheaded<br />
Gull<br />
2054 1520 21 22 0 0 0 0 17 440 5835<br />
M Herring<br />
Gull<br />
11 15 22 0 0 0 13 0 0 0 0 2<br />
R Common<br />
Kingfisher<br />
11 0 6 1 0 0 0 10 11 16 6 16<br />
R Whitethroated<br />
Kingfisher<br />
1 2 1 0 0 0 0 32 12 30 8 16<br />
M Blackwinged<br />
Stilt<br />
0 2334 3472 4200 9 0 0 14 0 0 0 0<br />
R Green<br />
Bee-eater<br />
0 0 0 0 0 1 21 14 22 0 0 0<br />
R Black Kite 11 5 3 0 0 0 0 0 1 3 3 0<br />
R Brahimy<br />
Kite<br />
9 11 2 7 0 0 0 0 0 19 11 57<br />
R Blackshouldered<br />
Kite<br />
1 0 1 0 0 0 1 0 0 3 3 3<br />
R White<br />
Wagtail<br />
10 12 2 0 0 0 0 0 10 18 26 16<br />
R Yellow<br />
Wagtail<br />
2 0 0 1 0 0 0 0 1 0 4 60<br />
R Greater<br />
Coucal<br />
12 17 5 32 16 4 24 34 21 21 8 18<br />
R Black<br />
Drongo<br />
16 6 7 42 0 0 0 0 4 119 9 76<br />
R Redwhiskered<br />
Bulbul<br />
0 0 0 0 0 0 0 0 3 0 0 0<br />
307
Type Spp<br />
Common<br />
name<br />
Observed Population (No)<br />
Jan Feb Mar Apr May Jun Jul Aug Sep Oct Nov Dec<br />
R Jerdon’s<br />
Bushchat<br />
0 0 0 0 0 0 0 0 0 0 0 5<br />
R Common<br />
Myna<br />
0 0 0 0 0 0 8 9 8 9 0 0<br />
R Whitevented<br />
Myna<br />
0 0 0 0 0 0 0 38 0 0 0 0<br />
R Barn<br />
Swallow<br />
0 0 27 54 0 0 12 80 63 1745 2 574<br />
R House<br />
Crow<br />
0 0 0 0 0 0 49 69 2 14 0 32<br />
M Cinnamon<br />
Bittern<br />
0 0 0 0 1 0 8 5 0 0 0 0<br />
R Common<br />
Stonechat<br />
7 13 17 2 0 0 0 1 6 19 3 30<br />
M Black<br />
Bittern<br />
0 0 0 1 0 0 0 3 0 0 0 0<br />
R Scalybreasted<br />
Munia<br />
0 0 0 0 0 0 24 38 0 1 0 2<br />
M Green<br />
Sandpiper<br />
0 0 0 0 0 0 0 0 0 0 20 7<br />
M Indian<br />
Skimmer<br />
0 0 0 0 0 0 0 0 0 0 0 18<br />
M Barheaded<br />
Goose<br />
0 0 0 0 0 0 0 0 0 0 0 2<br />
M Common<br />
Shelduck<br />
0 0 0 0 0 0 0 0 0 0 0 2<br />
M1 Redcrested<br />
Pochard<br />
0 1 1 0 0 0 0 0 0 0 0 4<br />
M Common<br />
Sandpiper<br />
0 0 0 0 0 0 0 0 0 0 0 12<br />
M Ruddybreasted<br />
Crake<br />
0 0 0 0 0 0 0 0 0 0 0 9<br />
M1 Pratincole 0 0 0 0 0 0 0 0 0 0 0 11<br />
R Comb<br />
Duck<br />
6 0 0 0 0 0 0 0 0 0 0 0<br />
M Common<br />
Pochard<br />
0 85 41 0 0 0 0 0 0 0 0 0<br />
M Gadwall 0 5 0 0 0 0 0 0 0 0 0 0<br />
R Blur-tailed<br />
Bee-eater<br />
0 0 0 0 0 0 29 109 47 3 0 0<br />
308
Type Spp<br />
Common<br />
name<br />
R Redwattled<br />
Lapwing<br />
0 0 0 0 0 0 0 0 0 2 0 0<br />
R Longtailed<br />
Shrike<br />
0 0 0 0 0 0 0 0 0 0 1 1<br />
M Great<br />
Blackheaded<br />
Gull<br />
0 0 1 0 0 0 0 0 0 0 0 0<br />
M1 Unknown<br />
Black<br />
Duck<br />
0 0 0 0 0 0 0 0 0 1 0 0<br />
Total 5922 16312 12176 11179 2168 106 634 919 3215 13362 18327 37014<br />
Source: IWWS (2005)<br />
Observed Population (No)<br />
Jan Feb Mar Apr May Jun Jul Aug Sep Oct Nov Dec<br />
309
Type Spp<br />
Common<br />
name<br />
Annex 1c: Total no of Bird observed in Bird<br />
Watching Center (BWC), Inle Wetland for Year 2003<br />
Observed Population (No)<br />
Jan Feb Mar Apr May Jun Jul Aug Sep Oct Nov Dec<br />
M Little<br />
grebe<br />
0 0 0 0 0 104 1 28 0 0 0 5<br />
R Little carmorant<br />
80 155 188 323 159 494 1084 1566 1038 1432 519<br />
R Indian<br />
shag<br />
0 0 0 0 7 0 0 2 3 0 0 0<br />
R Purple<br />
heron<br />
18 45 13 5 15 19 11 13 21 17 17 23<br />
M Grey<br />
heron<br />
8 24 2 0 0 0 2 0 0 28 10 1<br />
R Night<br />
heron<br />
0 0 0 0 0 0 0 0 4 0 6 0<br />
R Indian<br />
pond<br />
heron<br />
0 0 0 0 10 2 26 39 60 10 0 0<br />
M Yellow<br />
bittern<br />
0 0 0 0 23 54 60 55 30 4 0 0<br />
M Black<br />
biitern<br />
0 0 0 0 2 18 5 8 0 1 0 0<br />
M Cinanmon<br />
bittern<br />
0 0 0 0 20 23 43 19 2 0 0 0<br />
R Little Egret 0 0 0 35 11 87 70 10 7 5 1 0<br />
R Intermediate<br />
egret<br />
38 61 41 185 216 359 29 33 22 1 21 29<br />
R Cattle<br />
egret<br />
0 0 0 0 5 27 114 14 9 7 0 0<br />
M Spot-billed<br />
duck<br />
6601 5132 2600 2229 500 923 349 144 257 2371 4893 4320<br />
M Northern<br />
pintail<br />
11391 7880 489 0 1 1020 5 0 0 0 3003 2469<br />
M Lesser<br />
whistling<br />
duck<br />
6950 9240 2495 3915 2056 0 594 440 585 5364 3826 2600<br />
M Gad wall 0 31 28 0 0 0 0 0 0 0 267 235<br />
M Common<br />
teal<br />
0 30 27 0 0 0 0 0 0 0 0 4<br />
M Eurasian<br />
wigeon<br />
45 211 138 0 0 0 0 0 0 42 313 720<br />
M Garganey 6110 3090 2665 0 0 0 0 0 0 1863 6457 5323<br />
M Mallard 6 19 0 0 0 0 0 0 0 0 12 5<br />
M Ruddy<br />
Shelduck<br />
78 0 12 15 0 6 0 0 0 0 19 19<br />
M Common<br />
shelduck<br />
0 0 0 0 0 0 0 0 0 0 8 2<br />
310
Type Spp<br />
Common<br />
name<br />
M Furruginous<br />
Pochard<br />
M Barer’s<br />
Pochard<br />
M Common<br />
Pochard<br />
M Falcated<br />
teal<br />
M Northern<br />
shoveler<br />
M Cotton<br />
pygmygoose<br />
M Bar<br />
headed<br />
goose<br />
M Pheasant<br />
tailed<br />
jacana<br />
R Common<br />
morhen<br />
R purple swamphen<br />
M black/<br />
common<br />
coot<br />
M Ruddy<br />
breasted<br />
crake<br />
M Marsh<br />
sandpiper<br />
M Common<br />
sand piper<br />
M Green<br />
sand piper<br />
M Spottedredshank<br />
M common<br />
red shank<br />
M western<br />
curlew<br />
M common<br />
snipe<br />
M brown<br />
headed<br />
gull<br />
M herring<br />
gull<br />
Observed Population (No)<br />
Jan Jan Feb Feb Mar Mar Apr Apr May Jun Jun Jul Jul Aug Sep Sep Oct Oct Nov Nov Dec Dec<br />
2585 1923 493 2 0 0 0 0 0 0 677 673<br />
36 65 24 0 0 0 0 0 0 0 27 3<br />
0 0 0 0 0 0 0 0 0 0 4 34<br />
0 37 0 0 0 0 0 0 0 0 0 6<br />
0 62 19 0 0 0 21 0 0 0 60 256<br />
0 80 0 0 213 771 220 15 0 0 0 0<br />
0 0 0 0 274 0 0 0 0 0 0 3<br />
614 1568 984 784 0 61 8 0 0 3 186 295<br />
313 694 333 328 136 10 1 1 0 25 275 295<br />
64 47 37 30 26 27 2 22 40 37 50 57<br />
10 3 0 0 0 0 0 0 0 1 6105 3500<br />
15 17 0 0 0 0 0 0 0 0 18 15<br />
38 25 66 59 0 0 0 0 0 0 0 0<br />
0 0 0 0 0 0 0 0 0 0 0 0<br />
378 2579 1415 297 0 0 0 0 0 3 10 75<br />
8 0 0 0 0 0 0 0 0 0 0 0<br />
47 199 0 0 0 0 0 0 0 0 0 0<br />
0 2 0 0 0 0 0 0 0 0 0 1<br />
0 0 0 0 0 0 0 0 0 0 1 0<br />
1821 834 1230 109 0 0 0 0 0 26 2782 4967<br />
0 0 0 0 0 0 0 0 0 0 0 2<br />
311
Type Spp<br />
Common<br />
name<br />
Observed Population (No)<br />
Jan Feb Mar Apr May Jun Jul Aug Sep Oct Nov Dec<br />
M Indian<br />
skimmer<br />
0 2 0 0 16 0 0 0 0 0 0 0<br />
M black<br />
winged<br />
stilt<br />
435 3833 2550 10050 0 0 0 0 0 2 0 253<br />
R common<br />
king fisher<br />
0 6 6 0 0 0 2 2 21 45 29 16<br />
R white<br />
throated<br />
king fisher<br />
0 26 4 0 0 12 29 24 23 15 16 13<br />
R green bee<br />
eater<br />
0 0 0 0 0 100 130 187 65 0 0 0<br />
R blue tailed<br />
bee eater<br />
0 0 0 0 0 228 125 0 196 0 0 0<br />
R black kite 0 9 0 0 0 3 0 0 1 1 0 0<br />
R Brahminy<br />
kite<br />
0 15 1 0 0 12 0 0 0 1 0 4<br />
R black<br />
shoulder<br />
kite<br />
0 1 2 3 5 0 4 5 12 21 0 0<br />
M Pine harrier<br />
0 0 0 0 0 0 0 0 0 2 0 0<br />
R eastern<br />
marsh<br />
harrier<br />
0 0 0 0 0 0 0 0 1 0 27 30<br />
M western<br />
marsh<br />
harrier<br />
0 31 37 15 0 0 0 0 11 7 24 27<br />
R white<br />
wagtail<br />
0 7 7 8 0 0 0 0 3 32 25 23<br />
R yellow<br />
wagtail<br />
0 9 7 2262 0 0 0 0 0 3 6 7<br />
R citrine<br />
wagtail<br />
0 43 27 9 0 0 0 0 0 0 0 0<br />
R common<br />
myna<br />
0 2 7 0 2 28 0 0 0 23 0 0<br />
R white<br />
vented<br />
myna<br />
0 0 0 0 0 0 0 0 0 0 10 0<br />
R collored<br />
myna<br />
0 0 0 0 0 0 126 0 0 0 0 0<br />
R greater<br />
coucal<br />
0 31 15 9 21 42 28 45 9 24 16 11<br />
R lesser<br />
coucal<br />
0 0 0 0 1 24 31 13 25 20 0 0<br />
R jerdon’s<br />
bushchat<br />
0 0 0 0 0 0 9 0 0 0 0 0<br />
R common<br />
stone chat<br />
0 34 21 1 0 0 0 0 23 33 36 18<br />
312
Type Spp<br />
Common<br />
name<br />
Observed Population (No)<br />
Jan Feb Mar Apr May Jun Jul Aug Sep Oct Nov Dec<br />
R Pine<br />
bushchat<br />
0 0 0 0 0 0 0 0 0 10 1 0<br />
R black<br />
drongo<br />
0 53 29 35 1 10 0 0 40 123 114 32<br />
R house<br />
crow<br />
0 37 16 3 39 0 0 0 6 0 83 107<br />
R red-whiskered<br />
bulbul<br />
0 0 0 13 0 0 0 0 0 0 0 0<br />
R barn swallow<br />
0 285 39 24 538 114 239 288 2704 472 258 340<br />
R wired<br />
tailed<br />
swallow<br />
0 0 0 0 0 0 0 0 60 2 3 2<br />
R house<br />
sparrow<br />
0 0 0 0 87 0 0 0 0 0 0 0<br />
R long tail<br />
shrike<br />
0 0 0 0 0 0 0 0 0 5 1 0<br />
R brown<br />
shrike<br />
0 1 0 0 0 0 0 0 0 0 0 0<br />
R yellow<br />
billed<br />
prinia<br />
0 0 0 0 0 0 0 0 0 0 0 0<br />
R grey<br />
breasted<br />
prinia<br />
0 0 0 0 0 0 0 0 0 0 0 0<br />
R dusky<br />
warbaler<br />
0 4 15 5 0 0 0 0 1 1 17 18<br />
R orienta<br />
reed<br />
warbaler<br />
0 0 3 0 0 0 0 0 0 0 0 0<br />
R chestnut<br />
capped<br />
babbler<br />
0 0 0 0 0 0 21 15 0 9 5 16<br />
M1 Tufted<br />
duck<br />
0 0 0 0 0 0 0 0 0 0 93 0<br />
M1 black tern 0 0 0 0 0 0 0 0 88 0 0 0<br />
M1 white wing<br />
black tern<br />
0 0 0 0 0 0 0 0 75 0 0 0<br />
M1 clamorus<br />
reed<br />
warbaler<br />
0 0 0 0 0 0 4 13 0 0 0 0<br />
M1 Fulvous<br />
whistling<br />
duck<br />
0 0 0 0 0 0 4 0 0 0 0 0<br />
M1 streaked<br />
warbaler<br />
0 0 0 0 0 0 5 68 73 0 0 0<br />
Source: IWWS (2005)<br />
313
Type Spp Common<br />
name<br />
Annex 1d: Total no of Bird observed in Bird Watching<br />
Center (BWC), Inle Wetland for Year 2004<br />
314<br />
Observed Population<br />
Jan Feb Mar Apr May Jun Jul Aug Sep Oct Nov Dec<br />
M Little Grebe 0 0 58 0 0 0 0 0 0 0 0 3<br />
R Little Cormorant<br />
660 269 191 28 69 176 114 714 895 1529 632 227<br />
R Purple<br />
Heron<br />
0 0 4 0 12 13 3 0 18 10 16 19<br />
M Grey<br />
Heron<br />
9 18 0 0 0 0 0 0 0 2 5 3<br />
R Blackcrowned<br />
Night<br />
Heron<br />
0 0 0 0 0 0 0 2 22 39 0 0<br />
R Indian<br />
Pond<br />
Heron<br />
0 0 0 0 8 7 7 26 14 62 21 22<br />
R Little Egret 0 1 0 33 8 2 3 8 61 30 0 0<br />
R Intermediate<br />
Egret<br />
20 28 67 116 31 26 38 3 32 71 46 35<br />
R Cattle<br />
Egret<br />
0 0 0 0 18 25 6 0 1 0 0 0<br />
M Yellow<br />
Bittern<br />
0 0 2 9 59 49 53 39 81 11 1 0<br />
M Spot-billed<br />
Duck<br />
2300 936 1825 314 14 45 27 8 438 723 2949 5050<br />
M Cotton<br />
Pygmy-<br />
Goose<br />
0 0 6 0 0 0 0 0 0 0 0 0<br />
M Northern<br />
Pintail<br />
450 3 2 0 0 0 0 0 0 0 4213 7600<br />
M Lesser<br />
Whistling<br />
Duck<br />
1750 1850 8313 0 0 5 0 0 739 2549 10050 15200<br />
M Common<br />
Teal<br />
11 0 0 0 56 5 0 0 0 0 0 6<br />
M Eurasian<br />
Wigeon<br />
414 179 4 0 0 0 0 0 0 0 270 297<br />
M Garganey 3350 102 4 0 0 0 0 0 4 2248 7602 11700<br />
M Ruddy<br />
Shelduck<br />
70 1 9 0 0 0 0 0 0 0 18 16<br />
M Ferruginous<br />
Pochard<br />
145 560 303 0 0 0 0 0 0 0 436 889<br />
M Baer’s<br />
Pochard<br />
0 0 0 0 0 0 0 0 0 0 2 2<br />
M Falcated<br />
Teal<br />
41 10 0 0 0 0 0 0 0 2 0 0
M1 Type Red Spp Com- 3<br />
Crested mon name<br />
0 0 0 0 0 0 0<br />
Observed Population<br />
0 0 0 0<br />
Pochard Jan Feb Mar Apr May Jun Jul Aug Sep Oct Nov Dec<br />
M Pheasant-tailed<br />
Jacana<br />
1110 523 1089 1188 186 0 1 0 0 1 390 119<br />
R Common<br />
Moorhen<br />
104 27 66 101 68 0 0 0 0 2 2 60<br />
R Purple Swamphen<br />
31 11 116 735 89 17 23 16 27 44 43 23<br />
M Common<br />
Coot<br />
297 500 0 0 0 0 0 0 0 1 7985 29200<br />
M Brownheaded<br />
Gull<br />
2050 1571 10 0 0 0 0 0 0 0 1934 5524<br />
M Herring<br />
Gull<br />
0 0 0 0 0 0 0 0 0 6 3 1<br />
R Common<br />
Kingfisher<br />
0 0 1 0 0 0 2 7 27 23 20 21<br />
R Whitethroated<br />
Kingfisher<br />
0 0 0 0 1 16 21 12 31 35 34 26<br />
M Blackwinged<br />
Stilt<br />
1250 1690 3432 2839 1 0 0 0 0 0 0 31<br />
R Blue-tailed<br />
Bee-eater<br />
0 0 0 0 6 69 118 0 0 0<br />
R Blackshouldered<br />
Kite<br />
0 0 0 0 0 9 13 7 12 5 1 0<br />
R White<br />
Wagtail<br />
0 0 9 4 0 0 0 0 9 28 32 25<br />
R Greater<br />
Coucal<br />
0 0 0 22 26 45 29 15 11 23 21 18<br />
R Black<br />
Drongo<br />
0 0 20 64 1 0 0 1 15 114 69 33<br />
R Common<br />
Myna<br />
0 0 0 7 17 8 66 0 0 15 0 0<br />
R White-vented<br />
Myna<br />
0 0 0 6 0 0 0 0 0 150 0 0<br />
R Streaked<br />
(Baya)<br />
Weaver<br />
0 0 0 0 0 0 0 0 3 2 0 0<br />
R Barn Swallow<br />
0 0 0 4110 495 76 2800 648 1673 678 3125<br />
R House<br />
Crow<br />
0 0 0 6 8 0 0 0 0 0 41 2<br />
M Cinnamon<br />
Bittern<br />
0 0 0 0 19 13 43 12 26 0 0 0<br />
R Common<br />
Stonechat<br />
0 0 5 2 0 0 0 0 24 39 55 38<br />
M Black Bittern<br />
0 0 0 0 7 2 1 0 1 0 0 0<br />
315
Type Spp Common<br />
name<br />
M Green<br />
Sandpiper<br />
196 0 0 51 0 0 0 0 0 0 1 22<br />
R Long-tailed<br />
Shrike<br />
0 0 0 0 0 0 0 0 2 2 0 0<br />
M Common<br />
Shelduck<br />
0 0 0 o 0 0 0 0 0 0 12 0<br />
M Gadwall 34 0 0 o 0 0 0 0 0 0 53 49<br />
M Wood<br />
Sandpiper<br />
0 0 26 o 0 0 0 0 0 0 2 0<br />
R Eastern<br />
Marsh<br />
Harrier<br />
0 0 9 7 0 0 0 0 1 12 22 27<br />
M Common<br />
Redshank<br />
0 0 2 4 0 0 0 0 0 0 0 0<br />
R Chestnutcapped<br />
Babbler<br />
0 0 0 14 10 13 0 15 32 91 18 21<br />
M1 Lesser<br />
-tree Duck<br />
0 0 0 1235 303 73 71 137 0 0 0 0<br />
M1 House<br />
Switt<br />
0 0 0 20 0 0 0 0 0 0 0 0<br />
R Reed<br />
Warbler<br />
0 0 0 0 13 0 0 0 0 0 0 0<br />
M1 Whitewinged<br />
Black Tern<br />
0 0 0 0 7 0 8 0 10 0 0 0<br />
R Red<br />
Rumped<br />
Swallow<br />
0 0 0 0 0 0 36 0 0 0 0 0<br />
R House<br />
Sparrow<br />
0 0 0 0 0 0 0 0 2 0 3 0<br />
M Western<br />
Marsh<br />
Harrier<br />
0 0 0 0 0 0 0 0 0 5 33 23<br />
R Dusky<br />
Warbler<br />
0 0 0 0 0 0 0 0 0 5 33 23<br />
M1 Redcrested<br />
Pochard<br />
0 39 0 0 0 0 0 0 0 0 3 2<br />
M1 Tufted<br />
Duck<br />
0 0 0 0 0 0 0 0 0 0 50 30<br />
M Mallard 6 0 0 0 0 0 0 0 0 0 0 13<br />
M Northern<br />
Shoveler<br />
10 0 0 0 0 0 0 0 0 0 0 79<br />
R Rock<br />
Pigeon<br />
0 0 0 0 0 0 0 0 0 0 0 2<br />
R Lesser<br />
Coucal<br />
0 0 0 0 0 0 0 1 1 0 0 0<br />
R Indian<br />
Shag<br />
0 0 0 0 0 0 0 0 0 1 0 0<br />
316<br />
Observed Population<br />
Jan Feb Mar Apr May Jun Jul Aug Sep Oct Nov Dec
Type Spp Common<br />
name<br />
M Bar-headed<br />
Goose<br />
8 1 0 0 0 0 0 0 0 0 0 1<br />
M Common<br />
Pochard<br />
46 0 0 0 0 0 0 0 0 0 0 0<br />
M Ruddybrested<br />
Crake<br />
4 0 0 0 0 0 0 0 0 0 0 0<br />
M Marsh<br />
Sandpiper<br />
91 0 0 0 0 0 0 0 0 0 0 0<br />
Total 14457 8319 15573 10915 1532 852 794 3892 3305 9553 37799 79607<br />
Source: IWWS (2005)<br />
317<br />
Observed Population<br />
Jan Feb Mar Apr May Jun Jul Aug Sep Oct Nov Dec
Annex 2a:Monthly Average no of Migratory and resident<br />
Bird (Bird Watching Center)<br />
No of Frequency Observed Per Month (BWC)<br />
Year Jan Feb Mar Apr May Jun Jul Aug Sep Oct Nov Dec<br />
2001 0 0 0 10 23 0 3 0 0 20 26 16<br />
2002 22 21 20 20 14 15 30 29 26 17 17 21<br />
2003 27 25 19 19 20 27 26 27 28 24 24 23<br />
2004 27 26 13 18 27 25 25 17 26 23 25 23<br />
Migratory bird population (BWC)<br />
Year Jan Feb Mar Apr May Jun Jul Aug Sep Oct Nov Dec<br />
2001 - - - 8,103 16,017 - 19 - - 4,155 4,680 7,044<br />
2002 5,401 15,643 11,749 10,763 2,010 23 362 161 2,226 10,827 17,971 33,889<br />
2003 37,179 36,917 15,274 17,475 3,105 2,980 1,321 790 1,121 9,717 28,795 25,813<br />
2004 13,642 7,983 15,085 5,660 652 192 204 196 1,299 5,548 36,012 75,860<br />
No of Migratory Spp Observed (BWC)<br />
Year Jan Feb Mar Apr May Jun Jul Aug Sep Oct Nov Dec<br />
2001 0 0 0 6 8 0 5 0 0 4 9 14<br />
2002 12 16 17 10 9 1 7 6 5 12 11 25<br />
2003 20 25 18 10 9 8 14 9 8 14 22 26<br />
2004 22 15 15 8 9 7 7 4 7 10 21 24<br />
Monthly Average No of Migratory Bird Observed (BWC)<br />
Year Jan Feb Mar Apr May Jun Jul Aug Sep Oct Nov Dec<br />
2001 - - - 810 696 - 6 - - 208 180 440<br />
2002 246 745 587 538 144 2 12 6 86 637 1,057 1,614<br />
2003 1,377 1,477 804 920 155 110 51 29 40 405 1,200 1,122<br />
2004 505 307 1,160 314 24 8 8 12 50 241 1,440 3,298<br />
Residential bird population (BWC)<br />
Year Jan Feb Mar Apr May Jun Jul Aug Sep Oct Nov Dec<br />
2001 300 782 99 735 579 224<br />
2002 521 669 427 416 158 83 272 758 989 2535 356 3125<br />
2003 513 1565 811 3278 1279 1598 2081 2279 5108 1980 2449 1560<br />
2004 815 336 488 5255 880 660 590 3696 2006 4005 1787 3747<br />
No of Residential Spp Observed (BWC)<br />
Year Jan Feb Mar Apr May Jun Jul Aug Sep Oct Nov Dec<br />
2001 0 0 0 13 13 0 11 0 0 8 14 18<br />
2002 17 12 15 15 8 8 16 17 21 23 20 21<br />
2003 5 21 20 17 17 18 19 17 25 26 22 19<br />
2004 4 5 9 15 17 15 15 15 23 24 19 18<br />
Monthly Average No of Residential Bird Observed (BWC)<br />
Year Jan Feb Mar Apr May Jun Jul Aug Sep Oct Nov Dec<br />
2001 0 0 0 30 34 0 33 0 0 37 22 14<br />
2002 24 32 21 21 11 6 9 26 38 149 21 149<br />
2003 19 63 43 173 64 59 80 84 182 83 102 68<br />
2004 30 13 38 292 33 26 24 217 77 174 71 163<br />
Source: IWWS (2005)<br />
318
Annex 2b: Annual Average no of Migratory and resident Birds<br />
(other than in Bird Watching center)<br />
No of Frequency Observed (Other than BWC)<br />
Year Inle (Other) Sagar Lake Moe Bywe Hpae Khon<br />
2001 10 25 16<br />
2002 12<br />
2003 4 8 1<br />
2004 1<br />
Total No of Migratory Bird (Other than BWC)<br />
Year Inle (Other) Sagar Lake Moe Bywe Hpae Khon<br />
2001 1696 1793 5224 0<br />
2002 2659 0 0 0<br />
2003 99 504 0 315<br />
2004 6 0 0 0<br />
No of Migratory Spp Yearly Observed (Other than BWC)<br />
Year Inle (Other) Sagar Lake Moe Bywe Hpae Khon<br />
2001 9 14 10 0<br />
2002 9 0 0 0<br />
2003 3 10 0 6<br />
2004 2 0 0 0<br />
Annual Average No of Migratory Bird Observed (Other than BWC)<br />
Year Inle (Other) Sagar Lake Moe Bywe Hpae Khon<br />
2001 170 72 327<br />
2002 222<br />
2003 25 63 315<br />
2004 6<br />
Total No of Resident Bird (Other than BWC)<br />
Year Inle (Other) Sagar Lake Moe Bywe Hpae Khon<br />
2001 504 925 668<br />
2002 382<br />
2003 387 503 64<br />
2004 12<br />
No of Resident Spp Yearly Observed (Other than BWC)<br />
Year Inle (Other) Sagar Lake Moe Bywe Hpae Khon<br />
2001 19 26 10<br />
2002 18<br />
2003 22 29 10<br />
2004 6<br />
Annual Average No of Resident Bird Observed (Other than BWC)<br />
Year Inle (Other) Sagar Lake Moe Bywe Hpae Khon<br />
2001 50 37 42<br />
2002 32<br />
2003 97 63 64<br />
2004 12<br />
Source: IWWS (2005)<br />
319
Annex 3a<br />
Annex 3b<br />
320
Sr<br />
No.<br />
Annex 4. Population of Village Tract in Inle Wetland (Nyaungshwe Tsp)<br />
Village tract 1983 1990 1995 1996 1997 1998 1999 2000 2001 2002 2003 2004 2005<br />
1 Banbyin<br />
(UP)<br />
2 Inndan<br />
(UP)<br />
3 Kyauktaing<br />
(UP)<br />
4 Letmayngkwe<br />
(UP)<br />
5 Linlan<br />
North (UP)<br />
6 Linlan<br />
South (UP)<br />
7 Lonkan<br />
(UP)<br />
8 Taungche<br />
(UP)<br />
2,660 3,255 3,679 3,763 3,847 3,931 4,015 4,099 4,183 4,267 4,351 4,435 4,519<br />
1,055 1,376 1,601 1,646 1,691 1,736 1,781 1,826 1,871 1,916 1,961 2,006 2,051<br />
1,239 1,694 2,019 2,084 2,149 2,214 2,279 2,344 2,409 2,474 2,539 2,604 2,669<br />
1,680 1,827 1,932 1,953 1,974 1,995 2,016 2,036 2,056 2,076 2,096 2,116 2,136<br />
1,594 1,993 2,173 2,221 2,269 2,317 2,365 2,413 2,461 2,509 2,557 2,605 2,653<br />
1,105 1,488 1,758 1,812 1,866 1,920 1,974 2,028 2,082 2,136 2,190 2,244 2,298<br />
1,168 1,598 1,903 1,964 2,025 2,086 2,147 2,208 2,269 2,330 2,391 2,452 2,513<br />
4,189 4,448 4,633 4,670 4,707 4,744 4,781 4,818 4,855 4,892 4,929 4,966 5,002<br />
9 Yepu (UP) 1,079 1,240 1,355 1,378 1,401 1,424 1,447 1,470 1,493 1,515 1,537 1,555 1,581<br />
10 Kyepawkhone<br />
(UP)<br />
4,516 5,106 5,526 5,610 5,694 5,778 5,862 5,946 6,030 6,114 6,198 6,282 6,366<br />
11 Tilaw (UP) 4,307 5,329 6,059 6,205 6,351 6,497 6,643 6,788 6,933 7,078 7,223 7,368 7,513<br />
12 Ywatha<br />
(UP)<br />
13 Khaungtaing<br />
(Wet)<br />
14 Maingthauk<br />
(Wet)<br />
15 Minchaung<br />
(Wet)<br />
16 Naungtaw<br />
(Wet)<br />
17 Pontmu<br />
(Wet)<br />
18 Sakar<br />
(Wet)<br />
19 Taungbogyi<br />
(Wet)<br />
2,856 3,073 3,228 3,259 3,290 3,321 3,352 3,383 3,414 3,445 3,476 3,506 3,536<br />
2,003 2,339 2,579 2,627 2,675 2,723 2,771 2,819 2,866 2,913 2,960 3,007 3,054<br />
4,568 4,890 5,119 5,164 5,209 5,254 5,299 5,344 5,389 5,434 5,479 5,524 5,569<br />
6,442 7,051 7,486 7,573 7,660 7,747 7,834 7,921 8,008 8,094 8,180 8,266 8,352<br />
4,050 4,820 5,370 5,480 5,590 5,700 5,810 5,920 6,030 6,140 6,250 6,360 6,469<br />
3,606 4,040 4,346 4,407 4,468 4,529 4,590 4,651 4,712 4,773 4,834 4,895 4,956<br />
1,798 2,169 2,434 2,487 2,540 2,593 2,646 2,699 2,752 2,805 2,858 2,911 2,963<br />
2,031 2,402 2,667 2,720 2,773 2,826 2,879 2,932 2,985 3,038 3,090 3,142 3,194<br />
20 Tonle (Wet) 2,669 2,863 2,998 3,025 3,052 3,079 3,106 3,133 3,160 3,187 3,214 3,241 3,268<br />
21 Inntain<br />
(Wet)<br />
2,480 2,753 2,944 2,982 3,020 3,058 3,096 3,134 3,172 3,210 3,248 3,286 3,324<br />
22 Maingpyo<br />
(Wet)<br />
1,669 1,956 2,158 2,198 2,238 2,278 2,318 2,358 2,398 2,438 2,478 2,518 2,558<br />
23 Kyungyi<br />
(Wet)<br />
2,994 3,182 3,317 3,343 3,369 3,395 3,421 3,447 3,473 3,499 3,525 3,551 3,577<br />
24 Nathe<br />
(Wet)<br />
3,006 3,461 3,782 3,846 3,910 3,974 4,038 4,102 4,166 4,230 4,294 4,358 4,420<br />
321
Sr<br />
No.<br />
Village tract 1983 1990 1995 1996 1997 1998 1999 2000 2001 2002 2003 2004 2005<br />
25 Thabyepin<br />
(Wet)<br />
26 Linkin<br />
(Wet)<br />
27 Nampan<br />
(Wet)<br />
28 Taungtoh<br />
(Wet)<br />
29 Thaleoo<br />
(Wet)<br />
30 Innchankela<br />
(W)<br />
31 Innpawkhon<br />
(W)<br />
4,499 4,695 4,835 4,863 4,891 4,919 4,947 4,975 5,003 5,031 5,059 5,087 5,115<br />
2,830 3,243 3,536 3,594 3,652 3,710 3,768 3,826 3,884 3,942 4,000 4,058 4,116<br />
3,900 3,992 4,057 4,070 4,083 4,096 4,109 4,122 4,135 4,148 4,161 4,174 4,187<br />
3,918 4,142 4,300 4,331 4,362 4,393 4,424 4,455 4,486 4,517 4,548 4,579 4,610<br />
4,453 4,873 5,173 5,233 5,293 5,353 5,413 5,473 5,533 5,593 5,653 5,713 5,772<br />
3,563 3,920 4,175 4,226 4,277 4,327 4,377 4,427 4,477 4,527 4,577 4,627 4,677<br />
4,380 4,476 4,541 4,554 4,567 4,580 4,593 4,606 4,619 4,632 4,645 4,658 4,671<br />
32 Innya (W) 3,587 3,825 3,995 4,029 4,063 4,097 4,131 4,165 4,199 4,233 4,267 4,301 4,335<br />
33 Ngapechaung<br />
(W)<br />
2,346 2,423 2,478 2,489 2,500 2,511 2,522 2,532 2,542 2,552 2,562 2,572 2,582<br />
34 Thalay (W) 3,657 3,939 4,139 4,179 4,219 4,259 4,299 4,339 4,379 4,419 4,459 4,499 4,539<br />
35 Ywama<br />
(W)<br />
3,636 3,958 4,188 4,234 4,280 4,326 4,372 4,418 4,464 4,510 4,556 4,602 4,648<br />
Source: Nyaungshwe’s Immigration and <strong>National</strong> Registration Department (2005)<br />
322
Annex 5a: Members of Steering committee of inle lake conservation<br />
1. Military Commander and Chairman of Shan State Peace and<br />
Development Council<br />
323<br />
Chair Person<br />
2. Secretary, Shan State Peace and Development Council Vice Chairman (1)<br />
3. Chairman, Taunggyi District Peace and Development Council Vice Chairman (2)<br />
4. Commanding Officer, Taunggyi Military Supply Depot Member<br />
5. Public Administrator, Government Affairs Department, Southern Shan<br />
State<br />
Member<br />
6. Police Commander, Police Department of Southern Shan State Member<br />
7. Director, Immigration and <strong>National</strong> Registration Department, Southern<br />
Shan State<br />
Member<br />
8. General Manager, <strong>Myanmar</strong> Agriculture Service, Southern Shan State Member<br />
9. General Manager, <strong>Myanmar</strong> Enterprise for Perennial Crop Member<br />
10. Officer In Charge, Settlements and Land Records Department, Southern<br />
Shan State<br />
Member<br />
11. Chief Engineer, <strong>Myanmar</strong> Electrical Enterprise, Southern Shan State Member<br />
12. Director, Department of Development Affairs, Southern Shan State Member<br />
13. Director, Department of Agriculture Mechanization, Southern Shan<br />
State<br />
Member<br />
14. Officer In Charge, Fishery Department, Southern Shan State Member<br />
15. Secretary, Union of Solidarity and Development Association, Taunggyi<br />
Township<br />
Member<br />
16. Director, Forest Department, Southern Shan State Secretary (1)<br />
17. Director, Irrigation Department, Southern Shan State Secretary (2)<br />
Annex 5b: Members of Township level supervising committee for<br />
inle lake conservation<br />
1. Chairman, Township District Peace and Development Council Chair Person<br />
2. Chief of Township Police Department Member<br />
3. Staff Officer, Township Immigration and <strong>National</strong> Registration<br />
Department<br />
Member<br />
4. Staff Officer, Township Irrigation Department Member<br />
5. Township Manager, <strong>Myanmar</strong> Agriculture Service Member<br />
6. Staff Officer, Township Settlements and Land Records Department Member<br />
7. Township engineer, <strong>Myanmar</strong> Electrical Enterprise Member<br />
8. Township Executive Officer, Department of Development Affairs Member<br />
9. Staff Officer, Township level Department of Agriculture Mechanization Member<br />
10. Member from Township Union of Solidarity and Development<br />
Association<br />
Member<br />
11. Chairman of Village Tracts Peace and Development Council Member<br />
12. Staff Officer, Township Forest Department Secretary