

Documentation of the Evaluation of CALPUFF and Other Long ...
Documentation of the Evaluation of CALPUFF and Other Long ...
Documentation of the Evaluation of CALPUFF and Other Long ...

You also want an ePaper? Increase the reach of your titles
YUMPU automatically turns print PDFs into web optimized ePapers that Google loves.
120%<br />
100%<br />
80%<br />
60%<br />
40%<br />
20%<br />
0%<br />
‐20%<br />
120%<br />
100%<br />
80%<br />
60%<br />
40%<br />
20%<br />
0%<br />
‐20%<br />
EPA1998_PG<br />
EPA1998_CAL<br />
BASEA_AER<br />
BASEA_CAL<br />
BASEA_PG<br />
EXP1A_AER<br />
EXP1A_CAL<br />
EXP1A_PG<br />
EXP1B_AER<br />
EXP1B_CAL<br />
EXP1B_PG<br />
EXP1C_AER<br />
EXP1C_CAL<br />
EXP1C_PG<br />
EXP2A_AER<br />
EXP2A_CAL<br />
EXP2A_PG<br />
EXP2B_AER<br />
EXP2B_CAL<br />
EXP2B_PG<br />
EXP2C_AER<br />
EXP2C_CAL<br />
EXP2C_PG<br />
EXP3A_AER<br />
EXP3A_CAL<br />
EXP3A_PG<br />
EXP3B_AER<br />
EXP3B_CAL<br />
EXP3B_PG<br />
EXP3C_AER<br />
EXP3C_CAL<br />
EXP3C_PG<br />
MMIF12KM_AER<br />
MMIF12KM_CAL<br />
MMIF12KM_PG<br />
MMIF36KM_AER<br />
MMIF36KM_CAL<br />
MMIF36KM_PG<br />
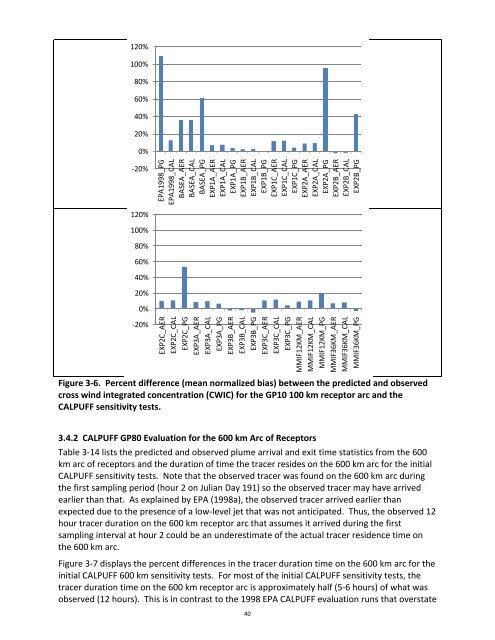
Figure 3‐6. Percent difference (mean normalized bias) between <strong>the</strong> predicted <strong>and</strong> observed<br />
cross wind integrated concentration (CWIC) for <strong>the</strong> GP10 100 km receptor arc <strong>and</strong> <strong>the</strong><br />
<strong>CALPUFF</strong> sensitivity tests.<br />
3.4.2 <strong>CALPUFF</strong> GP80 <strong>Evaluation</strong> for <strong>the</strong> 600 km Arc <strong>of</strong> Receptors<br />
Table 3‐14 lists <strong>the</strong> predicted <strong>and</strong> observed plume arrival <strong>and</strong> exit time statistics from <strong>the</strong> 600<br />
km arc <strong>of</strong> receptors <strong>and</strong> <strong>the</strong> duration <strong>of</strong> time <strong>the</strong> tracer resides on <strong>the</strong> 600 km arc for <strong>the</strong> initial<br />
<strong>CALPUFF</strong> sensitivity tests. Note that <strong>the</strong> observed tracer was found on <strong>the</strong> 600 km arc during<br />
<strong>the</strong> first sampling period (hour 2 on Julian Day 191) so <strong>the</strong> observed tracer may have arrived<br />
earlier than that. As explained by EPA (1998a), <strong>the</strong> observed tracer arrived earlier than<br />
expected due to <strong>the</strong> presence <strong>of</strong> a low‐level jet that was not anticipated. Thus, <strong>the</strong> observed 12<br />
hour tracer duration on <strong>the</strong> 600 km receptor arc that assumes it arrived during <strong>the</strong> first<br />
sampling interval at hour 2 could be an underestimate <strong>of</strong> <strong>the</strong> actual tracer residence time on<br />
<strong>the</strong> 600 km arc.<br />
Figure 3‐7 displays <strong>the</strong> percent differences in <strong>the</strong> tracer duration time on <strong>the</strong> 600 km arc for <strong>the</strong><br />
initial <strong>CALPUFF</strong> 600 km sensitivity tests. For most <strong>of</strong> <strong>the</strong> initial <strong>CALPUFF</strong> sensitivity tests, <strong>the</strong><br />
tracer duration time on <strong>the</strong> 600 km receptor arc is approximately half (5‐6 hours) <strong>of</strong> what was<br />
observed (12 hours). This is in contrast to <strong>the</strong> 1998 EPA <strong>CALPUFF</strong> evaluation runs that overstate<br />
40


