Documentation of the Evaluation of CALPUFF and Other Long ...
Documentation of the Evaluation of CALPUFF and Other Long ... Documentation of the Evaluation of CALPUFF and Other Long ...
Figure C‐ ‐16 Spatial model m perfoormance statistics for thhe CAMx CTEEX5 sensitivvity tests using the PiG ssubgrid‐scale e puff moduule (PiG). C.3.8 Gloobal Statistical Perform Figures CC‐17 and C‐18 displays th module wwith statistic cal metrics fo highest sscore. For th he FOEX met each other (‐1.2% ‐ 4.7%), 4 with t degradinng slightly across the ACM equivalennt NoPiG sce enarios. For NMSE and KSP, the CMAQ an CMAQ Kzz option has the best NM with valuues of 14.2 – 15.8 pg m for KSP, ffollowed by scores. OOB70 consist ‐3 mance for CAAMx CTEX5 PPiG Experime he global staatistics for thhe CAMx sen or the best pperforming mmodel has th tric, all of the Kz/advectiion solver op he best perfformance cooming from O M2 and CMAAQ options, which is larg nd TKE optioons perform better than MSE values wwith 9.9 – 100.8 pg m 3 (PPM/BOTTT). The TKE/ CMAQ/PPMM. All of the Kz options s tently scoredd the pooresst across all ‐3 ents nsitivity testss using the PPiG he, respectivvely, lowest and ptions are wwithin 5% ‐ 6% % of OB70 and TKKE options and gely consisteent with the either OB700 or ACM2. The (PPPM/BOTT), followed by TKE /PPM combination had tthe best scores save OB70 had very simiilar FB and FA2/5 of the globaal statistical metrics. 20
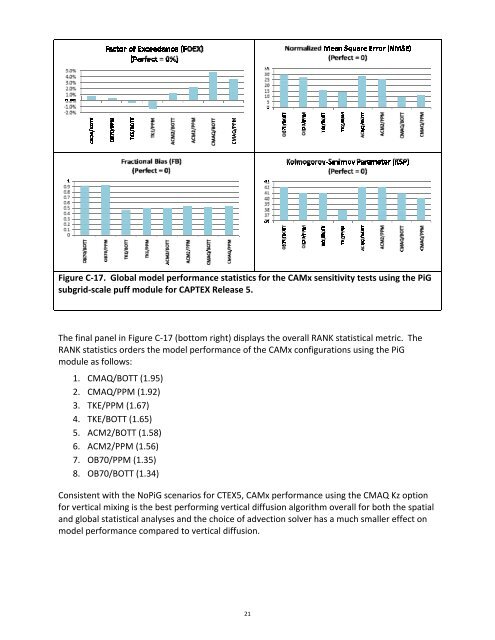
Figure C‐ ‐17. Global model perfoormance staatistics for thhe CAMx sennsitivity testts using the PiG subgrid‐sscale puff module m for CAAPTEX Releaase 5. The final panel in Fig gure C‐17 (boottom right) displays thee overall RANNK statisticaal metric. Thhe RANK staatistics order rs the model performance of the CAAMx configurations usingg the PiG module aas follows: 1. CMAQ/BOTT (1.95) 2. CMAQ/PPM (1.92) ( 3. TKE/PPM (1.6 67) 4. TKE/BOTT (1. 65) 5. AACM2/BOTT (1.58) 6. AACM2/PPM ( 1.56) 7. OOB70/PPM (1 1.35) 8. OOB70/BOTT ( 1.34) Consistennt with the NoPiG N scenaarios for CTEX5, CAMx peerformance using the CMMAQ Kz option for verticcal mixing is the best perrforming verrtical diffusioon algorithmm overall for both the sppatial and global statistical analyses annd the choicee of advectioon solver has a much smmaller effect on model peerformance compared too vertical difffusion. 21
- Page 173 and 174: Figure 6‐ ‐22 displays the t sp
- Page 175 and 176: Figure 6‐ ‐23a. Global model pe
- Page 177 and 178: Figure 6‐24. Figure of Merit (FMS
- Page 179 and 180: 7.0 REFERENCES Anderson, B. 2008. T
- Page 181 and 182: EPA, 1984: Interim Procedures for E
- Page 183 and 184: Mlawer, E.J., S.J. Taubman, P.D. Br
- Page 185 and 186: 148 Appendix A Evaluation of the MM
- Page 187 and 188: Table A‐1. Wind speed and wind di
- Page 189 and 190: Table A‐3. Definition of the CTEX
- Page 191 and 192: Figure A‐ ‐1. Wind speed bias (
- Page 193 and 194: Figure A‐ ‐3. Humidity bias and
- Page 195 and 196: Table A‐5. Comparison of CTEX5 MM
- Page 197 and 198: B.1 CALMET MODEL EVALUATION TO IDEN
- Page 199 and 200: Figure B‐ ‐1 displays th he win
- Page 201 and 202: Table B‐2a. Summary wind speed mo
- Page 203 and 204: B.2 CONCLUSIONS OF CTEX3 CALMET SEN
- Page 205 and 206: C.1 INTRODUCTION In this section, t
- Page 207 and 208: C.2.2 HYYSPLIT GLOB BAL STATISTIICS
- Page 209 and 210: The final panel in Figure C‐3 (bo
- Page 211 and 212: Figure C‐ ‐5. Global model m pe
- Page 213 and 214: C.3 CAMX SENSITIVITY TESTS Followin
- Page 215 and 216: ACM2 Kzz combinatio ons rank as the
- Page 217 and 218: Figure C‐ ‐10. Spatial model pe
- Page 219 and 220: Figure C‐ ‐12. Global model per
- Page 221 and 222: Figure C‐ ‐13. Spatial model pe
- Page 223: Figure C‐ ‐15. Global model per
- Page 227 and 228: Table C‐3. CAMx FMS and POD spati
- Page 229 and 230: Figure C‐ ‐20. False Alarm Rate
- Page 231 and 232: Figure C‐ ‐23. Factor of o Exce
- Page 233 and 234: The PCC values for th he six LRT mo
- Page 235 and 236: The RANK statistical performancce m
- Page 237 and 238: Table C‐55. Summary y of model r
- Page 239 and 240: Results foor the TS me etric are pr
- Page 241 and 242: Figure C‐ ‐35. Factor of o 2 (F
- Page 243 and 244: a negativve FB. The best b performm
- Page 245 and 246: performing model the most often sco
- Page 247: United States Environmental Protect
Figure C‐ ‐17. Global model perfoormance<br />
staatistics<br />
for thhe<br />
CAMx sennsitivity<br />
testts<br />
using <strong>the</strong> PiG<br />
subgrid‐sscale<br />
puff module m for CAAPTEX<br />
Releaase<br />
5.<br />
The final panel in Fig gure C‐17 (boottom<br />
right) displays <strong>the</strong>e<br />
overall RANNK<br />
statisticaal<br />
metric. Thhe<br />
RANK staatistics<br />
order rs <strong>the</strong> model<br />
performance<br />
<strong>of</strong> <strong>the</strong> CAAMx<br />
configurations<br />
usingg<br />
<strong>the</strong> PiG<br />
module aas<br />
follows:<br />
1. CMAQ/BOTT<br />
(1.95)<br />
2. CMAQ/PPM<br />
(1.92) (<br />
3. TKE/PPM<br />
(1.6 67)<br />
4. TKE/BOTT<br />
(1. 65)<br />
5. AACM2/BOTT<br />
(1.58)<br />
6. AACM2/PPM<br />
( 1.56)<br />
7. OOB70/PPM<br />
(1 1.35)<br />
8. OOB70/BOTT<br />
( 1.34)<br />
Consistennt<br />
with <strong>the</strong> NoPiG N scenaarios<br />
for CTEX5,<br />
CAMx peerformance<br />
using <strong>the</strong> CMMAQ<br />
Kz option<br />
for verticcal<br />
mixing is <strong>the</strong> best perrforming<br />
verrtical<br />
diffusioon<br />
algorithmm<br />
overall for both <strong>the</strong> sppatial<br />
<strong>and</strong> global<br />
statistical analyses annd<br />
<strong>the</strong> choicee<br />
<strong>of</strong> advectioon<br />
solver has<br />
a much smmaller<br />
effect on<br />
model peerformance<br />
compared too<br />
vertical difffusion.<br />
21


