Documentation of the Evaluation of CALPUFF and Other Long ...
Documentation of the Evaluation of CALPUFF and Other Long ... Documentation of the Evaluation of CALPUFF and Other Long ...
BASE Use 80 km MM5 data from EXP1C and 18 km CALMET grid resolution. 1. Use 80 km MM5 data from EXP1C and 12 km CALMET grid resolution. 2. Use 80 km MM5 data from EXP1C and 4 km CALMET grid resolution. 3. Use 36 km MM5 data from EXP2H and 12 km CALMET grid resolution. 4. Use 12 km MM5 data from EXP2H and 12 km CALMET grid resolution. 5. Use 36 km MM5 data from EXP2H and 4 km CALMET grid resolution. 6. Use 12 km MM5 data from EXP2H and 4 km CALMET grid resolution. The variations in the CALMET STEP2 OA procedures in the CALMET sensitivity test were as follows: A. Use meteorological observations with RMAX1/RMAX2 = 500/1000. B. Use meteorological observations with RMAX1/RMAX2 = 100/200. C. Use meteorological observations with RMAX1/RMAX2 = 10/100. D. Don’t use any meteorological observations (NOOBS = 2). Table A‐2. Summary of CTEX5 MM5 sensitivity tests. Sensitivity Horizontal Vertical FDDA Test Grid Layers PBL LSM Used 1A_80km 80 km 16 BLKDR 5LAY No FDDA 1B_80km 80 km 16 BLKDR 5LAY Analysis Nudging 1C_80km 80 km 16 BLKDR 5LAY Analysis Nudging Surface Analysis Nudging 2A_36km 2A_12km 108/36/12km 33 MRF 5LAY No FDDA 2B_36km 2B_12km 108/36/12km 33 MRF 5LAY Analysis Nudging 2C_36km 108/36/12km 33 MRF 5LAY Analysis Nudging Surface Analysis Nudging 2F_36km 2G_12km 108/36/12km 43 BLKDR 5LAY No FDDA 2G_36km 2G_12km 108/36/12km 43 BLKDR 5LAY Analysis Nudging 2H_36km 108/36/12km 43 BLKDR 5LAY Analysis Nudging 2H_12km Surface Analysis Nudging 2I_36km 108/36/12km 43 BLKDR 5LAY Analysis Nudging 2I_12km Surface Analysis Nudging FDDA x 2 strength 2J_36km 108/36/12km 43 BLKDR 5LAY Analysis Nudging 2J_12km Surface Analysis Nudging FDDA x 2 strength Observational Nudging 4_36km 108/36/12km 43 PX PX Analysis Nudging 4_12km Surface Analysis Nudging 3
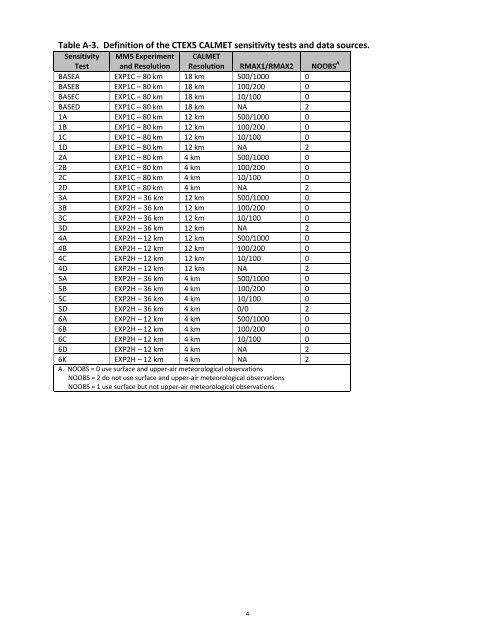
Table A‐3. Definition of the CTEX5 CALMET sensitivity tests and data sources. Sensitivity MM5 Experiment CALMET Test and Resolution Resolution RMAX1/RMAX2 NOOBS A BASEA EXP1C – 80 km 18 km 500/1000 0 BASEB EXP1C – 80 km 18 km 100/200 0 BASEC EXP1C – 80 km 18 km 10/100 0 BASED EXP1C – 80 km 18 km NA 2 1A EXP1C – 80 km 12 km 500/1000 0 1B EXP1C – 80 km 12 km 100/200 0 1C EXP1C – 80 km 12 km 10/100 0 1D EXP1C – 80 km 12 km NA 2 2A EXP1C – 80 km 4 km 500/1000 0 2B EXP1C – 80 km 4 km 100/200 0 2C EXP1C – 80 km 4 km 10/100 0 2D EXP1C – 80 km 4 km NA 2 3A EXP2H – 36 km 12 km 500/1000 0 3B EXP2H – 36 km 12 km 100/200 0 3C EXP2H – 36 km 12 km 10/100 0 3D EXP2H – 36 km 12 km NA 2 4A EXP2H – 12 km 12 km 500/1000 0 4B EXP2H – 12 km 12 km 100/200 0 4C EXP2H – 12 km 12 km 10/100 0 4D EXP2H – 12 km 12 km NA 2 5A EXP2H – 36 km 4 km 500/1000 0 5B EXP2H – 36 km 4 km 100/200 0 5C EXP2H – 36 km 4 km 10/100 0 5D EXP2H – 36 km 4 km 0/0 2 6A EXP2H – 12 km 4 km 500/1000 0 6B EXP2H – 12 km 4 km 100/200 0 6C EXP2H – 12 km 4 km 10/100 0 6D EXP2H – 12 km 4 km NA 2 6K EXP2H – 12 km 4 km NA 2 A. NOOBS = 0 use surface and upper‐air meteorological observations NOOBS = 2 do not use surface and upper‐air meteorological observations NOOBS = 1 use surface but not upper‐air meteorological observations 4
- Page 137 and 138: Figure 6‐2a. Surface synoptic met
- Page 139 and 140: Figure 6‐3a. Distribution of the
- Page 141 and 142: 36 kilometers and the vertical stru
- Page 143 and 144: splitting flag near sunset (hour 17
- Page 145 and 146: experienced during the original ETE
- Page 147 and 148: 2 1 0 ‐1 ‐2 3 2 1 0 23‐Oct 23
- Page 149 and 150: 70% 60% 50% 40% 30% 20% 10% 0% Figu
- Page 151 and 152: Figure 6‐9. Factor of Exceedance
- Page 153 and 154: eceiving a 0.0 score. Figure 6‐13
- Page 155 and 156: Table 6‐1. Summary of model ranki
- Page 157 and 158: plume spread and observed surface c
- Page 159 and 160: Figure 6‐16c. Comparison of spati
- Page 161 and 162: • NoPiG: The tracer emissions wer
- Page 163 and 164: Using the NMSE statistical performa
- Page 165 and 166: 6.4.3.2 Effect of PiG on Model Perf
- Page 167 and 168: 80 70 60 50 40 30 20 10 0 1 2 3 4 5
- Page 169 and 170: Table 6‐3. Summary of CALPUFF puf
- Page 171 and 172: 0.2 0.18 0.16 0.14 0.12 0.1 0.08 0.
- Page 173 and 174: Figure 6‐ ‐22 displays the t sp
- Page 175 and 176: Figure 6‐ ‐23a. Global model pe
- Page 177 and 178: Figure 6‐24. Figure of Merit (FMS
- Page 179 and 180: 7.0 REFERENCES Anderson, B. 2008. T
- Page 181 and 182: EPA, 1984: Interim Procedures for E
- Page 183 and 184: Mlawer, E.J., S.J. Taubman, P.D. Br
- Page 185 and 186: 148 Appendix A Evaluation of the MM
- Page 187: Table A‐1. Wind speed and wind di
- Page 191 and 192: Figure A‐ ‐1. Wind speed bias (
- Page 193 and 194: Figure A‐ ‐3. Humidity bias and
- Page 195 and 196: Table A‐5. Comparison of CTEX5 MM
- Page 197 and 198: B.1 CALMET MODEL EVALUATION TO IDEN
- Page 199 and 200: Figure B‐ ‐1 displays th he win
- Page 201 and 202: Table B‐2a. Summary wind speed mo
- Page 203 and 204: B.2 CONCLUSIONS OF CTEX3 CALMET SEN
- Page 205 and 206: C.1 INTRODUCTION In this section, t
- Page 207 and 208: C.2.2 HYYSPLIT GLOB BAL STATISTIICS
- Page 209 and 210: The final panel in Figure C‐3 (bo
- Page 211 and 212: Figure C‐ ‐5. Global model m pe
- Page 213 and 214: C.3 CAMX SENSITIVITY TESTS Followin
- Page 215 and 216: ACM2 Kzz combinatio ons rank as the
- Page 217 and 218: Figure C‐ ‐10. Spatial model pe
- Page 219 and 220: Figure C‐ ‐12. Global model per
- Page 221 and 222: Figure C‐ ‐13. Spatial model pe
- Page 223 and 224: Figure C‐ ‐15. Global model per
- Page 225 and 226: Figure C‐ ‐17. Global model per
- Page 227 and 228: Table C‐3. CAMx FMS and POD spati
- Page 229 and 230: Figure C‐ ‐20. False Alarm Rate
- Page 231 and 232: Figure C‐ ‐23. Factor of o Exce
- Page 233 and 234: The PCC values for th he six LRT mo
- Page 235 and 236: The RANK statistical performancce m
- Page 237 and 238: Table C‐55. Summary y of model r
Table A‐3. Definition <strong>of</strong> <strong>the</strong> CTEX5 CALMET sensitivity tests <strong>and</strong> data sources.<br />
Sensitivity MM5 Experiment CALMET<br />
Test <strong>and</strong> Resolution Resolution RMAX1/RMAX2 NOOBS A<br />
BASEA EXP1C – 80 km 18 km 500/1000 0<br />
BASEB EXP1C – 80 km 18 km 100/200 0<br />
BASEC EXP1C – 80 km 18 km 10/100 0<br />
BASED EXP1C – 80 km 18 km NA 2<br />
1A EXP1C – 80 km 12 km 500/1000 0<br />
1B EXP1C – 80 km 12 km 100/200 0<br />
1C EXP1C – 80 km 12 km 10/100 0<br />
1D EXP1C – 80 km 12 km NA 2<br />
2A EXP1C – 80 km 4 km 500/1000 0<br />
2B EXP1C – 80 km 4 km 100/200 0<br />
2C EXP1C – 80 km 4 km 10/100 0<br />
2D EXP1C – 80 km 4 km NA 2<br />
3A EXP2H – 36 km 12 km 500/1000 0<br />
3B EXP2H – 36 km 12 km 100/200 0<br />
3C EXP2H – 36 km 12 km 10/100 0<br />
3D EXP2H – 36 km 12 km NA 2<br />
4A EXP2H – 12 km 12 km 500/1000 0<br />
4B EXP2H – 12 km 12 km 100/200 0<br />
4C EXP2H – 12 km 12 km 10/100 0<br />
4D EXP2H – 12 km 12 km NA 2<br />
5A EXP2H – 36 km 4 km 500/1000 0<br />
5B EXP2H – 36 km 4 km 100/200 0<br />
5C EXP2H – 36 km 4 km 10/100 0<br />
5D EXP2H – 36 km 4 km 0/0 2<br />
6A EXP2H – 12 km 4 km 500/1000 0<br />
6B EXP2H – 12 km 4 km 100/200 0<br />
6C EXP2H – 12 km 4 km 10/100 0<br />
6D EXP2H – 12 km 4 km NA 2<br />
6K EXP2H – 12 km 4 km NA 2<br />
A. NOOBS = 0 use surface <strong>and</strong> upper‐air meteorological observations<br />
NOOBS = 2 do not use surface <strong>and</strong> upper‐air meteorological observations<br />
NOOBS = 1 use surface but not upper‐air meteorological observations<br />
4


