

Documentation of the Evaluation of CALPUFF and Other Long ...
Documentation of the Evaluation of CALPUFF and Other Long ...
Documentation of the Evaluation of CALPUFF and Other Long ...

Create successful ePaper yourself
Turn your PDF publications into a flip-book with our unique Google optimized e-Paper software.
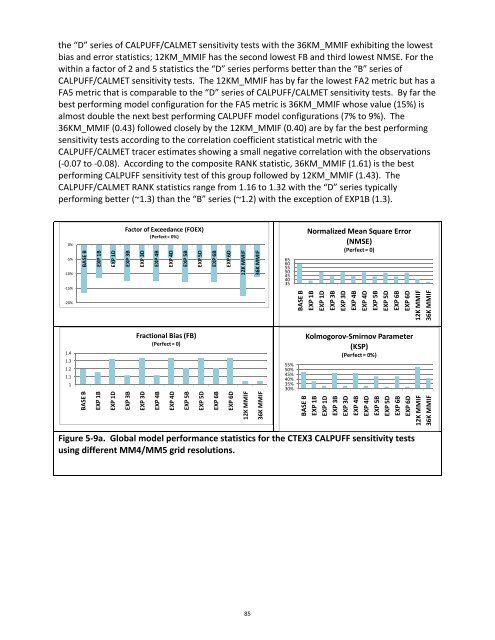
<strong>the</strong> “D” series <strong>of</strong> <strong>CALPUFF</strong>/CALMET sensitivity tests with <strong>the</strong> 36KM_MMIF exhibiting <strong>the</strong> lowest<br />
bias <strong>and</strong> error statistics; 12KM_MMIF has <strong>the</strong> second lowest FB <strong>and</strong> third lowest NMSE. For <strong>the</strong><br />
within a factor <strong>of</strong> 2 <strong>and</strong> 5 statistics <strong>the</strong> “D” series performs better than <strong>the</strong> “B” series <strong>of</strong><br />
<strong>CALPUFF</strong>/CALMET sensitivity tests. The 12KM_MMIF has by far <strong>the</strong> lowest FA2 metric but has a<br />
FA5 metric that is comparable to <strong>the</strong> “D” series <strong>of</strong> <strong>CALPUFF</strong>/CALMET sensitivity tests. By far <strong>the</strong><br />
best performing model configuration for <strong>the</strong> FA5 metric is 36KM_MMIF whose value (15%) is<br />
almost double <strong>the</strong> next best performing <strong>CALPUFF</strong> model configurations (7% to 9%). The<br />
36KM_MMIF (0.43) followed closely by <strong>the</strong> 12KM_MMIF (0.40) are by far <strong>the</strong> best performing<br />
sensitivity tests according to <strong>the</strong> correlation coefficient statistical metric with <strong>the</strong><br />
<strong>CALPUFF</strong>/CALMET tracer estimates showing a small negative correlation with <strong>the</strong> observations<br />
(‐0.07 to ‐0.08). According to <strong>the</strong> composite RANK statistic, 36KM_MMIF (1.61) is <strong>the</strong> best<br />
performing <strong>CALPUFF</strong> sensitivity test <strong>of</strong> this group followed by 12KM_MMIF (1.43). The<br />
<strong>CALPUFF</strong>/CALMET RANK statistics range from 1.16 to 1.32 with <strong>the</strong> “D” series typically<br />
performing better (~1.3) than <strong>the</strong> “B” series (~1.2) with <strong>the</strong> exception <strong>of</strong> EXP1B (1.3).<br />
0%<br />
‐5%<br />
‐10%<br />
‐15%<br />
‐20%<br />
1.4<br />
1.3<br />
1.2<br />
1.1<br />
1<br />
BASE B<br />
BASE B<br />
EXP 1B<br />
EXP 1B<br />
EXP 1D<br />
EXP 1D<br />
Factor <strong>of</strong> Exceedance (FOEX)<br />
(Perfect = 0%)<br />
EXP 3B<br />
EXP 3B<br />
EXP 3D<br />
EXP 4B<br />
EXP 4D<br />
EXP 5B<br />
Fractional Bias (FB)<br />
(Perfect = 0)<br />
EXP 3D<br />
EXP 4B<br />
EXP 4D<br />
EXP 5B<br />
EXP 5D<br />
EXP 5D<br />
EXP 6B<br />
EXP 6B<br />
EXP 6D<br />
EXP 6D<br />
Figure 5‐9a. Global model performance statistics for <strong>the</strong> CTEX3 <strong>CALPUFF</strong> sensitivity tests<br />
using different MM4/MM5 grid resolutions.<br />
12K MMIF<br />
12K MMIF<br />
85<br />
36K MMIF<br />
36K MMIF<br />
65<br />
60<br />
55<br />
50<br />
45<br />
40<br />
35<br />
55%<br />
50%<br />
45%<br />
40%<br />
35%<br />
30%<br />
Normalized Mean Square Error<br />
(NMSE)<br />
(Perfect = 0)<br />
BASE B<br />
EXP 1B<br />
EXP 1D<br />
EXP 3B<br />
EXP 3D<br />
EXP 4B<br />
EXP 4D<br />
EXP 5B<br />
EXP 5D<br />
EXP 6B<br />
EXP 6D<br />
12K MMIF<br />
36K MMIF<br />
Kolmogorov‐Smirnov Parameter<br />
(KSP)<br />
(Perfect = 0%)<br />
BASE B<br />
EXP 1B<br />
EXP 1D<br />
EXP 3B<br />
EXP 3D<br />
EXP 4B<br />
EXP 4D<br />
EXP 5B<br />
EXP 5D<br />
EXP 6B<br />
EXP 6D<br />
12K MMIF<br />
36K MMIF


