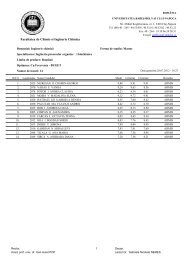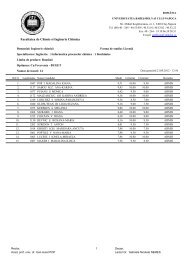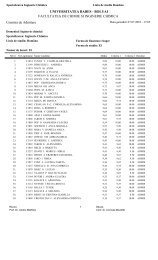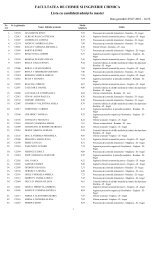
PDF file - Facultatea de Chimie şi Inginerie Chimică
PDF file - Facultatea de Chimie şi Inginerie Chimică
PDF file - Facultatea de Chimie şi Inginerie Chimică

You also want an ePaper? Increase the reach of your titles
YUMPU automatically turns print PDFs into web optimized ePapers that Google loves.
CHEMIA<br />
1/2009
ANUL LIV 2009<br />
S T U D I A<br />
UNIVERSITATIS BABEŞ-BOLYAI<br />
CHEMIA<br />
1<br />
Desktop Editing Office: 51 ST B.P. Has<strong>de</strong>u Street, Cluj-Napoca, Romania, Phone + 40 264-405352<br />
CUPRINS – CONTENT – SOMMAIRE – INHALT<br />
MIRCEA-VASILE CRISTEA, ADINA LUCREŢIA GHIRIŞAN,<br />
Professor Eng. Liviu Literat Phd........................................................... 5<br />
List of Publications ...................................................................................... 9<br />
PETRE T. FRANGOPOL, D. ALLAN CADENHEAD, MARIA TOMOAIA-<br />
COTIŞEL, AURORA MOCANU, Procaine Effects on Surface Topography<br />
of Spread Dipalmitoyl Phosphatidylcholine Monolayers ....................... 23<br />
BARBU RADU HORAŢIU MIŞCA, DORIN MANCIULA, Some Aspects<br />
Regarding Microwave Drying of Materials ............................................ 37<br />
ZOLTÁN TÖRÖK, NICOLAE AJTAI, ALEXANDRU OZUNU, Chemical Risk<br />
Area Estimation as a Tool for Efficient Emergency Planning ................... 49<br />
LÁSZLÓ SZÉLL, VALENTINA CETEAN, TÓTH ANIKÓ, GAGEA LUCIA,<br />
ROMAN CECILIA, ROMAN MARIUS, GOG ADRIANA, Power Plants<br />
Ashes Recovery in Eco-Friendly Mortar Compositions......................... 59
ELIANA JARA-MORANTE, MIHAELA-HILDA MORAR, PAUL ŞERBAN<br />
AGACHI, Heat Integration of an Industrial Fluid Catalytic Cracking Plant.......69<br />
CĂLIN-CRISTIAN CORMOŞ, ŞERBAN PAUL AGACHI, Gasification Process<br />
– A Practical Way for Solid Fossil Fuels Decarbonisation .................... 81<br />
VICTORIA GOIA, ADINA-LUCREŢIA GHIRIŞAN, VASILE-MIRCEA CRISTEA,<br />
Sedimentation Simulation of Coagulated Yeast Suspensions from<br />
Wastewater ......................................................................................................93<br />
CĂLIN IOAN ANGHEL, IOAN LAZĂR, Case Study of Structural Safety Based<br />
on Artificial Intelligence ....................................................................... 103<br />
LAURA ARDELEAN, MARIA GOREA, ELENA CICAL, ANGELA MICHNEA,<br />
Soil and Spring Water Pollution in Two Protected Natural Areas in<br />
Maramureş District.............................................................................. 115<br />
VASILE MIRCEA CRISTEA, RALUCA ROMAN, PAUL ŞERBAN AGACHI,<br />
Simulation of the Reactor-Regenerator-Main Fractionator Fluid Catalytic<br />
Cracking Unit Using Artificial Neural Networks ................................... 125<br />
ANA-MARIA CORMOŞ, FIRUŢA GOGA, JOSEPH GASPAR, DAN IRIDON,<br />
Software Application for Obtaining Ceramic Glazes with Pre-Definite<br />
Composition and Properties................................................................ 133<br />
ANDRA TĂMAŞ, ZENO GROPŞIAN, ROMULUS MINEA, Magnetic Fluids –<br />
Materials with Remarkable Applications ............................................. 143<br />
IOAN BALEA, MARIA TOMOAIA-COTIŞEL, OSSI HOROVITZ, GHEORGHE<br />
TOMOAIA, AURORA MOCANU, The Influence of Solid Surface on the<br />
Adsorption of Anti-C1q Monoclonal Antibody at Isoelectric pH........... 151<br />
DANA SILAGHI-PERJU, HARIETA PÎRLEA, GHEORGHIŢA JINESCU,<br />
GABRIELA-ALINA DUMITREL, DELIA PERJU, NO2 Dispersion Process<br />
Simulation in Urban Areas by Analitical-Experimental Methods ......... 165<br />
ANIELA ELENA VIZITIU, MIRCEA V. DIUDEA, Cluj Polynomial Description<br />
of TiO2 Nanostructures ....................................................................... 173<br />
MIREL GLEVITZKY, DELIA PERJU, GABRIELA-ALINA DUMITREL, MARIA<br />
POPA, MIHAELA LAURA VICĂ, Water Activity – Indicator of Food Safety<br />
and the Factors that Influence the Biochemical Stability of Soft Drinks..... 181<br />
SILVANA IANOŞEV, RADU LAZĂU, MARIANA SUBA, CORNELIA<br />
PĂCURARIU, IOAN LAZĂU, Synthesis and Characterization of Some<br />
Thermoresistant Pigments Based on the Al 3+ → Cr 3+ Substitution...... 189<br />
MIRELA SMARANDOIU, IOAN MAMALIGA, STELIAN PETRESCU, Mass<br />
Transfer in Sublimation Process......................................................... 203<br />
SOARE GHEORGHE, Molecular Dynamics Simulation of the Heat Transfer<br />
by Natural Convection......................................................................... 215
IONUŢ BANU, SORIN BÎLDEA, GRIGORE BOZGA, JEAN-PIERRE<br />
PUAUX, Simulation of a Polymerization Laminar Flow Reactor ......... 227<br />
ALEXIA BONNIFET, DELIA GLIGOR, CASTELIA CRISTEA, LIANA MARIA<br />
MUREŞAN, Electrochemical Behavior and Applications of Phenothiazine<br />
Derivatives Based on Bis-(10h-Phenothiazin-3-Yl)-Methane.............. 243<br />
NICOLAE HAR, MARIA GOREA, MARCEL BENEA, Mineralogy of<br />
Degradation Processes Affecting the Mortar from Buru Dam (Arieşului<br />
Valley, Cluj County) ............................................................................ 253
Studia Universitatis Babes-Bolyai Chemia has been selected for coverage<br />
in Thomson Reuters products and custom information services. Beginning<br />
with V. 53 (1) 2008, this publication will be in<strong>de</strong>xed and abstracted in the<br />
following:<br />
• Science Citation In<strong>de</strong>x Expan<strong>de</strong>d (also known as SciSearch®)<br />
• Chemistry Citation In<strong>de</strong>x®<br />
• Journal Citation Reports/Science Edition
STUDIA UNIVERSITATIS BABES-BOLYAI, CHEMIA, LIV, 1, 2009<br />
PROFESSOR ENG. LIVIU LITERAT PHD<br />
Professor Liviu Literat has been over 58<br />
years in the service of chemistry and chemical<br />
engineering education at two reference Universities<br />
of Cluj-Napoca – the Polytechnic Institute (1953-<br />
1974) and “Babeş-Bolyai” University (1974 -).<br />
He graduated the chemical-physics (1951) in Cluj<br />
at “V. Babeş” University, the chemical engineering<br />
(1961) at Polytechnic Institute of Bucharest and<br />
became PhD in chemistry (1966). He got scientific<br />
research training (post doctoral schooling) in:<br />
Reactions in solid state (1966) – University<br />
Bucharest, Faculty of Chemistry, Department of<br />
physical-chemistry (acad. Ilie Murgulescu);<br />
Magnetic Nuclear Resonance (RMN) in Organic<br />
Chemistry (1967) – Romanian Aca<strong>de</strong>my Bucharest<br />
(acad. Prof. Costin D. NeniŃescu) and UNESCO<br />
international training course in Scientific Research<br />
Management (Balkan Union of Mathematicians),<br />
Bucharest (1977). He also performed training in<br />
aca<strong>de</strong>mic management, such as the Educational Management (1982) training – UBB,<br />
Cluj-Napoca, the Ministry of Education and European Foundation “J. C. Drăgan”<br />
and became coordinator of TEMPUS programs (1991-1996). Professor Literat was<br />
the initiator and organizer of the chemical engineering education in the Cluj-<br />
Napoca University Center by establishing the specializations: the Technology of<br />
Building Materials (1971), Organic and Inorganic Technology (1977) and the Science<br />
and Engineering of Oxi<strong>de</strong> Materials (1990). He was foun<strong>de</strong>r and head of the<br />
Department of Chemical Engineering (1990) and foun<strong>de</strong>r of the Science of Oxi<strong>de</strong><br />
Materials (1992) specialization. He was also the promoter of the post-university<br />
(master) specializations (1994, 1995) and PhD advisor (1991) in chemical engineering<br />
and Science of Oxi<strong>de</strong> Materials. Professor Literat was the Head of the Organic<br />
Chemistry and Technology Department (1977-1985) and of the Chemical Engineering<br />
and Science of Oxi<strong>de</strong> Materials (1992-1995) chair, while he was also PhD supervisor<br />
in chemical engineering. He is author of 15 books (university manuals, treatises,<br />
monographs, history of sciences and education) and of over 130 scientific articles<br />
published in specialized journals in Romania and in foreign countries or in volumes<br />
of some international scientific events. Professor Literat is the author of over 300<br />
scientific communications at national and international Congresses and Symposiums,<br />
of 75 applied research reports (contracts, grants, projects). He was member of the<br />
Commission of the National Council for Inventions of Engineers and Technicians<br />
(CNIT) Cluj (1985-1989). He served as active member of the editorial boards of<br />
Scientific Bulletin of Polytechnic Institute Cluj, Studia Universitatis Babeş-Bolyai,<br />
Seria Chemia and Romanian Journal of Materials (Bucharest). He is member of the<br />
Association of Scientists (AOS) of the Romanian Aca<strong>de</strong>my – Transylvania subsidiary<br />
(1986). He is also founding member (1995), presi<strong>de</strong>nt (1995-2000) and honorary
6<br />
DEDICATED TO PROFESSOR LIVIU LITERAT, AT HIS 80 TH ANNIVERSARY<br />
presi<strong>de</strong>nt (2000) of the Romanian Chemical Engineering Society (SICR) – Cluj branch.<br />
As recognition of his outstanding scientific merits he became honorary member of<br />
the Romanian Aca<strong>de</strong>my of Technical Sciences (2004) and member of the European<br />
Fe<strong>de</strong>ration of Chemical Engineering (1999). He was proposed and accepted to be<br />
honorary citizen of Făgăraş Municipality (2005). Professor Literat is mentioned in<br />
numerous Romanian and foreign biographical compendiums (who’s who) as<br />
scientist, culture and successful man, as teacher and mentor for over 50 series of<br />
graduate chemical, mechanical, civil engineers and university chemists and as<br />
adviser of master and PhD stu<strong>de</strong>nts. This would be, in short, the visiting card of<br />
professor dr. eng. Liviu Literat.<br />
Born on 9 September 1928 in VinŃul <strong>de</strong> Jos, Alba County, professor Liviu<br />
Literat is a <strong>de</strong>scendant of an old (scholar) family promoting knowledge and national<br />
traditions (rustics, priests, teachers, professors) with <strong>de</strong>ep roots in the history of<br />
Făgăraş Country, strongly attached to the culture and national traditions.<br />
Grown up in the cult of work and of the moral precepts respect of honesty,<br />
truth and justice, he always rigorously followed these principles.<br />
High school studies have been performed at Braşov ("Andrei Şaguna"<br />
College), 1939-1945, Făgăraş ("Radu Negru" Lyceum), 1945/46 and Cluj ("Simion<br />
Ştefan" Lyceum), 1946/47, and baccalaureate at "George BariŃiu" Lyceum (1947).<br />
He got a thorough College education at "Victor Babeş" University from Cluj,<br />
Faculty of Chemistry (1947-1951), graduated in chemical-physics (1951) and at<br />
Polytechnic Institute of Bucharest, Faculty of Industrial Chemistry (1961), became a<br />
chemical engineer, specialized in the Technology of Inorganic Substances (1963).<br />
From the professional-scientific training perspective, Professor Liviu Literat<br />
is the product of the Chemistry School of Cluj and of the Chemical Engineering<br />
one, of Bucharest. This synthesis proved beneficial in his activity as member of the<br />
professorial staff and on a larger plan in organizing the chemical engineering<br />
education in Cluj-Napoca, a <strong>de</strong>si<strong>de</strong>ratum for which Professor Liviu Literat has<br />
plea<strong>de</strong>d for and has consistently acted in favor of and with which he has entirely<br />
i<strong>de</strong>ntified himself.<br />
In 1966 he obtained the scientific title of doctor in chemistry (PhD) with an<br />
ample research works in the field of non-stoichiometry of refractory oxi<strong>de</strong>s (a<br />
physical-chemistry study of some reducing alumina) performed un<strong>de</strong>r the guidance<br />
of aca<strong>de</strong>mician Raluca Ripan.<br />
The university career started as soon as his stu<strong>de</strong>nt’s years, as a teaching<br />
assistant, (Department of Mineralogy, "V. Babeş" University) then he ascen<strong>de</strong>d all the<br />
steps of the higher education hierarchy and since 1972 he has become full professor.<br />
Within the Polytechnic Institute (1953-1974) he was the titular of the General<br />
Chemistry, Inorganic and Physical-chemistry, Analytical chemistry and Technical<br />
Analysis, Building Materials and Building materials on polymer compounds disciplines.<br />
At the Babes-Bolyai University he thought disciplines of chemical<br />
engineering including: Operations and Equipments in the Building Material Industry<br />
(1974-1991), Processes and Equipments in the Chemical Technology (1976-1991),<br />
Transfer Phenomena and Equipments in the Chemical Engineering (1980-1993),<br />
Heterogeneous catalysis (1977-1980), Operations and Equipments in the Oxi<strong>de</strong><br />
Materials Industry (1990-1995), Engineering of Interface Processes (1994-2001).
DEDICATED TO PROFESSOR LIVIU LITERAT, AT HIS 80 TH ANNIVERSARY<br />
For these disciplines, he elaborated courses (5) and applications (7),<br />
appreciated for their content, mo<strong>de</strong>rn approach and high level of analysis for the<br />
involved problems. Among these are the book on General Chemistry (1975)<br />
recommen<strong>de</strong>d by the Ministry of Education and EDP House (in 1973) as textbook<br />
for all higher technical education Institutes; Transfer Phenomena and Equipments<br />
in the Chemical Industry; Transport Processes (1985) – where the concept of<br />
Property Transport has been first introduced; Operations and Equipments in the<br />
Oxi<strong>de</strong> Material Industry-Applications (1994) – example of applied theory, or in a<br />
reversed sense, inferred from the experiment and exten<strong>de</strong>d to the <strong>de</strong>sign; Technical<br />
Ceramics; Calculus and Designing Principles (2001) –synthesis of subjects and<br />
problems of theory, technology, research and <strong>de</strong>signing in the ceramics domain.<br />
Besi<strong>de</strong>s the didactic activity, Professor Liviu Literat has carried out a<br />
sustained and varied scientific activity in the fields of physical-chemistry,<br />
chemical engineering and materials science.<br />
His formation as engineer and chemist offered to professor Literat the<br />
possibility to perform fundamental and applied research in the field of the materials<br />
science and chemical engineering, both consi<strong>de</strong>red as based on physical and<br />
chemical processes or phenomena.<br />
Interested on the problems specific to each of these fields, Professor Liviu<br />
Literat and the school set up around him, have <strong>de</strong>veloped studies, with priority, in<br />
the competition area of these domains, situated at the bor<strong>de</strong>r between the<br />
materials science and process engineering, at the interface between the<br />
“phenomenological” and “structural” aspects.<br />
In the Materials Science domain, Professor Literat has essentials contributions<br />
to the discovery and research of a new class of refractory oxi<strong>de</strong>s (alumina) with <strong>de</strong>viation<br />
from stoichiometry, in the synthesis and characterization of some oxi<strong>de</strong>-nano-systems<br />
and materials with pre-set <strong>de</strong>stination aim, properties and characteristics (oxi<strong>de</strong><br />
refractory, metallic and composite matters with controlled porosity, ceramic membranes,<br />
catalysts, selective adsorbents, pow<strong>de</strong>rs and sintered matters).<br />
As concerns the alumina non-stoichiometry (reducing alumina with oxygen<br />
<strong>de</strong>ficit, paramagnetic properties, n-type semiconductor behaviour and catalytic activity in<br />
electron-change processes), the PhD thesis (1964) and the publications on this subject,<br />
had a particular interests and were favorable commented in literature (reviewed by<br />
Chemical Abstract, Referativnîi Zhurnal), professor Literat being consi<strong>de</strong>red as pioneer<br />
in this field that, later, will be called nano materials compounds and also, in the non<br />
conventional synthesis methods (organic-inorganic precursors, in special conditions).<br />
He has <strong>de</strong>veloped a new technique of punctual quantitative chemical<br />
analysis of the oxi<strong>de</strong> and composite micro-phases systems using the methods of<br />
the electronic microscopy (electron microprobe). A non-conventional granular<br />
analysis method of analogy based on physical metallurgy (Epiquant) has been<br />
<strong>de</strong>veloped, by which the dimension, shape, volume, specific surface and the<br />
distribution function of the pow<strong>de</strong>rs size fractions are estimated automatically.<br />
In the field of chemical engineering, professor Literat’s interests are<br />
connected to the concept of property transport and transfer phenomena, to the<br />
dimensional analysis applied to the phenomenological study of the interface<br />
processes (sorbtion, catalysis, extraction), to separation processes, to thermodynamics<br />
7
8<br />
DEDICATED TO PROFESSOR LIVIU LITERAT, AT HIS 80 TH ANNIVERSARY<br />
and kinetics in solid state reactions and catalysis, to mo<strong>de</strong>ling and simulation, to<br />
scale up and <strong>de</strong>sign of the research equipments and industrial installations.<br />
In the transfer theory, he has <strong>de</strong>termined (12) new similitu<strong>de</strong> criteria and<br />
criterion equations for stationary and transitory conductive-convective processes<br />
with electric load carriers.<br />
In the field of the separations processes, he has <strong>de</strong>veloped a graphanalytical<br />
procedure for the discrimination of the movement of dispersed particles<br />
in the sedimentation process, has established some news recurrence equations<br />
and nomographic charts between the sedimentation speed and the size of particles.<br />
As well, he has drawn up an experimental computerized method and technique for<br />
recording of settling curves and of the size distribution functions. In the separation<br />
of the fluid micro-dispersions by filtering, there were also studied the phenomenology<br />
of the micro and ultra filtering processes, and the separation techniques.<br />
He brought original contributions at the gas-solid sorption processes such<br />
as theory, experiment, apparatus, computation programs and applications in gas<br />
separations and to the porous solids and pow<strong>de</strong>rs characterization.<br />
In professor’s Liviu Literat activity as a whole, an important part is<br />
played by his constant interest and concern for the <strong>de</strong>velopment of the technical<br />
higher education in Cluj-Napoca, in general, and especially for the chemical<br />
engineering. For this <strong>de</strong>si<strong>de</strong>rate he <strong>de</strong>veloped a prodigious didactic and scientific –<br />
theoretical, applicative and managerial activity, with special effects.<br />
The name of the professor Liviu Literat has been inseparably linked with<br />
the actions and initiatives of setting up, <strong>de</strong>velopments and advances of the chemical<br />
engineering education in Cluj-Napoca University Center for over four <strong>de</strong>ca<strong>de</strong>s,<br />
being consi<strong>de</strong>red one of the foun<strong>de</strong>r of the fourth Romanian Chemical Engineering<br />
School (1971) after Ia<strong>şi</strong> (1937), Bucharest (1938) and Timişoara (1948).<br />
Therefore, Professor Liviu Literat does not belong only to the Babeş-Bolyai<br />
University and Polytechnic Institute of Cluj, he is a prominent personality of the<br />
Romanian School of Chemical Engineering and of the Oxi<strong>de</strong> Material Science, as<br />
he is, in these domains, a foun<strong>de</strong>r of school, and representative of the higher education,<br />
consi<strong>de</strong>red as a whole. In the same time, professor Liviu Literat is a personality of<br />
high morality, with a grand spirit and a great availability, always involved in the<br />
activities that he put love all along his life. Professor Liviu Literat has always been<br />
a dynamic, active and <strong>de</strong>dicated person; he has presented to the higher education<br />
with everything he has to give, with responsibility and competence.<br />
At the age of 80, Professor Liviu LITERAT is an active person in the<br />
aca<strong>de</strong>mic life as he still has many projects to work on. The group of his former and<br />
present colleagues and co-workers from the Faculty of Chemistry and Chemical<br />
Engineering addresses to Professor Literat the best wishes for a long life, full with<br />
further achievements.<br />
Volume Editors,<br />
Mircea-Vasile Cristea<br />
Adina LucreŃia Ghirişan
DEDICATED TO PROFESSOR LIVIU LITERAT, AT HIS 80 TH ANNIVERSARY<br />
LIST OF PUBLICATIONS<br />
BOOKS<br />
A. Scientific and Technical books<br />
1. Liviu Literat, Lucia Gagea, FiruŃa Goga, Eugenia Mirică, Ecaterina Olariu, Ceramică<br />
tehnică. Principii <strong>de</strong> calcul <strong>şi</strong> proiectare, Ed. Casa CărŃii <strong>de</strong> ŞtiinŃă, Cluj-Napoca,<br />
ISBN 973-686-194-5, 334 pag., 2001<br />
2. Liviu Literat, ÎnvăŃământul <strong>şi</strong> cercetarea în chimie în perioada postbelică. Istoria<br />
României, Transilvania-vol II, cap V, Ed. FundaŃiei "George BariŃiu", Cluj-Napoca,<br />
ISBN 973-97902-0-8, p. 1167-1162, 1999<br />
3. Liviu Literat, OperaŃii <strong>şi</strong> utilaje în industria materialelor oxidice, Ed. UniversităŃii<br />
Babeş-Bolyai, Cluj-Napoca, 425 pag., 1995<br />
4. Liviu Literat, Fenomene <strong>de</strong> transfer <strong>şi</strong> utilaje în industria chimică. Procese <strong>de</strong><br />
transport, Ed. UniversităŃii Babeş-Bolyai, Cluj-Napoca, 177 pag., 1985<br />
5. Liviu Literat, <strong>Chimie</strong> generală, Ed. Didactica <strong>şi</strong> Pedagogică, Bucureşti, 412 pag., 1975<br />
6. Liviu Literat, Studiu fizico-chimic asupra unor alumine reducătoare nestoechiometrice.<br />
Teza <strong>de</strong> doctorat, Univ. Babeş-Bolyai, Cluj-Napoca, 1964<br />
B. University Text Books<br />
1. Liviu Literat, OperaŃii <strong>şi</strong> utilaje in industria materialelor oxidice, Ed. UniversităŃii<br />
Babeş-Bolyai, Cluj-Napoca, vol. I, 297 pag., vol II, 129 pag., 1995<br />
2. Liviu Literat, OperaŃii <strong>şi</strong> utilaje in industria materialelor oxidice. AplicaŃii, Ed.<br />
UniversităŃii Babeş-Bolyai, Cluj-Napoca, 207 pag., 1994<br />
3. L. Literat, R. Mişca, A. Ozunu, S. Drăgan, Fenomene <strong>de</strong> transfer <strong>şi</strong> utilaje în<br />
industria chimică, Ed. UniversităŃii Babeş-Bolyai, Cluj-Napoca, 110 pag., 1993<br />
4. L. Literat, R. Mişca, A. Ghirişan, Fenomene <strong>de</strong> transfer <strong>şi</strong> utilaje in industria chimică.<br />
Îndrumar <strong>de</strong> lucrări practice, Ed. UniversităŃii Babeş-Bolyai, Cluj-Napoca, 107 pag., 1991<br />
5. T. Bereczky, L. Literat, Lucrări practice <strong>de</strong> chimie generală, Ed. Institutului Politehnic<br />
din Cluj-Napoca, 110 pag., 1970<br />
6. Liviu Literat, <strong>Chimie</strong> generală, Ed. Institutului Politehnic din Cluj-Napoca, 375<br />
pag., 1966<br />
9
DEDICATED TO PROFESSOR LIVIU LITERAT, AT HIS 80 TH ANNIVERSARY<br />
7. T. Bereczky, L. Literat, E. Felszeghy, <strong>Chimie</strong> generală. Lucrări practice, Ed. Institutului<br />
Politehnic din Cluj-Napoca, 97 pag., 1958<br />
8. T. Bereczky, A. Iacob, L. Literat, <strong>Chimie</strong> Generală (note <strong>de</strong> curs). Litografia<br />
ÎnvăŃământului Cluj, 400 pag., 1955<br />
C. Miscellaneea (Books, chapters and articles on various subjects in books<br />
and volumes, monographs)<br />
1. Liviu Literat, ÎnvăŃământul tehnic superior la Universitatea Daciei Superioare în<br />
concepŃia profesorului Vasile Parvan, Lucrările celei <strong>de</strong> a 3-a ConferinŃe NaŃionale<br />
a Aca<strong>de</strong>miei <strong>de</strong> ŞtiinŃe Tehnice din România (ASTR), Ed. MEDIAMIRA Cluj-Napoca,<br />
Editori: R. Munteanu <strong>şi</strong> D. Banabic, ISBN 978-973-713-223-9, p. 171-176, 2008<br />
2. Liviu Literat, La zi aniversară în Universitatea POLITEHNICA Bucureşti "Catedra<br />
<strong>de</strong> ŞtiinŃa <strong>şi</strong> Ingineria Materialelor Oxidice <strong>şi</strong> Nanomateriale la 60 <strong>de</strong> ani", Ed.<br />
POLITEHNICA Press, 2008<br />
3. D. Forna<strong>de</strong>, PersonalităŃi clujene (1800-2007). DicŃionar ilustrat. 678 pag. Ed. Casa<br />
CărŃii <strong>de</strong> ŞtiinŃă, Cluj-Napoca, ISBN 98-973-133-101-0, (L. Literat colaborator), 2007<br />
4. Liviu Literat, Alexandra Rus, Virgil Fulicea – Întoarcere în timp, Ed. Casa CărŃii<br />
<strong>de</strong> ŞtiinŃă, Cluj-Napoca, ISBN 978-973-133165-7, 115 pag., 2007<br />
5. Liviu Literat, Şcoala clujeană <strong>de</strong> inginerie chimică la a 35-a aniversare.<br />
Simpozionul NaŃional <strong>de</strong> <strong>Inginerie</strong> chimică. LUCRĂRI ŞTIINłIFICE, Ed. ACCENT,<br />
Cluj-Napoca, ISBN (13) 978-973-8915-18-3 (autor <strong>şi</strong> editor), 118 pag., 2006<br />
6. Liviu Literat, RezonanŃe ale personalităŃii profesorului Şerban Solacolu în<br />
învăŃământul superior clujean, Aca<strong>de</strong>mia <strong>de</strong> ŞtiinŃe Tehnice din România (colectiv<br />
<strong>de</strong> autori). Ed. AGIR, Bucureşti, p. 43-47, 2005<br />
7. Valeriu Literat, AMINTIRI. Ed. Casa CărŃii <strong>de</strong> ŞtiinŃă, Cluj-Napoca, ISBN 973-<br />
686-719-6. (L. Literat, editor), 177 pag., 2005<br />
8. Liviu Literat, A hault on the centenary of an illustrious scientist and school<br />
foun<strong>de</strong>r, Romanian Journal of Materials, Bucureşti, vol. 35, nr. 3, p. 186-188, 2005<br />
9. Liviu Literat, Professor Emilian A. Bratu centenary, Romanian Journal of Materials,<br />
vol. 35, nr. 1, p. 84-86, 2005<br />
10. Liviu Literat, ÎnvăŃământul românesc <strong>de</strong> inginerie chimică ctitorie a profesorului<br />
Emilian A. Bratu, Sesiune omagială "Centenar E. A. Bratu" Bucureşti, p. 20-22, 2004<br />
11. Liviu Literat, La centenarul profesorului Emilian A. Bratu. Sesiune omagială<br />
"Centenar Emilian A. Bratu", ASTR Bucureşti, p. 23-30, 2004<br />
10
DEDICATED TO PROFESSOR LIVIU LITERAT, AT HIS 80 TH ANNIVERSARY<br />
12. Liviu Literat, Homage Paid to associate Professor dr. ing. Lucia Gagea. Romanian<br />
Journal of Materials, Bucharest, vol. 34, nr. 2, p. 150-152, 2004<br />
13. Liviu Literat, The Chemical Engineering School of Cluj at the 30-th Anniversary,<br />
Studia Univ. Babeş-Bolyai, Chemia, vol. XLVI, nr. 1-2, p. 3-4, 2001<br />
14. Liviu Literat, The Chemical Engineering Education at Cluj-Napoca in Data and<br />
Achive Documents, CD-ROM, Ed. ACCENT, Cluj-Napoca, ISBN 973-99821-8-2<br />
Symposium "30-th years of Chemical Engineering Education at Cluj-Napoca", 2001<br />
15. Liviu Literat, Becoming steps. Three Quarters Century of Romanian Chemical<br />
Education at the Alma Mater Napocensis, Journal of Building Materials, vol. 26, nr. 2,<br />
p. 160-170, 1995<br />
16. Liviu Literat, 75 <strong>de</strong> ani <strong>de</strong> învăŃământ chimic românesc la Alma Mater Napocensis,<br />
Rev. Chim., vol. 45, nr. 7, p. 542, 1994<br />
17. Liviu Literat, 20 <strong>de</strong> ani <strong>de</strong> învăŃământ <strong>de</strong> <strong>Inginerie</strong> <strong>Chimică</strong> la Cluj-Napoca,<br />
Studia Univ. Babeş-Bolyai, Chemia, vol. XXXVI, nr. 1-2, p. 59-60, 1991<br />
18. Liviu Literat (autor <strong>şi</strong> editor), Breviar Monografic (1971-1991). <strong>Facultatea</strong> <strong>de</strong><br />
<strong>Chimie</strong> <strong>şi</strong> <strong>Chimie</strong> Industrială. "Din istoricul învăŃământului <strong>de</strong> inginerie chimică la<br />
Cluj-Napoca", Ed. UniversităŃii Babeş-Bolyai, Cluj-Napoca, p. 14-92, 1991<br />
SCIENTIFIC PUBLICATIONS. ARTICLES<br />
1. L. Literat, Mo<strong>de</strong>lling of some processes with mass variation. Applications to the<br />
separation, classification and characterization of ceramic microdispersions through<br />
sedimentation, Romanian Journal of Materials, Bucharest, vol. 38, nr. 4, p. 321-330, 2008<br />
2. L. Szell, L. Literat, A. Toth, L. Gagea, PigmenŃi ceramici purpurii cu structură tip<br />
fluorină, Simpozion NaŃional <strong>de</strong> <strong>Inginerie</strong> <strong>Chimică</strong>, Cluj-Napoca, Ed. ACCENT,<br />
Cluj-Napoca, ISBN (13)- 978-973-8915-18-3, p. 63-66, 2006<br />
3. A. Orban, L. Literat, Consi<strong>de</strong>raŃii privind presarea axială a pulberilor ceramice,<br />
Simpozion NaŃional <strong>de</strong> <strong>Inginerie</strong> <strong>Chimică</strong>, Cluj-Napoca, Ed. ACCENT, p. 67-71, 2006<br />
4. C. Voica, L. Gagea, L. Literat, Glazuri ceramice cu efecte speciale pentru porŃelan<br />
fosfatic, Simpozion NaŃional <strong>de</strong> <strong>Inginerie</strong> <strong>Chimică</strong>, Cluj-Napoca, Ed. ACCENT, p.<br />
78-84, 2006<br />
5. F. Goga, L. Literat, C. Suciu, Glasses in the SiO2-B2O3-Bi2O3 system, Reliability<br />
of Ceramics ECERS, Polish Ceramic Society, Cracow, (P.E 01), 2006<br />
6. F. Goga, L. Literat, M. Gorea, C. Suciu, Immiscibility in the SiO2-B2O3-Bi2O3<br />
system, The 32-th Conference SSCHE, Tatranske Matliare (SK), Proceedings CD-<br />
ROM, p. 241-246, 2005<br />
11
12<br />
DEDICATED TO PROFESSOR LIVIU LITERAT, AT HIS 80 TH ANNIVERSARY<br />
7. F. Goga, L. Literat, C. Suciu, M. Mocean, PbO free frits for ceramic colorants, Romanian<br />
International Conference on Chemistry and Chemical Engineering RICCCE XIV, Science<br />
and Engineering of Oxi<strong>de</strong> Materials, Proceedings vol. 1, p. S08-71-78, 2005<br />
8. F. Goga, L. Literat, M. Gorea, C. Suciu, The immiscibility in the SiO2-B2O3-Bi2O3<br />
system, Romanian International Conference on Chemistry and Chemical Engineering<br />
RICCCE XIV, Proceedings vol. 1, p. S08-202-210, 2005<br />
9. A. Toth, C. Dardai, L. Szell, L. Gagea, L. Literat, Structure of thin porous layers<br />
obtained from reactive pow<strong>de</strong>rs, Romanian Journal of Materials, vol. 34, nr. 2, p.<br />
90-98, 2004<br />
10. A. Toth, L. Literat, R. Mişca, V. Dumbraveanu, C. Neagu, Asimetrical membranes<br />
with application for wine clearing and stabilizing, Romanian Journal of Materials,<br />
vol. 34, nr. 3, p. 196-205, 2004<br />
11. L. Szell, L. Literat, L. Gagea, Cr. Dardai, A. Toth, Study on the synthesis and<br />
properties of the ceramic pigments in the CeO2-PrO2 system, Romanian Journal of<br />
Materials, vol. 34, nr. 3, p. 183-189, 2004<br />
12. A. Orban, M. Turos, L. Literat, Consi<strong>de</strong>rations about the axial pressing<br />
moulding method for grinding parts, Romanian Journal of Materials, vol. 34, nr. 4,<br />
p. 183-189, 2004<br />
13. A. Toth, L. Literat, R. Mişca, R. Dumbraveanu, C. Neagu, Asymetric ceramic<br />
membranes with application in wine clarification and stabilisation, CONSILOX IX,<br />
Ceramics, Sighişoara, p. 185-196, 2004<br />
14. L. Szell, Cr. Dardai, A.Toth, L. Literat, L. Gagea, Stady on the synthesis and<br />
properties of the ceramic pigments in the CeO2-PrO2 system, CONSILOX IX,<br />
Ceramics, Sighişoara, p. 89-94, 2004<br />
15. L. Literat, A. Orban, A study of the behaviour of some superaluminous pow<strong>de</strong>rs at<br />
the shaping by isostatic and axial pressing, CONSILOX IX, Ceramics, Sighişoara,<br />
p. 159-170, 2004<br />
16. A. Orban, L. Literat, M. Turos, Grinding parts shaped by axial pressing, CONSILOX<br />
IX, Ceramics, Sighişoara, p. 171-184, 2004<br />
17. A. Toth, L. Literat, R. Mişca, Hydraulic strenght of the oxi<strong>de</strong> membranes and<br />
gel layer, at convective transport of the aqueous dispersions, Romanian Journal of<br />
Materials, vol. 33, nr. 3, p. 234-241, 2003<br />
18. L. Literat, A. Orban, The behaviour of some superaluminous ceramic pow<strong>de</strong>rs<br />
atomised in the process of isostatic pressing, Romanian Journal of Materials, vol.<br />
33, nr. 4, p. 270-277, 2003
DEDICATED TO PROFESSOR LIVIU LITERAT, AT HIS 80 TH ANNIVERSARY<br />
19. A. Toth, R. Mişca, L. Gagea, A. Ozunu, L. Literat, Cross-flow separation of some<br />
heterogeneous systems through filtering on ceramic membranes, The 29-th<br />
Conference SSCHE, Tatranske Matliare (Sk) CD-ROM, p. 27-31, 2002<br />
20. L. Literat, L. C. Bodizs, The influence of humidity on the rheological behaviour<br />
of ceramic pow<strong>de</strong>rs in the pressing process, Romanian Journal of Materials, vol.<br />
32, nr.1, p. 54-59, 2002<br />
21. L. Literat, Recording <strong>de</strong>vice and exploring procedure of the settling curves.<br />
Applications to the Symptotic classifying of pow<strong>de</strong>ry systems, Studia Univ. Babeş-<br />
Bolyai, Chemia, vol. XLVI, nr. 1-2, p. 5-10, 2001<br />
22. A. Toth, L. Literat, L. Gagea, Pore structure stability of alumina bazed<br />
membranes, Studia Univ. Babeş-Bolyai, Chemia, vol. XLVI, nr. 1-2, p. 11-16, 2001<br />
23. L. Literat, Procedure of computerized recording of the settling curves.<br />
Application at the symptotic classifying of pow<strong>de</strong>ry systems, "30 years of Chemical<br />
Engineering Education at Cluj-Napoca", Ed.ACCENT Cluj-Napoca, CD ROM, 2001<br />
24. A. Toth, L. Literat, L. Gagea, Pore structure stability of alumina based membrane,<br />
"30 years of Chemical Engineering Education at Cluj-Napoca", Ed. ACCENT Cluj-<br />
Napoca, CD ROM, ISBN-973-99821-8-2, 2001<br />
25. L. Literat, Consi<strong>de</strong>rations on some mathematics mo<strong>de</strong>ls with application to the<br />
press-forming of ceramic pow<strong>de</strong>rs, Ed. ACCENT Cluj-Napoca, CD ROM, 2001<br />
26. A. Toth, I. Kotsis, K. Belofine-Bako, L. Literat, L. Gagea, Oxi<strong>de</strong> membranes with<br />
selective layer organic-mineral, CONSILOX VIII, Alba-Iulia, vol. 1, p. 203-208, 2000<br />
27. L. Literat, A. Ghirişan, The rheological behaviour of some silicate sol-gel systems,<br />
CONSILOX VIII, Alba-Iulia, vol. 1, p. 20-26, 2000<br />
28. L. Literat, M. Cristea, L. Gagea, C. Pavel-Voica, Shaping by pressing of some<br />
ceramic pow<strong>de</strong>rs. Diagrams and computing equations, CONSILOX VIII, Alba-Iulia,<br />
vol. 1, p. 290-295, 2000<br />
29. C. Vasile, L. Literat, L. Gagea, L. Szell, Ceramic mass with ZrO2 content and<br />
thermo-mechanics properties, CONSILOX VIII, Alba-Iulia, vol. 1, p. 27-32, 2000<br />
30. L. Literat, A. Toth, M. Lascu, L. Gagea, Application of the ceramic membranes<br />
on the selective separation processes, Papers of the 2-nd International Symposium<br />
on Chemical Engineering Bucharest, SICHEM 2000, p. 49-56, 2000<br />
31. L. Literat, A. Toth, M. Lascu, L. Gagea, Application of the ceramic membranes<br />
on the selective separation processes. Papers of the 2-nd International Symposium<br />
on Chemical Engineering Bucharest, SICHEM 2000, p. 49-56, 2000<br />
13
DEDICATED TO PROFESSOR LIVIU LITERAT, AT HIS 80 TH ANNIVERSARY<br />
32. L. Literat, I. Mureşan, P. Mureşan, Automatic <strong>de</strong>termination of vapors adsorption<br />
isotherms on porous solids, Acta Technica Napocensis Section Constr. Machines<br />
and Materials, vol. 2, p. 139-146, 1999<br />
33. A. Ozunu, L. Literat, L. Ghergari, L. Gagea, Kinetic mo<strong>de</strong>ls for gypsum <strong>de</strong>hydration,<br />
Journal of Building Materials, vol. 28, nr. 1, 1999<br />
34. C. Pavel, L. Gagea, L. Literat, Glazuri mate pentru porŃelan fosfatic, Analele Univ.<br />
Ora<strong>de</strong>a, <strong>Chimie</strong>, p. 11-19, 1999<br />
35. F. Goga, L. Gagea, L. Literat, M. Moceanu, Matrici vitoase cu fusibilitate ridicată,<br />
Analele Univ. Ora<strong>de</strong>a, <strong>Chimie</strong>, p. 39-45, 1999<br />
36. A. Ghirişan, L. Literat, Rheologic evolution of some sol-gel systems, International<br />
Conference on Chemistry and Chemical Engineering, POLITECHNICA University<br />
Bucharest, CD-ROM, p. 203-208, 1999<br />
37. A. Ozunu, L. Literat, R. Mişca, Investigation of Gypsum Dehydration, The 1-st<br />
International Conference of the Chemical Societies of the South-East European<br />
Countries. Chemical Sciences and Industry, Greece, vol. 1, p. 103-105, 1998<br />
38. A. Ozunu, L. Literat, R. Mişca, The materials moving in the drum rotary<br />
equipments. The influence of operational variables on the hold-up time distribution,<br />
Journal of Building Materials, vol.3, p. 197-203, 1998<br />
39. L. Literat, F. Bele, L. Gagea, E. Koncz, Frite ceramice fusibile fără conŃinut <strong>de</strong><br />
metale toxice, Analele Univ. Ora<strong>de</strong>a, <strong>Chimie</strong>, p. 113-119, 1998<br />
40. R. Mişca, L. Literat, A. Ozunu, Appreciation of the rate <strong>de</strong>terminant stage at<br />
non stationary extraction from porous medium through the general dimensional<br />
analysis, Chem. Bull. „Politechnica” Univ. Timişoara, vol. 43(57), p. 321-325, 1998<br />
41. R. Mişca, L. Literat, A. Ozunu, Heat transfer in non steady state in liquid<br />
medium, Chem. Bull. „Politechnica” Univ. Timişoara, vol. 43(57), p. 326-332, 1998<br />
42. A. Ozunu, L. Literat, R. Mişca, S. Drăgan, Parametric investigation of gypsum<br />
<strong>de</strong>hydration in a rotary drum reactor. Conference on Materials and Manufacturing<br />
Technologies (II), MACHTEHN ’98, Polytechnic University Cluj-Napoca, p. 215-220, 1998<br />
43. R. Mişca, L. Literat, A. Ozunu, S. Drăgan, General dimensional analysis<br />
applied to the unsteady dissolution of pure solids, Papers of the 1-st International<br />
Chemical Engineering Symposium SICHEM. ’98, Bucharest, p. 134-141, 1998<br />
44. R. Mişca, L. Literat, A. Ozunu, S. Drăgan, General dimensional analysis applied<br />
to the unsteady extraction from porous solid medium un<strong>de</strong>r the ultra sound action,<br />
Papers of the 1-st International Chemical Engineering Symposium SICHEM ’98,<br />
Bucharest, p. 178-183, 1998<br />
14
DEDICATED TO PROFESSOR LIVIU LITERAT, AT HIS 80 TH ANNIVERSARY<br />
45. A. Ozunu, L. Literat, R. Mişca, S. Drăgan, Scale-up of the rotary drum reactors.<br />
Applications to the non catalytic gas-solid processes <strong>de</strong>volving at low temperatures,<br />
Papers of the 1-st International Chemical Engineering Symposium SICHEM ’98,<br />
Bucharest, p. 192-201, 1998<br />
46. A. Ozunu, L. Literat, R. Mişca, S. Drăgan, Comparative study on the macro kinetic<br />
and mathematics mo<strong>de</strong>ling of the sodium bicarbonate thermal <strong>de</strong>composition and<br />
of the natural gypsum <strong>de</strong>hydration, Papers of the 1-st International Chemical<br />
Engineering Symposium SICHEM ’98, Bucharest, p. 202-211, 1998<br />
47. L. Literat, A. Toth, L. Gagea, A. Sintoma, Structural and functional characteristics<br />
of some micro filtering oxi<strong>de</strong> membranes, Papers of the 1-st International Chemical<br />
Engineering Symposium SICHEM ’98, Bucharest, p. 394-401, 1998<br />
48. L. Literat, C. Voica, L. Gagea, Study on the crystallization process in matte<br />
glazes for the phosphate porcelain, STICLOCERAM ’98, Technical University Cluj-<br />
Napoca, p. 112-116, 1998<br />
49. A. Ozunu, R. Mişca, L. Literat, Parametric investigation of sodium bicarbonate<br />
<strong>de</strong>composition in a rotary drum reactor, Studia Univ. Babeş-Bolyai, Chemia, vol.<br />
XLII, nr. 2, p. 255-262, 1997<br />
50. A. Ozunu, R. Mişca, L. Literat, Experimental aspects on the thermal <strong>de</strong>composition<br />
of sodium bicarbonate in a rotary drum reactor, National Conference of Chemistry and<br />
Chemical Engineering, Politechnica University Bucharest, vol. 1, pag. 540-545, 1997<br />
51. A. Ozunu, L. Literat, R. Mişca, M. Ozunu, Pulverous materials motion in the<br />
rotary drum equipments, National Conference of Chemistry and Chemical Engineering,<br />
Politechnica University Bucharest, vol. 1, p. 583-588, 1997<br />
52. R. Mişca, A. Ghirişan, L. Literat, A. Ozunu, S. Drăgan, The kinetic of solid-liquid<br />
extraction. Hypophae fructus oil, Studia Univ. Babeş-Bolyai, Chemia, vol. XLI, nr. 1, p.<br />
55-60, 1996<br />
53. L. Literat, L. Gagea, E. Mirică, J. łipan, Alternative proceeding for granulometric<br />
analysis of pow<strong>de</strong>ry dispersions, Journal of Building Materials, vol. 24, nr. 2, p.<br />
132-137, 1995<br />
54. T. Klainhempel, F. Atanasiu, L. Literat, Dimensionarea tehnologică a instalaŃiilor<br />
PSA. Mo<strong>de</strong>l <strong>de</strong> echilibru pentru dimensionarea coloanelor PSA, Rev. Chim, vol. 46,<br />
nr. 8, p. 756-764, 1995<br />
55. L. Literat, A. Ozunu, R. Mişca, A. Ghirişan, Discrimination method for<br />
sedimentation regimes with application in the symptotyc classification, Proceedings<br />
Aca<strong>de</strong>mic Days Timişoara, Section Chemical Sciences, vol. 2, p. 27-30, 1995<br />
15
DEDICATED TO PROFESSOR LIVIU LITERAT, AT HIS 80 TH ANNIVERSARY<br />
56. A. Ozunu, L. Literat, Consi<strong>de</strong>rations about fluid catalytic cracking. Mo<strong>de</strong>ling<br />
and control, Selected topics on Chemical Reaction Engineering, Bratislava, Slovakia,<br />
p. 202, 1994<br />
57. R. Mişca, L. Literat, Hypophae fructus oil separation, Selected topics on<br />
Chemical Reaction Engineering, Bratislava, Slovakia, p. 203, 1994<br />
58. L. Literat, Corelări privind regimul, viteza <strong>şi</strong> dimensiunile particulelor în analiza<br />
sedimentometrică, Rev. Chim., vol. 45, nr. 10, p. 921-922, 1994<br />
59. L. Literat, E. Mirica, L. Gagea, F. Bele, ProprietăŃile filmelor subŃiri <strong>de</strong> titanat <strong>de</strong><br />
bariu obŃinute prin metoda sol-gel, Simpozionul <strong>de</strong> ŞtiinŃe Mo<strong>de</strong>rne <strong>şi</strong> Energie,<br />
Universitatea Tehnică Cluj-Napoca, p. 39-41, 1993<br />
60. L. Literat, Korindonische unterlagen fur maleische Anhydrid Katalyzatoren,<br />
Studia Univ. Babeş-Bolyai, Chemia, vol. XXXVII, nr. 1, p. 99-104, 1992<br />
61. L. Literat, RelaŃii criteriale privind transportul difuziv-convectiv în procese<br />
staŃionare <strong>şi</strong> nestaŃionare, Comunicări ştiinŃifice, Aparate <strong>şi</strong> automatizări în industria<br />
chimică, Timişoara, vol. II, p. 5-12, 1991<br />
62. L. Literat, Neue kriterielle Abfassungen im stationaren konvektiv-molekularen<br />
Eigenschafts Transport, Studia Univ. Babeş-Bolyai, Chemia, vol. XXXV, nr.2, p.<br />
51-54, 1990<br />
63. L. Literat, Uber einige kriterielle Beziehungen in nichtstationaren konductivkonvektiven<br />
Eigenschafts transport, Studia Univ. Babeş-Bolyai, Chemia, vol.<br />
XXXV, nr. 1, p. 99-103, 1990<br />
64. L. Literat, Electro-corindonul poros, suport pentru catalizatori, Revista Materiale<br />
<strong>de</strong> ConstrucŃii, vol.19, nr. 4, p. 246-249, 1989<br />
65. L. Literat, D. Vasilescu, Suporturi catalitice pentru anhidrida ftalică, Revista<br />
Materiale <strong>de</strong> ConstrucŃii, vol.18, nr. 3, p. 204-207, 1988<br />
66. N. Alma<strong>şi</strong>, J. Mureşan, L. Literat, E. Cîmpan, F. Kakso, C. Viragh, I. Batiu,<br />
Structura <strong>şi</strong> morfologia unor pulberi <strong>de</strong> carbonat <strong>de</strong> nichel, ConferinŃa NaŃională <strong>de</strong><br />
Metalurgie a Pulberilor (III), Institutul Politehnic Cluj-Napoca, vol. 2, p. 25-30, 1988<br />
67. L. Literat, T. Farcaş, N. Farbas, D. Literat, E. Cîmpean, F. Kacso, N. Alma<strong>şi</strong>,<br />
V. Corbeanu, InvestigaŃii <strong>de</strong> microscopie electronică asupra unor dispersii <strong>de</strong><br />
carbonat <strong>de</strong> nichel, ConferinŃa NaŃională <strong>de</strong> Metalurgie a Pulberilor (III), Institutul<br />
Politehnic Cluj-Napoca, vol. 2, p. 31-36, 1988<br />
68. L. Literat, N. Farbas, M. Lazar, D. Literat, E. Bodis, Forma disribuŃiei<br />
particulelor pulberilor <strong>de</strong> carbonat <strong>de</strong> nichel, ConferinŃa NaŃională <strong>de</strong> Metalurgie a<br />
Pulberilor (III), Institutul Politehnic Cluj-Napoca, vol. 3, p. 15-18, 1988<br />
16
DEDICATED TO PROFESSOR LIVIU LITERAT, AT HIS 80 TH ANNIVERSARY<br />
69. L. Literat, Electronenmikroscopische Untersuchung einiger Feuerfestmassen<br />
die als katalytische Trager Wirken, Keramische Zeitschrift, 6, p. 378-381, 1987<br />
70. L. Literat, D. Vasilescu, Mase ceramice superaluminoase cu liant mulitic <strong>şi</strong><br />
porozitate controlată ca suport catalitic, Revista Materiale <strong>de</strong> ConstrucŃii, vol.16, nr.<br />
1, p. 47-50, 1986<br />
71. L. Literat, N. Farbas, InvestigaŃii asupra silicaŃilor prin intermediul analizei<br />
microelectronice, Revista Materiale <strong>de</strong> ConstrucŃii, vol.16, nr. 2, p. 140-142, 1986<br />
72. L. Literat, Microstructura, compoziŃia <strong>şi</strong> textura unor cimenturi uşoare cu<br />
granulit, Revista Materiale <strong>de</strong> ConstrucŃii, vol.16, nr. 2, p. 89-94, 1986<br />
73. L. Literat, Studiul microscopiei electronice asupra unor suporturi catalitice<br />
refractare, Revista Materiale <strong>de</strong> ConstrucŃii, vol. 15, nr. 2, p. 89-91, 1985<br />
74. L. Literat, S. Gocan, E. Ursu, Caracteristici <strong>de</strong> suprafaŃă <strong>şi</strong> cromatografice ale<br />
silicagelului RIE, Studia Univ. Babeş-Bolyai, Chemia, vol. XXVIII, nr. 1, p. 52-55, 1983<br />
75. L. Literat, V. Cuciurean, I. Dragomir, InvestigaŃii reologice a unor dispersii<br />
ceramice în câmp ultrasonic, Studia Univ. Babeş-Bolyai, Chemia, vol. XXVIII, nr. 1,<br />
p. 56-59, 1983<br />
76. L. Literat, N. Farbas, InvestigaŃii ale microscopiei electronice asupra unor<br />
<strong>de</strong>puneri metalice pe suporŃi silico-alumino<strong>şi</strong>, ConferinŃa NaŃională <strong>de</strong> Metalurgie a<br />
Pulberilor (II), Institutul Politehnic Cluj-Napoca, vol. 3, p. 135-140, 1983<br />
77. L. Literat, A. Motiu, N. Farbas, Microstructura, compoziŃia <strong>şi</strong> textura unor<br />
ceramici sinterizate, ConferinŃa NaŃională <strong>de</strong> Metalurgie a Pulberilor (II), Institutul<br />
Politehnic Cluj-Napoca, vol. 3, p. 141-146, 1983<br />
78. L. Literat, Studiul unor zeoliŃi naturali indigeni, Simpozionul NaŃional - ZeoliŃii în<br />
Tehnologia Mo<strong>de</strong>rnă, Ia<strong>şi</strong>, p. 417-423, 1983<br />
79. L. Literat, A. Barbat, E. Baditoiu, Indigene volcanic tuffs as anti agglomerating<br />
agents for nitrogenous fertilizer, Conference Permanente <strong>de</strong>s Ingineurs <strong>de</strong> Sud-Est<br />
<strong>de</strong> l’ Europe COPISEE (II), Section 3, p. 343-350, Cluj-Napoca, Romania, 1983<br />
80. L. Literat, A. Barbat, I. Batiu, Zeolite antiagglomerating agents for mineral<br />
fertilizer. Protection mechanisms, Conference Permanente <strong>de</strong>s Ingineurs <strong>de</strong> Sud-<br />
Est <strong>de</strong> l’Europe COPISEE (II), Sec. 3, p. 551-561, Cluj Napoca, Romania, 1983<br />
81. L. Literat, T. Farcaş, C. Dasoveanu, M. Stanciu, Metoda analizei microscopiei<br />
electronice asupra structurii <strong>şi</strong> compoziŃiei unor catalizatori pentru procese<br />
petrochimice, Lucrările ştiinŃifice ale ICITPR Ploieşti, p. 4-10, 1983<br />
17
18<br />
DEDICATED TO PROFESSOR LIVIU LITERAT, AT HIS 80 TH ANNIVERSARY<br />
82. L. Literat, J. Gros, Ră<strong>şi</strong>ni schimbătoare <strong>de</strong> ioni cu structură <strong>de</strong> stiren <strong>şi</strong> divinil<br />
benzen, ContribuŃii în <strong>Chimie</strong>, Simpozionul NaŃional Cluj-Napoca, p. 65-68, 1982<br />
83. L. Literat, A. MoŃiu, T. Farcaş, Catalizatori pentru etilen oxid. InvestigaŃii<br />
microstructurale. ContribuŃii în <strong>Chimie</strong>, Simpozionul NaŃional Cluj-Napoca, p. 69-71, 1982<br />
84. L. Literat, Proce<strong>de</strong>e <strong>de</strong> sorbŃie aplicate pentru investigarea caracteristicilor <strong>de</strong><br />
suprafaŃă <strong>şi</strong> texturale ale soli<strong>de</strong>lor, Aca<strong>de</strong>mia Română, Series 4, nr. 2, p. 67-89,<br />
tome 4, 1981 (prezentare acad. Emilian A. Bratu)<br />
85. L. Literat, S. Gocan, E. Ursu, Caracteristici <strong>de</strong> suprafaŃă ale silicagelului<br />
cromatografic R tratat termic <strong>şi</strong> chimic, Studia Univ. Babeş-Bolyai Cluj, Chemia, vol. XXV,<br />
nr. 1, p. 67-71, 1980<br />
86. L. Literat, L. Marta, Cercetări asupra pietrei <strong>de</strong> ciment din betoanele uşoare cu<br />
granulit, Schimb experimental cu Laboratoarele <strong>de</strong> <strong>Inginerie</strong> Civilă Tg. Mureş, vol.<br />
1, p. 110-116, 1979<br />
87. L. Literat, M. Langa, Cercetări experimentale privind posibilităŃile <strong>de</strong> caracterizare<br />
structurală a unor soli<strong>de</strong> poroase <strong>şi</strong> pulverulente utilizând date cinetice, Schimb<br />
experimental cu Laboratoarele <strong>de</strong> <strong>Inginerie</strong> Civilă Tg. Mureş, vol. 1, p. 215-220, 1979<br />
88. L. Literat, J. Gros, Schimbători <strong>de</strong> ioni macroporo<strong>şi</strong> indigeni. Caracteristici<br />
texturale, Studia Univ. Babeş-Bolyai, Chemia, vol. XXIII, nr. 1, p. 58-60, 1978<br />
89. L. Literat, O. Negru, Proce<strong>de</strong>u <strong>de</strong> calcul <strong>şi</strong> reprezentare programată a distribuŃiei<br />
volumului porilor în soli<strong>de</strong> poroase <strong>şi</strong> pulverulente, Studia Univ. Babeş-Bolyai Cluj,<br />
Chemia, vol. XXIII, nr. 2, p. 47-51, 1977<br />
90. L. Literat, Caracteristici fizice <strong>şi</strong> structurale ale unor cimenturi expandate,<br />
Lucrările ştiinŃifice ale I.P.C., C1, p. 375-379, 1978<br />
91. L. Literat, V. Cuciurean, Reziduuri ale fabricării acetilenei din carbit utilizate ca<br />
materiale <strong>de</strong> construcŃii, Lucrările ştiinŃifice ale I.P.C., p. 390-393, 1978<br />
92. L. Literat, J. Gros, Caracteristici superficiale <strong>şi</strong> <strong>de</strong> structură ale unor ră<strong>şi</strong>ni<br />
schimbătoare <strong>de</strong> ioni indigene, Studia Univ. Babeş-Bolyai Cluj, Chemia, vol. XXII,<br />
1, p. 3-7, 1977<br />
93. L. Literat, Modificări <strong>de</strong> stoechiometrie induse <strong>de</strong> sorptŃia amoniacului gazos<br />
pe alumine, Studia Univ. Babeş-Bolyai Cluj, Chemia, vol. XXII, nr. 1, p. 8-10, 1977<br />
94. L. Literat, O. Negru, Proce<strong>de</strong>u <strong>de</strong> calcul pentru <strong>de</strong>terminarea ariei specifice <strong>şi</strong><br />
a distribuŃiei porilor în soli<strong>de</strong> poroase <strong>şi</strong> pulberi, Studia Univ. Babeş-Bolyai Cluj,<br />
Chemia, vol. XXII, nr. 1, p. 61-64, 1977
DEDICATED TO PROFESSOR LIVIU LITERAT, AT HIS 80 TH ANNIVERSARY<br />
95. L. Literat, V. Cuciurean, Studiul fizico-chimic al unor argile coloidale<br />
montmorillonitice. Bentonita <strong>de</strong> la Sănduleşti-Turda, Studia Univ. Babeş-Bolyai,<br />
Cluj, Chemia, vol. XXII, nr. 2, p. 43-46, 1977<br />
96. L. Literat, O. Negru, Proce<strong>de</strong>u <strong>de</strong> calcul pentru caracterizarea unor pulberi<br />
texturate, ConferinŃa NaŃională <strong>de</strong> Metalurgice a Pulberilor (I), Cluj-Napoca,<br />
Comunicări ştiinŃifice, vol. 1, p. 45-50, 1975<br />
97. L. Literat, Consi<strong>de</strong>raŃii asupra unor meto<strong>de</strong> cinetice <strong>de</strong> sorbŃie pentru soli<strong>de</strong><br />
poroase <strong>şi</strong> pulberi, ConferinŃa NaŃională <strong>de</strong> Metalurgie a Pulberilor (I), Cluj-Napoca,<br />
Comunicări ştiinŃifice, vol. 1, p. 51-55, 1975<br />
98. L. Literat, V. Cuciurean, Studii termoanalitice privind oxidarea unor aliaje <strong>de</strong><br />
Ag-Cd alloys, ConferinŃa NaŃională <strong>de</strong> Metalurgie a Pulberilor (I), Cluj-Napoca,<br />
Comunicări ştiinŃifice, vol. 3, p. 19-22, 1975<br />
99. L. Literat, Investigations <strong>de</strong>s solids poreux par mesurages cinetiques <strong>de</strong><br />
sorbtion, Comte Rendu du Colloque International RILEM/IUPAC - Structure <strong>de</strong>s<br />
pores et proprietees <strong>de</strong>s materiaux, C, p. 129-138, Prague, Czekoslovakia, 1973<br />
100. L. Literat, ProprietăŃi electrice ale unor catalizatori montmorillonitici, Buletinul<br />
ŞtiinŃific al I.P.C., nr.13 bis, p. 75-78, 1971<br />
101. L. Literat, V. Cuciurean, Studii privind aplicarea unor meto<strong>de</strong> simple pentru<br />
<strong>de</strong>terminarea suprafeŃelor specifice ale cimenturilor, Buletinul ŞtiinŃific al I.P.C.,<br />
nr.13 bis, p. 79-83, 1971<br />
102. L. Literat, SuprafaŃa acidă a unor alumine sărace în oxigen, Lucrările ştiinŃifice<br />
ale I.P.C., p. 145-148, 1971<br />
103. L. Literat, V. Cuciurean, Studii termo-analitice ale unor pulberi pe bază <strong>de</strong><br />
aliaje <strong>de</strong> Ag-Cd, Lucrările ştiinŃifice ale I.P.C., p. 149-152, 1971<br />
104. L. Literat, V. Cuciurean, Studiul cinetic al oxidării unor pulberi pe bază <strong>de</strong><br />
aliaje <strong>de</strong> Ag-Cd, Lucrările ştiinŃifice ale I.P.C., p. 153-156, 1971<br />
105. L. Literat, V. Cuciureanu, Criteres cinetiques dans l’etu<strong>de</strong> d’oxidation <strong>de</strong>s alliages<br />
d’Ag-Cd pulverulents, 39-eme Congres International <strong>de</strong> <strong>Chimie</strong> Industrielle, Bucharest,<br />
3, p. 71-75, 1970<br />
106. L. Literat, Studiul termo-analitic <strong>şi</strong> cinetic al <strong>de</strong>scompunerii metil-aluminelor,<br />
Buletinul ŞtiinŃific al I.P.C., nr.12, p. .111-1184, 1969<br />
107. E. Stoicovici, E. Felszeghy, L. Literat, P. Krobl, E. Vermesan, L. Nagy,<br />
ContribuŃii la studiul argilelor coloidale din R.S.R. (IX). Argila <strong>de</strong> la Sindominic-Ciuc,<br />
Studia Univ. Babeş-Bolyai Cluj, Chemia, vol. XIII, nr. 2, p. 111-118, 1968<br />
19
20<br />
DEDICATED TO PROFESSOR LIVIU LITERAT, AT HIS 80 TH ANNIVERSARY<br />
108. L. Literat, Deviations from stoichiometry and structural modifications of some<br />
aluminae, Revue Roumaine <strong>de</strong> Chemie, nr. 13, p. 1161-1167, 1968<br />
109. E. Felszeghy, M. Ilies, P. Krobl, L. Literat, L. Nagy, E. Stoicovici, ContribuŃii la<br />
studiul argilelor coloidale din R.P.R. (VIII). Bentonite din Ciugud, Alba, Studia Univ.<br />
Babeş-Bolyai Cluj, Chemia, vol. XIII, nr. 1, p. 9-17, 1968<br />
110. L. Literat, Donnees thermoanalytiques sur la nonstoechiometrie <strong>de</strong> quelques<br />
alumines noires reductrices, Revue Roumaine <strong>de</strong> <strong>Chimie</strong>, nr. 13, p. 731-737, 1968<br />
111. L. Literat, Activitatea catalitică <strong>şi</strong> structura suprafeŃei unor alumino-silicaŃi,<br />
Buletinul ŞtiinŃific al I.P.C., nr.11(1), p. 117-123, 1968<br />
112. L. Literat, Activitatea catalitică a unor alumine nestoechiometrice reducătoare,<br />
Buletinul ŞtiinŃific al Institutului Politehnic Bucureşti, tome 29, nr. 3, p. 65-75, 1967<br />
113. E. Felszeghy, M. Ilies, P. Krobl, L. Literat, L. Nagy, E. Stoicovici, ContribuŃii la<br />
studiul argilelor coloidale din R.P.R. (VII). Bentonita <strong>de</strong> la Gura-Sada – Hunedoara,<br />
Studia Univ. Babeş-Bolyai Cluj, Chemia, vol. XII, nr. 2, p. 43-48, 1967<br />
114. L. Literat, L’activitee catalytique <strong>de</strong>s certaines alumines nonstoechiometriques,<br />
Revue Roumaine <strong>de</strong> Chemie, nr. 12, p. 1213-1222, 1967<br />
115. L. Literat, Studii <strong>de</strong> resonanŃă magnetică <strong>şi</strong> a conductivităŃii electrice cu<br />
variaŃia presiunii <strong>de</strong> oxigen a unor alumine reducătoare nestoechimetrice, Analele<br />
UniversităŃii Bucureşti, Seria ŞtiinŃele Naturii, nr. 1, p. 49-63, 1965<br />
116. E. Felszeghy, L. Literat, A. Covaci, Un aparat simplu pentru dozarea carbonatului.<br />
Note <strong>de</strong> laborator, Studia Univ. Babeş-Bolyai Cluj, Chemia, vol. X, nr. 1, p. 145-146,<br />
1965<br />
117. L. Literat, ContribuŃii la problema nestoechiometriei oxizilor refractari. Studii asupra<br />
caracteristicilor magnetoelectrice ale unor alumine nestoechiometrice reducătoare,<br />
Rev. Chim, vol. 16, nr.5, p. 262-268, 1965<br />
118. L. Literat, Noi date privind nestoechiometria aluminelor. VariaŃia izotermală a<br />
conductivităŃii electrice cu persiunea oxigenului, Lucrările ştiinŃifice ale Institutului<br />
Politehnic Cluj (I.P.C.), nr. 7, p. 87-94, 1964<br />
119. L. Literat, Studiul aluminelor nestoechiometrice reducătoare prin rezonanŃă<br />
electro-magnetică, Lucrările ştiinŃifice ale I.P.C., nr. 7, p. 95-101, 1964<br />
120. E. Felszeghy, M. Ilies, P. Krobl, L. Literat, L. Nagy, E. Stoicovici, ContribuŃii la<br />
studiul unor argile coloidale din R.P.R. (VI). Bentonita <strong>de</strong> la Oraşul Nou, Studia<br />
Univ. Babeş-Bolyai Cluj, Chemia, vol. VIII, nr. 1-2, p. 93-103, 1963
DEDICATED TO PROFESSOR LIVIU LITERAT, AT HIS 80 TH ANNIVERSARY<br />
121. L. Literat, Studiul fizico-chimic al aluminei nestoechiometrice, Lucrările<br />
ştiinŃifice ale I.P.C., nr. 6, p. 119-126, 1963<br />
122. E. Felszeghy, M. Ilies, L. Literat, L. Naghy, E. Stoicovici, I. Soos, ContribuŃii la<br />
studiul unor argile coloidale din R.P.R. (V). Bentonita <strong>de</strong> la Ocna Mureş, Studia<br />
Univ. Babeş-Bolyai Cluj, Chemia, vol. VII, nr. 1-2, p. 87-98, 1962<br />
123. L. Literat, ContribuŃii la studiul aluminei nestoechiometrice (II). Studiul proprietăŃilor<br />
electrice, Buletinul ŞtiinŃific al I.P.C., nr.5, p. 95-105, 1962<br />
124. L. Literat, ContribuŃii la studiul aluminei nestoechiometrice (I). CondiŃii <strong>de</strong> obŃinere<br />
a aluminei reducătoare, Buletinul ŞtiinŃific al I.P.C., nr. 5, p. 81-93, 1962<br />
125. L. Literat, Descompunerea acidului formic cu alumine reducătoare<br />
nestoechiometrice, Buletinul ŞtiinŃific al I.P.C., nr. 5, p. 107-118, 1962<br />
126. L. Literat, Consi<strong>de</strong>raŃii la <strong>de</strong>terminarea ariei specifice a cimentului, Buletinul<br />
ŞtiinŃific al I.P.C., nr. 4, p. 103-111, 1961<br />
127. T. Bereczky, L. Literat, O nouă metodă <strong>de</strong> studiu aplicată nisipurilor pentru<br />
turnare, Lucrările ştiinŃifice ale Institutului Politehnic Cluj, nr. 3, p. 69-79, 1960<br />
128. E. Felszeghy, L. Literat, E. Stoicovici, M. Ilies, M. Kulcsar, L. Nagy, ContribuŃii<br />
la studiul argilelor coloidale din R.P.R. (IV), Noi date <strong>de</strong>spre bentonita <strong>de</strong> la Cugir,<br />
Studia Univ. Babeş-Bolyai Cluj, Chemia, vol. IV, nr. 1-2, p. 175-192, 1959<br />
129. E. Felszeghy, L. Literat, E. Stoicovici M. Ilies, M. Kulcsar, L. Nagy, ContribuŃii<br />
la studiul argilelor coloidale din Republica Populară Română (III). Bentonitele <strong>de</strong> la<br />
Tg. Lăpuş <strong>şi</strong> Izvorul Oltului, Lucrările ştiinŃifice ale I.P.C., nr. 2, p. 159-169, 1959<br />
130. E. Felszeghy, M. Ilies, M. Kulcsar, L. Literat, L. Nagy, E. Stoicovici, ContribuŃii<br />
la studiul argilelor coloidale din R.P.R. (II). Lucrările ştiinŃifice ale I.P.C., nr. 2, p.<br />
145-157, Romania, 1959<br />
130. E. Felszeghy, L. Literat, Izotermele <strong>de</strong> adsorbŃie ale vaporilor <strong>de</strong> metanol pe<br />
argile coloidale, Lucrările ştiinŃifice ale I.P.C., nr. 2, p. 171-179, 1959<br />
132. L. Literat, ContribuŃii la metodologia adsorbŃiei vaporilor <strong>şi</strong> gazelor, Lucrările<br />
ştiinŃifice ale I. P.C., nr.2, p. 181-189, 1959<br />
133. E. Felszeghy, M. Ilies, M. Kulcsar, L. Literat, L. Nagy, E. Stoicovici, ContribuŃii la<br />
studiul argilelor coloidale din R.P.R. (I), Lucrările ştiinŃifice ale I.P.C., nr. 1, p. 31-46, 1958.<br />
21
STUDIA UNIVERSITATIS BABES-BOLYAI, CHEMIA, LIV, 1, 2009<br />
Dedicated to Professor Liviu Literat, at his 80 th anniversary<br />
PROCAINE EFFECTS ON SURFACE TOPOGRAPHY OF<br />
SPREAD DIPALMITOYL PHOSPHATIDYLCHOLINE<br />
MONOLAYERS<br />
PETRE T. FRANGOPOL a , D. ALLAN CADENHEAD b ,<br />
MARIA TOMOAIA-COTIŞEL c* AND AURORA MOCANU c<br />
ABSTRACT. The surface topography of dipalmitoyl phosphatidylcholine<br />
(DPPC) monolayers, spread at the air/water interface, in the absence and the<br />
presence of procaine, has been investigated by self-assembly Langmuir-<br />
Blodgett (LB) technique and atomic force microscopy (AFM), operating in<br />
tapping mo<strong>de</strong>. The LB monolayers were transferred on mica, at a controlled<br />
surface pressure, characteristic for the liquid expan<strong>de</strong>d to liquid con<strong>de</strong>nsed<br />
phase transition of pure DPPC monolayers. Our data indicate that procaine<br />
penetrates into and specifically interacts with DPPC monolayers stabilizing the<br />
phospholipid membrane interface.<br />
Keywords: DPPC, procaine, monolayers, AFM, LBT, phase transition<br />
INTRODUCTION<br />
Changes in physical and chemical properties of lipid membranes<br />
due to the distribution of local anesthetics within these membranes are of a<br />
major importance [1-4] for un<strong>de</strong>rstanding the molecular mechanism of<br />
anesthesia. In spite of numerous investigations, the molecular mechanism<br />
of anesthesia and the involved interfacial phenomena in anesthetics action<br />
are still not well un<strong>de</strong>rstood [5]. As a first step, the anesthetics action<br />
presumes that the anesthetic molecules modify the lipid membrane structure<br />
and thus, they change the biological membrane properties [5].<br />
a<br />
Institutul NaŃional <strong>de</strong> Fizică <strong>şi</strong> <strong>Inginerie</strong> Nucleară Horia Hulubei, Str. Atomiştilor, Nr. 407,<br />
Măgurele-Bucureşti, Romania<br />
b<br />
State University of New York at Buffalo, Department of Chemistry, 410 NSC, Buffalo, NY<br />
14260-3000, USA<br />
c<br />
Universitatea Babeş-Bolyai, <strong>Facultatea</strong> <strong>de</strong> <strong>Chimie</strong> <strong>şi</strong> <strong>Inginerie</strong> <strong>Chimică</strong>, Str. Kogălmiceanu,<br />
Nr. 1, RO-400084 Cluj-Napoca, Romania, mcotisel@chem.ubbcluj.ro
PETRE T. FRANGOPOL, D. ALLAN CADENHEAD, MARIA TOMOAIA-COTIŞEL, AURORA MOCANU<br />
Previously, we have reported that the local anesthetics, like procaine,<br />
expand the lipid monolayers spread at the air/water interface, at low and<br />
intermediate surface pressures, <strong>de</strong>pending on the pH’s, ionic strengths and<br />
surface characteristics of the chosen lipid [6-24].<br />
The interfacial characteristics of the mixed lipid and procaine<br />
monolayers results from the adsorption on and the penetration of procaine<br />
into lipid membrane mo<strong>de</strong>ls in substantial agreement with other related<br />
published data [1-5, 22-29].<br />
The objective of the present work is to analyse the effects of procaine<br />
on the structural and topographical characteristics of lipid monolayers using<br />
atomic force microscopy (AFM) and Langmuir-Blodgett technique (LBT).<br />
We have chosen a synthetic phospholipid, namely L-α dipalmitoyl phosphatidyl<br />
choline (1, 2-dipalmitoyl -sn- glycero-3-phospho-choline: DPPC), which forms<br />
stable monolayers at fluid interfaces [30-32]. Here, we investigate the structure<br />
and surface topography of the DPPC monolayers spread on aqueous solution<br />
in the absence and the presence of procaine and the formation of liquid<br />
con<strong>de</strong>nsed domains is evi<strong>de</strong>nced.<br />
RESULTS AND DISCUSSION<br />
The surface pressure versus mean molecular area isotherms were<br />
recor<strong>de</strong>d for pure DPPC monolayers, spread at the air/water (pH 5.6)<br />
interface, and for mixed DPPC and procaine monolayers, obtained by<br />
spreading DPPC monolayers on procaine (10 -3 M) aqueous phase (pH 5.2),<br />
at 20 o C. For pure DPPC monolayer, the compression isotherm shows a<br />
phase transition at a lateral surface pressure of about 8 mN/m, from liquid<br />
expan<strong>de</strong>d (LE) to liquid con<strong>de</strong>nsed (LC) state [30]. The mixed DPPC and<br />
procaine monolayer also presents a LE/LC phase transition, evi<strong>de</strong>nced on<br />
compression isotherm, at around 15 mN/m.<br />
In addition, the compression isotherms show a collapse phenomenon<br />
at very high surface pressures, characterized by collapse area (Ac) and collapse<br />
pressure (πc). The collapse characteristics and the limiting molecular areas<br />
(A0), characterizing the LC phase of DPPC monolayers, are given in Table 1.<br />
Table 1. Surface characteristics of DPPC monolayers spread at the air/water interface<br />
both in the absence and in the presence of procaine (P) in aqueous phase.<br />
24<br />
Monolayer P (M) A0 (Ǻ 2 ) Ac (Ǻ 2 ) πc (mN/m )<br />
DPPC 0 54 42 55<br />
DPPC and P 10 -3 78 42 63
PROCAINE EFFECTS ON SURFACE TOPOGRAPHY OF SPREAD DIPALMITOYL …<br />
From Table 1, it is observed the expan<strong>de</strong>d effect of procaine, namely<br />
the limiting molecular area (A0) for LC state and the collapse pressure (πc)<br />
are much higher in the presence of procaine than for pure DPPC monolayers.<br />
These data indicate that procaine has a notable effect both on the DPPC<br />
phase transition and on the collapse of DPPC monolayers, at the air/water<br />
interface. Due to the same collapse areas, (Ac), it is found that the procaine<br />
is exclu<strong>de</strong>d from DPPC monolayers at collapse, but still remains adsorbed<br />
on DPPC monolayer surface thus, increasing the monolayer collapse pressure<br />
and stability. This effect might correspond to pressure-driven exclusion of<br />
procaine from zwitterionic DPPC monolayers.<br />
Similar expansion effects were previously reported for octa<strong>de</strong>canoic<br />
acid [22, 24] and for tetra<strong>de</strong>canoic acid [23] spread on procaine aqueous<br />
phase. The magnitu<strong>de</strong> of the effect increased with increasing procaine<br />
concentration in the aqueous phase.<br />
The surface topography of pure DPPC monolayers, transferred at 8<br />
mN/m on mica surface, is given in the AFM images, Figs. 1 and 2. The 2D<br />
topographies show a heterogeneous DPPC monolayer with characteristic<br />
features and the domains formation is clearly evi<strong>de</strong>nced.<br />
Brighter areas (Figs. 1 and 2) are assigned for high domains of the<br />
DPPC in LC state, but darker areas correspond to lower domains characteristic<br />
for LE phase. The boundaries of DPPC domains are typically observed and<br />
are thought to be the bor<strong>de</strong>rs between various DPPC areas with different tilt<br />
of molecular orientations [19, 30, 32]. We suggest that the lighter domains<br />
correspond to well organized probably almost vertically oriented DPPC<br />
molecules, while the darker areas correspond to less or<strong>de</strong>rly DPPC molecules.<br />
The LC domains are distributed within the LE matrix of DPPC monolayers.<br />
The analysis of surface topographies, Figs. 1 and 2, clearly indicate<br />
the phase separation between LC and LE phases, which is consistent with<br />
the two surface phase transition recor<strong>de</strong>d at the lateral surface pressure of<br />
8 mN/m, as it is evi<strong>de</strong>nced on compression isotherms. The AFM images of<br />
DPPC monolayers show nano island LC domains (with long axis of isolated<br />
20 nm up to 100 nm domains, Fig. 1B). The large LC domains are observed in<br />
Figs. 1A and 2 (with long axis from 500 nm up to 2 and 3 µm). Also, micro<br />
islands of LC phase are i<strong>de</strong>ntified particularly at big scanned areas (e.g., 25<br />
µm x 25 µm) with major axis up to 3 or even 8 µm.<br />
The large LC domains are almost circular or elongated (Fig. 1A and<br />
Fig. 2A). The nano LC domains are predominantly circulars, square or elongated<br />
associated as asymmetric clusters, like windmill shape (Fig. 1B and 2) as<br />
previously observed by fluorescence microscopy [23], by direct compression<br />
of DPPC monolayer at the air/water interface. The large LC domains are<br />
higher with 0.8, 1.5 or 2 nm than the LE phase. It is to be noted that the<br />
large LC domains show almost the same height as the surrounding nano<br />
LC domains.<br />
25
PETRE T. FRANGOPOL, D. ALLAN CADENHEAD, MARIA TOMOAIA-COTIŞEL, AURORA MOCANU<br />
Ultimately, near the DPPC monolayer collapse a homogeneous structure<br />
results from the close packed DPPC molecules, well oriented vertically at the<br />
air/water interface, as a consequence of strong molecular interactions.<br />
26<br />
(A) (B)<br />
Figure 1. AFM topography images of DPPC monolayers, for 3 µm x 3 µm (A) and<br />
1 µm x 1 µm (B) scanned areas. Monolayers were transferred by Langmuir-Blodgett<br />
technique on mica surface, at 8 mN/m, for the liquid expan<strong>de</strong>d (LE) to liquid con<strong>de</strong>nsed (LC)<br />
phase transition. The z-scale is 5 nm for image A and 3 nm for image B. Image B<br />
was recor<strong>de</strong>d by scanning on small area marked in image A.<br />
(A) (B)<br />
Figure 2. AFM topography images of DPPC monolayers, for 2 µm x 2 µm (A) and<br />
1 µm x 1 µm (B) scanned areas. Monolayers were transferred at the phase transition<br />
(8 mN/m) on mica surface. The z-scale is 5 nm for image A and 3 nm for image B.<br />
Image B was recor<strong>de</strong>d by scanning on small area marked in image A.
PROCAINE EFFECTS ON SURFACE TOPOGRAPHY OF SPREAD DIPALMITOYL …<br />
The presence of procaine (0.001 M in aqueous phase, pH 5.2)<br />
causes changes in surface properties of DPPC monolayers as <strong>de</strong>termined<br />
on compression isotherms and in the structure of DPPC layers as observed<br />
on AFM images.<br />
The LE/LC phase transition is evi<strong>de</strong>nced on compression isotherms<br />
for mixed DPPC and procaine monolayers, at 15 mN/m. Thus, a substantial<br />
increase in transition lateral surface pressure is recor<strong>de</strong>d for mixed monolayers<br />
as compared with pure DPPC monolayers (i.e., 8 mN/m) on water.<br />
(A) (B)<br />
(C) (D)<br />
Figure 3. Topographies (A and C) and phase images (B and D) of DPPC monolayers<br />
spread on aqueous phases of 0.001 M procaine, transferred on mica at 8 mN/m.<br />
A and B: scanned area 5 µm x 5 µm; C and D: 3 µm x 3 µm. AFM images (C and D)<br />
were recor<strong>de</strong>d by scanning on small areas marked in images A and B,<br />
respectively. The z-scale is 5 nm for A and C topographies.<br />
27
PETRE T. FRANGOPOL, D. ALLAN CADENHEAD, MARIA TOMOAIA-COTIŞEL, AURORA MOCANU<br />
For the beginning, the AFM images for mixed DPPC and procaine<br />
monolayers, transferred on mica at the lateral surface pressure of 8 mN/m,<br />
are examined (Fig. 3) and compared with AFM images of pure DPPC<br />
monolayers (Figs. 1 and 2). A phase separation is also found and visualized in<br />
AFM images for mixed DPPC and procaine monolayers (Fig. 3) in a similar<br />
way with the situation for pure DPPC monolayers (Figs 1 and 2). Thus, the<br />
LC domains within mixed DPPC and procaine monolayers are <strong>de</strong>tected at<br />
low value of lateral surface pressure (about 8 mN/m). The LC domains in mixed<br />
monolayers are smaller (Fig. 3) than those observed in DPPC monolayers<br />
on a pure water substrate (Fig. 1A), at the lateral pressure of 8 mN/m, which is<br />
characteristic for the phase transition within the pure DPPC monolayers.<br />
As the compression of mixed DPPC and procaine monolayers<br />
continued, the LC domains increased in size and number (Fig. 4, for 14 mN/m).<br />
Furthermore, for mixed DPPC and procaine monolayers at the LE/LC<br />
phase transition (about 15 mN/m) recor<strong>de</strong>d on compression isotherm, it was<br />
observed a continuous increase in the LC domains, which carry various<br />
interesting shapes. In other words, at 10 -3 M procaine concentration, the<br />
LE/LC phase transition of mixed monolayers was observed by AFM images<br />
(Fig. 5, at the transition lateral surface pressure of about 15 mN/m), while<br />
the formation of LC phase was <strong>de</strong>tected at much lower pressures, like 8<br />
mN/m (Fig. 3) and at 14 mN/m (Fig. 4).<br />
Clearly, procaine induces nucleation of liquid con<strong>de</strong>nsed domains<br />
before the phase transition recor<strong>de</strong>d on compression isotherms for mixed<br />
DPPC and procaine monolayers. It appears that the onset of the LE/LC<br />
phase transition starts before the transition lateral surface pressure for<br />
mixed monolayers.<br />
At lateral pressures above the phase transition, e.g. 20 mN/m, still<br />
some very large LC domains are visualized in AFM images. Near the collapse,<br />
the mixed DPPC and procaine monolayers are well or<strong>de</strong>red as in the case of<br />
pure DPPC monolayers showing a very low roughness (rms about 0.2 nm).<br />
Undoubtedly, the presence of procaine in aqueous phase brings<br />
strong modifications on the structure and morphology of DPPC monolayers,<br />
even at low lateral surface pressure of 8 mN/m, which is characteristic for<br />
LE/LC phase transition of pure DPPC monolayers.<br />
We suggest that procaine coexists with less or<strong>de</strong>red DPPC molecules<br />
and is preferentially located at the domain boundaries. This would indicate<br />
that the lighter domains correspond to almost highly oriented DPPC molecules.<br />
The dark domains probably correspond to less organized DPPC molecules<br />
mixed with procaine. Thus, AFM images reveal a phase separation between<br />
DPPC con<strong>de</strong>nsed phase (high areas) and DPPC expan<strong>de</strong>d phase enriched<br />
in procaine (low areas).<br />
28
PROCAINE EFFECTS ON SURFACE TOPOGRAPHY OF SPREAD DIPALMITOYL …<br />
(A) (B)<br />
(C) (D)<br />
Figure 4. Topographies (A and C) and phase images (B and D) of DPPC monolayers<br />
spread on aqueous phases of 0.001 M procaine, compressed to 14 mN/m and transferred<br />
on mica surface. A and B: scanned area 3 µm x 3 µm; C and D: 1 µm x 1 µm. AFM<br />
images (C and D) were recor<strong>de</strong>d by scanning on small areas marked in images A<br />
and B, respectively. The z-scale is 5 nm for A and C topographies.<br />
The mixed DPPC and procaine monolayers present LC nano<br />
domains co-existing with small round LE procaine rich phase in the center<br />
of the LC large micro domains (Fig. 3A and B), where the LC nano domains<br />
form a network of filament unique structure. Also, the LC nano domains are<br />
situated at the edges of the large LC domains forming larger aggregates<br />
(Fig. 3C and D), belts (Fig. 4A and B) or stripes (Fig. 4C and D).<br />
29
PETRE T. FRANGOPOL, D. ALLAN CADENHEAD, MARIA TOMOAIA-COTIŞEL, AURORA MOCANU<br />
By increasing the surface pressure (Fig. 4, at 14 mN/m), the stripes<br />
are formed by the alignment of many smaller LC domains, that have almost<br />
the same height with the large LC domains of DPPC monolayers.<br />
The phase images (Figs. 3B, 3D, 4B and 4D) show the morphological<br />
character more clearly than the corresponding topography (Figs. 3A, 3C,<br />
4A and 4C) due to the difference in the surface physical and chemical<br />
properties between the con<strong>de</strong>nsed and expan<strong>de</strong>d DPPC monolayers.<br />
30<br />
(A) (B)<br />
Figure 5. Topographies (A and B) of DPPC monolayers spread on aqueous phases of<br />
0.001 M procaine, compressed at about 15 mN/m and transferred on mica surface by<br />
LB technique. A: scanned area of 5 µm x 5 µm. (B): 3 µm x 3 µm were recor<strong>de</strong>d by<br />
scanning on small areas marked in image A. The z-scale is 5 nm.<br />
Thus, almost in the center of the large LC domains, many nano LC<br />
domains are observed (with axis of 50 to 150 nm), particularly in small scale<br />
images (Figs. 3 and 5). The large LC domains have the same height as the<br />
edges of the aligned stripes.<br />
The large LC domains are about 2 nm higher than the fluid LE<br />
phase and are surroun<strong>de</strong>d by a mixture of LE phase and LC nano domains,<br />
in which LC domains are aligned in a striped pattern (Fig. 5). The large LC<br />
domains are rather well packed at high lateral surface pressure (15 mN/m)<br />
that corresponds to the phase transition of mixed DPPC:P monolayers<br />
evi<strong>de</strong>nced on compression isotherm.<br />
Thus, a unique morphology of mixed DPPC and procaine monolayers<br />
is observed, showing large LC domains, which contain a network of<br />
filaments of LC domains surroun<strong>de</strong>d by LE procaine rich phase, where the
PROCAINE EFFECTS ON SURFACE TOPOGRAPHY OF SPREAD DIPALMITOYL …<br />
procaine is adsorbed preferentially at the edge of the LC domains. At the<br />
transition surface pressure (15 mN/m), numerous filaments in the center of<br />
the large LC domains are formed (Fig. 5A) and larger patches at their edges<br />
appears (Fig. 5B).<br />
The differing shapes of LC phase within the mixed DPPC and<br />
procaine monolayers reflect a different structure of DPPC monolayers un<strong>de</strong>r<br />
the action of procaine. These data suggest that procaine affects DPPC<br />
morphology in the LC phase. Nevertheless, the morphological changes<br />
within mixed DPPC and procaine monolayers support the participation of<br />
procaine in anesthesia.<br />
Higher amounts of procaine in aqueous phase give numerous<br />
filaments in the center of the LC micro domains and evi<strong>de</strong>ntly larger LC<br />
patches at their edges.<br />
Qualitatively, the same effects were observed at lower procaine<br />
concentrations. However, the magnitu<strong>de</strong> of the procaine effects was smaller<br />
and was diminished with <strong>de</strong>creasing of procaine concentrations.<br />
This situation might be related to the fact that the procaine adsorbs<br />
and penetrates preferably at the boundaries between LC domains, with a<br />
different tilt direction, and in the expan<strong>de</strong>d DPPC phase, as also found by<br />
epifluorescent microscopy [23]. However, the binding of procaine molecules<br />
to the surface of the DPPC con<strong>de</strong>nsed domains could also perturb the lipid<br />
chains organization. In this regard, the maximum height in mixed monolayers<br />
is about 3.6 nm as <strong>de</strong>termined in Fig. 3. This height corresponds to the mixed<br />
DPPC and procaine con<strong>de</strong>nsed domains, and is <strong>de</strong>creased as compared to<br />
the height of the con<strong>de</strong>nsed domains existing in pure DPPC layers (Fig. 1A,<br />
where maximum height of 4.3 nm was found). The phase contrast images,<br />
given in Figs. 3 and 4, show also clearly the morphological character<br />
corresponding to the given surface topography.<br />
The tertiary amine procaine is an amphiphilic molecule which exists<br />
in the charged form [13] at the working pH of about 5.6. The hydrophilic<br />
amine moiety is responsible for water solubility and DPPC membrane surface<br />
binding and the hydrophobic moiety appears to control the organization within<br />
the DPPC membrane mo<strong>de</strong>l. The interaction of procaine molecules with<br />
zwitterionic DPPC molecules may lead to an or<strong>de</strong>ring effect on the DPPC<br />
monolayer interface and to a disor<strong>de</strong>ring effect on the hydrocarbon interior<br />
of DPPC monolayers, in substantial agreement with AFM observations.<br />
In or<strong>de</strong>r to explain the mo<strong>de</strong> of action of procaine, positively charged<br />
un<strong>de</strong>r the working conditions, on the zwitterionic phospholipids monolayers,<br />
we assume that positively charged procaine molecules adsorb onto the lipid<br />
membrane surface. This will allow the hydrophobic portion of procaine<br />
molecule to be embed<strong>de</strong>d into the hydrocarbon part of the expan<strong>de</strong>d liquid<br />
phase and at the domain boundaries of lipid monolayers.<br />
31
PETRE T. FRANGOPOL, D. ALLAN CADENHEAD, MARIA TOMOAIA-COTIŞEL, AURORA MOCANU<br />
The positively charged amine group of procaine molecules can<br />
interact electrostatically, at the monolayer/water interface, with the negatively<br />
charged group of the zwitterionic DPPC molecules. The electrostatic interaction<br />
will appear in both the con<strong>de</strong>nsed and the expan<strong>de</strong>d liquid state of DPPC<br />
monolayers increasing the stability of the lipid membrane.<br />
The findings in this study suggest that procaine accumulates in the<br />
lipid phase of cell membranes, and thus might change the physical properties<br />
of the membrane lipid and consequently, procaine molecules influence the<br />
protein conformation. The effect of procaine and other local anesthetics on<br />
DPPC membrane structuration at various lateral surface pressures is un<strong>de</strong>r<br />
further investigation in our laboratories.<br />
CONCLUSIONS<br />
Combined surface chemistry, Langmuir-Blodgett (LB) self-assembly<br />
technique, and atomic force microscopy have been used to <strong>de</strong>termine the<br />
spreading, structure and topography of DPPC monolayers at the air/water<br />
interface.<br />
During compression at the air/water interface, DPPC monolayers<br />
present a structural transition at a lateral surface pressure of about 8 mN/m,<br />
from liquid expan<strong>de</strong>d (LE) to liquid con<strong>de</strong>nsed (LC) structures, showing LC<br />
domains with heterogeneous structures. Finally, near the DPPC monolayer<br />
collapse a homogeneous structure results from the close packed DPPC<br />
molecules, well oriented in a matrix at the air/water interface, which is a<br />
consequence of the strong molecular interactions.<br />
The LB self-assembled monolayers were transferred from Langmuir<br />
films onto mica, at controlled surface pressures characteristic for the phase<br />
transition in DPPC monolayers by using vertical transfer method. In the<br />
presence of procaine (10<br />
32<br />
-3 M) in aqueous phase, the stability of DPPC films<br />
is highly increased as it is reflected by the increased collapse and phase<br />
transition pressures of DPPC monolayers.<br />
The DPPC monolayer structure is influenced by the presence of<br />
procaine in aqueous phase and a more expan<strong>de</strong>d monolayer structure is<br />
observed for 10 -3 M procaine. AFM images confirm, at the microscopic and<br />
nanoscopic levels, almost the same type of structural changes <strong>de</strong>duced from the<br />
compression isotherms for DPPC monolayers as a function of surface pressure.<br />
Structural characteristics and the surface topography of DPPC<br />
monolayers are highly <strong>de</strong>pen<strong>de</strong>nt on the lateral surface pressure for a<br />
particular concentration of procaine in the aqueous phase. In addition, the<br />
appearance of a new liquid con<strong>de</strong>nsed (LC) phase is strongly evi<strong>de</strong>nced in<br />
the mixed DPPC and procaine monolayers.<br />
The results reveal some specific molecular interactions between<br />
DPPC and procaine in substantial agreement with molecular interactions<br />
and with molecular structure of these biocompounds.
PROCAINE EFFECTS ON SURFACE TOPOGRAPHY OF SPREAD DIPALMITOYL …<br />
EXPERIMENTAL SECTION<br />
Materials<br />
Synthetic 1,2-dipalmitoyl-sn-glycero-3-phosphocholine: DPPC, and<br />
procaine, 2-(diethylamine)ethyl-para-(amine) benzoate, hydrochlori<strong>de</strong> (P- HCl),<br />
were purchased from Sigma Chemical Co., and used without further purification.<br />
For the study of the procaine effect, P- HCl was first dissolved in two-distilled<br />
water, giving a chosen procaine concentration, e.g., 10 -3 M procaine, in the<br />
aqueous solution.<br />
Langmuir-Blodgett (LB) film<br />
DPPC was dissolved in a mixture of chloroform: ethanol (9:1, v/v),<br />
giving a 1 mM phospholipid in organic solution. The DPPC solution was<br />
spread at the air/water interface with a microsyringe both in the absence and<br />
the presence of procaine in aqueous solutions. After spreading, the system<br />
was allowed to stand for 10 min, without causing the surface disturbance.<br />
Then, the compression isotherms in terms of surface pressure versus mean<br />
molecular area of DPPC were recor<strong>de</strong>d. All measurements were performed<br />
with KSV equipment. The speed of the compression was 10 mm min -1 (i.e.,<br />
8 Å 2 /(molecule x min). For AFM observations, a single layer (LB film) was<br />
transferred on freshly cleaved mica surface, using a vertical dipping method<br />
at different surface pressures maintained constant (e.g., 8 mN/m). The LB<br />
film transfer took place at a rate of about 5 mm/min.<br />
AFM observations<br />
Atomic force microscopy (AFM) is a surface imaging technique with<br />
a nanometer-scale resolution [32-35]. AFM studies were performed using<br />
the AFM JEOL 4210. The cantilevers with a resonance frequency of 250 –<br />
350 kHz were used. Triplicate samples were prepared for each monolayer<br />
composition and at least four separate areas were imaged for each sample.<br />
Through this study, AFM images were obtained at several constant surface<br />
pressures in or<strong>de</strong>r to examine the effect of procaine on the phase behaviour<br />
of DPPC monolayers spread at the air/water interface.<br />
REFERENCES<br />
1. H. Tsuchiya, M. Mizogami, T. Ueno, K. Takakura, Inflammopharmacol., 2007,<br />
15, 164.<br />
2. T. Hata, H. Matsuki, S. Kaneshina, Colloids Surf. B, 2000, 18, 41.<br />
3. Z. Leonenko, E. Finot, D. Cramb, Biochim. Biophys. Acta, 2006, 1758, 487.<br />
4. H. Matsuki, S. Kaneshina, H. Kamaya, I. Ueda, J. Phys. Chem. B, 1998,<br />
102, 3295.<br />
33
PETRE T. FRANGOPOL, D. ALLAN CADENHEAD, MARIA TOMOAIA-COTIŞEL, AURORA MOCANU<br />
34<br />
5. Z. V. Leonenko, D. T. Cramb, Can. J. Chem., 2004, 82, 1128.<br />
6. M. Tomoaia-Cotisel, E. Chifu, A. Mocanu, J. Zsakó, M. Salajan, P.T. Frangopol,<br />
Rev. Rroum. Biochim., 1988, 25( 3), 227.<br />
7. M. Tomoaia-Cotisel, J. Zsakó, E. Chifu, P. T. Frangopol, W. A. P. Luck, E.<br />
Osawa, Rev. roum. Biochim., 1989, 26(4), 305.<br />
8. J. Zsakó, M. Tomoaia-Cotisel, E. Chifu, A. Mocanu, P. T. Frangopol, Biochim.<br />
Biophys. Acta, 1990, 1024, 227.<br />
9. J. Zsakó, M. Tomoaia-Cotisel, E. Chifu, I. Albu, A. Mocanu, P. T. Frangopol,<br />
Rev. Roum. Chim., 1990, 35(7-9), 867.<br />
10. E. Chifu, M. Tomoaia-Cotisel, J. Zsakó, I. Albu, A. Mocanu, P.T. Frangopol,<br />
Rev. Roum. Chim., 1990, 35(7-9), 879.<br />
11. M. Tomoaia-Cotisel, E. Chifu, S. Jitian, I. Bratu, S. Bran, P. T. Frangopol, A.<br />
Mocanu, Stud. Univ. Babes-Bolyai, Chem., 1990, 35(2), 17.<br />
12. E. Chifu, M. Tomoaia-Cotisel, J. Zsakó, A. Mocanu, M. Salajan, M. Neag,<br />
P. T. Frangopol, Seminars in Biophysics, Vol. 6, Editors: P. T. Frangopol,<br />
V. V. Morariu, IAP Press, Bucharest, 1990, 117.<br />
13. J. Zsakó, M. Tomoaia-Cotisel, I. Albu, A. Mocanu, E. Chifu, P. T. Frangopol,<br />
Rev. roum. Biochim., 1991, 28(1-2), 33.<br />
14. M. Tomoaia-Cotisel, E. Chifu, J. Zsakó, P. T. Frangopol, P. J. Quinn, A.<br />
Mocanu, Stud. Univ. Babes-Bolyai, Chem., 1993, 38(1-2), 81.<br />
15. J. Zsakó, M. Tomoaia-Cotisel, E. Chifu, A. Mocanu, P. T. Frangopol,<br />
Gazz. Chim. Ital., 1994, 124, 5.<br />
16. J. Zsakó, E. Chifu, M. Tomoaia-Cotisel, A. Mocanu, P. T. Frangopol, Rev.<br />
Roum. Chim., 1994, 37(7), 777.<br />
17. M. Tomoaia-Cotisel, J. Zsakó, E. Chifu, A. Mocanu, P. T. Frangopol, P. J.<br />
Quinn, J. Romanian Colloid and Surface Chem. Assoc., 1997, 2(3-4), 30.<br />
18. M. Tomoaia-Cotisel, T. Oproiu, J. Zsako, A. Mocanu, P. T. Frangopol, P.<br />
J. Quinn, Rev. Roum. Chim., 2000, 45(9), 851.<br />
19. M. Tomoaia-Cotisel, A. Mocanu, Rev. Chim. (Bucharest), 2008, 59(11), 1230.<br />
20. P. T. Frangopol, D. Mihailescu, Colloids Surf. B, 2001, 22, 3.<br />
21. T. Hianik, M. Fajkus, B. Tarus, P. T. Frangopol, V. S. Markin, D. F. Lan<strong>de</strong>rs,<br />
Bioelectrochem. Bioenergetics, 1998, 46, 1.<br />
22. M. Tomoaia-Cotisel, D. A. Ca<strong>de</strong>nhead, Langmuir, 1991, 7, 964.<br />
23. B. Asgharian, D. A. Ca<strong>de</strong>nhead, M. Tomoaia-Cotisel, Langmuir, 1993, 9, 228.<br />
24. M. Tomoaia-Cotisel, Progr. Colloid Polym. Sci., 1990, 83, 155.<br />
25. H. Matsuki, K. Shimada, S. Kaneshina, M. Yamanaka, H. Kamaya, I. Ueda,<br />
Langmuir, 1997, 13, 6115.<br />
26. S.-Y. Choi, S.-G. Oh, J.-S. Lee, Colloids Surf. B, 2001, 20, 239.<br />
27. A. Cavalli, G. Borissevitch, M. Tabak, O. N. Oliveira, Jr., Thin Solid Films,<br />
1996, 284, 731.<br />
28. D. M. Goodman, E. M. Nemoto, R. W. Evans, P. M. Winter, Chemistry and<br />
Physics of Lipids, 1996, 84, 57.<br />
29. S.-Y. Choi, S.-G. Oh, J.-S. Lee, Colloids Surf. B, 2000, 17, 255.<br />
30. M. Tomoaia-Cotisel, J. Zsako, E. Chifu, Ann. Chim. (Rome), 1981, 71(3), 189.<br />
31. G. Chimote, R. Banerjee, Colloids Surf. B, 2008, 65, 120.<br />
32. S. Yokoyama, Y. Ohta, H. Sakai, M. Abe, Colloids Surf. B, 2004, 34, 65.
PROCAINE EFFECTS ON SURFACE TOPOGRAPHY OF SPREAD DIPALMITOYL …<br />
33. M. Tomoaia-Cotisel, Convergence of Micro-Nano-Biotechnologies, Series in<br />
Micro and Nanoengineering, Vol. 9, Editors: M. Zaharescu, E. Burzo, L. Dumitru,<br />
I. Kleps, D. Dascalu, Romanian Aca<strong>de</strong>my Press, Bucharest, 2006, 147.<br />
34. K. Hoda, Y. Ikeda, H. Kawasaki, K. Yamada, R. Higuchi, O. Shibata, Colloids<br />
Surf. B, 2006, 52, 57.<br />
35. Gh. Tomoaia, M.Tomoaia-Cotisel, A. Mocanu, O. Horovitz, L.-D. Bobos,<br />
M. Crisan, I. Petean, J. Optoelectron. Adv. Materials, 2008, 10(4), 961.<br />
35
STUDIA UNIVERSITATIS BABES-BOLYAI, CHEMIA, LIV, 1, 2009<br />
Dedicated to Professor Liviu Literat, at his 80 th anniversary<br />
SOME ASPECTS REGARDING MICROWAVE DRYING OF<br />
MATERIALS<br />
BARBU RADU HORAŢIU MIŞCA a , DORIN MANCIULA b<br />
ABSTRACT. The paper presents the experimental results of microwave<br />
drying for a granular material (siliceous sand). Drying kinetics and effective<br />
power absorbed by the material for two cases: compact volume (bulk) and<br />
exten<strong>de</strong>d volume (layer) were <strong>de</strong>termined and analyzed.<br />
Keywords: microwaves, drying, thermal properties, heat transfer, power transport.<br />
INTRODUCTION<br />
Traditionally, drying of solid materials is carried out by convective<br />
heating, transferring the thermal energy from the heater to the heated material.<br />
The penetration of this energy into material <strong>de</strong>pends on the thermal<br />
conductivity of the material. While the material dries, the thermal and mass<br />
conductivity <strong>de</strong>crease. As a result, the penetration of the <strong>de</strong>livered heat is<br />
reduced progressively, and water is slower transferred to surface layers, where<br />
evaporation occurs. Consequently, the surface layers become overheated<br />
and it may even produce a crust, which will need to be mechanically broken<br />
up to transfer the dried material to shipping containers.<br />
To increase the effectiveness of the drying process it is necessary<br />
to employ various tricks, such as stirring the substance, drying in fluidized<br />
bed etc. Normally this requires high power consumption.<br />
Drying un<strong>de</strong>r microwave irradiation presents several advantages<br />
comparative to convective drying. The main advantages consist on high<br />
conversion of microwave energy into thermal energy, in<strong>de</strong>pen<strong>de</strong>nce on thermal<br />
conductivity and selectivity [1]. In the same time, the influence of the<br />
resistance of the boundary layer between the material and drying air, as<br />
well as the thermal conductive transport through the material are eliminated,<br />
un<strong>de</strong>r microwave irradiation heating occurring simultaneously in whole volume<br />
of the heated material.<br />
a Universitatea Babeş-Bolyai, <strong>Facultatea</strong> <strong>de</strong> <strong>Chimie</strong> <strong>şi</strong> <strong>Inginerie</strong> <strong>Chimică</strong>, Str. Kogălniceanu<br />
Nr. 1, RO-400084 Cluj-Napoca, Romania, miscar@chem.ubbcluj.ro;<br />
b Universitatea Babeş-Bolyai, <strong>Facultatea</strong> <strong>de</strong> Ştiinţa Mediului, Str. Kogălniceanu Nr. 1, RO-<br />
400084 Cluj-Napoca, Romania, dimro21@gmail.com
38<br />
BARBU RADU HORAŢIU MIŞCA, DORIN MANCIULA<br />
Equipments used in microwave drying are relatively simple and can<br />
be easily adapted to the variable conditions; have no thermal inertia, therefore<br />
can quickly reach natural regime of operation; the volume of all installation<br />
is small and that for needs no large space.<br />
The disadvantages of the method are: high exploitation costs and<br />
limited using field.<br />
Depending on the type of radiation and material nature, when one<br />
irradiates solids with microwaves, the microwaves can be reflected, absorbed,<br />
or simply pass through the sample with no absorption occurring [2, 3].<br />
Through vibration, elongation and successive contraction of bounds and<br />
atoms, the radiant energy is transformed into heat which propagates from<br />
the warmest zones towards the col<strong>de</strong>st zones through convection and<br />
conduction mechanisms.<br />
During the microwave drying process in many cases the material<br />
being dried does not absorb or absorb a low level of microwave irradiation<br />
but the water molecules associated with it do. Thus the microwave drying<br />
process is caused by the property of water to absorb microwave irradiation.<br />
Consequently, removing of the water molecules from the drying materials<br />
eliminates the heating effect. In such a way the microwave drying appears<br />
to be self-regulative process.<br />
Microwave irradiation consists in electromagnetic wave in the range<br />
300 MHz to 300 GHz that corresponds to wavelengths of 1 cm to 1 m, and<br />
frequency between 2450 kHz - 434, 915 MHz, being <strong>de</strong>fined by international<br />
regulations. The microwave region of the electromagnetic spectrum lies<br />
between infrared and radio frequencies [4].<br />
In or<strong>de</strong>r to avoid local heating if the material is keeping static,<br />
shifting of material into irradiated space is necessary to be applied [5].<br />
RESULTS AND DISCUSSION<br />
Preliminary results obtained by the heating of water un<strong>de</strong>r microwave<br />
irradiation in two situations: compact volume (beakers) and exten<strong>de</strong>d volume<br />
(trays), at different power levels of the microwave oven are shown in Table<br />
1 and Table 2.<br />
Table1. Water temperature in beaker during microwave heating<br />
Time<br />
[minutes]<br />
L Level<br />
[ 0 C]<br />
ML Level<br />
[ 0 C]<br />
M Level<br />
[ 0 C]<br />
MH Level<br />
[ 0 C]<br />
H Level<br />
[ 0 C]<br />
0 20 20 21 20 21<br />
1 28 27 54 77 96<br />
0 20 20 20 21 20<br />
2 35 60 88 94 -<br />
0 20 20 20 20 20<br />
3 41 77 - - -<br />
0 20 21 20 20 20<br />
4 45 90
SOME ASPECTS REGARDING MICROWAVE DRYING OF MATERIALS<br />
Table1. Water temperature in beaker during microwave heating (continuation)<br />
Time<br />
[minutes]<br />
L Level<br />
[ 0 C]<br />
ML Level<br />
[ 0 C]<br />
M Level<br />
[ 0 C]<br />
MH Level<br />
[ 0 C]<br />
H Level<br />
[ 0 C]<br />
0 20 20 20 20 20<br />
5 50 - - - -<br />
0 20 20 20 20 20<br />
6 60 - - - -<br />
L = low level; ML = medium - low level; M = medium level; MH = medium - high level; H = high level.<br />
Table 2. Water temperature in tray during microwave heating<br />
Time<br />
[minutes]<br />
L Level<br />
[ 0 C]<br />
ML Level<br />
[ 0 C]<br />
M Level<br />
[ 0 C]<br />
MH Level<br />
[ 0 C]<br />
0 20 20 20 20<br />
1 35 42 55 70<br />
0 20 20 20 20<br />
2 37 55 69 77<br />
0 21 21 21 21<br />
3 43 63 77 -<br />
0 21 21 21 21<br />
4 47 64 75 -<br />
0 21 21 21 21<br />
5 50 68 - -<br />
0 21 21 21 21<br />
6 56 - - -<br />
Each temperature is the average of at least three measurements<br />
carried out in the same conditions.<br />
Consi<strong>de</strong>ring the difference of temperature between initial moment<br />
and final moment of each heating experiment, the effective power absorbed<br />
by water can be <strong>de</strong>termined by the relation [4]:<br />
Pef = (m water cp water·ΔT water /τ),<br />
where: m water is the mass of heated water, 100 [g] = 0.1 [kg]; cp water - specific<br />
heat of water 4,185 [J/kg 0 K]; ΔT water - difference of temperature between<br />
the initial moment and the final moment of the heating process [ 0 K]; and τ -<br />
irradiation time [ s].<br />
The resulted values are presented in Table 3 and Table 4.<br />
Table 3. The effective power absorbed by water during microwave heating in beaker<br />
Heating time L Level ML Level M Level MH Level H Level<br />
[min] [W] [W]<br />
[W]<br />
[W]<br />
[W]<br />
1 55.8 128.825 230.175 397.575 523.125<br />
2 48.825 129.5 237.16 372.025 -<br />
3 48.825 123.212 - - -<br />
4 43.594 120.319<br />
5 43.245 - - - -<br />
6 46.5 - - - -<br />
Pef av 47.798 125.464 233.667 384.480 523.125<br />
39
40<br />
BARBU RADU HORAŢIU MIŞCA, DORIN MANCIULA<br />
Table 4. The effective power absorbed by water during microwave heating in tray<br />
Heating time L Level ML Level M Level<br />
H Level<br />
[min]<br />
[W]<br />
[W]<br />
[W]<br />
[W]<br />
1 140.625 153.450 244.125 348.75<br />
2 59.287 122.0625 170.8875 198.7875<br />
3 51.15 97.650 - -<br />
4 45.3375 74.98125 - -<br />
5 40.455 - - -<br />
6 40.6875 - - -<br />
Pef av 62.923 112.0575 207.5 273.76875<br />
It is easy to see that calculated values of effective power increase<br />
with the increase of power level of the microwave oven and generally, the<br />
effective absorbed power is higher for compact volume (in backer) that for<br />
exten<strong>de</strong>d volume (in tray).<br />
Temperature variation during microwave irradiation of siliceous sand<br />
(tested material) in both cases analyzed earlier (compact and exten<strong>de</strong>d<br />
volume) are shown in Figure 1 and Figure 2.<br />
Temperature [grd C]<br />
Temperature variation in compact volume<br />
120<br />
100<br />
80<br />
60<br />
40<br />
20<br />
0<br />
0 2 4 6 8<br />
Time [minutes]<br />
Tr L Temp [grd C]<br />
Tr ML Temp [grd C]<br />
Tr M Temp [grd C]<br />
Tr MH Temp [grd C]<br />
Tr H Temp [grd C]<br />
Figure 1. Temperature variation during microwave drying of sand in compact volume.<br />
It can be seen that the temperature curves increase continuously,<br />
with a faster rhythm for higher power level of the microwave oven and with<br />
a slower rhythm for lower power level. In the same time the temperature<br />
increase slower in the case of exten<strong>de</strong>d volume comparative to compact<br />
volume. This phenomenon can be attributed to the higher heat lost into the<br />
chamber environment, which remains cold and does not increase its<br />
temperature, surface area exposed by tray was 181.366 cm 2 , comparative<br />
to surface area exposed by backer, 28.6 cm 2 .
Temperature [grd C]<br />
SOME ASPECTS REGARDING MICROWAVE DRYING OF MATERIALS<br />
Temperature variation in exten<strong>de</strong>d volume<br />
120<br />
100<br />
80<br />
60<br />
40<br />
20<br />
0<br />
0 2 4 6 8 10 12<br />
Time [minutes]<br />
Tr L Temp [grd C]<br />
Tr ML Temp [grd C]<br />
Tr M Temp [grd C]<br />
Tr MH Temp [grd C]<br />
Figure 2. Temperature variation during microwave drying of sand in exten<strong>de</strong>d volume.<br />
Regarding the effective power absorbed by siliceous sand, it was<br />
measured an almost constant power in the case of compact volume. The<br />
effective power absorbed by the sand <strong>de</strong>creases progressively with a<br />
ten<strong>de</strong>ncy of stabilization in the case of exten<strong>de</strong>d volume (Figure 3). An<br />
explanation for such behavior of the system could not be found.<br />
Figure 3. The effective power absorbed by the sand in exten<strong>de</strong>d volume.<br />
Kinetic curves of drying for compact volume and for exten<strong>de</strong>d volume<br />
samples at lower power level of the microwave oven are shown in Figure 4<br />
and 5. These curves present the variation in time of several characteristics<br />
of the system: weight, temperature and humidity.<br />
During the microwave irradiation the sand temperature follows a<br />
ten<strong>de</strong>ncy similar to the heating of water alone; the weight of the samples<br />
diminishes similarly in both situations.<br />
41
42<br />
BARBU RADU HORAŢIU MIŞCA, DORIN MANCIULA<br />
Figure 4. Drying curves for sand in compact volume.<br />
Figure 5. Drying curves for sand in exten<strong>de</strong>d volume.<br />
To compare the results of microwave drying of sand in compact and<br />
exten<strong>de</strong>d volume, Figures 6, 7 and 8 are plotted.<br />
Figure 6. Weight variation for compact and exten<strong>de</strong>d volume.
SOME ASPECTS REGARDING MICROWAVE DRYING OF MATERIALS<br />
Figure 6 shows a <strong>de</strong>crease of the weight almost linear in both<br />
cases. The <strong>de</strong>tected difference between the curves can be attributed to the<br />
weight difference of the containers: 2, 4 g for beaker and 7, 7 g for tray,<br />
which means that the weight of containers can influence the drying process;<br />
containers heat up only by conduction.<br />
Temperature [C]<br />
100<br />
80<br />
60<br />
40<br />
20<br />
Comparison betw een compact and exten<strong>de</strong>d volume<br />
0<br />
0 20 40 60<br />
Time [minutes]<br />
Temp mat [C] VE<br />
Temp material [C]<br />
VC<br />
Figure 7. Temperature variation for compact and exten<strong>de</strong>d volume.<br />
The evolution in time of temperature plotted in Figure 7 shows for<br />
exten<strong>de</strong>d volume a lower increase than in the case of compact volume. In<br />
both cases, at the end of the process, the temperature <strong>de</strong>crease more slowly,<br />
due to the <strong>de</strong>crease of the water quantity in the material.<br />
The slope of the curves suggests the i<strong>de</strong>a of using exten<strong>de</strong>d<br />
volumes in case of temperature-sensitive materials. In this way, these materials<br />
are less affected by the temperature and due to the higher heat lost, the<br />
material cooling occurs more rapidly.<br />
Figure 8. Drying kinetics for sand in compact and exten<strong>de</strong>d volume.<br />
43
44<br />
BARBU RADU HORAŢIU MIŞCA, DORIN MANCIULA<br />
The drying rate, in terms of water amount eliminated per unit of time<br />
and surface, [g/cm 2 ·min] or in international system IS [kg/m 2 ·s], shows the<br />
rhythm of humidity elimination (Figure 8). It can be seen a relatively constant<br />
loss of humidity in the case of exten<strong>de</strong>d volume. In the case of compact<br />
volume, the drying rate presents higher variation. The following observations<br />
were ma<strong>de</strong>: in the first stage, the drying rate is reduced because of the heat<br />
lost by convection in the cold environment; at the end, the diminution of the<br />
rate is due to a <strong>de</strong>crease of the humidity amount.<br />
This behavior was explained by the followings facts:<br />
- during the first stage, the material is intensely heated and the<br />
losses to the external environment are diminished due to the smaller<br />
contact surface of the material to the cold environment;<br />
- the heat of the material mass is near to the water boiling point<br />
value and this generates an intense evaporation and also water boiling.<br />
The generation of a larger amount of vapors indicates a higher drying rate,<br />
associated to material splash because of energetic formation and evacuation<br />
of steams (this phenomenon was experimentally observed);<br />
- reaching of a minimum drying rate was explained by the formation<br />
of a "coating" of relatively dry material, which is difficult to be penetrated by<br />
the generated water vapors;<br />
- the barrier penetration <strong>de</strong>termines a growth of the released vapor<br />
amount, specifically an increase of the drying rate, but since the vapor<br />
amount is smaller, a maximum rate due to vaporization cannot be reached.<br />
In addition, the material temperature <strong>de</strong>crease contributes to this phenomenon;<br />
- the <strong>de</strong>crease of the drying rate is attributed to the <strong>de</strong>crease of the<br />
material humidity amount in a relatively constant rhythm (Figure 9).<br />
Figure 9. Comparison of humidity losses.
CONCLUSIONS<br />
SOME ASPECTS REGARDING MICROWAVE DRYING OF MATERIALS<br />
Microwave heating was experimentally studied using a household<br />
microwave oven, type CANDY-CMG-2180-M, in or<strong>de</strong>r to obtain useful<br />
experimental information, special for improving the process of the drying<br />
operation.<br />
Effective emitted power of the generator and the power absorbed by<br />
the material were <strong>de</strong>termined. Effective absorbed power was constant in the<br />
case of compact volume, while in the case of exten<strong>de</strong>d volume the effective<br />
absorbed power was progressively <strong>de</strong>creased, showing a stabilization<br />
ten<strong>de</strong>ncy. An explanation for such system behavior was not found.<br />
During microwave drying the temperature of the tested material has<br />
shown a continuous increase. The smaller increase of the temperature in<br />
the case of exten<strong>de</strong>d volume was attributed to the heat lost in the chamber<br />
environment. In the same time, the obtained results suggest the i<strong>de</strong>a of<br />
using exten<strong>de</strong>d volumes in case of temperature-sensitive materials.<br />
The humidity was reduced with relatively constant rate in the case<br />
of exten<strong>de</strong>d volume and with variable rate, in the case of compact volume.<br />
EXPERIMENTAL SECTION<br />
The drying process un<strong>de</strong>r microwave field was monitored in or<strong>de</strong>r to<br />
obtain valid experimental data that may be useful for the drying process<br />
improvement. The experimental measurements were focused on:<br />
1. Determination of the technical characteristics of the equipment<br />
and<br />
2. Determination of drying kinetics and effective absorbed energy.<br />
In or<strong>de</strong>r to <strong>de</strong>termine technical characteristics of the equipment, a<br />
household microwave oven, type CANDY CMG 2180 M was used. The<br />
technical features presented by the manufacturer in the technical book are:<br />
Supply voltage 220 - 230 V;<br />
Network Frequency 50 Hz;<br />
Generator working frequency 2450 Hz;<br />
Absorbed power from the network 1300 W;<br />
Emission power 800 W;<br />
Chamber sizes 300 x 295 x 205 mm;<br />
Useful volume 21 dm 3 ;<br />
Turntable diameter 270 mm;<br />
5 power levels<br />
45
46<br />
BARBU RADU HORAŢIU MIŞCA, DORIN MANCIULA<br />
Preliminary measurements were ma<strong>de</strong> in or<strong>de</strong>r to <strong>de</strong>termine the<br />
"active" power emitted by the generator of the microwave oven and absorbed<br />
by water.<br />
The working method: 100 ml of water were introduced in the shockabsorbing<br />
polystyrene container. Two types of containers are used: backers<br />
for compact volume experiment and trays for exten<strong>de</strong>d volume. Parameters<br />
of containers at microwave heating tests were:<br />
- beaker: truncated cone shape, small base (at the bottom), diameter<br />
∅ 45 mm; large base (up) diameter ∅ 60 mm; and height 50 mm,<br />
- tray: cylin<strong>de</strong>r of negligible height, and diameter ∅ 152 mm.<br />
Simple shock-absorbing polystyrene beakers and trays were chosen<br />
due to the following reasons: they are compatible with the microwave radiations<br />
and their effects; the shock-absorbing polystyrene does not warm up un<strong>de</strong>r<br />
the microwave action; they have a reduced weight and their mass is<br />
negligible in thermal subsequent calculations; the subsequent error entered<br />
is minor (the beaker mass is 2.4 g, and the tray mass is 7.7 g); it provi<strong>de</strong>s<br />
two significant forms for the drying process: compact volume and exten<strong>de</strong>d<br />
volume with a larger exposed surface to microwaves.<br />
The initial water temperature was measured and then the container<br />
was introduced in the chamber of the oven. A power level was selected and<br />
then the material was irradiated for a <strong>de</strong>termined period of time. The water<br />
temperature was measured at the end of the established time. Each experiment<br />
was repeated at least 3 times. This condition is necessary because of the<br />
special structure of the <strong>de</strong>vice, which has a power limiter mechanism that<br />
interrupts the microwave generation process when the generator is overheated.<br />
Therefore, the microwaves generation is not continuous; the limiter has the<br />
purpose of protecting the equipment against overheating.<br />
In or<strong>de</strong>r to <strong>de</strong>termine the drying kinetics, direct measurements were<br />
carried out using a synthetic blend consisting of siliceous sand and water.<br />
This blend was introduced in: beaker for compact volume experiment, and<br />
tray for exten<strong>de</strong>d volume experiment.<br />
The working procedure was as follows: 95 g of siliceous sand were<br />
introduced in the container; the sand was consi<strong>de</strong>red as "perfectly dried"<br />
due to the drying in the oven at 105 0 C for 8 hours. 35 ml of water were ad<strong>de</strong>d<br />
to the sand. This amount is sufficient to cover all the sand in the container.<br />
Thus, it is possible to <strong>de</strong>tect a phenomenon similar to that observed during<br />
the period I of the convective drying in constant conditions.<br />
The material was irradiated with microwaves; e.g. "low level, L", and<br />
the temperature and weight of material were regularly measured.
SOME ASPECTS REGARDING MICROWAVE DRYING OF MATERIALS<br />
REFERENCES<br />
1. O. Floarea, Gh. Jinescu, “Proce<strong>de</strong>e intensive în operaţiile unitare <strong>de</strong> transfer”;<br />
Ed. Tehnică, Bucureşti, 1975, 139.<br />
2. A. J. B. Fuller, “Microwaves: an Introduction to Microwave Theory and<br />
Technology”, Pergamon Press, Inc., Oxford, 1994.<br />
3. B. R. H. Mişca, A. Ozunu, “Introducere in ingineria mediului”, Ed. Presa<br />
Universitara Clujeană, 2006, 111.<br />
4. H. M. Silaghi, “Tehnologii cu microun<strong>de</strong>”; Ed. Teora, Bucureşti, 2001, 28.<br />
5. A. Ba<strong>de</strong>a, H. Necula, M. Stan, L. Ionescu, P. Blaga, G. Darie, “Echipamente<br />
<strong>şi</strong> instalaţii termice, Ed. Tehnică, Bucureşti, 2003, 530.<br />
47
STUDIA UNIVERSITATIS BABES-BOLYAI, CHEMIA, LIV, 1, 2009<br />
Dedicated to Professor Liviu Literat, at his 80 th anniversary<br />
CHEMICAL RISK AREA ESTIMATION AS A TOOL FOR<br />
EFFICIENT EMERGENCY PLANNING<br />
ZOLTÁN TÖRÖK a , NICOLAE AJTAI, ALEXANDRU OZUNU<br />
ABSTRACT. Chemical disaster management has two essential components:<br />
Chemical Risk Management (CRM) and Emergency Situations Management<br />
(ESM). The connection between these two major elements is represented by the<br />
risk area estimations. Risk area estimations are an important tool in the process<br />
of Risk Assessment. It provi<strong>de</strong>s the authorities responsible with intervention in<br />
case of a major chemical acci<strong>de</strong>nt, accurate and <strong>de</strong>tailed information on the site,<br />
weather conditions, hazardous chemicals involved, and their dispersion patterns<br />
aiding in the <strong>de</strong>velopment of Emergency Response Plans. The paper presents<br />
an overview of the Chemical Disaster Management process and a comparative<br />
case study of a possible chemical acci<strong>de</strong>nt involving chlorine.<br />
Keywords: chemical risk assessment, risk analysis, consequence maps, chlorine<br />
INTRODUCTION<br />
The technological processes that involve dangerous substances are<br />
known to have high risk levels, due to their capability to produce major<br />
acci<strong>de</strong>nts. These acci<strong>de</strong>nts can occur during the process, storage and<br />
transportation, releasing a large quantity of energy or substance which can<br />
harm humans or the environment, and lead to technological disasters.<br />
Therefore the need for strict regulations arises, in or<strong>de</strong>r to prevent<br />
these disasters form occurring with the active participation of the industry, the<br />
authorities and the general public. The regulatory organism in the field of major<br />
industrial acci<strong>de</strong>nts involving dangerous substances is the European Union by<br />
the 2003/105/CE Directive, also called the Seveso III Directive [1].<br />
Chemical disaster management has two essential components:<br />
Chemical Risk Management (CRM) and Emergency Situations Management<br />
(ESM), Figure 1.<br />
a Universitatea Babeş-Bolyai, <strong>Facultatea</strong> <strong>de</strong> Ştiinţa Mediului,Str. Kogălniceanu, Nr. 1, RO-400084,<br />
Cluj-Napoca, Romania, torokzoltan@yahoo.com
ZOLTÁN TÖRÖK, NICOLAE AJTAI, ALEXANDRU OZUNU<br />
CRM can be consi<strong>de</strong>red as a combination of all the processes necessary<br />
to control chemical risk: risk analysis, risk evaluation, cost-benefit analysis,<br />
and change management. On the other hand ESM focuses on managing<br />
these events once they have occurred. ESM inclu<strong>de</strong>s: internal and external<br />
emergency plans, emergency response, and post-emergency recovery.<br />
Figure 1. Disaster Management Scheme.<br />
Risk analysis starts with the i<strong>de</strong>ntification of the hazards present or<br />
likely to be formed in the process, dangerous conditions that are present or<br />
could be generated failures of certain parts of the process or process control<br />
system, and human errors. After the i<strong>de</strong>ntification of the hazards and estimation<br />
of the likelihood of these hazardous events and an evaluation of the effects<br />
and possible consequences to humans, environment and for structures is<br />
nee<strong>de</strong>d.<br />
In risk analysis certain questions need to be addressed:<br />
- What weaknesses could occur in the security management<br />
system?<br />
- What preventive measures can be taken in or<strong>de</strong>r to control the<br />
risk factor?<br />
- How are these actions monitored?<br />
The qualitative part of risk analysis focuses on i<strong>de</strong>ntifying the risks,<br />
possible failure cases, using methods like:<br />
- Preliminary Hazard Analysis (PHA), was <strong>de</strong>veloped according to<br />
military standards in this field, and can be applied in the preliminary<br />
project phases. It focuses on the main areas that might contain<br />
dangerous substances, and on the main equipments, and monitors<br />
the possible failure points where dangerous substances or energies<br />
could be released.<br />
50
CHEMICAL RISK AREA ESTIMATION AS A TOOL FOR EFFICIENT EMERGENCY PLANNING<br />
- “What If?” method, poses a series of questions in or<strong>de</strong>r to <strong>de</strong>termine<br />
unexpected events in the system.<br />
- Checklists i<strong>de</strong>ntify known and predictable risks using standards.<br />
Some of the more relevant techniques are: DSF – Diagnosis<br />
Safety Form, DCT – Diagnostique et Conditions <strong>de</strong> Travail, SDQ –<br />
Safety Diagnosis Questionnaire.<br />
- Hazard and Operability studies (HAZOP), is <strong>de</strong>signed to i<strong>de</strong>ntify<br />
safety and operability problems using a systematic and structured<br />
approach by a multidisciplinary team. Using brainstorming and<br />
certain keywords <strong>de</strong>viations in the process from the normal<br />
functioning are i<strong>de</strong>ntified, their causes and consequences on the<br />
process, humans and environment are evaluated qualitatively.<br />
HAZOP is one of the most used methods in technological hazard<br />
evaluation.<br />
- Failure Mo<strong>de</strong>s and Effects Analysis (FMEA) <strong>de</strong>termines how the<br />
failures of certain system components affect the optimum system<br />
performance. This ensures that proper safety measures are taken<br />
and safety systems are installed. The FMEA is a complementary<br />
analysis of Layer Of Protection Analysis (LOPA).<br />
The qualitative methods focus mainly on i<strong>de</strong>ntifying the possible hazards<br />
and are usually followed by a more thorough quantitative analysis (QRA).<br />
In or<strong>de</strong>r to quantify the risk historical data or mathematical algorithms<br />
can be used to estimate probabilities of failures and frequencies of acci<strong>de</strong>ntal<br />
scenarios. Proper safety measures can be applied efficiently only after a<br />
thorough quantitative risk analysis. QRA is the starting point for more complex<br />
processes like Land-use Planning, and Emergency Planning. High quality data<br />
also provi<strong>de</strong>s <strong>de</strong>cision-makers with accurate information about the situation.<br />
Vulnerability (V [-]) should be introduced in the risk formula shown below:<br />
R= F x C x V [loss/year]<br />
where F [event/year] is the frequency of the event and C [loss/event]<br />
represents the magnitu<strong>de</strong> of the consequences [2].<br />
Consequence analysis relies on theoretical mo<strong>de</strong>ls to simulate events<br />
like release, dispersion, fire and explosion of different hazardous materials.<br />
Generally, risk assessment methods begin with the i<strong>de</strong>ntification of hazards<br />
and vulnerabilities. Consequence based risk analysis has an approach that<br />
starts with the i<strong>de</strong>ntification of the major consequences by analyzing the<br />
potential acci<strong>de</strong>nt scenarios and the effects of the acci<strong>de</strong>nts upon the<br />
environment, human factor and structures. Then the process searches for<br />
combinations of hazard and vulnerability that could result in the most<br />
serious consequences.<br />
51
52<br />
ZOLTÁN TÖRÖK, NICOLAE AJTAI, ALEXANDRU OZUNU<br />
The advantage of the consequence based risk analysis is that it will<br />
show how qualitative threat, vulnerability and consequence information can<br />
be combined to <strong>de</strong>rive a qualitative value for risk and offer an easy-toun<strong>de</strong>rstand<br />
graphical way to present risk assessment results [3].<br />
Assessment of vulnerability<br />
Vulnerability can be <strong>de</strong>fined as the proneness to experience adverse<br />
impacts or failures, or as the characteristics of a person or a group to anticipate,<br />
cope, resist and recover after a hazardous impact. Vulnerability involves a<br />
combination of factors which <strong>de</strong>termine the level of the hazard for health,<br />
life, and damage of property following an inci<strong>de</strong>nt.<br />
Quantitatively the vulnerability can be expressed as a number<br />
between 0-1 or 0%-100%.<br />
The vulnerability <strong>de</strong>pends on the infrastructure and socio-economical<br />
conditions of the area. With reducing the hazards we are reducing the<br />
vulnerability, too. In many cases the increased number of victims is not due to<br />
bigger hazards, but the amplification of vulnerability of population. Some<br />
social groups are more vulnerable than others, in function of sex, age,<br />
corporeal condition etc.<br />
A major component of a risk assessment is assessing the area’s<br />
vulnerability to hazards. Regional vulnerability is <strong>de</strong>termined by evaluating<br />
hazard exposure and coping capacity. For <strong>de</strong>termining the vulnerability it<br />
can be selected a set of indicators. In case of technological disasters these<br />
indicators can differ from one case to another, <strong>de</strong>pending on the possible<br />
acci<strong>de</strong>nt consequences [4].<br />
Mitigation of vulnerability is strongly correlated with socioeconomic<br />
<strong>de</strong>velopment, and with social stability. Therefore it can be used to reduce<br />
the causes of environmental vulnerability, not only the consequences in<br />
terms of disastrous casualties and losses [5].<br />
The mo<strong>de</strong>ling and simulation of chemical acci<strong>de</strong>nts<br />
In general, mo<strong>de</strong>ls can be used to measure and represent; <strong>de</strong>scribe<br />
structure, behavior and pattern; reconstruct past or predict future behavior;<br />
generate and test theories and hypotheses [6].<br />
Consequence assessment and mo<strong>de</strong>ling is based on mo<strong>de</strong>ls for<br />
source-term <strong>de</strong>finition, dispersion calculations, fire and explosion, and finally<br />
vulnerability estimation of health effects [1].<br />
The most important issue in simulation of chemical acci<strong>de</strong>nts is to<br />
find the right mo<strong>de</strong>l which fits to the purpose of the study. For example,<br />
different mo<strong>de</strong>ls should be used in case of a toxic dispersion simulation for
CHEMICAL RISK AREA ESTIMATION AS A TOOL FOR EFFICIENT EMERGENCY PLANNING<br />
flat and complex terrain. Two dimensional mo<strong>de</strong>ls can be applied for short<br />
distances where the topography of the terrain is not significant. 3D dispersion<br />
mo<strong>de</strong>ls are very useful for major releases above complex topography terrain.<br />
One of these 3D mo<strong>de</strong>ling systems is the SEVEX (SEVeso EXPert)<br />
system, which is built from three different parts:<br />
- The SEVEX-Meso is a complex 3D terrain and meteorological<br />
mo<strong>de</strong>l which solves the Navier-Stokes equations, consi<strong>de</strong>ring the<br />
terrain roughness (the topography of the terrain), the land use of<br />
the terrain (five categories: water, forest, urban, grass-land and<br />
the mixture of the previous four) and the solar radiation and heat<br />
transfer between the ground and the atmosphere.<br />
- The SEVEX-Toxic module is a Lagrangian 3D dispersion mo<strong>de</strong>l<br />
that simulates the passive transport and dispersion of toxic and<br />
flammable material.<br />
- The SEVEX-Source module simulates different types of releases<br />
and the effects of acci<strong>de</strong>nts. These three modules combined in<br />
SEVEX View software compute the worst-case realistic conditions<br />
of an acci<strong>de</strong>nt. SEVEX View is the only software that consi<strong>de</strong>rs both<br />
the SEVESO directives of the European Commission, and U.S.<br />
EPA gui<strong>de</strong>lines. The software was built to simulate major industrial<br />
acci<strong>de</strong>nts, so the mo<strong>de</strong>l is <strong>de</strong>signed for impact zones from 1 to 18<br />
km. The software was <strong>de</strong>veloped by the Lakes Environmental<br />
Software from Canada, in collaboration with ATM-Pro, Belgium [7].<br />
A very popular mo<strong>de</strong>l is the SLAB atmospheric dispersion mo<strong>de</strong>l for<br />
<strong>de</strong>nser-then-air releases over flat terrain. This mo<strong>de</strong>l does not calculate<br />
source emission rates. It assumes that all source input conditions have been<br />
<strong>de</strong>termined before. The current version of the SLAB mo<strong>de</strong>l treats the following<br />
situations: instantaneous releases, finite and continuous releases from<br />
different sources like evaporating pools on land, horizontal or vertical jets, and<br />
instantaneous or short-duration evaporating pool on ground level.<br />
The atmospheric dispersion of the released gas is calculated by solving<br />
the mass, heat and momentum flux conservation equations. The mathematical<br />
mo<strong>de</strong>l is based on the theory of the superficial layer. The <strong>de</strong>scription of the<br />
variation that occurs in the gas plume is given by a differential equation system<br />
based on the total mass conservation and for the components, on the heat and<br />
impulse conservation for the three directions. The mo<strong>de</strong>l is completed with the<br />
equations which <strong>de</strong>scribe the shape of the vapor cloud and physical<br />
equations [8]. The SLAB View software is the windows interface for the SLAB<br />
mo<strong>de</strong>l and it was created by the Lakes Environmental Software in Canada.<br />
53
54<br />
ZOLTÁN TÖRÖK, NICOLAE AJTAI, ALEXANDRU OZUNU<br />
Comparative analysis of a possible acci<strong>de</strong>nt<br />
In the followings are presented simulations of a chemical acci<strong>de</strong>nt<br />
involving major liquefied chlorine release from storage vessel, a comparison<br />
between results obtained with 2D SLAB dispersion mo<strong>de</strong>l and 3D SEVEX<br />
mo<strong>de</strong>l.<br />
The selected site is located at a height of 150 m above sea level, at<br />
10 km from the city of Ramnicu-Valcea, Romania, on the right si<strong>de</strong> of the<br />
Olt River on an alluvial terrace 7 meters above Govora Lake. The facility is<br />
2 km long and 1,5 km wi<strong>de</strong>. The site is surroun<strong>de</strong>d by hills with a maximum<br />
altitu<strong>de</strong> of 450 m, and the mean absolute altitu<strong>de</strong> is 150 m.<br />
With the building of the dams on the Olt valley, the surface covered<br />
by water increased, resulting in an increase of the relative humidity in the<br />
site’s area, with a mean of 76%. The total annual precipitation in the area is<br />
710,5 mm.<br />
The wind circulation, both direction and speed, are influenced by the<br />
area’s landscape. The Olt Valley has an obvious funneling effect, the highest<br />
wind frequencies occurring from the North (10,2%) and South (13%). The<br />
atmospheric calm situation has the highest occurrence rate (37,4%). The mean<br />
wind speed varies between 0.8 and 2 m/s. The dominant atmospheric stability<br />
conditions are class D (neutral), E (slightly stable) and F (stable) [9].<br />
Simulations of the acci<strong>de</strong>nt have been performed consi<strong>de</strong>ring the<br />
meteorological “worst case scenario”, for daytime, with a complete cloud cover,<br />
a 70% relative humidity, stability class D, ambient temperature of 20 o C, and<br />
for nighttime with no cloud cover, a 90% relative humidity, stability class F,<br />
ambient temperature of 10 o C.<br />
The storage vessel has the following technical characteristics:<br />
length, L = 11 m, diameter d = 3 m, maximum capacity of storage equal to<br />
90 tons of chlorine at 20 o C storage temperature, 80% filling level at 10 bar<br />
service pressure.<br />
The SEVEX simulation consi<strong>de</strong>rs the complex topography (GTOPO 30<br />
database) and the land use of the terrain (CORIN database), calculating the<br />
wind direction and velocity for every 1 km x 1 km square using a 2 m/s synoptic<br />
wind [7]. The wind speeds for 36 directions were computed, for every multiples<br />
of 10 o , from 0 o to 350 o . For this reason, the overall area of danger is estimated<br />
based on a discrete set of results, generating the so called plume fingers.<br />
RESULTS AND DISCUSSION<br />
In the followings are presented the consequence maps obtained<br />
from SEVEX and SLAB simulations, for the daytime scenario consi<strong>de</strong>ring<br />
the wind direction form S-SW and for the nighttime scenario from N-NE.<br />
These wind directions can be found most frequently in the area.
CHEMICAL RISK AREA ESTIMATION AS A TOOL FOR EFFICIENT EMERGENCY PLANNING<br />
Figure 2. SEVEX View simulation for daytime scenario.<br />
Figure 3. SEVEX View simulation for nighttime scenario.<br />
55
56<br />
ZOLTÁN TÖRÖK, NICOLAE AJTAI, ALEXANDRU OZUNU<br />
In the SLAB View simulations we used the source emission rates<br />
calculated by the SEVEX mo<strong>de</strong>l.<br />
The distances obtained for the following typical concentration levels<br />
after one hour exposure: LC50 (Lethal Concentration 50%) = 293 ppm, IDLH<br />
(Immediately Dangerous to Life or Health concentration) = 10 pmm and EEGL<br />
(Emergency and Continuous Exposure Guidance Level) [10], are presented in<br />
Table 1:<br />
Figure 4. SLAB View simulation for daytime scenario.<br />
Figure 5. SLAB View simulation for nighttime scenario.
CHEMICAL RISK AREA ESTIMATION AS A TOOL FOR EFFICIENT EMERGENCY PLANNING<br />
SEVEX<br />
SLAB<br />
Table 1. Distances for the concentration levels of concern<br />
Concentration level Daytime scenario Nighttime scenario<br />
LC50 651,9 m 1632,5 m<br />
IDLH 5042,3 m 6630,6 m<br />
EEGL 9780,8 m 9527,1 m<br />
Concentration level Daytime scenario Nighttime scenario<br />
LC50 357 m 443 m<br />
IDLH 5000 m 8880 m<br />
EEGL 10943 m > 15000 m<br />
The SEVEX mo<strong>de</strong>l consi<strong>de</strong>rs a possible fluctuation of 30 <strong>de</strong>grees in<br />
the wind direction and the results are presented consi<strong>de</strong>ring this wind sector.<br />
The distances obtained in SEVEX, shown in Table 1, are the highest values<br />
from this 30 <strong>de</strong>grees wind sector. The SLAB simulation consi<strong>de</strong>rs only one<br />
wind direction.<br />
As seen, the daytime simulation results regarding the maximum<br />
distances are showing pretty close values in both cases. There are major<br />
differences in the nighttime simulation results; the distances obtained with<br />
the SLAB mo<strong>de</strong>l are overestimated. The SLAB mo<strong>de</strong>l does not take into<br />
account the topography of the terrain; it assumes that the dispersion is over a<br />
flat terrain with a specific roughness. This can lead to over or un<strong>de</strong>restimation<br />
of danger zones for major releases, where the dispersion process can reach<br />
large distances.<br />
CONCLUSIONS<br />
The Chemical Risk Assessment is an important tool in the <strong>de</strong>velopment<br />
of Safety Reports and Emergency Plans. The combination of qualitative<br />
and quantitative analysis methods can offer a good solution for the estimation<br />
of risk zones.<br />
The aim of the Risk Analysis process is to reduce uncertainties by<br />
increasing safety levels by <strong>de</strong>veloping more efficient Emergency Plans for<br />
the restriction of insulation perimeters, offering immediate <strong>de</strong>cisions, <strong>de</strong>tailed,<br />
accurate and steady instructions.<br />
Simulations of a possible chemical acci<strong>de</strong>nt involving liquefied chlorine<br />
at a large storage facility have been preformed, and obtained dispersion results<br />
using two commercial software packages, SLAB View and SEVEX View.<br />
The simulations show that the situation could become extremely<br />
dangerous to the nearby inhabitants, therefore an efficient external emergency<br />
plan must be <strong>de</strong>veloped and according to the Seveso III directive, the population<br />
should be informed about the hazards involved, emergency individual and<br />
collective measures, warning and evacuation plans.<br />
57
58<br />
ZOLTÁN TÖRÖK, NICOLAE AJTAI, ALEXANDRU OZUNU<br />
In or<strong>de</strong>r to achieve this, high quality data is required, following the<br />
principle: “good quality data leads to good <strong>de</strong>cisions”. With the use of high<br />
performance software like SEVEX, we can aid the Romanian stakehol<strong>de</strong>rs<br />
and <strong>de</strong>cision makers with information in or<strong>de</strong>r to <strong>de</strong>velop efficient plans and<br />
policies.<br />
REFERENCES<br />
1. C. Kirchsteiger, M. D. Christou, G. A. Papadakis, Risk Asessment and<br />
management in the context of Seveso II Directive, Industrial Safety Series,<br />
Volume 6, Elsevier, 1998, chapter 2-4.<br />
2. Al. Ozunu, C. Anghel, “Evaluarea riscului tehnologic <strong>şi</strong> securitatea mediului”,<br />
Editura Accent, Cluj-Napoca, 2007.<br />
3. Z. Török, N. Ajtai, Al. Ozunu, Proceedings of the 35th International Conference<br />
of SSCHE, Publisher Slovak University of Technology, 2008.<br />
4. Al. Ozunu, Z. Török, V. Coşara, E. Cordoş, A. Dutrieux - Vulnerability Mitigation<br />
and Risk Assessment of Technological Disaster, NATO Security through<br />
Science Series, IOS Pres, Chisinau, 2007.<br />
5. P. Blaikie, T. Cannon, I. Davis, and B. Wisner, “At Risk: Natural Hazards,<br />
People's Vulnerability and Disasters”, London: Routledge, 1994, 320.<br />
6. A. J. Jakeman, A. A. Voinov, A. E. Rizzoli, S. H. Chen, “Environmental Mo<strong>de</strong>ling,<br />
Software And Decision Support”, Elsevier, The Netherlands, 2008, chapter 2.<br />
7. SEVEX View:<br />
http://www.atmpro.be/product.php?item=sevex_view&onglet=general<br />
8. D. L. Ermak, “User’s manual for slab: an atmospheric dispersion mo<strong>de</strong>l for<br />
<strong>de</strong>nser-than-air releases”, Livermore, California, USA, 1990.<br />
9. Ramnicu Valcea Extremal Emergency Plan, Romania, 2005.<br />
http://enviro.ubbcluj.ro/cercetare/ccpaim/Apell/pdf/Oltchim.pdf<br />
10. The National Institute for Occupational Safety and Health:<br />
http://www.cdc.gov/niosh/idlh/7782505.html
STUDIA UNIVERSITATIS BABES-BOLYAI, CHEMIA, LIV, 1, 2009<br />
Dedicated to Professor Liviu Literat, at his 80 th anniversary<br />
POWER PLANTS ASHES RECOVERY IN ECO-FRIENDLY<br />
MORTAR COMPOSITIONS<br />
LÁSZLÓ SZÉLL a , VALENTINA CETEAN b , TÓTH ANIKÓ a ,<br />
GAGEA LUCIA c , ROMAN CECILIA d , ROMAN MARIUS d ,<br />
GOG ADRIANA d<br />
ABSTRACT. The paper treats the possibilities to recover the wastes resulted<br />
by coal combustion in power plants. This issue is in the researchers attention<br />
because the power plant’s ashes represents the main waste in almost all<br />
European countries and the coal combustion will remain the most important<br />
source of energy. The greenhouse gas and the ashes have a huge impact on<br />
environment and the living species. In the experimental work the properties of<br />
five different mortars, realized with different proportion of ash were compared.<br />
Keywords: fly ash, concrete, mortar<br />
INTRODUCTION<br />
The main reason for the ash use is not only the low price, but also the<br />
technical and qualitative benefits brought to the products. Due to its puzzolanic<br />
activity the ash combine with calcium hydroxi<strong>de</strong> resulted from cement hydration<br />
giving birth in this way to cementitious materials which har<strong>de</strong>n in time and<br />
have similar properties with the cement hydration products [1-3]. Through<br />
this activity is reduced the calcium hydroxi<strong>de</strong> quantity in concrete which can<br />
leach in time by water providing cracks and voids. Thereby, the porosity and<br />
permeability of the concrete are reduced and the freeze-thaw resistance is<br />
increased, with other words the concrete is more durable.<br />
a<br />
S.C. Procema Cercetare S.R.L., Punct <strong>de</strong> lucru Cluj-Napoca, Str. Beiuşului, Nr. 1, RO-400394<br />
Cluj-Napoca, Romania, procema.cluj@clicknet.ro<br />
b<br />
S.C. Procema Geologi S.R.L., B-dul Preciziei, Nr.6, RO-062203 Bucureşti, Romania,<br />
procema.geologi@clicknet.ro<br />
c<br />
Universitatea Babeş-Bolyai, <strong>Facultatea</strong> <strong>de</strong> <strong>Chimie</strong> <strong>şi</strong> <strong>Inginerie</strong> <strong>Chimică</strong>, Str. Kogălniceanu, Nr. 1,<br />
RO-400084 Cluj-Napoca,Romania, gagea@chem.ubbcluj.ro<br />
d<br />
INCDO-INOE2000 filiala ICIA, str Donath, Nr. 67, RO-400293 Cluj-Napoca, Romania, icia@icia.ro
60<br />
L. SZÉLL, V. CETEAN, TÓTH A., GAGEA L., ROMAN C., ROMAN M., GOG A.<br />
Ashes fill in the minute voids that no other part of the mix can fill, thus<br />
creating a <strong>de</strong>nser and less absorptive concrete with improved mechanical<br />
features. On short term mechanical strengths are lower than plain concrete,<br />
after 28 days they equalized and after a long period of hydration products with<br />
ashes present 15-20% higher mechanical strength than classic concrete [4-6].<br />
Ashes use – recovered wastes – reduces the natural resources use.<br />
They also reduces the energy-intensive production of other concrete ingredients,<br />
leading to energy saving and “greenhouse gas” emission <strong>de</strong>crease. Replacing<br />
one tone of cement with fly ash it would save enough electricity to power an<br />
average home for 24 days, and reduce carbon dioxi<strong>de</strong> emissions equal to a<br />
two months use of an automobile.<br />
RESULTS AND DISCUSSIONS<br />
The setting time (SR EN 196-3:2006) and the workability (SR EN<br />
1015-9:2002) were <strong>de</strong>termined on the fresh mortar. The results are presented<br />
in Figures 1 and 2.<br />
Time [min]<br />
600<br />
500<br />
400<br />
300<br />
200<br />
100<br />
0<br />
200<br />
230<br />
375<br />
100 105 105<br />
450<br />
150<br />
0 5 10 20 30<br />
Proportion of cement replaced by ash<br />
[wt%]<br />
510<br />
180<br />
initial<br />
time<br />
final<br />
time<br />
Figure 1. Variation of setting time in function of proportion of cement replaced by ash.<br />
After 28 days of har<strong>de</strong>ning in standard conditions (5 days in moulds<br />
at 20°C and 90% humidity; 2 days without moulds at 20°C and 90% humidity;<br />
21 days without moulds at 20°C and 65% humidity) the <strong>de</strong>nsity and water<br />
absorption of the mortars were <strong>de</strong>termined using the methods indicated in<br />
SR EN 1015-10:2002 and SR EN 1015-18:2003.
POWER PLANTS ASHES RECOVERY IN ECO-FRIENDLY MORTAR COMPOSITIONS<br />
Time [min]<br />
50<br />
45<br />
40<br />
35<br />
30<br />
25<br />
20<br />
15<br />
10<br />
5<br />
0<br />
30 30<br />
0 5 10 20 30<br />
35<br />
40<br />
Proportion of cement replaced by ash [wt%]<br />
Figure 2. Variation of workability in function of proportion of cement replaced by ash.<br />
Density after 28 days [g/cm 3 ]<br />
The results are shown in the Figures 3 and 4.<br />
2<br />
1,95<br />
1,9<br />
1,85<br />
1,8<br />
1,75<br />
1,7<br />
1,91<br />
1,962<br />
1,869<br />
1,8<br />
45<br />
1,757<br />
1,65<br />
0 5 10 20 30<br />
Proportion of cement replaced by ash [wt%]<br />
Figure 3. Density variation in function of cement replaced by ash.<br />
The flexural and compressive strength of the compositions were<br />
<strong>de</strong>termined after 28 days of har<strong>de</strong>ning using the method indicated in SR<br />
EN 196-1:2006. In Figure 5 is presented the evolution of the strength in<br />
function of proportion of cement replaced by ash.<br />
61
62<br />
Water absorption [%]<br />
L. SZÉLL, V. CETEAN, TÓTH A., GAGEA L., ROMAN C., ROMAN M., GOG A.<br />
14<br />
12<br />
10<br />
8<br />
6<br />
4<br />
2<br />
0<br />
8,97<br />
8,34<br />
10,56<br />
12,52<br />
12,87<br />
0 5 10 20 30<br />
Proportion of cement replaced by ash [wt%]<br />
Figure 4. Water absorption variation in function of cement replaced by ash.<br />
Flexural strength after 28 days<br />
[N/mm 2 ]<br />
4<br />
3,5<br />
3<br />
2,5<br />
2<br />
1,5<br />
1<br />
0,5<br />
0<br />
3,58<br />
3,63<br />
2,53<br />
2,29<br />
0 5 10 20 30<br />
Proportion of cement replaced by ash [wt%]<br />
Figure 5. Flexural strength variation in function of proportion of cement replaced by ash.<br />
2,1
POWER PLANTS ASHES RECOVERY IN ECO-FRIENDLY MORTAR COMPOSITIONS<br />
Compressive strength after 28<br />
days [N/mm 2 ]<br />
16<br />
14<br />
12<br />
10<br />
8<br />
6<br />
4<br />
2<br />
0<br />
13,09<br />
13,86<br />
7,03<br />
6,15<br />
0 5 10 20 30<br />
Proportion of cement replaced by ash [wt%]<br />
4,96<br />
Figure 6. Compressive strength variation in function of proportion of cement<br />
replaced by ash.<br />
It is a known fact that the mechanical strength of the mortars and<br />
concretes with ash content is lower after 28 days and a beneficial effect it is<br />
observed only after 56 or 91 days. To <strong>de</strong>monstrate the evolution of the strength,<br />
mechanical tests were repeated after 56 days (Figure 7 and 8).<br />
Flexural strength after 56 days<br />
[N/mm 2 ]<br />
4,5<br />
4<br />
3,5<br />
3<br />
2,5<br />
2<br />
1,5<br />
1<br />
3,66<br />
3,83<br />
2,68<br />
2,34<br />
0,5<br />
0<br />
0 5 10 20 30<br />
Proportion of cement replaced by ash [wt%]<br />
Figure 7. Flexural strength variation in function of proportion of cement replaced by ash.<br />
2,12<br />
63
Compressive strength after 56 days<br />
[N/mm 2 ]<br />
L. SZÉLL, V. CETEAN, TÓTH A., GAGEA L., ROMAN C., ROMAN M., GOG A.<br />
16<br />
14<br />
12<br />
10<br />
8<br />
6<br />
4<br />
2<br />
0<br />
13,48<br />
14,78<br />
From the figures presented above it can be conclu<strong>de</strong>d that it is<br />
possible to use ashes in mortar compositions, respectively a part of the cement<br />
can be replaced by ashes. The replacement of cement in proportion of 5, 10,<br />
20 and 30 wt% was experimented (composition 2, 3, 4 and 5).<br />
By replacing the cement with ash, the setting times of the mortars<br />
increases. The difference between the initial setting time of the composition<br />
without ash and the composition in which 5 wt% of cement was replaced by ash<br />
is only 5 minutes. The differences are bigger for higher ash content; it reaches<br />
80 minutes for composition 5 in which 30 wt% of cement was replaced by<br />
ash.<br />
The differences are more evi<strong>de</strong>nt in the case of the final time of<br />
setting, where replacement of 5 wt% cement lead to a 30 minutes longer<br />
final setting time and replacement of 30 wt% cement with ash a 310 minutes<br />
longer time, which means an increase of 1,5 times.<br />
In the case of mortars workability no differences were observed<br />
between the composition with no ash and the composition in which 5 wt%<br />
of cement were replaced, after that every 10wt% of cement replaced by ash<br />
brings 5 minutes in plus.<br />
The <strong>de</strong>nsity increases slowly by replacing 5% of cement, after that a<br />
<strong>de</strong>crease is observed, every sample <strong>de</strong>nsities being un<strong>de</strong>r the <strong>de</strong>nsity of<br />
the standard composition. The water absorption is in agreement with the<br />
results obtained for the <strong>de</strong>nsities. The water absorption <strong>de</strong>crease from 8,96 %<br />
for the standard composition to 8,34 % for composition 2 with 5 wt% ash.<br />
64<br />
7,53<br />
6,35<br />
0 5 10 20 30<br />
Proportion of cement replaced by ash [wt%]<br />
Figure 8. Compressive strength variation in function of proportion of<br />
cement replaced by ash.<br />
5,06
POWER PLANTS ASHES RECOVERY IN ECO-FRIENDLY MORTAR COMPOSITIONS<br />
For the other compositions the value of absorption increases to 12,87 %,<br />
while the ash proportion was increased to 30 wt%.<br />
The values for the mechanical strength state the observations at the<br />
<strong>de</strong>nsity and absorption <strong>de</strong>termination. Thus an increase in strength, both<br />
flexural and compressive, was observed for the composition 2 with 5 wt%<br />
ash. While the ash content was increased the mechanical strength <strong>de</strong>creased<br />
and it is situated below the standard composition strength.<br />
The mechanical test after 56 day of har<strong>de</strong>ning shows that the strength<br />
increase is higher for the compositions with ash. In the figure 9 are presented<br />
the proportions of the strength increase from 28 to 56 days.<br />
Strength increase [%]<br />
8<br />
7<br />
6<br />
5<br />
4<br />
3<br />
2<br />
1<br />
0<br />
2,23<br />
2,98<br />
5,51<br />
6,64<br />
5,93<br />
7,11<br />
2,18<br />
3,25<br />
0,95<br />
0 5 10 20 30<br />
Proportion of cement replaced by ash [wt%]<br />
2,02<br />
Flexural<br />
Compressiv<br />
Figure 9. The increasing strength from 28 to 56 days in function of proportion<br />
of cement replaced by ash.<br />
CONCLUSIONS<br />
It can be conclu<strong>de</strong>d that the Zalău power plant ash can be used in<br />
mortar compositions. Replacement of 5 wt% cement by ash brings both<br />
economical and qualitative benefits.<br />
Using power plants ash presents some advantages: ash is a cheap<br />
unconventional raw material, which introduce in mortar composition <strong>de</strong>termine<br />
the <strong>de</strong>crease of production cost with 10-20%, without any quality compromises;<br />
the mechanical strength and durability of the product can be improved.<br />
65
66<br />
L. SZÉLL, V. CETEAN, TÓTH A., GAGEA L., ROMAN C., ROMAN M., GOG A.<br />
EXPERIMENTAL SECTION<br />
In this experimental works 5 compositions of masonry mortars were<br />
prepared replacing the cement with different amounts of ash. The fresh and<br />
har<strong>de</strong>ned mortars characteristics were investigated. The compositions were<br />
prepared by forced mixing using a laboratory mixer. The fresh mortar was cast<br />
in metallic moulds obtaining 160x40x40 mm prisms which were subjected to<br />
testing in har<strong>de</strong>ned state.<br />
In the table 1 are presented the proportions of the raw materials used in<br />
the compositions. The first composition, without ash is the standard composition.<br />
Table 1. Mortar compositions<br />
1 2 3 4 5<br />
CEM II/A-S 32,5 R % 25 23,75 22,5 20 17,5<br />
Ash % 0 1,25 2,5 5 7,5<br />
Sand 0-4 % 75 75 75 75 75<br />
+ Water % 17,70 17,90 18,10 19,40 20,80<br />
Three types of raw materials were used for the experimentation.<br />
a) Cement - CEM II/A-S 32,5 R<br />
►Chemical and physical–mechanical characteristics:<br />
Initial setting time Min 75 min.<br />
Soundness Max 10 mm.<br />
Compression strength:<br />
After 2 days: Min 10 N/mm 2<br />
After 28 days: Min 32.5 N/mm 2<br />
Max 52.5 N/mm 2<br />
Sulphate content (SO3) Max 3.5%<br />
Chlori<strong>de</strong> content Maxim 0.10%<br />
b) The chemical composition and the grain size distribution of the<br />
power plant ash from Zalău are given in Table 2 and 3.<br />
Table 2. Chemical composition of the ash.<br />
Oxi<strong>de</strong>s [wt %]<br />
SiO2 Al2O3 TiO2 Fe2O3 CaO MgO Na2O K2O L.O.I.<br />
59,71 21,62 0,62 7,10 4,48 1,02 0,60 2,60 1,31
POWER PLANTS ASHES RECOVERY IN ECO-FRIENDLY MORTAR COMPOSITIONS<br />
Table 3. Grain size distribution.<br />
Fraction Percent [wt %]<br />
> 2mm 6,33<br />
> 1mm 5,58<br />
> 500μm 12,00<br />
> 200μm 42,52<br />
> 100μm 25,29<br />
< 100μm 8,28<br />
c) SAND 0-4 mm in conformity with SR EN 13139:2003 (Aggregates<br />
for mortar)<br />
Table 4. Determination of particle size distribution of the sand –<br />
Sieving method SR EN 933-1/2002.<br />
Sieve<br />
[mm]<br />
Rest on sieve (Ri)<br />
kg<br />
Refuse percent<br />
(Ri//M1) 100<br />
[ wt %]<br />
Cumulated percents of refuse<br />
100-(Ri//M1 100)<br />
[wt %]<br />
8 0 0 100<br />
4 0 0 100<br />
2 0.019 9.5 90.5<br />
1 0.0384 19.2 71.3<br />
0.25 0.1144 57.2 14.1<br />
0.1 0.023 11.5 2.6<br />
0.063 0.0044 2.2 0.4<br />
68<br />
L. SZÉLL, V. CETEAN, TÓTH A., GAGEA L., ROMAN C., ROMAN M., GOG A.<br />
REFERENCES<br />
1. Gao Pei-wei, Lu Xiao-lin, Lin Hui, Li Xiaoyan, Hou Jie, Fuel, 2007, 86, 1208.<br />
2. Sarat Kumar Das Yudhbir, Cement and Concrete Research, 2006, 36, 1827.<br />
3. N. P. Rajamane, J. Annie Peter, P.S. Ambily, Cement & Concrete Composites,<br />
2007, 29, 218.<br />
4. Tsong Yen, Tsao-Hua Hsu, Yu-Wen Liu, Shin-Ho Chen, Construction and<br />
Building Materials, 2007, 21, 458.<br />
5. Takeshi Yamamoto, Tsutomu Kanazu, Masateru Nambu, Takao Tanosaki,<br />
Fuel, 2006, 85, 2345.<br />
6. Serdar Aydın, Halit Yazıcı, Hüseyin Yigiter, Bülent Baradan, Building and<br />
Environment, 2007, 42, 717.
STUDIA UNIVERSITATIS BABES-BOLYAI, CHEMIA, LIV, 1, 2009<br />
Dedicated to Professor Liviu Literat, at his 80 th anniversary<br />
HEAT INTEGRATION OF AN INDUSTRIAL FLUID<br />
CATALYTIC CRACKING PLANT<br />
ELIANA JARA-MORANTE a , MIHAELA-HILDA MORAR a ,<br />
PAUL ŞERBAN AGACHI a<br />
ABSTRACT. The fluid catalytic cracking process represents the main<br />
conversion process in a refinery. The successful operation of the FCC unit<br />
<strong>de</strong>termines the position on the market of the refinery. The objective of this<br />
work is to analyze the actual heat exchanger network (HEN) of an industrial<br />
fluid catalytic cracking plant (FCC) and, using real data provi<strong>de</strong>d by a refinery<br />
from Romania and Pinch technique, to improve it. ASPEN Plus was used to<br />
simulate the process. ASPEN HX-Net was used to generate the retrofitted<br />
<strong>de</strong>signs of the HEN. The obtained results present the possibility to improve the<br />
actual heat exchanger distribution in the heat exchanger network and to save<br />
energy. Adding heat exchangers, re-piping, and improving the performance of<br />
some heat exchangers, it is possible to save energy from the actual heat<br />
exchanger network and to improve the process operation.<br />
Keywords: fluid catalytic cracking, heat exchanger network, optimization<br />
INTRODUCTION<br />
The fluid catalytic cracking process (FCC) is the process most<br />
common used in any mo<strong>de</strong>rn oil refinery. The FCC unit consists of three<br />
distinct sections: the reactor-regenerator unit section including air blower and<br />
waste heat boiler, the main fractionator section including wet gas compressor<br />
and unsaturated gas plant section (Gascon). In or<strong>de</strong>r to improve its operation<br />
and to recover a certain quantity of energy, the FCC process must go through<br />
some structural changes (retrofitting). Retrofitting represents changes (new<br />
heat transfer area, re-piping, changing the heat exchangers place, etc) in<br />
the actual structure of the HEN in or<strong>de</strong>r to reduce the operation cost and in<br />
this way to increase the capital cost, indicating that there is a tra<strong>de</strong>-off<br />
between the operational and capital costs.<br />
a Universitatea Babeş-Bolyai, <strong>Facultatea</strong> <strong>de</strong> <strong>Chimie</strong> <strong>şi</strong> <strong>Inginerie</strong> <strong>Chimică</strong>, Str. Kogălniceanu,<br />
Nr. 1, RO-400084 Cluj-Napoca,Romania, mmorar@chem.ubbcluj.ro
70<br />
ELIANA JARA-MORANTE, MIHAELA-HILDA MORAR, PAUL ŞERBAN AGACHI<br />
The method most used for energy integration is Pinch Analysis. This<br />
technique is the simplest, easy to use, with immediate results and <strong>de</strong>monstrates<br />
its efficiency and applicability in many industrial saving energy problems. In<br />
addition, heat integration reduces site utility costs and capital costs. The<br />
savings ma<strong>de</strong> applying this technique came up to the 20-30% comparative<br />
with classical process <strong>de</strong>sign (B. Linnhoff, 1997).<br />
A rigorous analysis of a FCC plant for energy saving was ma<strong>de</strong> by<br />
B. A. Al-Riyami et al., 2001. The HEN inclu<strong>de</strong>d the feed preheating, main<br />
fractionation and gas concentration section. The system was simulated using<br />
HySys.<br />
The aims of our research were to analyze the actual heat exchanger<br />
network (HEN) of an FCC industrial plant using real process data (ex. flow<br />
streams, temperatures, transfer areas etc.) and to improve its operation<br />
from the economical point of view, using Pinch Analysis.<br />
The FCC plant was already integrated in the past, during the time<br />
there were some changes in its operation (different raw materials, no production<br />
of heavy gasoline, different flow streams etc.). Constrained by the new type<br />
of operation and changes appeared in the <strong>de</strong>sign, a retrofit was realized<br />
trying not to affect the conversion process.<br />
RESULTS AND DISCUSSION<br />
Analyzing the existing HEN<br />
The investigation of the actual HEN and the <strong>de</strong>termination of the<br />
minimum duty of heating and cooling utilities have been done. The system<br />
was simulated in ASPEN Plus with the real process data collected from a<br />
Romanian refinery (UOP Fluid Catalytic Cracking process).<br />
The scheme of the FCC unit which was implemented in Aspen Plus<br />
may be seen in the Figure 1.<br />
Figure 1. Flow diagram of FCC process.
HEAT INTEGRATION OF AN INDUSTRIAL FLUID CATALYTIC CRACKING PLANT<br />
In this study was realized the inventory of the heating and cooling<br />
sources. The data extracted from the simulation results using ASPEN HX-Net<br />
may be seen in Table 1. The table comprises 10 hot streams and 4 cold<br />
streams.<br />
Table 1. Hot and Cold Streams Extracted from Simulation<br />
Streams Type Supply<br />
Temp.<br />
Target<br />
Temp.<br />
CP HTC Enthalpy<br />
[C] [C] [kW/C] [kW/C-m2] [kW]<br />
SL-20-21 Hot 393.6 254 35.95 0.15 5018.0<br />
SL-22-23 Hot 393.6 238 74.94 0.12 11660.3<br />
SL-18-19:23 Hot 393.6 234.4 37.41 0.12 5956.1<br />
MG-9:MG-10 Hot 334.7 60 17.89 0.15 4914.8<br />
MG-41A:MG-41B Hot 250.4 224 102.39 0.15 2703.0<br />
MG-42B:MG-42D Hot 224 177 5.85 0.12 275.1<br />
MU-86A:MU-72 Hot 205.5 108.9 79.31 0.12 7661.8<br />
MOT-USO:MU-83 Hot 177.2 60 9.64 0.2 1129.3<br />
BG-111:BG-129 Hot 145.4 98 61.74 0.2 2926.7<br />
BU-207:BENZ-OUT Hot 66 43 342.60 0.15 7879.9<br />
C-31:C-32 Cold 80 110.2 96.91 0.15 2926.7<br />
C-32:C-33 Cold 110.2 114.5 96.86 0.15 416.5<br />
C-33:C-34 Cold 114.5 143.2 96.94 0.15 2782.3<br />
C-34:C-35 Cold 143.2 204.7 96.85 0.15 5956.1<br />
C-35:C-36 Cold 204.7 293.8 96.82 0.15 8626.6<br />
B1-GE12:B2GE12 Cold 172 187.6 747.46 0.25 11660.3<br />
B1-GE11:B2GE11 Cold 172 176.1 659.27 0.2 2703.0<br />
B1-GE9:B2GE9 Cold 105 112.7 995.04 0.2 7661.8<br />
WFE3-FE23 Cold 100 200.7 49.83 0.5 5018.0<br />
The raw material stream of the FCC process, mainly the heavy vacuum<br />
distillate stream from the vacuum distillation unit, is a cold stream that is been<br />
heated up to a temperature around 290 0 C in 4 heat exchangers (streams: C-<br />
31:C-32, C-32:C-33, C-33:C-34, C-34:C-35 and 1 fire heater (stream C-35:C36).<br />
The products stream from the riser is fractionated in the main column<br />
in the following streams: heavy diesel oil, light diesel oil, heavy gasoline,<br />
light gasoline and slurry.<br />
71
72<br />
ELIANA JARA-MORANTE, MIHAELA-HILDA MORAR, PAUL ŞERBAN AGACHI<br />
The slurry stream separated on the bottom of the column has the<br />
highest temperature (393.6 0 C). It provi<strong>de</strong>s energy to produce superheated<br />
steam (WFE3-FE23) and to heat up other process streams: the gasoline<br />
from Gascon and the raw material. The steam generation stream was<br />
consi<strong>de</strong>red as a process stream in or<strong>de</strong>r to keep the existing production of<br />
steam the same both before and after the retrofit. The steam is nee<strong>de</strong>d for<br />
the other processes from the refinery. In the Aspen Plus simulation slurry<br />
stream is splited in: SL-20-21, SL-22-23 and SL-18-19:23.<br />
The cold gasoline streams from Gascon plant (B1-GE12:B2GE12,<br />
B1-GE11:B2GE11, B1-GE9:B2GE9) were consi<strong>de</strong>red to be process<br />
streams trying not to modify the process behavior and the consumption of<br />
cold utility of the FCC process. The light (MU-86A:MU-72, MOT-USO: MU-<br />
83) and heavy (MG-41A:MG-41B, MG-42B:MG-42D) diesel oil streams<br />
help to increase the temperature of the raw material and are cooled and<br />
sent to storage. Heavy diesel oil (BG-111: BG-129) in the actual operation<br />
of the FCC process it’s not consi<strong>de</strong>red anymore as one of the main<br />
products. It is used only to heat up the raw material stream and then is<br />
reintroduced in the main column. The gasoline and gases stream from the<br />
top of the column (BU-207: BENZ-OUT) is sent to Gascon unit after a part<br />
of the gases are separated to the furnace.<br />
Based on the data provi<strong>de</strong>d by the simulation and that have been<br />
presented in Table 1, the composite curves (Figure 2) and Grand composite<br />
curve (Figure 3) were generated.<br />
Temperature [C]<br />
400<br />
350<br />
300<br />
250<br />
200<br />
150<br />
100<br />
50<br />
0<br />
0 10000 20000 30000 40000 50000 60000 70000 80000<br />
Enthalpy [kW]<br />
Hot composite<br />
Cold composite<br />
Figure 2. Composite Curves of the existing HEN.
Temperature [C]<br />
HEAT INTEGRATION OF AN INDUSTRIAL FLUID CATALYTIC CRACKING PLANT<br />
4 0 0<br />
3 5 0<br />
3 0 0<br />
2 5 0<br />
2 0 0<br />
1 5 0<br />
1 0 0<br />
5 0<br />
0<br />
-5 0<br />
0 2 5 0 0 5 0 0 0 7 5 0 0 1 0 0 0 0 1 2 5 0 0 1 5 0 0 0 1 7 5 0 0 2 0 0 0 0 2 2 5 0 0 2 5 0 0 0<br />
E n th a lp y [k W ]<br />
Figure 3. Grand Composite of the existing HEN.<br />
The Grand composite curve shows that the pinch temperature of the<br />
process is 144.5 0 C and from the composite curves it was discovered that<br />
the ∆Tmin for the process is 129 0 C and the duty of hot utility is 19858 kW<br />
and of cold utility is 22234.79 kW.<br />
Table 2. Heat exchangers from the industrial process<br />
Heat Cost Simulation area Real area Duty<br />
exchanger [$] [m2] [m2] [kW]<br />
FE-21 271525.74 941.91 324 2926.69<br />
FE-18 62073.63 81.15 113 2782.33<br />
FE-9 0.00 0.00 18777 0.00<br />
FE-4 52865.53 50.28 120 2132.50<br />
FE-22 38003.33 8.44 7 275.09<br />
FE-17 48050.00 35.39 248 416.46<br />
FE-3 83867.74 163.15 76 4766.40<br />
FE-23 39939.71 13.04 12.3 251.60<br />
FE-6 106258.59 256.77 894 7879.95<br />
GE-12 366717.43 1678.59 - 11660.34<br />
FE-2 130758.34 367.28 111 5956.05<br />
FE-10 73604.16 123.20 2776 712.84<br />
GE-9 462658.57 1657.14 - 7661.77<br />
GE-11 197879.39 596.48 - 2702.99<br />
The simulation of industrial process provi<strong>de</strong>d 15 heat transfer units<br />
(excepting the fire heater) that are summarized in Table 2. The cold utilities<br />
used are cooling water (94%) and air (6%) with a total cooling need of<br />
11000.38 kW. The only hot utility consi<strong>de</strong>red is the fuel (8626.6 kW).<br />
73
74<br />
ELIANA JARA-MORANTE, MIHAELA-HILDA MORAR, PAUL ŞERBAN AGACHI<br />
The heat exchanger FE-9 present in the real process it is used only for<br />
cooling down the temperature of the gasoline stream (top of the column) when<br />
it increases above a fixed value. The heat exchangers GE-9, GE-11 and GE-<br />
12 are located in the Gascon plant and they have to remain unmodified.<br />
Besi<strong>de</strong>s the heat exchangers summarized in Table 2, preheating train of<br />
the raw material contain another heat exchanger, FE-24, that is out of or<strong>de</strong>r and<br />
it wasn’t consi<strong>de</strong>red in the simulation. It was <strong>de</strong>signed to cool the heavy gasoline<br />
stream that goes to the storage but this product is not produced anymore.<br />
The existing heat exchanger network <strong>de</strong>sign was generated by Aspen<br />
HX-Net (Figure 4). The heat transfer marked with blue dots represents the heat<br />
exchangers with cold utilities, the red dots represent a heat exchanger with hot<br />
utility and the grey dots represent process to process heat exchangers.<br />
Figure 4. Existing Heat Exchanger Network.<br />
Improving the existing HEN<br />
In or<strong>de</strong>r to improve the real heat exchanger network the optimization<br />
of the total cost of FCC process was done. The total cost as a function of<br />
∆Tmin is represented in Figure 5. It can be seen that the minimum cost is<br />
achieved in a range of ∆Tmin=8.5 to 12 0 C; and as a conservative approach the<br />
optimum minimum approach temperature for the retrofit target is ∆Tmin=12 0 C<br />
because operating with a ∆Tmin less than 10 0 C should be avoi<strong>de</strong>d [4].
HEAT INTEGRATION OF AN INDUSTRIAL FLUID CATALYTIC CRACKING PLANT<br />
Total cost [$/y]<br />
2.40e+6<br />
2.38e+6<br />
2.36e+6<br />
2.34e+6<br />
2.32e+6<br />
2.30e+6<br />
2.28e+6<br />
2.26e+6<br />
2.24e+6<br />
5.00 10.00 15.00 20.00 25.00<br />
ΔT min [C]<br />
Figure 5. Total cost vs. minimum ∆T.<br />
Consi<strong>de</strong>ring that the actual HEN is operated with ∆Tmin=129 0 C,<br />
<strong>de</strong>creasing it to 12 0 C it is possible to improve the actual heat exchanger<br />
distribution for saving energy of 13553 kW.<br />
Temperature [C]<br />
400<br />
350<br />
300<br />
250<br />
200<br />
150<br />
100<br />
50<br />
0<br />
0 10000 20000 30000 40000 50000 60000<br />
Enthalpy [kW]<br />
Hot composite<br />
Cold composite<br />
Figure 6. Composite curves with ∆Tmin=12 0 C.<br />
75
ELIANA JARA-MORANTE, MIHAELA-HILDA MORAR, PAUL ŞERBAN AGACHI<br />
Figure 7. Grand Composite curve with ∆Tmin=12 0 C<br />
The new composite curves, generated in Figure 6 and Figure7,<br />
show that the pinch temperature has been reduced from 144.5 0 C to 88 0 C<br />
and the minimum need of heating and cooling is reduced to 6325.92 kW<br />
and 8701.28 kW respectively. In conclusion, reducing the ∆Tmin reduces the<br />
heating and cooling needs approximately with 32% and 39% respectively.<br />
Also it can be observed in Grand Composite curve that there are some<br />
pockets of extra energy that may be saved.<br />
Table 3 presents the comparison of the necessary of cooling and<br />
heating needs in those two cases consi<strong>de</strong>red: ∆Tmin=129 0 C and ∆Tmin=12 0 C.<br />
These results were compared against the Grand Composite curve (Figure 8).<br />
Table 3. Saving energy through reduction of ∆Tmin<br />
∆Tmin [ 0 C] Reduce<br />
129 12 [%]<br />
Heating [kW] 19859.00 6325.92 68.15<br />
Cooling [kW] 22234.36 8701.28 60.87<br />
In the new HEN, generated with Aspen HX-Net, there is not processto-process<br />
heat exchange that crosses the pinch temperature. This is an<br />
improvement compared to the initial <strong>de</strong>sign extracted from the simulation.<br />
In or<strong>de</strong>r to improve the HEN other <strong>de</strong>signs were generated and<br />
analyzed. The only change consi<strong>de</strong>red in those <strong>de</strong>signs is the distribution of the<br />
heat exchangers. The <strong>de</strong>signs were compared in terms of their operation costs<br />
and efficiency. In all the <strong>de</strong>signs the stream corresponding to steam generation<br />
was consi<strong>de</strong>r as a process stream. Five <strong>de</strong>signs were proposed and have been<br />
used the economic mo<strong>de</strong>l recommen<strong>de</strong>d in [1] and by ASPEN HX-Net.<br />
76
HEAT INTEGRATION OF AN INDUSTRIAL FLUID CATALYTIC CRACKING PLANT<br />
Temperature [C]<br />
400<br />
350<br />
300<br />
250<br />
200<br />
150<br />
100<br />
50<br />
0<br />
-50<br />
0 5000 10000 15000 20000 25000 30000<br />
Enthalpy [kW]<br />
ΔTmin= 12 [C]<br />
ΔTmin= 129 [C]<br />
Figure 8. Grand Composite curves comparison.<br />
The <strong>de</strong>signs used present the following conditions:<br />
Design A:<br />
- The or<strong>de</strong>r of the heat exchangers are changed optimizing the<br />
production of steam;<br />
- The total area of the HEN was increased;<br />
- The operating cost was reduced.<br />
Design B:<br />
- Addition of a fire heater to heat the cold stream;<br />
- The heating and cooling needs are <strong>de</strong>creased;<br />
- The operating cost and the total cost are reduced.<br />
Design C:<br />
- The split of slurry stream was taken out;<br />
- The number of heat exchangers was reduced;<br />
- The operation and the capital costs have been increased;<br />
- The cooling need was the same as in the base case;<br />
The total area was increased.<br />
Design D:<br />
- The number of heat exchangers that are used to heat up the raw<br />
material were increased;<br />
- The total area of the heat exchangers was increased;<br />
- The operating cost and the total cost increased.<br />
77
78<br />
ELIANA JARA-MORANTE, MIHAELA-HILDA MORAR, PAUL ŞERBAN AGACHI<br />
Design E:<br />
- A part of the hot stream “heavy diesel oil” was re-piped to produce<br />
steam;<br />
- The heating and cooling needs were <strong>de</strong>creased;<br />
- The operating, capital, and total costs were reduced.<br />
The characteristics (total cost, transfer area, etc.) of the <strong>de</strong>signs<br />
obtained are compared in the Table 4.<br />
Table 4. Comparison among <strong>de</strong>signs evaluated<br />
The performance of the consi<strong>de</strong>red <strong>de</strong>signs, with respect to the i<strong>de</strong>al<br />
target, was evaluated through the alpha plot, the closest the existing HEN is to<br />
the i<strong>de</strong>al curve in an energy area plot the better the performance. In Figure 9a<br />
may be seen that there are at least three <strong>de</strong>signs that could have a better<br />
performance than the simulation base case (e.g., <strong>de</strong>sign B, D and E).<br />
Capital cost [$]<br />
5.4e+6<br />
5.2e+6<br />
5.0e+6<br />
4.8e+6<br />
4.6e+6<br />
Target<br />
SimBase<br />
Design A<br />
Design B<br />
Design C<br />
Design D<br />
Design E<br />
4.4e+6<br />
6.0e+5 7.0e+5 8.0e+5 9.0e+5 1.0e+6 1.1e+6<br />
Operating cost [$/y]<br />
Total cost Area Heating Cooling<br />
Total Area [m 2 ]<br />
95 00<br />
90 00<br />
85 00<br />
80 00<br />
75 00<br />
70 00<br />
65 00<br />
60 00<br />
6.5e+ 5 7 .0 e+ 5 7.5e+ 5 8 .0e+ 5 8.5 e+ 5 9.0e+ 5 9 .5 e+ 5 1.0e+ 6 1 .1e+ 6 1.1 e+ 6<br />
E nergy cost [$/y]<br />
a) b)<br />
Figure 9. a) Performance of the <strong>de</strong>signs. b) Efficiency<br />
of the proposed <strong>de</strong>signs respect to the i<strong>de</strong>al.<br />
Operating<br />
cost<br />
[$/y] [m2] [kW] [kW] [$/y]<br />
SimulationBaseCase 2569201.45 6238.39 8626.55 11000.38 1049460.81<br />
Design A 2707323.90 8443.29 8621.23 11000.38 998785.53<br />
Design B 2430791.22 8542.85 8309.79 10689.08 947392.96<br />
Design C 2695805.34 8441.96 8621.23 11000.38 998785.53<br />
Design D 2377950.54 8581.62 8033.84 10413.99 915249.06<br />
Design E 2335706.83 6350.65 7325.39 9701.64 897860.72
HEAT INTEGRATION OF AN INDUSTRIAL FLUID CATALYTIC CRACKING PLANT<br />
Figure 9b shows the efficiency of the <strong>de</strong>signs consi<strong>de</strong>red. The closest to<br />
the i<strong>de</strong>al efficiency are the <strong>de</strong>sign E and the <strong>de</strong>sign consi<strong>de</strong>red in the simulation<br />
base case, indicating that those <strong>de</strong>signs are using efficiently the heat transfer<br />
area. The <strong>de</strong>signs A, B, C and D are far from the i<strong>de</strong>al performance.<br />
It could be advantageous from the economical point of view to change<br />
the existing HEN with <strong>de</strong>sign E (Figure 10) that has lower energy consumption,<br />
capital and operational costs than the existing HEN. Consi<strong>de</strong>ring the results<br />
from Table 4, total costs are <strong>de</strong>creased with approximately 9% and there is an<br />
energy saving of 15% of heating and 12% of cooling. However, the performance<br />
of this <strong>de</strong>sign needs to be evaluated through a simulation implemented in<br />
Aspen Plus or Aspen Dynamics to see if it is the best choice in all conditions<br />
(economics, dynamic behavior, controllability etc.).<br />
CONCLUSIONS<br />
Figure 10. Heat exchanger network – Design E.<br />
The fluid catalytic cracking is a dominant process in oil refineries<br />
and there has been a continuous effort to improve the efficiency and yield<br />
of the unit over the years.<br />
79
80<br />
ELIANA JARA-MORANTE, MIHAELA-HILDA MORAR, PAUL ŞERBAN AGACHI<br />
The results of the present retrofit study confirmed that it is possible<br />
to save energy from the actual heat exchanger network. The improvement<br />
comprises adding heat exchangers, re-piping, and improving the performance<br />
of some heat exchangers. The closest to the i<strong>de</strong>al efficiency is the <strong>de</strong>sign E<br />
because it uses efficiently the heat transfer area and it is the best <strong>de</strong>sign<br />
comparative with the existing industrial HEN. In the real HEN there are<br />
process-to-process heat exchangers that cross the pinch temperature. Total<br />
costs are <strong>de</strong>creased with approximately 9% and there is an energy saving<br />
of 15% of heating and 12% of cooling.<br />
No drastic changes have been suggested for the existing HEN, the<br />
new <strong>de</strong>sign was done trying not to modify the process-to-process heat<br />
exchangers, assuring that the process would not be affected.<br />
Significant quantities of hot and cold utilities (water, gas, etc.) are<br />
saved by reducing the heating and cooling needs in the FCC plant. This is<br />
an important step in conserving and recycling the natural resources.<br />
This optimization of the HEN in terms of the economical point of<br />
view gives a starting point to continue with the improvement of the industrial<br />
process. Future work will analyze the generated <strong>de</strong>signs in terms of<br />
dynamic behavior and controllability.<br />
ACKNOWLEDGMENTS<br />
The authors are thankful for the financial support from the Romanian<br />
Ministry of Education, Research and Youth through the research grant PD-<br />
CEEX “Operation of the non-stationary catalytic <strong>de</strong>pollution and thermally<br />
integrated processes using techniques of advanced process control“.<br />
REFERENCES<br />
1. A. B. Al Riyami, J. Klemes, S. Perry, Applied Thermal Engineering, 2001,<br />
21, 1449.<br />
2. F.S. Liporace, F.L.P. Pessoa, E.M. Queiroz, Lat. Am. Appl. Res., 2002, 32, 2.<br />
3. B. Linnhoff, “A user gui<strong>de</strong> on process integration for efficient use of<br />
energy”, Rugby Institution of chemical Engineers, 1997.<br />
4. R. Smith, “Chemical Process Design and Integration”, John Wiley & Sons, 2000.<br />
5. W. D. Sei<strong>de</strong>r, J. D. Sea<strong>de</strong>r, D. R. Lewin, “Product & Process Design Principles”,<br />
John Wiley & Sons, Inc, 2003.<br />
6. M. M. El-Halwagi, “Process System Engineering: Process Integration”, vol.<br />
7, Aca<strong>de</strong>mic Press, 2006.
STUDIA UNIVERSITATIS BABES-BOLYAI, CHEMIA, LIV, 1, 2009<br />
Dedicated to Professor Liviu Literat, at his 80 th anniversary<br />
GASIFICATION PROCESS – A PRACTICAL WAY FOR<br />
SOLID FOSSIL FUELS DECARBONISATION<br />
CĂLIN – CRISTIAN CORMOŞ a , ŞERBAN PAUL AGACHI a<br />
ABSTRACT. This paper investigates the technical aspects of solid fossil<br />
fuels <strong>de</strong>carbonisation by gasification process. More specifically, it focuses on<br />
the technical evaluation and the assessment of performance of an Integrated<br />
Gasification Combined Cycle (IGCC) scheme modified for Carbon Capture<br />
and Storage (CCS). One of the key units of such a plant is the gasification<br />
island, a number various commercial gasification reactors (mainly entrainedflow<br />
types of dry feed and slurry feed) are evaluated for <strong>de</strong>carbonisation of<br />
fossil fuels (coal).<br />
The significant issues in the overall <strong>de</strong>sign of fossil fuels <strong>de</strong>carbonisation<br />
process using gasification process are: proper choice of gasification reactor and<br />
feedstock (e.g. fluxing or fuel blending), downstream syngas treatment options<br />
(shift conversion of carbon monoxi<strong>de</strong>, syngas <strong>de</strong>sulphurization and later carbon<br />
dioxi<strong>de</strong> capture) and finally the usage of combustible <strong>de</strong>carbonised gas for<br />
various energy vectors poly-generation (e.g. power, H2 etc.).<br />
Finally, whole process for one case study (using Siemens gasification<br />
reactor) was mathematical mo<strong>de</strong>led and simulated using ChemCAD software<br />
for the particular case of hydrogen and electricity co-production scheme<br />
based on coal with carbon capture and storage.<br />
Keywords: Fossil fuels <strong>de</strong>carbonisation, Gasification, Carbon Capture and<br />
Storage<br />
INTRODUCTION<br />
Gasification of solid fuels (either only fossil fuels or in addition with<br />
various renewable energy sources such biomass or solid wastes) forms the<br />
core of Integrated Gasification Combined Cycle (IGCC) concepts which is one<br />
of the advanced clean coal power generation systems [1, 2]. Compared with<br />
conventional coal fired power plants, IGCC scheme has lower emissions of<br />
acid gases (NOX, SOX) and particulate matter. In addition, with respect to clean<br />
a Universitatea Babeş - Bolyai, <strong>Facultatea</strong> <strong>de</strong> <strong>Chimie</strong> <strong>şi</strong> <strong>Inginerie</strong> <strong>Chimică</strong>, Str. Kogălniceanu, Nr. 1,<br />
RO-400084 Cluj-Napoca, Romania, cormos@chem.ubbcluj.ro, sagachi@staff.ubbcluj.ro
82<br />
CĂLIN – CRISTIAN CORMOŞ, ŞERBAN PAUL AGACHI<br />
coal technology, IGCC has a better carbon dioxi<strong>de</strong> capture potential, using<br />
pre-combustion capture whereas conventional coal fired power plants have<br />
to use post-combustion capture [2, 3].<br />
The IGCC is an energy conversion process concept in which the<br />
solid fuel (e.g. coal) is gasified to produce a fuel gas (called syngas), which<br />
after purification (ash removal and <strong>de</strong>sulphurization), is burnt in the gas turbine<br />
in a conventional Combined Cycle Gas Turbine (CCGT) to produce power.<br />
Because the gasification process produces a large amount of waste heat,<br />
which can be used for steam production, the steam systems in the CCGT heat<br />
recovery steam generator and gasification system are integrated together,<br />
hence the IGCC appellation (the combination of two thermodynamic cycles<br />
namely Brayton cycle and Rankine cycle) [4].<br />
In gasification processes <strong>de</strong>signed for fuel <strong>de</strong>carbonisation, oxygen<br />
plus steam or water is reacted with coal at high temperatures to produce syngas<br />
which mainly consists of carbon monoxi<strong>de</strong> and hydrogen. After purification<br />
performed to remove ash and sulphur compounds, the mixture of CO and H2<br />
is normally used as a fuel gas for the gas turbine (no capture option). But for<br />
the capture option (pre-combustion capture of carbon dioxi<strong>de</strong>), the hydrogen<br />
level is raised by catalytic conversion of carbon monoxi<strong>de</strong> in the syngas with<br />
steam, the chemical reaction being:<br />
CO + H O ↔ H +<br />
2<br />
This step also enables the carbon present in the coal to be concentrate<br />
in form of carbon dioxi<strong>de</strong> that can be later captured. After shift conversion,<br />
the gas, which now contains mainly carbon dioxi<strong>de</strong> and hydrogen, is cooled to<br />
ambient temperature then sent to an Acid Gas Removal (AGR) system for<br />
CO2 and H2S removal. Here, CO2 and H2S are removed by chemical solvents<br />
similar with those used in post-combustion capture (alkanolamines such as<br />
methyl-diethanol-amine - MDEA) as well as by physical solvents (e.g. Rectisol ® ,<br />
Selexol ® ) [5].<br />
After AGR, the hydrogen-rich gas stream can be used for various<br />
purposes: to produce hydrogen for chemical and petro-chemical processes<br />
(e.g. ammonia and methanol synthesis, hydrogenation, hydrocracking and<br />
hydro<strong>de</strong>sulphurization processes etc.) or for co-production of hydrogen and<br />
electricity. In this last option, one of the main advantages of such a scheme is<br />
the possibility to run the plant full-load all the time. It is well known that power<br />
duty has daily, weekly and seasonal variations and the power generation has<br />
to follow the duty (<strong>de</strong>mand). In such a case (e.g. during the night), the power<br />
plants have to run part-load or even to be switched off which implies severe<br />
reduction of the plant lifetime (thermal stress, corrosion etc.) and negative<br />
impact on plant economic indicators.<br />
2<br />
CO<br />
2
GASIFICATION PROCESS – A PRACTICAL WAY FOR SOLID FOSSIL FUELS DECARBONISATION<br />
The co-production mo<strong>de</strong> of hydrogen and electricity has the merits<br />
that during the low power duty periods, the plant can produce hydrogen which,<br />
apart from power, can be stored. In this case the plant is running full load all<br />
time with significant benefits in term of plant lifetime and economic indicators.<br />
In co-production mo<strong>de</strong>, the hydrogen-rich gas is split in two: one stream is<br />
purified by Pressure Swing Adsorption (PSA) and then is sent to the hydrogen<br />
customers and rest is used in a CCGT for power generation.<br />
This paper investigates the technical aspects of coal gasifier selection<br />
for co-production of electricity and hydrogen based on IGCC processes with<br />
carbon capture and storage [6-9]. More specifically, it focuses on the technical<br />
evaluation and the assessment of performance of a number of coal gasifiers<br />
based on existing moving-bed, fluidised-bed and entrained-flow gasification<br />
processes.<br />
The key factors consi<strong>de</strong>red in the analysis are: gasifier throughputs,<br />
reliability and experience, gasifier pressure and temperature, cold gas efficiency<br />
(CGE), carbon conversion, water or steam requirement, downstream gas clean<br />
up issues, hydrogen production potential, implication of oxygen purity for<br />
hydrogen purification stage, implication of gasifier selection for AGR system<br />
etc. Based on these key factors, a list of the most promising coal gasifiers<br />
for electricity and hydrogen co-production based on IGCC processes with<br />
carbon capture is proposed.<br />
After analyzing the most promising gasification reactors for coal, for<br />
one case the whole IGCC concept with carbon capture and storage will be<br />
mo<strong>de</strong>led and simulated using ChemCAD software for generation of about<br />
400 MW power and a flexible hydrogen output between 0 and 200 MW<br />
hydrogen (consi<strong>de</strong>ring the hydrogen lower heating value – LHV) with about<br />
90 % carbon capture rate (<strong>de</strong>carbonisation rate).<br />
Plant concept and gasifier options for hydrogen and electricity<br />
co-production with carbon capture<br />
An IGCC plant modified for co-production of hydrogen and electricity<br />
with carbon capture and storage is basically similar to that of existing IGCC<br />
plants for producing electricity only without carbon capture. The main differences<br />
are the need for shift conversion stage to increase hydrogen production<br />
and to concentrate the carbon species in form of carbon dioxi<strong>de</strong>, an Acid<br />
Gas Removal (AGR) system which in addition to hydrogen sulphi<strong>de</strong> (as in<br />
conventional technology) is capturing also carbon dioxi<strong>de</strong> and a hydrogen<br />
purification stage by PSA.<br />
A simplified flowsheet of the hydrogen and electricity co-production<br />
(HYPOGEN concept) plant based on coal with carbon dioxi<strong>de</strong> capture is<br />
presented in the Figure 1 [10]. In this case, based on an entrained-flow <strong>de</strong>sign,<br />
a syngas boiler is used to recover waste heat before the syngas is sent to<br />
the shift converter. Other entrained-flow gasifiers dispense with this option<br />
and quench the gas with water to solidify and remove slag.<br />
83
84<br />
CĂLIN – CRISTIAN CORMOŞ, ŞERBAN PAUL AGACHI<br />
As shown, carbon dioxi<strong>de</strong> stream is compressed to pressures more<br />
than 100 bar before being sent to storage site (geological storage or for<br />
Enhanced Oil Recovery - EOR). This also gives a difference between the<br />
type of plant and a conventional IGCC, the compression of carbon dioxi<strong>de</strong><br />
requiring a significant amount of energy which implies an energy penalty.<br />
Figure 1. Hydrogen and electricity co-production scheme with<br />
carbon capture and storage based on coal gasification.<br />
An other main difference is the addition of a Pressure Swing Absorption<br />
(PSA) system for purifying the hydrogen outlet stream of the plant. Because<br />
the need to find suitable solutions for replacing fuel oil-<strong>de</strong>rived products<br />
(gasoline and diesel) for transport sector, the hydrogen stream purity is set<br />
to 99.95 % (vol.) to be used in Proton Exchange Membrane (PEM) fuel cells<br />
<strong>de</strong>signed for mobile applications.<br />
Gasification reactors can be grouped into the following three main<br />
categories: moving-bed gasifiers (sometimes also called fixed-bed gasifiers),<br />
fluidised-bed gasifiers and entrained-flow gasifiers [1, 10-11]. A short <strong>de</strong>scription<br />
of each of these categories is discussed below:<br />
- Moving-bed gasifiers are characterized by a bed in which the fuel<br />
moves slowly downward un<strong>de</strong>r gravity as it is gasified. The phases circulation<br />
is a counter-current one. In such a counter-current arrangement, the hot gases<br />
from the gasification zone are used to preheat and pyrolyse the downward<br />
flowing coal. With this type of gasifier, the oxygen consumption is low but
GASIFICATION PROCESS – A PRACTICAL WAY FOR SOLID FOSSIL FUELS DECARBONISATION<br />
pyrolysis products are present in the syngas and also the outlet temperatures<br />
are low (400 – 600 o C). Within this category there are two different gasifier<br />
types: the dry ash type in which the temperature is kept below the ash<br />
melting point, and the slagging type in which the temperature in the gasifier<br />
heart is above the ash melting point.<br />
The main shortcoming of this type of gasifier is that a consi<strong>de</strong>rable<br />
amount of methane will be produced, which reduces the amount of hydrogen<br />
that can be generated and <strong>de</strong>crease the carbon capture capabilities of the<br />
plant (methane cannot be captured by AGR) [10].<br />
- Fluidized-bed gasifiers in which the bed is maintained in a fluidised<br />
condition by an upward flow of gaseous stream. This configuration offers<br />
extremely good mixing between feed and the oxidant, which promotes both<br />
heat and mass transfer. This ensures an even distribution of material in the<br />
bed, and hence a certain amount of partially un-reacted coal is removed with<br />
the ash (lower carbon conversion compared with other gasifier types). This<br />
gasifier type has mo<strong>de</strong>rate oxygen and steam consumptions [1].<br />
Unfortunately operation of fluidised beds are restricted to temperatures<br />
below ash softening point (900 – 1050 o C), as operation above this temperature<br />
would cause the ash to agglomerate. This implies the need for a highly reactive<br />
fuel. Coal is therefore not suitable as much fuel would remain in an un-reacted<br />
condition. Methane also is a problem for fluidised beds and this feature, plus<br />
the loss of carbon in the ash, results in this process being less i<strong>de</strong>al for<br />
hydrogen production or carbon capture.<br />
- Entrained-flow gasifiers are reactors in which the particles of coal<br />
are relatively dispersed and are carried along by a blast of reactants and<br />
products in co-current flow. The resi<strong>de</strong>nce time is just a few seconds and<br />
the temperatures are in the range of 1250 – 1600 o C to ensure good carbon<br />
conversion. High temperature ensures that the syngas has very low methane<br />
content and because the temperature is high and the fuel is dry, there are<br />
no limitations on the type of coal.<br />
The method of introducing the fuel into the gasifiers is specific to the<br />
<strong>de</strong>sign. There are, basically, two ways in which coal is transported into an<br />
entrained-flow gasifier: via water slurry (slurry feed gasifier), and via a gas,<br />
typically nitrogen (dry feed gasifier). For the slurry feed gasifier, the need to<br />
bring the water in the slurry up to gasifier temperatures, results in some of<br />
the coal having to be combusted, producing CO2, as this reaction provi<strong>de</strong>s<br />
much more energy than the reaction of coal with oxygen to produce CO. The<br />
effect of this is to reduce the amount of hydrogen that can be produced, since<br />
the CO can subsequently react with steam to form hydrogen. As a conclusion<br />
regarding the gasification reactor feed system, the dry feed system ensures<br />
a higher energy efficiency of the gasifier [1].<br />
85
86<br />
CĂLIN – CRISTIAN CORMOŞ, ŞERBAN PAUL AGACHI<br />
The key factors that are consi<strong>de</strong>red for selection of gasifiers for<br />
hydrogen and electricity co-production with CO2 capture are [1,10]: oxygen<br />
purity (usually 95 % O2 vol., air blown gasifiers being unsuitable because of the<br />
nitrogen dilution), gasifier throughputs, reliability and experience on the industrial<br />
scale (400 MW power), cold gas efficiency (CGE) and carbon conversion<br />
(which are optimum in case of entrained-flow gasifiers), syngas cooling<br />
options (the quench type being <strong>de</strong>sirable because the steam requirement of<br />
the shift conversion), hydrogen production potential (hydrogen and carbon<br />
monoxi<strong>de</strong> content as high as possible in the syngas) and implication of gasifier<br />
reactor on Acid Gas Removal system (from this point of view a gasifier able<br />
to run at high pressure being <strong>de</strong>sirable).<br />
Consi<strong>de</strong>ring the various commercial gasification reactors and their<br />
characteristics [1, 10-11] and analyzing these reactors against the above<br />
criteria, the most promising options for hydrogen and electricity co-generation<br />
schemes with carbon capture and storage are:<br />
- Entrained-flow gasifier with dry feed and heat recovery (<strong>de</strong>veloped<br />
by Shell);<br />
- Entrained-flow gasifier with dry feed and water quench (<strong>de</strong>veloped<br />
by Siemens formerly known Future Energy GmbH);<br />
- Entrained-flow gasifier with slurry feed and water quench (<strong>de</strong>veloped<br />
by General Electric – Texaco).<br />
The next section of this paper presents in <strong>de</strong>tail a <strong>de</strong>tailed mo<strong>de</strong>ling study<br />
for a plant concept based on Siemens gasification technology (entrained-flow<br />
gasifier with dry feed and syngas quench). The choice of Siemens gasification<br />
technology for an IGCC scheme with carbon capture for hydrogen and power<br />
generation is based on the following main factors: dry feed <strong>de</strong>sign which<br />
implies an increase energy efficiency compared with slurry feed <strong>de</strong>sign, water<br />
quench of the hot syngas which ensure the optimum condition for the shift<br />
conversion (no extra steam has to be ad<strong>de</strong>d to the syngas), good cold gas<br />
efficiency and carbon conversion, good hydrogen production potential and<br />
clean syngas.<br />
RESULTS AND DISCUSSIONS<br />
This section presents a mo<strong>de</strong>ling study of a whole IGCC plant <strong>de</strong>signed<br />
for hydrogen and electricity co-production with carbon capture based on<br />
Siemens gasification reactor. For the case study presented in <strong>de</strong>tail below,<br />
the coal characteristics consi<strong>de</strong>red as feedstock are presented in Table 1.<br />
The main sub-systems of the plant for co-generation of hydrogen<br />
and power co-generation with carbon capture and theirs <strong>de</strong>sign assumptions<br />
used in the mathematical mo<strong>de</strong>ling and simulation are presented in Table 2 [2,<br />
8,12-15].
GASIFICATION PROCESS – A PRACTICAL WAY FOR SOLID FOSSIL FUELS DECARBONISATION<br />
Table 1. Feedstock (coal) characteristics<br />
Parameter Coal<br />
Proximate analysis (% wt)<br />
Moisture 8.10<br />
Volatile matter 28.51<br />
Ash 14.19<br />
Ultimate analysis (% wt dry)<br />
Carbon 72.04<br />
Hydrogen 4.08<br />
Nitrogen 1.67<br />
Oxygen 7.36<br />
Sulphur 0.65<br />
Chlorine 0.01<br />
Ash 14.19<br />
Lower heating value - LHV (MJ/kg a.r.) 25.353<br />
Table 2. Main <strong>de</strong>sign assumptions for the plant concept<br />
Unit Parameters<br />
Air separation unit (ASU) Oxygen purity: 95 % (vol.)<br />
Delivery pressure: 2.37 bar<br />
Power consumption: 225 kWh/ton O2<br />
No integration with gas turbine<br />
Gasifier (Siemens) Pressure: 40 bar<br />
Pressure drop: 1.5 bar<br />
Temperature: >1400 o C<br />
Water quench<br />
Shift conversion (WGS) Sulphur tolerant catalyst<br />
Two adiabatic beds<br />
Pressure drop: 1 bar / bed<br />
Acid gas removal (AGR) Solvent: Selexol ® (mixture of di-methyl ethers of poly-ethylene glycols)<br />
Separate capture of CO2 and H2S<br />
Solvent regeneration: - thermal (heat) for H2S step<br />
CO2 compression and<br />
drying<br />
Claus plant & tail gas<br />
treatment<br />
Pressure Swing<br />
Adsorption (PSA)<br />
- pressure flash for CO2 step<br />
Delivery pressure: 100 bar<br />
Compressor efficiency: 85 %<br />
Solvent used for drying: TEG (Tri-ethylene-glycol)<br />
Drying level: < 500 ppm H2O<br />
Oxygen-blown<br />
H2S-rich gas composition: > 20 % (vol.)<br />
Tail gas recycled to H2S absorption stage<br />
Purified hydrogen: > 99.95 % (vol.)<br />
Purification yield: 85 %<br />
Tail gas pressure: 1.5 bar (recycled to the power island)<br />
Gas turbine Gas turbine type: M701G2 (Mitsubishi Heavy Industries Ltd.)<br />
Net power output: 334 MW<br />
Electrical efficiency: 39.5 %<br />
Pressure ratio: 21<br />
Heat recovery steam<br />
generation (HRSG) and<br />
steam cycle<br />
Turbine outlet temperature (TOT): 588 o C<br />
Three pressure levels: 118 bar / 34 bar / 3 bar<br />
Reheat of MP steam<br />
Steam turbine isoentropic efficiency: 85 %<br />
Steam wetness ex. steam turbine: max. 10 %<br />
Heat exchangers ΔTmin. = 10 o C<br />
Pressure drop: 1 % of inlet pressure<br />
87
88<br />
CĂLIN – CRISTIAN CORMOŞ, ŞERBAN PAUL AGACHI<br />
The hydrogen and electricity co-generation plant based on Siemens<br />
gasification technology presented in Figure 1 was mo<strong>de</strong>led and simulated<br />
using ChemCAD software. The case study was simulated in different situations<br />
(only electricity or various mo<strong>de</strong>s of hydrogen and electricity co-production).<br />
In case of power generation only mo<strong>de</strong>, the gas turbine is running full load and<br />
for hydrogen and electricity co-production mo<strong>de</strong> the gas turbine is gradually<br />
turned down to 80 % in or<strong>de</strong>r to displace an energy stream in form of hydrogenrich<br />
gas which can be then purified in a Pressure Swing Adsorption (PSA) unit<br />
to produce a purified hydrogen stream (99.95 % vol.) to be used in transport<br />
sector (PEM fuel cells).<br />
Table 3 presents the overall plant performance indicators (gross and<br />
net power output, electrical and hydrogen efficiencies, specific CO2 emissions)<br />
in electricity only and hydrogen and electricity co-generation with carbon<br />
capture and storage.<br />
Table 3. Overall plant performance indicators<br />
Main Plant Data Units Power Power + hydrogen<br />
Coal flowrate (a.r.) t/h 165704<br />
Coal LHV (a.r.) MJ/kg 25.353<br />
Feedstock thermal energy – LHV (A) MWth 1166.98<br />
Syngas thermal energy (B) MWth 934.75<br />
Cold gas efficiency (B/A * 100) % 80.10<br />
Thermal energy of syngas ex. AGR (C) MWth 830.70<br />
Syngas treatment efficiency (C/B *100) % 88.86<br />
Gas turbine output (1 x M701G2) MWe 334.00 314.97 296.27 277.58<br />
Steam turbine output (1 ST) MWe 197.50 187.44 177.38 167.40<br />
Expan<strong>de</strong>r power output MWe 0.78 0.72 0.66 0.61<br />
Gross electric power output (D) MWe 532.28 503.13 474.31 445.59<br />
Hydrogen output – LHV (E) MWth 0.00 50.00 100.00 150.00<br />
ASU consumption + O2 compression MWe 44.72 44.72 44.72 44.72<br />
Gasification island power consumption<br />
AGR + CO2 drying & compression<br />
MWe<br />
MWe<br />
8.08<br />
40.07<br />
8.08<br />
40.07<br />
8.08<br />
40.07<br />
8.08<br />
40.07<br />
H2 compression MWe 0.00 0.66 1.33 2.01<br />
Power island power consumption MWe 19.00 18.30 17.55 16.80<br />
Total ancillary power consumption (F) MWe 111.87 111.83 111.75 111.68<br />
Net electric power output (G = D - F) MWe 420.41 391.30 362.56 333.91<br />
Gross electrical efficiency (D/A * 100) % 45.61 43.11 40.64 38.18<br />
Net electrical efficiency (G/A * 100) % 36.02 33.53 31.06 28.61<br />
Hydrogen efficiency (E/A * 100) % 0.00 4.28 8.57 12.85<br />
Cumulative efficiency (G+E/A * 100) % 36.02 37.81 39.63 41.46<br />
Carbon capture rate % 92.35 92.35 92.35 92.35<br />
CO2 specific emissions kg/MWh 76.12 80.16 86.27 93.41
GASIFICATION PROCESS – A PRACTICAL WAY FOR SOLID FOSSIL FUELS DECARBONISATION<br />
Compared with classic IGCC technology for power generation without<br />
carbon capture which has an overall net energy efficiency of about 42 % [16],<br />
the modified IGCC technology for carbon capture is penalized by 7 – 8 % which<br />
is the energy penalty for the carbon capture process. This is the price in term<br />
of energy for <strong>de</strong>creasing the specific CO2 emissions from about 800 kg/MWh<br />
(for no capture case) to about 76.12 kg/MWh for the capture case (92.35 %<br />
carbon capture rate).<br />
Another fact that has to be mentioned for hydrogen and power coproduction<br />
mo<strong>de</strong>, is the overall energy efficiency of the plant that is increasing<br />
in the situation in which the ancillary power consumption is remaining virtually<br />
constant (see Table 3). This fact is very important and attractive for plant cycling<br />
(modification of the power generated by the plant according to the <strong>de</strong>mand<br />
of the national grid) consi<strong>de</strong>ring that for low electricity <strong>de</strong>mand the plant can<br />
produce mostly hydrogen which compared with power can be stored to be used<br />
either for covering the peak loads or for other applications (transport sector,<br />
petro-chemical sector etc.).<br />
Figure 2 presents the variations of net electrical efficiency, hydrogen<br />
efficiency and overall energy efficiency with hydrogen and power co-production<br />
rate (thermal energy of the hydrogen output stream).<br />
Efficiency (%)<br />
45<br />
40<br />
35<br />
30<br />
25<br />
20<br />
15<br />
10<br />
5<br />
0<br />
0 50 100 150<br />
Hydrogen output (MW)<br />
Electrical efficiency<br />
Hydrogen efficiency<br />
Cumulative efficiency<br />
Figure 2. Variation of net electricity, hydrogen and overall efficiency<br />
vs. hydrogen and power co-production rate.<br />
In the range of 0 to 200 MW hydrogen (based on 10.795 MJ/Nm 3<br />
hydrogen lower heating value), the gas turbine can be gradually turned down<br />
to about 80 % of the nominal load [4]. For higher hydrogen plant flexibility<br />
89
90<br />
CĂLIN – CRISTIAN CORMOŞ, ŞERBAN PAUL AGACHI<br />
(for the case <strong>de</strong>scribed above, i.e. more than 200 MW hydrogen), another<br />
approach must be used in plant <strong>de</strong>sign namely building a separate power<br />
block <strong>de</strong>signed to provi<strong>de</strong> the ancillary power for the plant [17, 18].<br />
CONCLUSIONS<br />
This paper assesses the main characteristics of coal gasifiers for<br />
hydrogen and electricity co-production scheme with carbon capture based on<br />
a modified IGCC plant <strong>de</strong>sign. The main aim has been to <strong>de</strong>velop evaluation<br />
criteria and then to select the most appropriate coal gasification concepts<br />
for hydrogen and electricity co-production with carbon capture and storage<br />
(CCS) and to investigate how the gasifier selection affects the other subsystems<br />
of the plant (e.g. Acid Gas Removal unit).<br />
The most three promising concepts for hydrogen and electricity coproduction<br />
with carbon capture based on coal gasification are all based on<br />
entrained-flow gasifiers (dry feed with heat recovery - Shell, dry feed with<br />
water quench – Siemens and slurry feed with water quench – GE Texaco).<br />
The paper also presents in <strong>de</strong>tail a case study for hydrogen and<br />
electricity co-production based on Siemens gasifier and with carbon capture<br />
step using a physical absorption (solvent Selexol ® ). This case study was<br />
mo<strong>de</strong>led and simulated using ChemCAD software and the simulation results<br />
were used for quantification of main performance characteristics (overall plant<br />
efficiency, carbon capture rate, specific CO2 emissions etc.).<br />
ACKNOWLEDGMENTS<br />
This work has been supported by Romanian National University<br />
Research Council (CNCSIS) through grant no. 2455: “Innovative systems<br />
for poly-generation of energy vectors with carbon dioxi<strong>de</strong> capture and<br />
storage based on co-gasification processes of coal and renewable energy<br />
sources (biomass) or solid waste”.<br />
REFERENCES<br />
1. C. Higman, M. Van <strong>de</strong>r Burgt, “Gasification”, Elsevier Science, second edition,<br />
2008, chapters 1-4.<br />
2. International Energy Agency (IEA), Greenhouse Gas Program (GHG),<br />
Potential for improvement in gasification combined cycle power generation<br />
with CO2 capture, 2003, Report PH4/19.<br />
3. International Energy Agency (IEA), Greenhouse Gas Program (GHG), CO2<br />
capture in low rank coal power plants, 2006, Report 2006/1.<br />
4. H. Cohen, G.F.C. Rogers, H.I.H. Saravanuamutto, “Gas Turbine Theory”,<br />
4th Edition, Addison Wesley Longman Ltd, 1996, 131.
GASIFICATION PROCESS – A PRACTICAL WAY FOR SOLID FOSSIL FUELS DECARBONISATION<br />
5. A. Kohl, R. Nielsen, “Gas purification”, Gulf Publishing Comp., 1997, chapter 2.<br />
6. E. Tzimas, F. Starr, S. D. Peteves, “A large scale test facility for the production<br />
of hydrogen and electricity”. The HYPOGEN project: A JRC – SETRIS<br />
perspective”, European Commission, JRC, Institute for Energy, Petten, The<br />
Netherlands, 2005, Report EUR 21651.<br />
7. F. Starr, E. Tzimas, S.D. Peteves, “Near-term IGCC and steam reforming<br />
processes for the hydrogen economy. The <strong>de</strong>velopment issues.”, European<br />
Commission, JRC, Institute for Energy, Petten, The Netherlands, 2006, Report<br />
EUR 22340.<br />
8. P. Chiesa, S. Consonni, T. Kreutz, R. Williams, International Journal of Hydrogen<br />
Energy, 2005, 30, 747.<br />
9. R. Domenichini, L. Mancuso, “IGCC plants – A practical pathway for combined<br />
production of hydrogen and power from fossil fuels”, Foster Wheeler Italiana<br />
Spa, 2003.<br />
10. C. Cormoş, F. Starr, E. Tzimas, S. Peteves, A. Brown, “Gasifier concepts<br />
for hydrogen and electricity co-production with CO2 capture”, Third International<br />
Conference on Clean Coal Technologies, Cagliari, Sardinia, Italy, 2007.<br />
11. C. Cormoş, “Decarbonizarea combustibililor fosili solizi prin gazeificare”,<br />
Presa Universitară Clujană, 2008, chapters 3-4.<br />
12. C. Cormos, F. Starr, E. Tzimas, S. Peteves, International Journal of Hydrogen<br />
Energy, 2008, 33, 1284.<br />
13. K. Jordal, International Journal of Greenhouse Gas Control, 2008, 2, 468.<br />
14. K. Damen, M. Van Troost, A. Faaij, W. Turkenburg, Progress in Energy<br />
Combustion Science, 2006; 32, 215.<br />
15. J. Hetland, L. Zheng, X. Shisen, Applied Energy, 2009, 86, 219.<br />
16. E. Tzimas, A. Mercier, C. Cormos, S. Peteves, Energy Policy, 2007, 35, 3991.<br />
17. F. Starr, E. Tzimas, C. Cormos, S. Peteves, Hydrocarbon Processing, 2007,<br />
5, 6.<br />
18. F. Starr, E. Tzimas, S.D. Peteves, International Journal of Hydrogen Energy,<br />
2007, 32, 1477.<br />
91
STUDIA UNIVERSITATIS BABES-BOLYAI, CHEMIA, LIV, 1, 2009<br />
Dedicated to Professor Liviu Literat, at his 80 th anniversary<br />
SEDIMENTATION SIMULATION OF COAGULATED YEAST<br />
SUSPENSIONS FROM WASTEWATER<br />
VICTORIA GOIA a , ADINA-LUCREłIA GHIRIŞAN a<br />
AND VASILE-MIRCEA CRISTEA a<br />
ABSTRACT. On the basis of mathematical mo<strong>de</strong>lling and numerical simulation<br />
the batch settling of coagulated yeast suspensions was analysed. Time<br />
and space behaviour of the solids height and critical height of sediment in<br />
gravitational settling, has shown similar results comparative to experimental<br />
data. The method offers the possibility to predict by simulation the settling rate<br />
for the consolidation region, a key settling variable difficult to be measured<br />
experimentally but important for the settler <strong>de</strong>sign.<br />
Keywords: sedimentation, settling rate, coagulated yeast suspensions,<br />
simulation<br />
INTRODUCTION<br />
Solving the water pollution problem by colloidal and micro suspen<strong>de</strong>d<br />
particles resulting from breweries has been a challenge for a long time. As it is<br />
known for colloids and fine particles, main transport mechanisms inclu<strong>de</strong><br />
convection, Brownian diffusion, shear-induced diffusion, inertial lift, gravitational<br />
settling and lateral migration. Their relative importance strongly <strong>de</strong>pends on<br />
the shear rate, particle size and bulk concentration. To improve the solid-liquid<br />
separation of micro-particles in aqueous suspensions before sedimentation<br />
and/or before filtration a common used method is aggregation (coagulation<br />
or flocculation). Some studies concerning settling of yeast micro-particles<br />
have shown that coagulation or flocculation, as a pre-treatment step before<br />
conventional sedimentation, could improve colloidal and micro-particles removal<br />
from aqueous suspension [1, 2].<br />
Investigations of yeast particles sedimentation in water <strong>de</strong>monstrated<br />
that lack or low and limited separation may occur if no coagulant was ad<strong>de</strong>d to<br />
induce a <strong>de</strong>stabilization between yeast particles [3]. Pre-treatment by coagulation<br />
a Universitatea Babeş-Bolyai, <strong>Facultatea</strong> <strong>de</strong> <strong>Chimie</strong> <strong>şi</strong> <strong>Inginerie</strong> <strong>Chimică</strong>, Str. Kogălniceanu Nr. 1,<br />
RO-400084 Cluj-Napoca, Romania, vgoia@chem.ubbcluj.ro
94<br />
VICTORIA GOIA, ADINA-LUCREłIA GHIRIŞAN, VASILE-MIRCEA CRISTEA<br />
or flocculation using chemical additives <strong>de</strong>stabilizes colloidal suspensions,<br />
allowing colloidal and fine particles to agglomerate into micro- and large<br />
flocks which settle more quickly than single particles because of their larger<br />
mass to surface area ratio.<br />
The sedimentation behaviour of aggregated suspensions strongly<br />
<strong>de</strong>pends on concentration. Experimental sedimentation in a batch system<br />
shows different regions of sedimentation, as presented in Figure 1.<br />
φ = 0<br />
Free Fall Zone φ = φ 0<br />
Collapse Zone φ > φ 0<br />
H0 Initial Solids Height<br />
H(t) Solids Height<br />
zc(t) Critical Height<br />
of sediment<br />
z = 0 Container bottom<br />
Figure 1. Schematic illustration of sedimentation zones.<br />
In dilute suspensions (Φ = Φ0) or at low <strong>de</strong>grees of aggregation,<br />
particles and aggregates settle in<strong>de</strong>pen<strong>de</strong>ntly and their motion is unaffected<br />
by the motion of other particles (free sedimentation). In more concentrated<br />
suspensions (Φ > Φ0) or higher <strong>de</strong>grees of aggregation, sedimentation is<br />
influenced by hydrodynamic interaction with other moving particles and<br />
hin<strong>de</strong>red settling or zone settling is observed [4-6]. The transition from free<br />
sedimentation to hin<strong>de</strong>red settling occurs at a concentration which <strong>de</strong>pends on<br />
the <strong>de</strong>gree of aggregation. Zone settling may be found at quite low solids<br />
concentrations if the particles are aggregated to a large extent. For high<br />
concentrations of aggregated particles compression becomes significant<br />
and this is typically observed at the bottom of the sedimentation vessel.<br />
Mathematical mo<strong>de</strong>ls of the sedimentation process are nee<strong>de</strong>d in<br />
industrial applications for the <strong>de</strong>scription, simulation, <strong>de</strong>sign and control of<br />
solid-liquid separation processes of suspensions, as it is also the case of<br />
coagulated yeast suspensions from wastewater.<br />
According to Buscall and White [7], the system of equations (1) – (4)<br />
<strong>de</strong>scribing the sedimentation process consists in:
SEDIMENTATION SIMULATION OF COAGULATED YEAST SUSPENSIONS FROM WASTEWATER<br />
where:<br />
( u)<br />
∂φ ∂ φ<br />
=<br />
∂t<br />
∂z<br />
( 1−<br />
)<br />
ust<br />
φ ⎡ 1 ∂p<br />
⎤<br />
u = ⎢1<br />
+ ⋅<br />
r(<br />
φ)<br />
⎥<br />
⎣ Δρ<br />
⋅ g ⋅φ<br />
∂z<br />
⎦<br />
∂u<br />
= 0 for p < Py<br />
(φ)<br />
∂z<br />
(3)<br />
∂u<br />
k(<br />
φ)<br />
= [ p − Py<br />
( φ)]<br />
for p ≥ Py<br />
(φ)<br />
∂z<br />
φ<br />
(4)<br />
Consi<strong>de</strong>ring that suspension is fully networked, the numerical<br />
mo<strong>de</strong>lling technique solves the system of equations and computes the time<br />
evolution of the two moving boundaries which <strong>de</strong>scribe the settling and the<br />
consolidation process [8].<br />
For the simulation the mathematical mo<strong>de</strong>l <strong>de</strong>scribed below has<br />
been implemented in MatLab software. Dimensionless sedimentation<br />
equations are obtained by the use of the following scaling:<br />
Z =<br />
z<br />
H 0<br />
t ⋅ u<br />
T =<br />
r<br />
Z<br />
c<br />
( T )<br />
st ⋅ ( 1−<br />
φ)<br />
( φ)<br />
⋅ H 0<br />
φ( z,<br />
t)<br />
Φ(<br />
Z , T ) =<br />
φ<br />
U<br />
( Z,<br />
T )<br />
0<br />
=<br />
z<br />
c<br />
H<br />
( t)<br />
0<br />
( φ )<br />
u(<br />
z,<br />
t)<br />
⋅ r 0<br />
=<br />
⋅ ( 1−<br />
φ )<br />
ust<br />
P(<br />
z,<br />
t)<br />
Π(<br />
Z , T ) =<br />
( φ )<br />
B(<br />
Φ)<br />
=<br />
Py<br />
( 1−<br />
φ0<br />
⋅ Φ)<br />
⋅ r(<br />
φ0<br />
)<br />
( 1−<br />
φ ) ⋅ r(<br />
φ ⋅ Φ)<br />
For the consolidation zone to exist:<br />
Py ( φ0<br />
)<br />
ε =<br />
< 1<br />
Δρ<br />
⋅ g ⋅φ<br />
⋅ H<br />
0<br />
0<br />
0<br />
0<br />
0<br />
0<br />
H<br />
L ( T ) =<br />
H<br />
Py<br />
( φ)<br />
f ( Φ)<br />
=<br />
P ( φ )<br />
y<br />
0<br />
( t)<br />
0<br />
(1)<br />
(2)<br />
(5)<br />
(6)<br />
(7)<br />
(8)<br />
(9)<br />
(10)<br />
(11)<br />
95
96<br />
VICTORIA GOIA, ADINA-LUCREłIA GHIRIŞAN, VASILE-MIRCEA CRISTEA<br />
The solution in the free-fall zone (Zc(T) ≤ Z ≤ L(T)) may be obtained<br />
from the set of equations:<br />
( Z,<br />
) = 1<br />
Φ T<br />
(12)<br />
dL<br />
U ( Z,<br />
T ) = −<br />
dT<br />
(13)<br />
1 ⎡ dL ⎤<br />
Π ( Z, T ) =<br />
⎢<br />
1+<br />
[ L T − Z ]<br />
⎣ dT ⎥<br />
( )<br />
ε ⎦<br />
(14)<br />
In the collapse zone (0 < Z < Zc(T)) the dimensionless equations<br />
and boundary conditions are:<br />
∂Φ<br />
∂<br />
= ( Φ ⋅U<br />
)<br />
∂T<br />
∂Z<br />
(15)<br />
⎡ ε ∂Φ<br />
⎤<br />
U ( Z,<br />
T ) = B(<br />
Φ)<br />
⋅<br />
⎢<br />
1+<br />
⋅ f '(<br />
Φ)<br />
⎣ Φ ∂Z<br />
⎥<br />
⎦<br />
Φ( Z,<br />
0)<br />
= 1<br />
U ( 0 , T ) = 0<br />
Φ( Z c ( T ), T ) = 1<br />
(16)<br />
(17)<br />
(18)<br />
(19)<br />
dL<br />
U ( Z c ( T ), T ) = −<br />
dT<br />
(20)<br />
The equation connecting the solids height to the critical height is:<br />
⎡ dL ⎤<br />
⎢<br />
1+ ⎥<br />
⋅<br />
c T )<br />
⎣ dT ⎦<br />
[ L(<br />
T)<br />
− Z ( ] = ε<br />
The functions B(Φ) and f(Φ) may be <strong>de</strong>tailed by:<br />
0<br />
( Φ)<br />
= ⎢ ⎥<br />
⎣ 1−<br />
φ0<br />
⎦<br />
n n<br />
5.<br />
5<br />
(21)<br />
⎡1−φ<br />
⋅Φ<br />
⎤<br />
B (22)<br />
C ⋅ Φ −1<br />
f ( Φ) =<br />
(23)<br />
n<br />
C −1<br />
The parameter C is and <strong>de</strong>fined by:<br />
φ0 C<br />
φg<br />
= (24)
SEDIMENTATION SIMULATION OF COAGULATED YEAST SUSPENSIONS FROM WASTEWATER<br />
where the parameter φ g represents the lowest volume fraction for which the<br />
flocculated particles are networked. The parameter n represents the in<strong>de</strong>x in<br />
yield stress function.<br />
When equations are rewritten in terms of Φ and dimensionless<br />
solids flux Q= Φ U, they <strong>de</strong>scribe the collapse zone by:<br />
∂Q<br />
∂Φ<br />
=<br />
∂Z<br />
∂T<br />
(25)<br />
∂Φ<br />
1<br />
=<br />
[ Q − Φ ⋅ B(<br />
Φ)<br />
]<br />
∂Z<br />
ε ⋅ f ' ( Φ)<br />
⋅ B(<br />
Φ)<br />
Φ( Z,<br />
0)<br />
= 1<br />
Q(<br />
0 , T ) = 0<br />
Φ( Z c ( T ), T ) = 1<br />
(26)<br />
(27)<br />
(28)<br />
(29)<br />
dL<br />
Q( Z c ( T),<br />
T ) = −<br />
dT<br />
(30)<br />
⎡ dL ⎤<br />
⎢<br />
1+ ⎥<br />
⋅[<br />
L(<br />
T)<br />
− Z c ( T ) ] = ε<br />
⎣ dT ⎦<br />
(31)<br />
Equations (25) – (31) must be solved numerically to obtain the<br />
volume fraction Φ ( Z,<br />
T ) , the solids height L(T), the solid flux Q(Z,T) and the<br />
critical height Zc(T).<br />
The significance of the symbols is: B(Φ) - scaled hydrodynamic drag<br />
function, C - constant in f (Φ)<br />
, dp50 - mean particles diameter, f (Φ)<br />
- scaled<br />
yield stress function, g - gravitational constant, k(φ ) - dynamic compressibility<br />
of the flocculated network, L(T) - scaled solids height, n - in<strong>de</strong>x in yield stress<br />
function, p – network pressure, P (φ)<br />
- yield stress of a flocculated suspension,<br />
Q - scaled solids flux, ( φ)<br />
y<br />
r - hydrodynamic interaction factor, t - time, T - scaled<br />
time, u - solids velocity vector, ust - Stokes settling velocity of an isolated<br />
particle, U(Z,T) -scaled solids speed, w - fluid velocity vector, z - vertical<br />
spatial coordinate, zc(t) - critical height, boundary of the consolidation zone,<br />
Z - scaled vertical spatial coordinate, Zc(T) - scaled critical height, Δ ρ - difference<br />
between solid and fluid <strong>de</strong>nsities, ε - dimensionless number characterizing the<br />
flocculated suspension, ηl - fluid viscosity, ρs - <strong>de</strong>nsity of the solids, ρl - liquid<br />
<strong>de</strong>nsity, φ - volume fraction of suspension occupied by solids, φg - gel point<br />
of a flocculated suspension, φ 0 - initial volume fraction, Φ ( Z, T ) - scaled solids<br />
Π Z, T - scaled network pressure.<br />
volume fraction, ( )<br />
97
98<br />
VICTORIA GOIA, ADINA-LUCREłIA GHIRIŞAN, VASILE-MIRCEA CRISTEA<br />
Numerical values for the parameters taken into consi<strong>de</strong>ration in the<br />
mo<strong>de</strong>l are:<br />
- initial solids height H0 = 102 mm<br />
- fluid viscosity η = 10 -3 Pa*s<br />
- solid <strong>de</strong>nsity ρ = 1100 kg/m 3<br />
- sedimentation rate uSt = 2.725*10 -4 m/s (<strong>de</strong>termined for particles<br />
diameter dp =50 µm)<br />
- initial volume fraction 0 0.<br />
014 = φ<br />
The goal of the paper has been the implementation of the sedimentation<br />
mo<strong>de</strong>l equations for the case of yeast suspensions from a brewery and<br />
comparison of the simulation results with experimental data in or<strong>de</strong>r to<br />
validate the mo<strong>de</strong>l for further use of the simulator in equipment <strong>de</strong>sign and<br />
operation optimization of the sedimentation process.<br />
RESULTS AND DISCUSSION<br />
First, on the basis of the mo<strong>de</strong>l <strong>de</strong>scribed above, a simulator has<br />
been built in MatLab software environment. The simulator <strong>de</strong>scribes the<br />
sedimentation of suspensions in the free fall and consolidation zones.<br />
Second, the parameters of the simulator have been fitted to the particular<br />
case un<strong>de</strong>r study. Furthermore, the parameters n and C of the mo<strong>de</strong>l have<br />
been chosen on the basis of the experimental results.<br />
In or<strong>de</strong>r to find out the suitable value of the mo<strong>de</strong>l parameter n for the<br />
investigated sedimentation process of coagulated yeast suspensions, different<br />
simulations have been performed, for different values of n. Analysing the<br />
simulation results it has been <strong>de</strong>ci<strong>de</strong>d the most suitable value for n to be 5.<br />
Consequently, the simulation of the sedimentation process was performed<br />
with the parameters C = 3 and n = 5. Figure 2 presents the computed scaled<br />
volume fraction Φ as a function of Z, in the consolidating zone and at various<br />
scaled time moments T.<br />
1.6<br />
1.6<br />
1.5<br />
1.5<br />
1.4<br />
1.4<br />
1.3 1.3<br />
1.3<br />
1.2<br />
1.2<br />
1.1<br />
1.1<br />
1<br />
0 0.1 0.1<br />
0.2 0.2 0.2<br />
0.3 0.3<br />
0.4 0.4<br />
0.5 0.5<br />
0.6 0.6<br />
0.7<br />
0.7<br />
Z<br />
Figure 2. Volume fraction pro<strong>file</strong>s for n = 5, C = 3, ε = 0.1, at different time moments.<br />
T=0.01<br />
T=0.01<br />
T=0.05<br />
T=0.05<br />
T=0.1<br />
T=0.1<br />
T=0.15<br />
T=0.15<br />
T=0.2<br />
T=0.2<br />
T=0.3<br />
T=0.3<br />
T=0.4<br />
T=0.4<br />
T=0.5<br />
T=0.5
SEDIMENTATION SIMULATION OF COAGULATED YEAST SUSPENSIONS FROM WASTEWATER<br />
Figure 3 shows the simulated solids height H(t) and the critical height<br />
of sediment zc(t) as a function of time.<br />
H e ig h t (m m )<br />
120<br />
100<br />
80<br />
60<br />
40<br />
20<br />
0<br />
0 20 40 60 80 100<br />
Time (s)<br />
120 140 160 180 200<br />
Figure 3. Critical height of sediment zc(T) and solids height H(t) for n =5, C =3, ε =0.1.<br />
The experimental results show that at the initial time, t = 0, H(t) = H0 =<br />
102 mm and when all the large particles are settled H(t) = Hfinal = 78.588 mm.<br />
Figure 4 shows the progress of the experimental solids height as a<br />
function of time, compared to the results obtained by the numerical simulation.<br />
H e ig h t (m m )<br />
105<br />
100<br />
95<br />
90<br />
85<br />
80<br />
75<br />
70<br />
0 20 40 60 80 100 120 140 160 180 200 220<br />
Time (s)<br />
zc(t)<br />
H(t)<br />
Simulation<br />
Experiment<br />
Figure 4. Comparison of solids height change in time for both experimental<br />
and simulated case.<br />
99
100<br />
VICTORIA GOIA, ADINA-LUCREłIA GHIRIŞAN, VASILE-MIRCEA CRISTEA<br />
Comparing the experimental and the mo<strong>de</strong>lling results it may be<br />
conclu<strong>de</strong>d that a good match between the simulation and the experiment<br />
was obtained. Comparison between the experimental sedimentation time<br />
and the simulated sedimentation time has been also performed and the<br />
results show values close one to each other: texp = 210 s and tsim = 202 s.<br />
CONCLUSIONS<br />
The aim of this study was to build a sedimentation simulator in MatLab<br />
software, in or<strong>de</strong>r to investigate the sedimentation of coagulated yeast<br />
suspensions from wastewaters. The simulator reveals the complex time and<br />
space evolution of the sediment concentration in the settler.<br />
An important outcome of the simulator is its ability to compute the<br />
change in time of the critical height, an important process variable which is<br />
very difficult to be experimentally observed due to the poorly <strong>de</strong>limited<br />
boundary of the critical sediment height.<br />
The simulator also offers the means for investigating the influence of<br />
different settling parameters on the sedimentation process. Such parameters<br />
that influence the sedimentation and that can be observed with the simulator<br />
are: yeast particle diameter, initial suspension concentration, viscosity,<br />
differences between solid and liquid <strong>de</strong>nsities and gel point of flocculated<br />
suspensions. The simulator is also a useful tool for the computation of the<br />
theoretical sedimentation time (time when all the solid particles are settled).<br />
As the simulator presents the complex time and space behaviour of<br />
important sedimentation variables, such as: sedimentation rate, solid<br />
concentration, time of sedimentation, it may be further used for the <strong>de</strong>sign<br />
and optimization operation of the settler.<br />
EXPERIMENTAL SECTION<br />
In or<strong>de</strong>r to <strong>de</strong>termine the solids and critical heights the experimental<br />
measurements of sedimentation were carried out in a batch settling test<br />
with 5 graduated cylin<strong>de</strong>rs having D = 50 mm and H = 500 mm, by the same<br />
method <strong>de</strong>scribed in the earlier work [1]. Wastewater from brewery “URSUS”,<br />
Cluj-Napoca, Romania was used as suspen<strong>de</strong>d material for the experimental<br />
research. Untreated effluents typically contain suspen<strong>de</strong>d solids in the range<br />
of 10 – 60 mg/L, biochemical oxygen <strong>de</strong>mand (BOD) in the range of 1,000 –<br />
5,000 mg/L, chemical oxygen <strong>de</strong>mand (COD) in the range of 1,800 – 3,000 mg/L,<br />
and nitrogen in the range of 30 – 100 mg/L. In the experimental sample Ferric<br />
chlori<strong>de</strong> (FeCl3) with the concentration 1150 ppm was used as coagulant.<br />
Sedimentation curve has been experimentally <strong>de</strong>termined by the measurement<br />
of the moving solids height during time.<br />
ACKNOWLEDGMENTS<br />
Funding from grant PN71-006 is gratefully acknowledged.
SEDIMENTATION SIMULATION OF COAGULATED YEAST SUSPENSIONS FROM WASTEWATER<br />
REFERENCES<br />
1. A. Ghirişan, M. Azad, STUDIA Universitatis “Babeş-Bolyai”, Chemia, 2005,<br />
50(1), 113.<br />
2. C. Posten, “Biological Aspects in Solid-Liquid Separation, A review for IFPRI”,<br />
Institute of Mechanical Process Engineering, Karlsruhe, Germany, 2004.<br />
3. U. Stahl, U. Hues, K. Esser, European Journal of Appl. Microbial<br />
Biotechnology, 1983, 17, 199.<br />
4. A. Rushton, A. S. Ward, R. G. Holdich, “Solid-Liquid Filtration and Separation<br />
Tehnology”, Wiley-VCH, Weinheim, 1996, chapters 3-5.<br />
5. E. S. Tarleton, Proceedings of the International Conference and Exhibition<br />
FILTECH Europa Dusseldorf, Germany, 2001, 1, 20.<br />
6. H. Nirschl, Proceedings of the 10 th Filtration Congress, Leipzig, Germany,<br />
2008, 1, 391.<br />
7. R. Buscall, L.R. White, J. Chem. Soc. Faraday Trans. 1987, 83, 873.<br />
8. I. Howells, K. Landman, A. Panjkov, C. Sirakoff, L. R. White, Appl. Math.<br />
Mo<strong>de</strong>lling, 1990, 14, 77.<br />
101
STUDIA UNIVERSITATIS BABES-BOLYAI, CHEMIA, LIV, 1, 2009<br />
Dedicated to Professor Liviu Literat, at his 80 th anniversary<br />
CASE STUDY OF STRUCTURAL SAFETY BASED ON<br />
ARTIFICIAL INTELLIGENCE<br />
CĂLIN IOAN ANGHEL a , IOAN LAZĂR<br />
ABSTRACT. The paper provi<strong>de</strong>s a new insight into safety assessment using<br />
artificial intelligence methods. In safety in<strong>de</strong>x assessment, besi<strong>de</strong> of the<br />
traditional FORM/SORM methods, a minimax probability machine approach<br />
was implemented. The core of the procedure based on a binary classification<br />
approach was <strong>de</strong>veloped according to a novel type of support vector machine<br />
in a minimax manner. The procedure, involving a link between artificial<br />
intelligence and structural reliability methods was <strong>de</strong>veloped as a user-friendly<br />
computer program in MATLAB language. For simplicity, only safety in<strong>de</strong>x<br />
approaches was presented. A numerical example replicating some previous<br />
related works reveals the opportunity of this approach in safety analysis.<br />
Keywords: risk assessment, safety in<strong>de</strong>x, limit state function, support vector<br />
machine, minimax approach, pressure vessel.<br />
INTRODUCTION<br />
To avoid failure or major inci<strong>de</strong>nts technological systems must to be<br />
safe. Basically, safety can be thought as a state, a perceived state or a quality.<br />
Approaches of system safety presume planned, disciplined and systematic<br />
assessments to prevent or reduce acci<strong>de</strong>nts throughout the life cycle of a<br />
technological system. Structural safety related to process equipment is a<br />
part of the global safety of technological system. Because safety is a state, it<br />
cannot be quantified directly. Rather, assessing and controlling risk assure this<br />
state. The most usually <strong>de</strong>finitions for risk in engineering applications are [1]:<br />
- a combination of the likelihood and the consequences of a future event;<br />
- the failure probabilities for a number of different scenarios;<br />
- the product between the probability of occurrence and the quantified<br />
consequence of a future event.<br />
a Universitatea Babeş-Bolyai Cluj-Napoca, <strong>Facultatea</strong> <strong>de</strong> <strong>Chimie</strong> <strong>şi</strong> <strong>Inginerie</strong> <strong>Chimică</strong>, Str. M.<br />
Kogălniceanu Nr. 1, RO-400084 Cluj-Napoca, canghel@chem.ubbcluj.ro
104<br />
CĂLIN IOAN ANGHEL, IOAN LAZĂR<br />
The equipment for process industries, are hardly affected by: fluctuations<br />
and variations in service loading and operating conditions, scatters in material<br />
properties and manufacturing process, uncertainties regarding the analytical<br />
mo<strong>de</strong>ls, continuous chemical corrosion and so on. Many engineering <strong>de</strong>cisions<br />
concerning the safety of technological equipment for process industries are<br />
usually <strong>de</strong>terministic. These <strong>de</strong>terministic mo<strong>de</strong>ls provi<strong>de</strong> a difficulty in handling<br />
variations and uncertainties in service conditions or variability concerning the<br />
main variables. To avoid these drawbacks, probabilistic methods became wellestablished<br />
tools in the risk assessment. The structural reliability procedures [2,<br />
3] based on safety in<strong>de</strong>x and failure probability are still of greater importance<br />
in engineering applications. There are various methods to compute the safety<br />
in<strong>de</strong>x. Sampling-based methods (Monte Carlo Simulation, Latin Hypercube<br />
Sampling, etc.), analytical approximation methods like the Response Surface,<br />
the First-and Second-Or<strong>de</strong>r Reliability (FORM/ SORM) methods, advanced<br />
second moment method (ASM) or asymptotic techniques are among the most<br />
common methods used to estimate safety in<strong>de</strong>x or the failure probability. In<br />
general all these methods are time consuming, have limitations and an<br />
approximate nature. Despite of the recent important advances these traditional<br />
methods cannot fulfil in a satisfactory manner all the <strong>de</strong>mands. The variability<br />
and uncertainty inclu<strong>de</strong>d in parameters of the mo<strong>de</strong>l can <strong>de</strong>termine major<br />
changes in the safety of the system. Within this context over the past<br />
<strong>de</strong>ca<strong>de</strong> intense effort has been <strong>de</strong>voted to bring i<strong>de</strong>as from the artificial<br />
intelligence field into engineering problems related to structural safety [4-7].<br />
The aim of this paper is to present a procedure suitable for engineers<br />
in the stage of structural risk analysis. For simplicity it is based on the<br />
previous second mentioned <strong>de</strong>finition of the risk. To compute the safety<br />
in<strong>de</strong>x the procedure focuses on the reliability concept <strong>de</strong>veloped in an artificial<br />
intelligence manner based on the support vector machine (SVM-a primarily<br />
two-class classifier) in a minimax approach. Some advantages of the support<br />
vector machine in minimax approach are: (a) provi<strong>de</strong>s an explicit direct upper<br />
bound on the probability of misclassification of new data, without making any<br />
specific distribution assumptions and (b) obtains explicit <strong>de</strong>cision<br />
boundaries based on a global information of available data. The support vector<br />
machine and minimax approach, named minimax probability machine<br />
classification, has become an active research topic [8-11]. The problem of<br />
finding the safety in<strong>de</strong>x will be reported as a binary classification problem<br />
according to the traditional reliability methods better known by their<br />
acronyms FORM/SORM. The binary classification is applied to samples<br />
obtained by simulating a performance function or to values obtained by<br />
experimental analyses. Basically in structural safety methods the boundary<br />
between the two domains S-safe and F-unsafe is called the failure limit<br />
hyper surface and corresponds to a limit state function. This limit state
CASE STUDY OF STRUCTURAL SAFETY BASED ON ARTIFICIAL INTELLIGENCE<br />
function is tantamount to a <strong>de</strong>cision function that classifies the samples. In<br />
principle the problem becomes a binary classification one and the <strong>de</strong>cision<br />
function becomes a function whose sign represents the class assigned to<br />
any sampled point. The proposed procedure named minimax <strong>de</strong>cision<br />
procedure, involving a link between artificial intelligence and reliability methods<br />
was <strong>de</strong>veloped as a user-friendly computer program in MATLAB language.<br />
The main parts of the paper are: (1) introduction, (2) theoretical overview for<br />
safety in<strong>de</strong>x assessment in minimax approach, (3) numerical examples<br />
implemented in the MATLAB package and (4) conclusions. Numerical<br />
example is reported to the risk of failure for a thin-wall pressure vessel during<br />
its serviceable life. It is associated with structure’s strength, corrosion effects<br />
and the presumption of miss regulated of heating/cooling closed loop system.<br />
Safety In<strong>de</strong>x Assessment in a Minimax Approach<br />
Safety and safety in<strong>de</strong>x assessment of systems/structures are well<br />
established. Basic knowledge exists and many papers are available in the<br />
literature [2,3]. The paper focuses only on the methods better known by<br />
their acronyms FORM/SORM. Instead of these traditional methods, the<br />
safety in<strong>de</strong>x approach will be obtained based on a <strong>de</strong>cisional procedure using<br />
a binary classification procedure. Because basic fundamentals and principles<br />
were presented elsewhere [6,7] only the main principle of implemented<br />
procedure will be presented. A starting point is the establishment of the<br />
performance or response function, which gives the relation between the inputs<br />
of the system and the chosen performance. This performance function<br />
<strong>de</strong>pends on the set of governing input parameters representing vectors of<br />
all random variables, x = (x1, x2,…,xd) ∈R d . If PF represents performance<br />
function and PFCR represents a critical value of particular interest of this<br />
performance function, the limit state function (LSF) is the locus of points of<br />
the performance functions that can be <strong>de</strong>fined as:<br />
LSF = PFCR - PF (x) = 0 or LSF = PFCR /PF (x) = 1 . (1)<br />
The traditional FORM/SORM algorithms work into an equivalent standard<br />
normal U d space to estimate the safety in<strong>de</strong>x and the failure probability.<br />
The transformation of the basic random variables x = (x1, x2,…,xd) ∈R d into<br />
equivalent in<strong>de</strong>pen<strong>de</strong>nt and uncorrelated variates u = (u1, u2,…,ud) ∈ U d<br />
should be ma<strong>de</strong> using the Rackwitz-Fiessler or Rosenblatt-Nataf or other<br />
similar isoprobabilistic transformations [2]. Therefore the limit state function<br />
is also transformed into equivalent standard normal U d space by:<br />
LSF(u) = PFCR - PF(u) = 0 or LSF(u) = PFCR / PF(u) = 1 (2)<br />
⎧<br />
⎫<br />
F = ⎨u<br />
∈U<br />
d<br />
LSF ( u)<br />
≤ 0 or LSF ( u)<br />
≤ 1⎬<br />
(3)<br />
⎩<br />
⎭<br />
105
106<br />
CĂLIN IOAN ANGHEL, IOAN LAZĂR<br />
In practice the state of any system can be divi<strong>de</strong>d into two regions: (F)-the<br />
failure domain, a region where combinations of system parameters lead to<br />
an unacceptable or unsafe system response-<strong>de</strong>fined by the existence of a<br />
performance function whose non-positive values establish the non-reliability<br />
domain (eqn.3) and (S)-the safety domain, a region where system response is<br />
acceptable, <strong>de</strong>fined by the existence of a performance function whose positive<br />
values establish the safety domain:<br />
⎧<br />
⎫<br />
S = ⎨u<br />
∈ U<br />
d<br />
LSF(<br />
u)<br />
> 0 or LSF(<br />
u)<br />
> 1⎬<br />
. (4)<br />
⎩<br />
Basically LSF is a boundary between the safe and failure regions.<br />
Geometrically LSF represents a failure limit hyper surface. The safety in<strong>de</strong>x ββββ<br />
is reported to the point (often referred as the most probable point MPP) that<br />
lies closest to the origin of the system (u* = (u1*, u2*,…,ud*)) in transformed<br />
reduced space U d and belongs to the limit state surface. There is a direct<br />
relationship between the safety in<strong>de</strong>x and the probability of failure:<br />
⎧<br />
⎫<br />
P = Prob ∈<br />
d<br />
f ⎨u<br />
U LSF ( u)<br />
≤ 0 or LSF ( u)<br />
≤ 1⎬<br />
= Φ(<br />
−β<br />
) (5)<br />
⎩<br />
where Φ(…) is the one-dimensional standard Gaussian (normal) cumulative<br />
<strong>de</strong>nsity function. The eqn. (5) represents the first or<strong>de</strong>r approximation for<br />
the failure probability. Basically, this relationship is only approximate, but in<br />
the unique case of a linear limit state function of Gaussian distributed<br />
random variables the relationship is exact.<br />
To improve this drawback our procedure estimates the safety in<strong>de</strong>x<br />
based on artificial intelligence methods. The safety in<strong>de</strong>x will report to an<br />
equivalent hyper plane (equivalent linear form of the limit state function)<br />
into a binary minimax classification manner. The proposed procedure<br />
estimates the location of the most probable point (MPP) and calculates the<br />
safety in<strong>de</strong>x ββββ. Once the location of the MPP, in the reduced standard normal<br />
space has been found and safety in<strong>de</strong>x ββββ was calculated, the failure probability<br />
of the system may be achieved. Into a binary classification problem, a pattern<br />
may be given through the sets of labelled data-points in R n (or in other space)<br />
as: {x1;x2,…xN} and {y1,y2…yM}. Usually the label of a training pattern<br />
represents the category or the class to which the pattern belongs, in our<br />
case C1-safety domain and C2-failure domain. The <strong>de</strong>manding problem is<br />
to find a function f : R n → R which is positive on the first set and negative<br />
on the second, such as f(xi) > 0, i = 1,…N and f(yi) < 0, i = 1,…M. If the<br />
inequalities hold we say that “f” or its 0-level set {x | f(x) = 0}, separates or<br />
classifies the two sets of points. This function “f” sometimes viewed as a<br />
<strong>de</strong>cision function is often named as the classifier. The classifier is built in a<br />
random manner on a training (learning) set and is validated on a test set<br />
⎭<br />
⎭
CASE STUDY OF STRUCTURAL SAFETY BASED ON ARTIFICIAL INTELLIGENCE<br />
(testing). Because training data is labelled, the classifier transforms these<br />
labels to new data (test data) as long as the feature space sufficiently<br />
distinguished each label as well. A heuristic approach to approximate linear<br />
discrimination (when the two sets of points cannot be perfectly linearly<br />
separated) is based on support vector classifiers. In the light of SVM a<br />
simplified reformulation for separating the set of m training vectors belonging<br />
to two separate classes, with a hyper plane, w<br />
T<br />
⋅ z − b = 0 , is:<br />
r r { ( z , y ) z ∈ R<br />
n<br />
, y ∈{<br />
−1,<br />
+ 1}<br />
, i = 1,..,<br />
m}<br />
where yi ( y ≈ ( w<br />
T<br />
⋅ z − b)<br />
i<br />
i<br />
i<br />
i<br />
, (6)<br />
i<br />
sign<br />
i<br />
) is the associated “truth” given by a trusted<br />
source. The un<strong>de</strong>rlying problem of interest is to establish a <strong>de</strong>cision<br />
n<br />
function f : R → { ± 1}<br />
using input-output training labelled data from eqn.<br />
(6). In principle a <strong>de</strong>cision function is a function f(z) whose sign represents<br />
the class assigned to data points z. If the points are linearly separable, in a<br />
two-class classification, then there exists an n-vector w and a scalar b. To<br />
optimally separate the sets of vectors (eqn. 6) is equivalent to maximising<br />
the separation margin or distance between two parallel hyper planes<br />
w<br />
T<br />
⋅ z = b + 1 and w<br />
T<br />
⋅ z = b −1<br />
. Minimising the probabilities that data<br />
vectors fall on the wrong si<strong>de</strong> of the boundary we can establish the<br />
classifier <strong>de</strong>sign. A possible way is the attempt to control the<br />
misclassification probabilities in a worse case by setting as minimising the<br />
worst case-maximum probability of misclassification of future data points.<br />
This is the minimax approach [12,13]. Basically, as was stated in a minimax<br />
approach reported as a binary classification problem, z1 and z2 <strong>de</strong>note<br />
random vectors data from each of two classes as<br />
1<br />
Class C1 ∈ z and<br />
2<br />
Class C2 ∈ z . Thus to estimate the location of the most probable point a<br />
hyper plane that separates the two classes of points with maximal<br />
probability must be <strong>de</strong>termined (eqn. 7).<br />
{ z w<br />
T<br />
⋅ z = b}<br />
, where w ∈ R<br />
n<br />
\ { 0}<br />
and R<br />
H ( w, b)<br />
= offset b ∈ (7)<br />
To overcome intricate non-linear classification problems, the kernel trick [8-<br />
13] is used to map the input data points into a high-dimensional ‘d’ feature<br />
space R d , where a linear classifier corresponds to a non-linear hyper plane<br />
in the original space. In a minimax approach the classifier must minimise<br />
the misclassification probability by an optimal separating hyper plane that<br />
separates the two classes of points with maximal probability. In our safety<br />
in<strong>de</strong>x approach this optimal separating hyper plane is an equivalent failure<br />
107
108<br />
CĂLIN IOAN ANGHEL, IOAN LAZĂR<br />
limit hyper surface and represents a boundary between the safe and failure<br />
regions. Because w is the normal to the hyper plane and w is the<br />
Eucli<strong>de</strong>an norm of w, according to well-known statements [14], b w is<br />
the perpendicular distance from the optimal separating hyper plane to the<br />
origin and then it can be i<strong>de</strong>ntified as the reliability-safety in<strong>de</strong>x ββββ.<br />
β ≅ b w<br />
(8)<br />
For non-linear classification problems in terms of a kernel function satisfying<br />
the Mercer's condition, the <strong>de</strong>cision is transferred from the reduced original U d<br />
space into reduced high dimensional feature space. For the output, it is not w<br />
that is returned, but instead of it the weights of the <strong>de</strong>composition of w in the<br />
span of the data points are obtained [12,13]. The basis vectors can be<br />
interpreted as co-ordinate axes in the subspace and the “weights" of the basis<br />
vectors <strong>de</strong>termine the corresponding “co-ordinate values” of the point. In our<br />
procedure there are some favourable circumstances where the linear<br />
discrimination works properly in the safety in<strong>de</strong>x assessment: (1) all projections<br />
of a standard normal distribution are also normal and generally linear functions<br />
of normally distributed data result also in normal distributions; (2) because the<br />
variates u are a set of standard uncorrelated variates the axes of the subspace<br />
U d <strong>de</strong>fined by these variates are orthogonal. Because the elements of kernel<br />
matrix were reduced to linear inner products and the classifier is provi<strong>de</strong>d in a<br />
linear configuration into a feature space, according to previous mentioned<br />
circumstances the general prerequisites for an exact assessment of eqn. (5)<br />
are fulfilled. The simulations are performed cyclic by multiple random trials.<br />
The performance of the procedure was evaluated based on test set accuracy<br />
(percentage of well-classified test data) and lower bound on the probability of<br />
correct classification of future data. Long random trials do not get improved<br />
accuracy or more reliable predictions, thus we consi<strong>de</strong>red appropriate to obey<br />
recent statements [11] and to work with a reduced learning set and to limit the<br />
random cyclic trials to k = 50…100.<br />
RESULTS AND DISCUSSIONS<br />
Numerical application presents an example based on the already<br />
published paper [16]. The numerical analysis has been carried out for a thinwall<br />
pressure vessel working into a technological process of natrium salicilate.<br />
The risk of failure is based on traditional permissible stress methods and<br />
serviceability limit state. It is reported to the structural condition beyond which<br />
the service criteria specified for the component are no longer met [17,18]. The<br />
limit state function (LSF) was established based on the presumption of miss<br />
regulated of multi-fluid heating/cooling closed loop system. This situation can
CASE STUDY OF STRUCTURAL SAFETY BASED ON ARTIFICIAL INTELLIGENCE<br />
conduct to an uncontrolled value of pressure through the reactor jacket. Un<strong>de</strong>r<br />
these circumstances coupled with variations, uncertainties in service conditions,<br />
variability concerning the main variables and continuous chemical corrosion, it<br />
is possible that the pressure vessel cannot fulfil all the strength <strong>de</strong>mands.<br />
The main dimensional parameters of the pressure vessel, material<br />
characterization and operating technological conditions, are shown in Table1.<br />
Full statistic characterization of all the parameters on which the limit state<br />
function <strong>de</strong>pends is not available. These parameters were set according to<br />
values known in practice or to values reported in literature [15,16].<br />
Table 1. The main parameters and working conditions of the case study<br />
Variable/Parameter<br />
Symbol Nominal value Statistical<br />
distribution<br />
Design thickness [mm] So 6 LogNormal<br />
μ = 6; σ = 0.60<br />
Corrosion rate [mm/year] Vc 0.1 Normal<br />
μ = 6; σ = 0.60<br />
Young Modulus [MPa] E 2.12*10 5<br />
Normal<br />
μ = 6; σ = 0.60<br />
Yield technical limit [MPa] σ0.2 255 Normal<br />
μ = 6; σ = 0.60<br />
Admissible stress [MPa] σad 170 Nominal value<br />
Outer nominal diameter [mm] D 445 LogNormal<br />
μ = 6; σ = 0.60<br />
Equivalent length for outer operating L 250 LogNormal<br />
pressure [mm]<br />
μ = 6; σ = 0.60<br />
TU - service life [year] Tu 12 Normal<br />
μ = 6; σ = 0.60<br />
Operating pressure [MPa] Poe 1.2 Normal<br />
μ = 6; σ = 0.60<br />
Technological mixture -- NaOH and phenol;<br />
Steel K41.2b STAS 2883/2-80<br />
The state of stresses in various operating technological conditions<br />
obtained by simulations with the finite element method (FEM) using the<br />
professional package COSMOS/M Designer II is presented in Figure 1. The<br />
higher stresses were <strong>de</strong>termined in the area of wel<strong>de</strong>d reactor jacket. Because<br />
stresses don’t exceed permissible stress and stress concentrations are<br />
mo<strong>de</strong>rate, the structure is one that will not be expected to fail, thus a real<br />
structural safety may be suggested. Because uncertainties and variability<br />
concerning the main variables, in fact any structure has a risk, even though<br />
it can be extremely small. It follows that even though a structure is safe<br />
there is still the possibility of failure.<br />
By the proposed procedure we can express a global risk of failure for<br />
the mentioned pressure vessel. According with main dimensional parameters<br />
109
CĂLIN IOAN ANGHEL, IOAN LAZĂR<br />
of the pressure vessel, material characterization and technological conditions<br />
(Table 1) the LSF system vectors are obtained by simulations of <strong>de</strong>terministic<br />
relationships (Table 2). These simulations might substitute real data as inputs to<br />
consequence mo<strong>de</strong>ls and illustrate the variability and uncertainty of the process.<br />
b.<br />
Figure 1. Equivalent Von Misses stresses in the area of wel<strong>de</strong>d reactor jacket<br />
a. Von Misses stress at the beginning of the life cycle (So = 6 mm)<br />
b. Von Misses stress along the life cycle (So = 4.8 mm)<br />
110<br />
a.
CASE STUDY OF STRUCTURAL SAFETY BASED ON ARTIFICIAL INTELLIGENCE<br />
The experiments are performed cyclic „k” times by multiple random trials. In<br />
each experiment the data was randomly split into (50%…90%) training and<br />
(50%…10%) test set. A number of different training and test sets are randomly<br />
chosen at each cycle. In each cycle the safety in<strong>de</strong>x ββββ is evaluated and<br />
stored. The results of the proposed procedure are presented in Table 3. The<br />
performance of the procedure based on the test set accuracy (percentage<br />
of well-classified test data) and on the lower bound of correct classification<br />
of future data reveals a reasonable level. In every experiment the lower<br />
bound of correct classification of future data is smaller than the test set<br />
accuracy as was stated by [12,13]. Thus the lower bound is not violated<br />
and the linear approach is a robust one.<br />
Table 2. Deterministic-explicit relations<br />
Outer operating pressure in reactor jacket<br />
Ellipsoidal closure<br />
D 2 /H*s ≤ E/2*σ0.2 → 0.0269 < 0.25 – Plastic domain<br />
Outer critical operating pressure<br />
Pcr = 8*s*σa*H/(D+(2H/D)*s)*D<br />
Cylindrical shell<br />
1.5(2*s/D) 0.5 ≤ L/D ≤(D/2*s) 1/3 →<br />
0.2463 < 0.55955 < 6.089 - Short shell<br />
s/D > 1.1*10 -2 (L 2 *σ 2 0.2/10 -6 *D2*E 2 ) →<br />
1.3483*10 -2 >0.8524*10 -2<br />
Outer critical operating pressure<br />
Pcr = 2*E t *s/D*K1<br />
K1=(1.5*E t /σ0.2)+1.39*σ t 0.2*D*L 2 (Cs2-1)/ E t *s 3<br />
Cs2=1.5(1+0.93(Cs1-1.5)*(L*σ t 0.2/ E t *s) 2 *D/s)<br />
where Cs1 = 2.6<br />
Original explicit limit state functions LSF ⇒<br />
LSF = Pcr – Poe<br />
Original explicit kernel function<br />
Deterministic<br />
Numerical Values<br />
Tu=0 Tu=12<br />
[year] [years]<br />
4.54 MPa<br />
4.36MPa<br />
A polynomial kernel with a unit offset K( zi<br />
, z j ) = ( zi<br />
⋅ z j + 1)<br />
3.33 MPa<br />
3.067MPa<br />
Table 3. Results for safety in<strong>de</strong>x assessment based on averaged values<br />
Safety in<strong>de</strong>x ββββ Probability of failure LBCPFD TSA<br />
[%]<br />
[%]<br />
2.8131 0.00245<br />
k = 100 cycles<br />
0.896 0.990<br />
LBCPFD = lower bound on correct classification of future data<br />
TSA = test set accuracy (percentage of well-classified test data)<br />
111
112<br />
CĂLIN IOAN ANGHEL, IOAN LAZĂR<br />
The reported results are averaged over the entire random cyclic<br />
trials, as was stated [12,13]. Due to uncontrolled combinations of the variations<br />
in service loads, uncertainties and variability of any parameters, during service<br />
elapsed time, damage can occur. In fact, the mentioned pressure vessel has a<br />
risk, even though it is small. Extending Mc.Leods and Plewes’s conversion<br />
scale to structural safety, this probability of failure Pf = 0.00245 is placed on<br />
the scale of risk in the range between 10 -2 …10 -4 . This risk is characterized<br />
as a reduced one, when the failure is possible. It follows that the pressure<br />
vessel is still possibility of failure even though it is relative safe un<strong>de</strong>r a pure<br />
<strong>de</strong>terministic analysis.<br />
CONCLUSIONS<br />
The paper presents another insight into safety assessment and<br />
structural risk analysis using artificial intelligence methods. The proposed<br />
procedure offers a greater reliability in the safety prediction and reduction<br />
the risk of failure. High values for safety factor β lead to low values for the risk<br />
of failure. This approach improves some drawback of the traditional reliability<br />
methods, reduces the need for excessive safety margins in <strong>de</strong>sign or additional<br />
cumbersome experimental-analytical approaches. At the same time it<br />
focuses on uncontrolled combinations between the variations in service<br />
loads, uncertainties and variability of parameters, during service elapsed time.<br />
This is a key factor that could have a profound impact on the risk assessment.<br />
Based on numerical application we can highlight that using a corrosion<br />
<strong>de</strong>cay mo<strong>de</strong>l it is possible to establish a safer working life of the pressure<br />
vessel. These types of studies become recommen<strong>de</strong>d and necessary for<br />
engineers, especially for chemical engineers to work out optimal safety<br />
<strong>de</strong>cisions, inspection and maintenance schedules.<br />
REFERENCES<br />
1. D.G. Elms, Struct. Safety, 1999, 21, 311.<br />
2. R.E. Melchers, “Structural reliability analysis and prediction”, John Wiley &<br />
Sons, New York, 1999.<br />
3. O. Ditlevsen, O., H.O. Madsen, “Structural reliability”, John Wiley&Sons.<br />
New York, 1996.<br />
4. J.E. Hurtado, D.A. Alvarez, Journal of Structural Engineering, 2003, 129(8), 1141.<br />
5. J.E. Hurtado, Struct.Safety, 2004, 26(3), 271.<br />
6. C.I. Anghel, Al. Ozunu, Chem. Pap. 2005, 59(6b), 469.<br />
7. C.I. Anghel, Int Jnl of Pressure Vessels and Piping, 2009, (in press).<br />
8. V.N. Vapnik, “The nature of statistical learning theory”, 2nd edition, Springer,<br />
New York, 2000.
CASE STUDY OF STRUCTURAL SAFETY BASED ON ARTIFICIAL INTELLIGENCE<br />
9. B. Scholkopf, C. Burges, A. Smola, (Eds.), “Advances in Kernel Methods.<br />
Support Vector Machines”, MA MIT Press Cambridge, 1998.<br />
10. C.J.C. Burges, Data Min. Knowl. Disc, 1998, 2, 121.<br />
11. A. Bor<strong>de</strong>s, S. Ertekin, J. Weston, L. Bottou, Journal of Machine Learning<br />
Research, 2005, 6, 1579.<br />
12. G.R.G. Lanckriet, EL. Ghaoui, C. Bhattacharyya, M.I. Jordan, in: T.G.<br />
Dietterich, S. Becker, Z. Ghahramani (Eds.), Advances in Neural<br />
Information Processing Systems, MA. MIT Press Cambridge, 2002, 14,<br />
801 (http://robotics.eecs.berkeley.edu/~gert/)<br />
13. G.R.G. Lanckriet, EL. Ghaoui, C. Bhattacharyya, M.I. Jordan, Journal of<br />
Machine Learning Research, 2002, 3, 555.<br />
14. C. I. Anghel, I. Lazar, R.I. Iatan, “Proceedings – ConferinŃa Natională <strong>de</strong><br />
Echipamente, InstalaŃii <strong>şi</strong> <strong>Inginerie</strong> <strong>de</strong> Proces”, 2004, 253.<br />
15. Al. Pavel, D. Popescu, Rev. Chim., 1998, 49, 2, 128.<br />
16. *** ASME - Boiler And Pressure Vessel Co<strong>de</strong>, Section VIII, The American<br />
Society of Mechanical Engineers; New York, 1995.<br />
17. *** Euroco<strong>de</strong> pr.EN 13445-3, Unfired Pressure Vessels – Part 3: Design,<br />
1999.<br />
18. *** Euroco<strong>de</strong> pr.ENV 1991-1, Euroco<strong>de</strong> 1: Basis of <strong>de</strong>sign and actions on<br />
structures, Part 1 Basis of Design, 1994, (CEN/TC 250).<br />
113
STUDIA UNIVERSITATIS BABES-BOLYAI, CHEMIA, LIV, 1, 2009<br />
Dedicated to Professor Liviu Literat, at his 80 th anniversary<br />
SOIL AND SPRING WATER POLLUTION IN TWO<br />
PROTECTED NATURAL AREAS IN MARAMUREŞ DISTRICT<br />
LAURA ARDELEAN a , MARIA GOREA b , ELENA CICAL c ,<br />
ANGELA MICHNEA d<br />
ABSTRACT. This paper presents recent data on soil contamination with Pb,<br />
Cd, Cu and Zn at 5 and respectively 30 cm in <strong>de</strong>pth and the pollution of<br />
surface waters in two protected areas in Maramureş County. The measured<br />
values are presented in comparison with the limits <strong>de</strong>fined by the Romanian<br />
legislation. In the case of Creasta Cocoşului reservation, lead pollution reaches<br />
the intervention limit at 5 cm in <strong>de</strong>pth and it exceeds the alert threshold at 30 cm.<br />
Lead contamination in Chiuzbaia reservation is also high at the 30 cm in<br />
<strong>de</strong>pth, the Cd content exceeds the alert limit, while the values for Cu, Zn and<br />
Mn are over the normal admitted values. The high level of contamination with<br />
heavy metals of these areas is mainly related to local mining activities and<br />
non-ferrous metals concentrates processing.<br />
Keywords: soil pollution, heavy metals, natural protected areas<br />
INTRODUCTION<br />
Maramureş County has a surface of 6304 km 2 , including natural<br />
heritage areas of special value: 36 protected natural areas, of which one<br />
national park, Rodna Mountains Natural Park – Biosphere reservation, and<br />
one natural park, Maramureş Mountains Natural Park. These areas place<br />
Maramureş County on the 7 th place in Romania as far as the number of<br />
protected areas is concerned (Fig.1).<br />
The presence of several pollution sources in the area (former mining<br />
activity and metallurgic processing) involves a strict monitoring of the types<br />
a Garda NaŃională <strong>de</strong> Mediu – Comisariatul Ju<strong>de</strong>Ńului Maramureş, Str. G. Coşbuc, Nr. 52,<br />
RO-430222, Baia Mare, Romania, ar<strong>de</strong>laura@yahoo.com<br />
b Universitatea Babeş-Bolyai, <strong>Facultatea</strong> <strong>de</strong> <strong>Chimie</strong> <strong>şi</strong> <strong>Inginerie</strong> <strong>Chimică</strong>, St. Kogălniceanu,<br />
Nr. 1, RO-400084, Cluj-Napoca, Romania, mgorea@chem.ubbcluj.ro<br />
c SC Vital SA, Str. Ghe. Şincai, Nr. 19-21, RO-430311, Baia Mare, Romania<br />
d AgenŃia pentru ProtecŃia Mediului, Str. Iza, Nr. 1A, RO-430073, Baia Mare, Romania
116<br />
LAURA ARDELEAN, MARIA GOREA, ELENA CICAL, ANGELA MICHNEA<br />
of soils and the physical-chemical features (heavy metals content, pH,<br />
humus amount) in relationship with vegetation (types, ecological preferences)<br />
but also of the quality of spring waters, especially in the protected areas.<br />
The two reservations un<strong>de</strong>r study are presented on the map (Fig.<br />
1); they are located north-east from Baia Mare municipality, where nonferrous<br />
metal concentrates rich in Pb, Cd, Cu and Zn have been processed<br />
for the last fifty years in the local metallurgical plants. Some toxic gases<br />
and heavy metals pow<strong>de</strong>rs (particulate emissions) have been, but in small<br />
amounts still are released in the air, transported by air currents and finally<br />
settled on the surface of the soil in various areas.<br />
In spite of the fact that the activity of these plants have lately take<br />
place using more environmental-friendly technologies (according to<br />
European legislation) and less-polluting raw materials (including wastes) were<br />
used, soil and water pollution are still clearly visible, negatively affecting flora<br />
and fauna of the region and consequently, human health. By taking into<br />
account the long-term effects of pollution, but also by consi<strong>de</strong>ring the need for<br />
preservation of some areas of high touristic potential, continuous investigation<br />
and monitoring activities take place. The two metallurgic plants inclu<strong>de</strong><br />
installations for pollution prevention and integrated control, IPPC, of which<br />
one (related to secondary copper processing) already works in agreement<br />
with the UE regulations, while the second one (related to primary lead<br />
processing) is currently submitted to specific transformations in the frame of<br />
a <strong>de</strong>tailed programme to end in 2010, when the environmental requirements<br />
of the EU will have to be fulfilled.<br />
The territory of Maramureş County and especially the areas in the<br />
vicinity of Baia Mare represent “environmental hot spots” proper due to the<br />
long period of mining activity and non-ferrous metallurgy; for this reason,<br />
such areas have been intensely investigated especially concerning heavy<br />
metals pollution [1].<br />
The aim of the present work is the quantification of the pollution<br />
<strong>de</strong>gree, concerning heavy metals (Pb, Cd, Cu, Zn and Mn), of soil and spring<br />
waters in two geological reservations: Creasta Cocoşului and fossiliferous<br />
reservation Chiuzbaia. Samples were collected from 5 and respectively 30 cm<br />
in <strong>de</strong>pth and the measured and <strong>de</strong>termined values were compared with the<br />
limits allowed by the Romanian legislation. Samples collected in the first step<br />
of the study were used to evaluate the pollution <strong>de</strong>gree of the areas consi<strong>de</strong>red,<br />
as a preliminary stage of a more complex research concerning that region.<br />
The obtained data are necessary for soil type mapping and correlation<br />
of their physical-chemical features with type and abundance of flora and<br />
fauna in the protected areas of Maramureş County, for the evaluation of soil<br />
quality and interpretations concerning the influence of pollutants on both<br />
vegetation and tourists in these areas.
SOIL AND SPRING WATER POLLUTION IN TWO PROTECTED NATURAL …<br />
Figure 1. Schematic map of the protected areas in Maramureş County<br />
RESULTS AND DISCUSSIONS<br />
CREASTA COCOŞULUI protected area<br />
The protected natural area Creasta Cocoşului was created in or<strong>de</strong>r to<br />
protect and conserve some natural elements of special ecological, scientific and<br />
landscape value and significance. The most prominent feature within the area is<br />
the Creasta Cocoşului itself, a steep and wavy ridge, about 200 m in length,<br />
located at an average altitu<strong>de</strong> of 1200 m, with an almost vertical spatial display<br />
[2]. The results of the soil investigation in this area are presented in Table 1.<br />
The data on soil samples collected at 5 cm in <strong>de</strong>pth evi<strong>de</strong>nced a<br />
high content of lead, about three times more than the intervention threshold<br />
in the samples collected from the uppermost part of the Creasta Cocoşului<br />
ridge and near the alert threshold for those collected near the spring below the<br />
ridge. The lower content in the second group of samples may be correlated to<br />
the local pattern of the air currents leading to a better protection of the area.<br />
The lead pollution <strong>de</strong>gree is relatively higher (above the alert limit) also in the<br />
case of soil samples collected at 30 cm in <strong>de</strong>pth, pointing to a long term<br />
“pollution history” in the area.<br />
117
LAURA ARDELEAN, MARIA GOREA, ELENA CICAL, ANGELA MICHNEA<br />
The experimental data for copper, zinc and manganese fall within<br />
the normal limits for this type of soils, however towards the upper limit in<br />
the case of copper and zinc. It is worth to mention that cadmium is missing<br />
from the investigated soil samples.<br />
Concerning the organic matter content, the soil samples collected in<br />
the vicinity of the spring below the ridge are slightly polluted (organic C < 3<br />
%), those collected near the top of the ridge at both 5 and 30 cm <strong>de</strong>pth are<br />
medium polluted (< 4 % organic C) while those from the area near Masa<br />
Pintii are strongly polluted (> 4 % organic C).<br />
Table 1. Results obtained on soil samples collected from Creasta Cocoşului reserve<br />
Soil sample<br />
(Creasta<br />
Cocoşului reserve)<br />
pH<br />
Pb<br />
mg/kg<br />
Cd<br />
mg/kg<br />
Cu<br />
mg/kg<br />
Zn<br />
mg/kg<br />
Mn<br />
mg/kg<br />
Humus<br />
%<br />
Org. C<br />
%<br />
The top of the ridge<br />
(5 cm <strong>de</strong>pth) 4.1 311.65 0.0 21.40 90.06 323.18 6.63 3.84<br />
(30 cm <strong>de</strong>pth) 4.3 67.34 0.0 13.91 67.23 190.98 6.03 3.50<br />
Near the spring<br />
below the ridge<br />
(5 cm <strong>de</strong>pth)<br />
4.5 57.26 0.0 13.15 79.63 366.02 2.72 1.58<br />
Near “Masa Pintii”<br />
(5 cm <strong>de</strong>pth) 4.5 294.18 0.0 18.90 92.22 176.61 7.95 4.61<br />
Near Masa Pintii<br />
(30 cm <strong>de</strong>pth)<br />
4.4 86.026 0.0 15.463 103.99 205.15 7.21 4.18<br />
Normal values 1,2<br />
20 1 20 100 900<br />
Alert threshold 1,2<br />
50 3 100 300 1500<br />
Intervention<br />
1,2<br />
threshold<br />
100 5 200 600 2500<br />
1 in the case of soils for sensitive usage, in mg/kg; 2 according to OMAPM 756/1997<br />
approving Regulations on the evaluation of environmental pollution<br />
Soil acidity showed relatively high (pH about 4) but relatively constant<br />
values with <strong>de</strong>pth and horizontal distances in the sampled areas.<br />
CHIUZBAIA protected area<br />
The Chiuzbaia fossiliferous reservation is located at the base of<br />
Igniş Peak, between the Plopilor Valley and the “Biserica lui Spiridon” cliff; it<br />
is well-known and protected for its diatomite <strong>de</strong>posits interlayered with volcanic<br />
ash containing abundant rests of plant impressions. These geological <strong>de</strong>posits<br />
were formed in a lake surroun<strong>de</strong>d by a <strong>de</strong>nse forest. The leaf impressions<br />
point to the following plant species such as, oak (Quercus), al<strong>de</strong>r (Alnus),<br />
beech (Fagus), maple (Acer), chestnut (Castanea), besi<strong>de</strong>s which birch tree<br />
118
SOIL AND SPRING WATER POLLUTION IN TWO PROTECTED NATURAL …<br />
(Betula), hornbeam (Carpinus), Giyptostrobus, Lirio<strong>de</strong>ndron, Magnolia, Finus,<br />
elm etc, were present, pointing to a forest growing in a temperate, relatively<br />
warmer climate as compared to the present day one. The fossil flora from<br />
Chiuzbaia represents one of the richest and best preserved floras of Pliocene<br />
age from Romania: over 120 species of which 32 for the first time in Romania,<br />
6 for the first time worldwi<strong>de</strong>, and 3 new varieties have been i<strong>de</strong>ntified [3].<br />
Table 2. Results obtained on soil samples collected from the Chiuzbaia<br />
fossiliferous reserve<br />
Soil sample<br />
(Chiuzbaia<br />
reserve)<br />
pH<br />
Pb<br />
mg/kg<br />
Cd<br />
mg/kg<br />
Cu<br />
mg/kg<br />
Zn mg/kg<br />
Mn<br />
mg/kg<br />
Humus<br />
%<br />
Org. C<br />
%<br />
5 cm <strong>de</strong>pth 4.7 376.04 3.88 26.61 145.18 1217.17 5.95 3.45<br />
30 cm <strong>de</strong>pth 4.7 236.98 3.25 17.62 136.21 1298.12 4.64 2.69<br />
Normal values<br />
1, 2 20 1 20 100 900<br />
Alert<br />
1, 2<br />
threshold<br />
50 3 100 300 1500<br />
Intervention<br />
1,2<br />
threshold<br />
100 5 200 600 2500<br />
1 in the case of soils for sensitive usage, in mg/kg; 2 according to OMAPM 756/1997<br />
approving Regulations on the evaluation of environmental pollution<br />
The experimental data on the soil samples from Chiuzbaia<br />
fossiliferous reservation collected at 5 and respectively 30 cm in <strong>de</strong>pth are<br />
presented in Table 2.<br />
These data point to a relatively higher pollution <strong>de</strong>gree both at<br />
surface and in <strong>de</strong>pth by comparison to the first protected area un<strong>de</strong>r study,<br />
which can be due to the closer proximity from the polluting source, i.e. Baia<br />
Mare town. A high Pb content, exceeding the intervention limit both at the<br />
surface and at <strong>de</strong>pth can be mentioned; high amounts were registered also<br />
in the case of the other metals, Cu, Zn and Mn exceeding the normally<br />
admitted values. More than that, Cd – a very toxic metal, was also evi<strong>de</strong>nced,<br />
in concentrations exceeding even the alert threshold.<br />
Based on the carbon contents, the soils in this area may be classified<br />
as slightly (at 30 cm in <strong>de</strong>pth) and medium (at 5 cm in <strong>de</strong>pth) polluted with<br />
acidity values close to those recor<strong>de</strong>d in Creasta Cocoşului reserve.<br />
Spring waters<br />
The evaluation of the pollution <strong>de</strong>gree of spring waters in the monitored<br />
reserves was performed by investigating water samples from two springs<br />
along the tourist path starting from the Şuior mine perimeter, located in the<br />
119
120<br />
LAURA ARDELEAN, MARIA GOREA, ELENA CICAL, ANGELA MICHNEA<br />
upper part of the climb towards Creasta Cocoşului ridge, while for Chiuzbaia<br />
fossiliferous reserve the water sample was collected from the spring<br />
located close to the forest road that crosses the reserve.<br />
Table 3 presents the main physical-chemical characteristics of the<br />
tested water samples compared with reference values for surface and<br />
drinking waters.<br />
The values in Table 3 obtained for this study show that lead and<br />
cadmium exceed the admitted limits in the waters in the case of Chiuzbaia<br />
Valley and the spring from the base of the Creasta Cocoşului ridge, supporting<br />
the data obtained for the soil samples in the same areas.<br />
The acidity of these waters is higher than that of reference surface<br />
water and <strong>de</strong>creases from the top to the bottom of the ridge, probably as a<br />
consequence of the pH variation for the corresponding soils.<br />
By comparing the data from Tables 2 and 3, it can be noticed that<br />
lead concentrations in soil represent special issues, all the investigated<br />
samples showing values higher than the alert threshold or in some cases<br />
even values exceeding the intervention limit.<br />
CONCLUSIONS<br />
In the two investigated protected areas, the soil is contaminated with<br />
heavy metals (Pb, Cd, Cu, Zn and Mn) in variable amounts <strong>de</strong>pending on the<br />
location of the sampling site and <strong>de</strong>pth. High pollution with Pb exceeding the<br />
alert threshold was evi<strong>de</strong>nced in the top area of Creasta Cocoşului reserve<br />
and exceeding the intervention limit near the spring below the ridge at 5 and<br />
30 cm in <strong>de</strong>pth, as well as in all the investigated sites from Chiuzbaia reserve.<br />
The <strong>de</strong>gree of pollution with organic matter varies from slightly polluted soils<br />
(at the spring below the Creasta Cocoşului ridge) to strongly polluted soils in<br />
the Masa Pintii area from Creasta Cocoşului reserve.<br />
The allowable limits for heavy metals Pb and Cd are excee<strong>de</strong>d in<br />
the water samples collected from Chiuzbaia Valley and in the spring at the<br />
base of Creasta Cocoşului ridge as a result of soil pollution in these protected<br />
areas. The pH values for the spring waters are lower than those allowed for<br />
surface waters and they increase from the top to the base according to the<br />
variation of the pH values for the soils.<br />
The high Pb values in some soil samples both at the surface and<br />
<strong>de</strong>eper into the soil suggest the possible influence of the Pb-containing particulate<br />
emissions from the dispersion furnace of the company that processes Pb ores<br />
in Baia Mare, taking into account that the two reservations are located NE<br />
from the metallurgical plant at a distance of only 4.5 km (Chiuzbaia reserve)<br />
and respectively 17.5 km (Creasta Cocoşului reserve). The lead content is<br />
higher in the samples collected from Chiuzbaia reserve, located closer to<br />
the metallurgical plant as compared to Creasta Cocoşului reserve.
SOIL AND SPRING WATER POLLUTION IN TWO PROTECTED NATURAL …<br />
No. Feature<br />
Table 3. Physical-chemical features of spring waters<br />
Chiuzbaia<br />
Valley<br />
Creasta<br />
Cocoşului –<br />
spring at the<br />
base of the<br />
ridge<br />
Creasta<br />
Cocoşuluispring<br />
near the<br />
top of the ridge<br />
Reference<br />
value<br />
(surface<br />
waters) 3<br />
CMA value<br />
(drinking<br />
water) 4<br />
1 pH 6.196 5.483 4.967 6.5-8.5 6.5-9.5<br />
2 Conductivity, µS/cm 68.5 24.4 41.5 2500<br />
3 CCOMn, mgO2/l 1.84 2.4 2.72 5.0<br />
4 Chlori<strong>de</strong>s, mg/l 7.09 7.09 6.38 25 250<br />
5 Sulphates, mg/l 5.10 0.0 1.70 60 250<br />
6 Calcium, mg/l 8.55 3.89 5.44 50<br />
7 Magnesium, mg/l 3.26 0.47 0.93 12<br />
8 Total hardness,<br />
1.96 0.652 0.978 5<br />
Ge <strong>de</strong>grees<br />
9 Nitrites, mg/l 0.0 0.0 0.0 0.01 mgN/l 0.5<br />
10 Nitrates, mg/l 22.8 0.10 0.0 1.0 mgN/l 50<br />
11 Ammonium, mg/l 0.025 0.0 0.0 0.4 mgN/l 0.5<br />
12 Pb, mg/l 0.025 0.002 0.0 0.005 0.010<br />
13 Cd, mg/l 0.001 0.002 0.0 0.0005 0.005<br />
14 Cu, mg/l 0.0 0.0 0.0 0.02 0.1<br />
15 Zn, mg/l 0.021 0.018 0.012 0.1 5.0<br />
16 Fe, mg/l 0.087 0.023 0.045 0.3 0.2<br />
17 Mn, mg/l 0.004 0.003 0.006 0.05 0.05<br />
3 according to the MMGA Or<strong>de</strong>r 161/2006 approving the Classification Norms for<br />
surface waters quality in the view of establishing the ecological status of the water<br />
bodies; 4 according to Law 458/2002 on the quality of drinking water<br />
These preliminary data suggest that soil pollution has an anthropic<br />
source related to industrial air pollution by soil <strong>de</strong>position of particulate emissions<br />
containing heavy metals, especially Pb. If the natural substrate in the area of the<br />
reservation would have been rich in heavy metals, these cations should have<br />
been present in higher concentrations also in the investigated spring waters.<br />
EXPERIMENTAL SECTION<br />
Soil sampling<br />
Soil samples were collected according to the procedures <strong>de</strong>fined for<br />
environmental pollution evaluation and the Romanian standard on soil sampling<br />
for pedological and agrochemical studies [4, 5].<br />
Soil sampling at 5 cm in <strong>de</strong>pth is significant for the evaluation of the<br />
bioasimilation processes of heavy metals by plants in the upper part of the<br />
soil, and thus the potential risks on the trophic chain. Metal distribution<br />
121
122<br />
LAURA ARDELEAN, MARIA GOREA, ELENA CICAL, ANGELA MICHNEA<br />
patterns in <strong>de</strong>eper soil layers (30 cm in <strong>de</strong>pth) may evi<strong>de</strong>nce the history of<br />
pollution or acci<strong>de</strong>ntal infiltrations.<br />
In the case of Creasta Cocoşului reservation, samples of both soil<br />
and water were collected, due to the local morphological-structural complexity<br />
of the landscape and of the co-existence of various altitu<strong>de</strong>s.<br />
The tested soils were collected in the upper part of Creasta Cocoşului<br />
area at 5 and respectively 30 cm in <strong>de</strong>pth, from the vicinity of the spring at the<br />
bottom of the cliff at 5 cm in <strong>de</strong>pth, and from Masa Pintii area at 5, and<br />
respectively 30 cm in <strong>de</strong>pth. In the Chiuzbaia reservation, soil samples were<br />
collected at 5 cm and 30 cm in <strong>de</strong>pth from a single sampling point.<br />
Water sampling<br />
Water samples were collected and investigated in agreement with<br />
the procedures <strong>de</strong>fined by Romanian legislation (surface waters quality<br />
types and quality of drinking water, for spring waters) [6, 7].<br />
Water samples were collected from the existing springs in the two<br />
reservations. In the case of Creasta Cocoşului area the springs are more<br />
abundant, thus two of the springs within the reservation were sampled. In the<br />
case of the Chiuzbaia fossiliferous reservation a single spring was tested.<br />
Analytical procedures<br />
The soil samples collected from the pre-established locations were<br />
packed in plastic bags and transported to the laboratory. There they have<br />
been air dried at room temperatures, then pow<strong>de</strong>red and sieved on a 2 mm<br />
mesh. One gram from each dried soil sample was subsequently submitted<br />
to acid treatment for releasing the heavy metals into solution. After cooling,<br />
the solutions were filtered and diluted with bi-distilled water up to 25 ml<br />
volume. The heavy metal content (Pb, Cd, Cu and Zn) in these final solutiuons<br />
was <strong>de</strong>termined using atomic absorption spectrometry.<br />
The pH values and the humus content were measured in aqueous<br />
mixtures obtained from fresh samples (solid matter: liquid = 1:5), the latter<br />
by <strong>de</strong>termining the content of organic carbon (warm oxidation with K<br />
dichromate in the presence of sulphuric acid and titration of the excess<br />
dichromate with Mohr salt solution).<br />
The pollution <strong>de</strong>gree of the studied soil samples was estimated<br />
based on the scale proposed by Parrakova [8], according to the organic<br />
carbon content C, as follows:<br />
- unpolluted soil 0-1 %<br />
- slightly polluted soil 1-3 %<br />
- medium polluted soil 3-4 %<br />
- heavily polluted soil 4-6 %
SOIL AND SPRING WATER POLLUTION IN TWO PROTECTED NATURAL …<br />
The water samples were collected in 500 ml plastic bottles that were<br />
prior to this carefully rinsed and dried in the laboratory; the samples were<br />
investigated right after they were brought to the laboratory from the field.<br />
Conductivity and pH were measured by potentiometric methods<br />
using a laboratory conductometer and pH meter; the anions were <strong>de</strong>termined<br />
by UV-VIS molecular absorption spectrometry while the metallic cations by<br />
atomic absorption spectrometry.<br />
Equipment<br />
The investigations on the soil and water samples were performed at<br />
the Laboratory for physical-chemical testing of the Agency for Environmental<br />
Protection Maramureş, Baia Mare, Romania, using a Varian SpectrAA-250<br />
Plus atomic absorption spectrophotometer, an UV/VIS spectrophotometer<br />
with molecular absorption Cecil 8000 series, a WTW InoLab Level2<br />
conductometer, and a WTW InoLab Level2 pH meter.<br />
REFERENCES<br />
1. E. Cordoş, C. Roman, M. Ponta, T. FrenŃiu, R. RăuŃiu, Revista <strong>de</strong> <strong>Chimie</strong>,<br />
2007, 58, 470.<br />
2. L. Ar<strong>de</strong>lean, „Ecoterra”, Ed. Fac. <strong>de</strong> ŞtiinŃa Mediului Cluj Napoca <strong>şi</strong> I.C.P.E.<br />
BistriŃa SA, 2006, chapter 11.<br />
3. R. Givulescu, “Flora fosilă a Miocenului superior <strong>de</strong> la Chiuzbaia (ju<strong>de</strong>Ńul<br />
Maramureş)”, Editura Aca<strong>de</strong>miei Române, Bucureşti, 1990, chapter 3.<br />
4. Ordinul 756/1997 – pentru aprobarea Reglementării privind evaluarea<br />
poluării mediului, Monitorul Oficial, Partea I, nr.303bis/06.11.1997.<br />
5. STAS nr. 7184/1-84, Soluri. Recoltarea probelor pentru studii pedologice <strong>şi</strong><br />
agrochimice, 1984.<br />
6. Ordinul 161/2006 – pentru aprobarea Normativului privind clasificarea<br />
calităŃii apelor <strong>de</strong> suprafaŃă în ve<strong>de</strong>rea stabilirii stării ecologice a corpurilor<br />
<strong>de</strong> apă, Monitorul Oficial, Partea I, nr.511/13.06.2006.<br />
7. Legea 458/2002 – privind calitatea apei potabile, Monitorul Oficial, Partea I,<br />
nr.552/29.07.2002.<br />
8. S. Mănescu, M. Cucu, M. Diaconescu, “Chimia sanitară a mediului”, Editura<br />
medicală, Bucuresti, 1994, chapter 4.<br />
123
STUDIA UNIVERSITATIS BABES-BOLYAI, CHEMIA, LIV, 1, 2009<br />
Dedicated to Professor Liviu Literat, at his 80 th anniversary<br />
SIMULATION OF THE REACTOR-REGENERATOR-MAIN<br />
FRACTIONATOR FLUID CATALYTIC CRACKING UNIT<br />
USING ARTIFICIAL NEURAL NETWORKS<br />
VASILE MIRCEA CRISTEA a , RALUCA ROMAN a ,<br />
PAUL ŞERBAN AGACHI a<br />
ABSTRACT. The present work it is a successful approach for mo<strong>de</strong>lling the<br />
dynamic behaviour of the FCC unit, using Artificial Neural Networks (ANN). An<br />
analytical mo<strong>de</strong>l, validated with construction and operation data, has been used<br />
to produce a comprehensive input-target set of training data. The novelty of the<br />
mo<strong>de</strong>l consists in that besi<strong>de</strong>s the complex dynamics of the reactor-regenerator<br />
system, it also inclu<strong>de</strong>s the dynamic mo<strong>de</strong>l of the main fractionator. A new fivelump<br />
kinetic mo<strong>de</strong>l for the riser is also inclu<strong>de</strong>d. Consequently, it is able to<br />
predict the final production rate of the main products, gasoline and diesel. The<br />
architecture and training algorithm used by the ANN are efficient and this is<br />
proved by the results obtained both on training set and set of input-target data<br />
not met during the training procedure. The same good ANN performance has<br />
been obtained by the comparison between dynamic simulations results emerged<br />
from the ANN mo<strong>de</strong>l versus first principle mo<strong>de</strong>lling, both using the same<br />
randomly varying inputs. The computation time is consi<strong>de</strong>rably reduced when<br />
using the ANN mo<strong>de</strong>l, compared to the use of the analytical mo<strong>de</strong>l. The<br />
presented results show the incentives and benefits for further exploiting the ANN<br />
mo<strong>de</strong>l as internal mo<strong>de</strong>l for Mo<strong>de</strong>l Predictive Control industrial implementation.<br />
Keywords: Fluid Catalytic Cracking Unit, Artificial Neural Networks, dynamic<br />
mo<strong>de</strong>lling<br />
INTRODUCTION<br />
A mo<strong>de</strong>rn petroleum refinery is composed of processing units that<br />
convert cru<strong>de</strong> oil into valuable products such as gasoline, diesel, jet fuel,<br />
heating oil, fuel oil, propane, butane, and several secondary chemical feed<br />
stocks. Fluid Catalytic Cracking (FCC) is one of the most important conversion<br />
processes in a petroleum refinery, Figure 1. The main goal of this unit is to<br />
a Universitatea Babeş-Bolyai, <strong>Facultatea</strong> <strong>de</strong> <strong>Chimie</strong> <strong>şi</strong> <strong>Inginerie</strong> <strong>Chimică</strong>, Str. Kogălniceanu, Nr. 1,<br />
RO-400084 Cluj-Napoca,Romania, mcristea@chem.ubbcluj.ro
126<br />
VASILE MIRCEA CRISTEA, RALUCA ROMAN, PAUL ŞERBAN AGACHI<br />
convert high-boiling petroleum fractions called gasoil into high octane gasoline,<br />
high cetane diesel and heating oil. The process is complex, incorporating<br />
most processes of chemical engineering fundamentals, such as fluidization,<br />
heat/mass/momentum transfer and separation by distillation.<br />
As presented in the schematic representation of FCCU, raw material is<br />
mixed with the regenerated catalyst in the reactor-riser. The cracking reactions<br />
and coke formation occur in the riser and the important products are then<br />
separated in the main fractionator. Due to coke <strong>de</strong>position the <strong>de</strong>activated<br />
catalyst needs to be regenerated in the regenerator [1].<br />
Regenerator<br />
Steam<br />
svrgc<br />
Combustion Air<br />
Blower<br />
Reactor<br />
Steam<br />
svsc<br />
Furnace<br />
Fractionator<br />
Wet gas compressor<br />
Slurry Fuel Diesel<br />
gas<br />
Figure 1. Schematic view of the FCCU plant.<br />
Fresh feed<br />
Wash oil<br />
Mathematical mo<strong>de</strong>lling in the chemical engineering field has a<br />
multidisciplinary character, <strong>de</strong>aling with different processes that have to be<br />
<strong>de</strong>scribed. The mathematical mo<strong>de</strong>ls can be used in the system <strong>de</strong>sign, process<br />
control, i<strong>de</strong>ntification of possible failures, training the operating personnel but<br />
also for the safety operation and assessment of environmental impact of the<br />
process.
SIMULATION OF THE REACTOR-REGENERATOR-MAIN…<br />
From the point of view of the relationship between variables of a<br />
system, the mo<strong>de</strong>ls may be either analytical or statistical. Statistical mathematical<br />
mo<strong>de</strong>ls are based on observation data and measurements originating from the<br />
process (such as the Artificial Neural Networks mo<strong>de</strong>ls). Development of the<br />
analytical mo<strong>de</strong>ls is complex and time consuming as they imply a good<br />
knowledge of the phenomena and processes taking place insi<strong>de</strong> the mo<strong>de</strong>lled<br />
system. They imply special instruction of a specialist in or<strong>de</strong>r to <strong>de</strong>velop the<br />
specific equations. Statistical mathematical mo<strong>de</strong>ls are useful because they<br />
are simple from mathematical point of view and they do not need exten<strong>de</strong>d<br />
knowledge about the system, phenomena and processes un<strong>de</strong>rlying the system.<br />
ANN mo<strong>de</strong>ls are able to capture the complexity of the intrinsic processes<br />
featuring the global process behaviour. Artificial Neural Networks are composed<br />
of simple elements, neurons, operating in parallel. The network function is<br />
<strong>de</strong>termined by the connections between its neurons. The weighted connection<br />
paths link every two neurons to each other, the weighting structure providing<br />
the total network performance. Statistical mo<strong>de</strong>ls <strong>de</strong>veloped by means of<br />
ANNs and using process data are efficient alternatives to the traditional<br />
analytical mo<strong>de</strong>ls [2-4].<br />
RESULTS AND DISCUSSION<br />
The performance of a trained network can be measured by the errors<br />
on the training, validation and test sets, but it is often useful to investigate the<br />
network response in more <strong>de</strong>tail. A regression analysis between the network<br />
response and the corresponding targets was first performed. The correlation<br />
coefficient (R-value) between the outputs and targets it is an efficient<br />
measure of how well the variation in the output is explained by the targets.<br />
For the training test the correlation coefficient, R-value, showed high values<br />
revealing a good correlation between targets and outputs.<br />
The ANN was first <strong>de</strong>signed and subsequently the quasi-Newton<br />
Levenberg-Marquardt algorithm was used to train the network. The 23<br />
ANN-inputs are: spent and regenerated catalyst valve position; gasoline<br />
and diesel composition at the bottom and top of the main fractionator,<br />
gasoline and diesel composition on the 36 th and the 37 th stage of the main<br />
fractionator, reactor and regenerator temperature, main fractionator pressure,<br />
regenerator pressure, reactor and regenerator catalyst inventory; coke amount<br />
on the regenerated and spent catalyst; combustion air blower and wet gas<br />
compressor pressure; velocity of spent and regenerated catalyst, inventory<br />
of gas. All inputs are consi<strong>de</strong>red at the t sampling time. The last 21 variables<br />
are the process state variables and also represent the ANN outputs, but<br />
they are consi<strong>de</strong>red at the next sampling time, t+ Δ t.<br />
A set of 201 input and output data (input/target pairs), provi<strong>de</strong>d by<br />
the FCCU analytical mo<strong>de</strong>l, has been used for the ANN mo<strong>de</strong>l <strong>de</strong>velopment.<br />
The entire set has been divi<strong>de</strong>d into a set of data used for training the ANN<br />
and the rest for testing the quality of the training process.<br />
127
VASILE MIRCEA CRISTEA, RALUCA ROMAN, PAUL ŞERBAN AGACHI<br />
Both for the training and testing sets of data, the R-correlation<br />
coefficient is very close to unity, indicating a very good fit between targets<br />
and the ANN mo<strong>de</strong>l response and <strong>de</strong>monstrating a very good generalization<br />
property of the <strong>de</strong>signed and trained ANN, Figure 2.<br />
A<br />
A<br />
A<br />
x 10-3 Best Linear Fit: A = (1.01) T + (3.83e-006)<br />
4<br />
3<br />
2<br />
1<br />
0<br />
-1<br />
-2<br />
-3<br />
R = 1<br />
-4 -2 0 2 4<br />
x 10 -3<br />
-4<br />
T<br />
x 10-3Best<br />
Linear Fit: A = (1) T + (-8.57e-007)<br />
8<br />
6<br />
4<br />
2<br />
0<br />
-2<br />
-4<br />
R = 1<br />
Data Points<br />
Best Linear Fit<br />
A = T<br />
A<br />
x 10-3 Best Linear Fit: A = (1.01) T + (3.42e-006)<br />
4<br />
3<br />
2<br />
1<br />
0<br />
-1<br />
-2<br />
-3<br />
R = 1<br />
-4 -2 0 2 4<br />
x 10 -3<br />
-4<br />
T<br />
(a) (b)<br />
-6<br />
-0.01 -0.005 0<br />
T<br />
0.005 0.01<br />
0.15<br />
0.1<br />
0.05<br />
0<br />
-0.05<br />
-0.1<br />
-0.15<br />
R = 1<br />
Data Points<br />
Best Linear Fit<br />
A = T<br />
A<br />
1500<br />
1000<br />
500<br />
0<br />
-500<br />
-1000<br />
R = 1<br />
Best Linear Fit: A = (1) T + (0.113)<br />
-1500<br />
-1500 -1000 -500 0<br />
T<br />
500 1000 1500<br />
(c) (d)<br />
Best Linear Fit: A = (1) T + (5.6e-005)<br />
-0.2<br />
-0.2 -0.1 0<br />
T<br />
0.1 0.2<br />
Data Points<br />
Best Linear Fit<br />
A = T<br />
A<br />
500<br />
400<br />
300<br />
200<br />
100<br />
0<br />
-100<br />
-200<br />
-300<br />
-400<br />
R = 1<br />
Best Linear Fit: A = (1) T + (-0.0269)<br />
-500<br />
-500 0 500<br />
T<br />
Data Points<br />
Best Linear Fit<br />
A = T<br />
Data Points<br />
Best Linear Fit<br />
A = T<br />
Data Points<br />
Best Linear Fit<br />
A = T<br />
(e) (f)<br />
Figure 2. Results of the regression analysis between the ANN mo<strong>de</strong>l response and<br />
the corresponding targets (testing set of data): (a)- gasoline composition on top of<br />
main fractionator, (b)- diesel composition on bottom of main fractionator, (c)- reactor<br />
temperature, (d)- column pressure, (e)-regenerator temperature,<br />
(f)- regenerator pressure.<br />
128
SIMULATION OF THE REACTOR-REGENERATOR-MAIN…<br />
The network outputs are plotted versus the targets as open circles.<br />
The best linear fit is indicated by a dashed line. The perfect fit line (output<br />
equal to targets) is indicated by the solid line. Figure 2 also shows that it is<br />
difficult to distinguish the best linear fit line from the perfect fit line, as they<br />
actually merge. The data set used for training has been chosen in correlation<br />
to the number of neurons in the hid<strong>de</strong>n layer and covering the operating range<br />
of change of the input and output variables.<br />
As a second, more comprehensive test, a random amplitu<strong>de</strong> sequence<br />
has been generated for the input (manipulated) variables of the FCCU process:<br />
spent and regenerated catalyst sli<strong>de</strong> valve opening position. They having random<br />
changes equally distributed in time. Within this final and complex test have<br />
been compared the induced evolutions of the process variables <strong>de</strong>scribed by<br />
the ANN and the analytical mo<strong>de</strong>ls. The random amplitu<strong>de</strong> sequence has been<br />
generated for both consi<strong>de</strong>red input (manipulated) variables with random<br />
changes equally distributed in time at multiples of 3000 seconds, as presented<br />
in Figure 3. The simulation has been performed for 15000 seconds and the<br />
evolution of the most important FCCU output variables was investigated<br />
and presented in Figure 4.<br />
svrgc<br />
0.66<br />
0.655<br />
0.65<br />
0.645<br />
0.64<br />
0 5000 10000 15000<br />
time(s)<br />
svsc<br />
0.56<br />
0.558<br />
0.556<br />
0.554<br />
0.552<br />
0.55<br />
0.548<br />
0.546<br />
0.544<br />
0 5000 10000 15000<br />
time(s)<br />
Figure 3. Amplitu<strong>de</strong> sequence of the spent (svsc) and regenerated (svrgc) catalyst<br />
sli<strong>de</strong> valve opening position.<br />
The trained ANN is <strong>de</strong>signed to predict one step ahead into the<br />
future the behaviour of the process variables. Applied repeatedly, the dynamic<br />
ANN predicts the time evolution of the state variables over a <strong>de</strong>sired future<br />
time horizon. Again, this randomly generate testing set of data is completely<br />
different of the training one and not yet seen by the ANN.<br />
The dynamic simulation results of the trained ANN mo<strong>de</strong>l for the FCCU,<br />
compared to the analytical mo<strong>de</strong>l, are shown in the Figure 4. As it may be<br />
noticed from these results, the <strong>de</strong>veloped ANN mo<strong>de</strong>l has good dynamic<br />
performance. Results show the capability of the ANN mo<strong>de</strong>l to capture the<br />
time evolution of the most important FCCU output variables.<br />
129
gasoline top (kg/kg)<br />
Temperature reactor (°C)<br />
Temperature regenerator (°C)<br />
130<br />
0.9305<br />
0.93<br />
0.9295<br />
0.929<br />
0.9285<br />
525.2<br />
525<br />
524.8<br />
524.6<br />
524.4<br />
524.2<br />
VASILE MIRCEA CRISTEA, RALUCA ROMAN, PAUL ŞERBAN AGACHI<br />
Mo<strong>de</strong>l<br />
RNA<br />
0 5000 10000 15000<br />
time(s)<br />
524<br />
0 5000 10000 15000<br />
time(s)<br />
709.95<br />
709.9<br />
709.85<br />
709.8<br />
709.75<br />
709.7<br />
709.65<br />
709.6<br />
709.55<br />
709.5<br />
Mo<strong>de</strong>l<br />
RNA<br />
Mo<strong>de</strong>l<br />
RNA<br />
709.45<br />
0 5000 10000 15000<br />
time(s)<br />
diesel bottom (kg/kg)<br />
Pressure fractionator (bar)<br />
Pressure regenerator (bar)<br />
0.212<br />
0.211<br />
0.21<br />
0.209<br />
0.208<br />
0.207<br />
0.206<br />
0.205<br />
0.204<br />
0.203<br />
0.202<br />
1.314<br />
1.313<br />
1.312<br />
1.311<br />
1.31<br />
1.309<br />
1.308<br />
1.307<br />
1.306<br />
Mo<strong>de</strong>l<br />
RNA<br />
0 5000 10000 15000<br />
time(s)<br />
Mo<strong>de</strong>l<br />
RNA<br />
1.305<br />
0 5000 10000 15000<br />
time(s)<br />
1.7085<br />
1.7085<br />
1.7085<br />
1.7085<br />
1.7085<br />
1.7084<br />
1.7084<br />
1.7084<br />
1.7084<br />
1.7084<br />
Mo<strong>de</strong>l<br />
RNA<br />
1.7083<br />
0 5000 10000 15000<br />
time(s)<br />
Figure 4. Comparative simulation results of the ANN and analytical mo<strong>de</strong>l for the<br />
set of the most important FCCU variables.<br />
It has been measured and compared the computation time nee<strong>de</strong>d<br />
for the dynamic simulation, using both the FCCU analytical and ANN based<br />
mo<strong>de</strong>l. It was observed a substantial computation time saving in the case of<br />
the ANN. Using the ANN mo<strong>de</strong>l the computational time is about 10 times
SIMULATION OF THE REACTOR-REGENERATOR-MAIN…<br />
shorter compared to the first principle mo<strong>de</strong>l requirement. This computation<br />
time reduction may have an important benefit on the real time implementation<br />
of the mo<strong>de</strong>l based control algorithms.<br />
CONCLUSIONS<br />
The paper presents the simulation results of successfully using Artificial<br />
Neural Networks for mo<strong>de</strong>lling the dynamic behaviour of the complex FCC unit.<br />
First, a comprehensive input-target set of training data were produced using<br />
the FCCU analytical mo<strong>de</strong>l. The first principle mo<strong>de</strong>l was previously validated<br />
with experimental data taken from a real industrial FCC unit, Rompetrol<br />
Refinery, Romania. Correlation coefficients close to unity are shown on both<br />
training and testing steps, the last one being performed on sets of inputtarget<br />
data not met during the training procedure. The favourable fit between<br />
results emerged from the ANN versus analytical mo<strong>de</strong>lling, using randomly<br />
varying inputs, showed again that the ANN architecture and training algorithm<br />
are very efficient. They <strong>de</strong>monstrate a good generalization property of the ANN.<br />
The ANN <strong>de</strong>veloped mo<strong>de</strong>l substantially reduces the computation effort and<br />
supplies the potential control algorithm with speed necessary for real time<br />
implementation. Due this favourable feature, the trained ANN mo<strong>de</strong>l for the<br />
complex FCCU can be successfully used, as inherent mo<strong>de</strong>l, for FCCU<br />
Nonlinear Mo<strong>de</strong>l Predictive Control. This popular advanced control strategy<br />
may be efficiently used for improving the quality and the productivity of the<br />
gasoline and diesel products.<br />
EXPERIMENTAL SECTION<br />
An FCCU analytical mo<strong>de</strong>l was available and it served as a rich<br />
database nee<strong>de</strong>d for the ANN training and testing procedure. The FCCU mo<strong>de</strong>l<br />
has been <strong>de</strong>veloped based on reference construction and operation data taken<br />
from an industrial unit: Rompetrol Refinery, Romania. The new <strong>de</strong>veloped<br />
complex mo<strong>de</strong>l of the FCCU reactor-regenerator-main fractionator and auxiliary<br />
systems (wet gas compressor, air blower, feed and preheat system, catalyst<br />
circulation lines) is a high or<strong>de</strong>r differential-algebraic equations system, consisting<br />
in 933 differential equations and more than 100 algebraic equations. The<br />
analytical mo<strong>de</strong>l parameters have been validated with construction and<br />
operation data from the industrial unit. The <strong>de</strong>veloped analytical mo<strong>de</strong>l is able<br />
to capture the major dynamic effects that may occur in the industrial FCCU<br />
system.<br />
The ANN architecture for the FCCU statistical mo<strong>de</strong>l is a doublelayer<br />
feed-forward one with the backpropagation training algorithm used for<br />
computing the network biases and weights [5, 6]. In the ANN architecture<br />
two layers of neurons have been consi<strong>de</strong>red. The input layer has 23 neurons,<br />
131
132<br />
VASILE MIRCEA CRISTEA, RALUCA ROMAN, PAUL ŞERBAN AGACHI<br />
in the hid<strong>de</strong>n layer 26 neurons have been used and the output layer consists in<br />
21 neurons. The number of no<strong>de</strong>s in the hid<strong>de</strong>n layer has been set on the basis<br />
of a trial and error process. Two ANN activation functions have been utilized:<br />
the tansing sigmoid transfer function for the hid<strong>de</strong>n layer and the purelin<br />
linear transfer function for the output layer. The quasi-Newton Levenberg-<br />
Marquardt algorithm was employed for training the ANN. Overfitting has<br />
been avoi<strong>de</strong>d by the early stopping method which improved generalization.<br />
Random initial conditions have been used for the weights and biases, during<br />
the set of repeated sequence of training steps, in or<strong>de</strong>r to prevent convergence<br />
to un<strong>de</strong>sired local minima. For improving the training procedure all inputoutput<br />
training data have been normalized using the maximum and minimum<br />
values of the input and output sets of data.<br />
ACKNOWLEDGMENTS<br />
Funding from grant PN 71-006 is gratefully acknowledged by the authors.<br />
REFERENCES<br />
1. R. C. McFarlane, R. C. Reineman, Computers and Chemical Engineering,<br />
1993, 17, (3), 275.<br />
2. C. Jia, S. Rohani , A. Jutan, Chemical Engineering and Processing, 2003, 42, 311.<br />
3. W.G. Vieira, V.M.L. Santos, F.R. Carvalho, J.A.F.R. Pereira, A.M.F. Fileti,<br />
Chemical Engineering and Processing, 2005, 44, 855.<br />
4. M.V. Cristea, S. P. Agachi, M.V. Marinoiu, Chemical Engineering and<br />
Processing, 2003, 42, 67.<br />
5. V. M. Cristea, P.S. Agachi, Revista <strong>de</strong> <strong>Chimie</strong>, 2007, 58 (4), 406.<br />
6. M.T Hagan, M.H. Menhaj, T, IEEE Transaction on Neural Networks, 1994,<br />
5, 989.
STUDIA UNIVERSITATIS BABES-BOLYAI, CHEMIA, LIV, 1, 2009<br />
Dedicated to Professor Liviu Literat, at his 80 th anniversary<br />
SOFTWARE APPLICATION FOR OBTAINING CERAMIC<br />
GLAZES WITH PRE-DEFINITE COMPOSITION AND<br />
PROPERTIES<br />
ANA-MARIA CORMOŞ a , FIRUłA GOGA a , JOSEPH GASPAR a ,<br />
DAN IRIDON a<br />
ABSTRACT. The paper presents a software application <strong>de</strong>veloped for fast<br />
<strong>de</strong>termination of glaze or glass properties with a known composition, optimization<br />
of glaze composition using the pre-<strong>de</strong>finite properties and calculation of necessary<br />
of raw materials using the composition of glaze and available raw materials. The<br />
software application was <strong>de</strong>veloped using Matlab software package. A friendly<br />
and easy to use interface of the software application was built using GUIDE<br />
(Graphical User Interface Development Environment) components of Matlab.<br />
Keywords: ceramic glazes, glaze properties, optimization of glaze composition<br />
INTRODUCTION<br />
The ceramic glazes are glass thin films that cover the ceramic products<br />
in or<strong>de</strong>r to improve some properties. The properties of ceramic glazes have<br />
to be in a concordance with the ceramic support. The oxi<strong>de</strong> composition of<br />
glaze gives the properties of glaze.<br />
A number of characteristics of glaze are important for the calculation<br />
of composition of mixture of raw materials, such as:<br />
- complexity of composition (the large number of oxi<strong>de</strong>s);<br />
- glaze properties are correlated with properties and composition<br />
of the ceramic body;<br />
- raw materials available.<br />
This work presents a fast method for calculation of raw material mixture<br />
composition for glaze production using pre-<strong>de</strong>finite properties, and oxi<strong>de</strong>s<br />
composition of raw materials. Using the <strong>de</strong>veloped software application, the user<br />
could choose the most suitable raw materials, in or<strong>de</strong>r to reproduce accurate the<br />
chemical composition of glaze and subsequently the product properties.<br />
a Universitatea Babeş-Bolyai, <strong>Facultatea</strong> <strong>de</strong> <strong>Chimie</strong> <strong>şi</strong> <strong>Inginerie</strong> <strong>Chimică</strong>, Str. Kogălniceanu,<br />
Nr. 1, RO-400084 Cluj-Napoca, Romania, cani@chem.ubbcluj.ro
134<br />
ANA-MARIA CORMOŞ, FIRUłA GOGA, JOSEPH GASPAR, DAN IRIDON<br />
The calculation steps are followed:<br />
- <strong>de</strong>termination of glaze oxi<strong>de</strong>s composition, using the firing<br />
temperature of ceramic product (by reading the Norton diagram);<br />
- calculation of glaze properties using a pre-<strong>de</strong>finite composition;<br />
- calculation of composition of mixture of raw materials;<br />
- optimization of the composition of glaze in function of the thermal<br />
expansion coefficient.<br />
The main importance of this software application is to <strong>de</strong>crease the<br />
calculation time and the number of practical experiments which must be<br />
done for obtaining an optimal composition glaze.<br />
RESULTS AND DISCUSSION<br />
Determination of ceramic glaze composition<br />
The chemical composition of glazes is complex and it corresponds<br />
to an alkali-silico-aluminate glass. The composition is adapted to the support<br />
product and is correlated with the product final usage.<br />
The ceramic support implies on pre-<strong>de</strong>finite properties for the optimal<br />
of glaze composition. Ceramist researchers [1] tried to correlate the glazes<br />
composition with its fusibility and built a two part diagram (Norton). That<br />
diagram allows pursuing the variation of molar composition for glaze vs.<br />
firing temperature (Figure1).<br />
Figure 1. Norton Diagram.
SOFTWARE APPLICATION FOR OBTAINING CERAMIC GLAZES …<br />
Also, the glazes composition is characterized by certain in<strong>de</strong>xes as<br />
follow:<br />
- silica module - SiO2/Al2O3 with value 4.2-6.2;<br />
- acali module - Na2O/K2O with value 0.8 - 1.4;<br />
- CaO/MgO with value with value 0.3 - 1.5;<br />
- Acidity coefficient (acidity coefficient shows the activity of glaze vs.<br />
support product and allows estimation of stability of glaze in firing<br />
process).<br />
The acidity coefficient <strong>de</strong>pends of molar fraction of oxi<strong>de</strong>s from glaze:<br />
y + 3⋅<br />
z<br />
A =<br />
1+<br />
3⋅<br />
x<br />
where:<br />
y - molar concentration of SiO2;<br />
z - molar concentration of B2O3;<br />
x - sum of molar concentration of oxi<strong>de</strong>s: Al2O3 and Fe2O3.<br />
The variation of glaze characteristics vs. acidity coefficient is presented<br />
in Table 1 [2, 3].<br />
Table 1. Variation of glazes characteristics vs. acidity coefficient<br />
Acidity coefficient (A) Glazes characterizations<br />
0.7 - 1.25 Useable mat glazes if are rich in PbO<br />
1.45 Mat glazes<br />
1.90 – 2.0 Possible glazes<br />
2.60 Normal glazes<br />
2.90 Possible glazes<br />
2.90 De-vitrification is produced<br />
The <strong>de</strong>veloped software application allows <strong>de</strong>termination of the<br />
oxi<strong>de</strong> composition of glaze for a known temperature, using Norton diagram.<br />
Molar formula read from Norton diagram is converted in mass or molar<br />
percentage. Using the percentage composition of oxi<strong>de</strong>s, the <strong>de</strong>sirable glaze<br />
properties are calculated: thermal expansion coefficient, <strong>de</strong>nsity, and the<br />
refractive in<strong>de</strong>x and dispersion in<strong>de</strong>x. In or<strong>de</strong>r to validate the glaze composition,<br />
the <strong>de</strong>veloped software application could also be used to calculate the<br />
acidity coefficient.<br />
Properties of the glazes in the solid state<br />
The glaze properties are very important for reliability, prediction and<br />
<strong>de</strong>sign of the ceramic material.<br />
The physical-mechanical properties are calculated using an additive<br />
relation <strong>de</strong>scribed in next relation [4, 5]:<br />
135
where:<br />
P - property;<br />
ANA-MARIA CORMOŞ, FIRUłA GOGA, JOSEPH GASPAR, DAN IRIDON<br />
P =<br />
where: mj -“j” raw material weight;<br />
mam – the total mass of blend;<br />
ci,j – the concentration of “i” component in a “j” raw material;<br />
ci,am – the concentration of “i” component in mixture.<br />
136<br />
n<br />
∑<br />
i=<br />
1<br />
pici<br />
, (1)<br />
pi - additive coefficient of the “i” oxi<strong>de</strong> property;<br />
ci - concentration of “i” component in glaze, [mol %].<br />
In practice, for some oxi<strong>de</strong>s (B2O3, SiO2, PbO, TiO2) the additive<br />
coefficients are strong influenced by the existence and concentration of the<br />
other oxi<strong>de</strong>s from the system.<br />
In this article the following properties of glazes are calculated using<br />
the <strong>de</strong>veloped software: the thermal coefficient of expansion, the refractive<br />
in<strong>de</strong>x and dispersion in<strong>de</strong>x and <strong>de</strong>nsity.<br />
Glaze composition optimization<br />
To obtain a glaze with a pre-<strong>de</strong>fine properties; an optimization of<br />
glazes composition is necessary. In this software application, the group<br />
multi-dynamic optimization method was used [6]. The application of this<br />
method is characterized by following elements: an initial solution (the initial<br />
glaze composition), the precision of <strong>de</strong>termination of extreme point.<br />
The <strong>de</strong>veloped software application optimizes the composition of<br />
glaze in function of the thermal expansion coefficient with preservation of<br />
acidity coefficient in a specific limit for glaze. The difference between thermal<br />
coefficient of expansion of glaze and support layer have to be smaller than<br />
10 -7 , in or<strong>de</strong>r that the glaze not cracks during the cooling.<br />
Besi<strong>de</strong> the two above mentioned coefficients, the oxi<strong>de</strong> ratio is<br />
equally important to obtain a glaze (4.2 < SiO2/Al2O3 < 6.2; 0.8 < Na2O/K2O<br />
SOFTWARE APPLICATION FOR OBTAINING CERAMIC GLAZES …<br />
Software application – Case Study<br />
Solving of mathematical mo<strong>de</strong>l and finding the optimum of raw<br />
materials composition was done using Matlab software [7]. For the end-users,<br />
the GUIDE component (Graphical User Interface Development Environment)<br />
of Matlab was used in or<strong>de</strong>r to create an interactive interface which allows an<br />
easy handling of application. The interface application is easy to use because<br />
is using the standard components of the graphic interface of Windows<br />
Operation System, and the users do not need to know Matlab syntax.<br />
The main application window [8] (see Figure 2) contains the graphic<br />
elements for input data (temperature and composition) and commands for<br />
calculation of glaze properties, optimization of glaze composition and calculation<br />
of glaze formula. The glaze composition can be introduce in two ways using<br />
the Norton diagram (using the firing temperature) or read the glaze’s composition<br />
from keyboard.<br />
Using the “display” bottom the program can show the glaze composition<br />
(Figure 3).<br />
Figure 2. Main application window<br />
137
138<br />
ANA-MARIA CORMOŞ, FIRUłA GOGA, JOSEPH GASPAR, DAN IRIDON<br />
Figure 3. Glaze composition (weight %)<br />
The optimization of the composition needs to know the glaze properties,<br />
because any numeric optimization method expects an initial solution. The glaze<br />
properties can be visualized using „Property’s calculation” button from main<br />
window. The properties of glaze are showed in a new window (Figure 4).<br />
Figure 4. Glaze characteristics
SOFTWARE APPLICATION FOR OBTAINING CERAMIC GLAZES …<br />
Using the “Optimization” button from main application interface, a new<br />
window is open (Figure 5). The value of parameters for optimization: lower value<br />
and upper value of thermal coefficient of expansion and acidity coefficient are<br />
<strong>de</strong>fined using this window. The calculation of optimal composition is done using<br />
the “Run” button and the composition result is display in a new window (Figure<br />
6). The glaze properties after optimization are presented in Figure 7.<br />
Figure 5. Optimization window. Figure 6. Glaze [%weight]<br />
composition, after optimization.<br />
Figure 7. Glaze characteristics, after optimisation.<br />
139
140<br />
ANA-MARIA CORMOŞ, FIRUłA GOGA, JOSEPH GASPAR, DAN IRIDON<br />
Other option of application <strong>de</strong>veloped is the <strong>de</strong>termination of fabrication<br />
formula using a raw material database. The raw materials database of the<br />
software application is presented in Table 2. The opening of the window for<br />
the calculation of composition of mixture of raw materials (Figure 8) is doing<br />
by using the „Fabrication recipe” button from main application window.<br />
Table 2. Raw materials composition<br />
Raw SiO2 Al2O3 CaO MgO Na2O K2O LOI*<br />
Materials %weight %weight %weight %weight %weight %weight %weight<br />
Feldspatr 71.6 16.48 1.15 0.20 1.50 8.57 0.50<br />
Kaolin 53.5 32.78 0.47 0.38 0.15 0.47 12.18<br />
Sand 98.38 0.92 0.40 0.04 0.06 0.20 0.00<br />
Talc 61.36 0.63 0.83 30.65 0.08 0.03 6.42<br />
Wollastonite 51.82 1.01 44.30 1.13 0.20 0.32 1.22<br />
Limestone 0.00 1.47 53.90 0.00 0.00 0.00 44.64<br />
Soda ash 0.00 0.00 0.00 0.00 57.20 0.00 42.50<br />
Dolomite 0.20 0.38 26.10 24.32 0.00 0.00 66.10<br />
Alumina 0.00 1.70 32.00 0.00 0.00 0.00 66.10<br />
* LOI = Loss on ignition<br />
For <strong>de</strong>termination of raw materials quantity, the user must specify:<br />
raw materials used for glazes production and the bases oxi<strong>de</strong>s that are<br />
used for calculations. The results, the quantity of raw materials are available in<br />
a text <strong>file</strong>, „compmp.txt”<br />
Figure 8. The calculation of composition of mixture of raw materials
SOFTWARE APPLICATION FOR OBTAINING CERAMIC GLAZES …<br />
In or<strong>de</strong>r to validate the software application, the raw materials used<br />
and calculated formula for a glaze was <strong>de</strong>terminate, Table 3.<br />
Table 3. Raw materials for glazes<br />
Raw Material Kg/Kg<br />
Feldspatr 0.5389<br />
Kaolin 0.0843<br />
Sand 0.1808<br />
Talc 0.1075<br />
Wollastonite 0.0695<br />
Soda ash 0.0693<br />
The raw materials database of software application <strong>de</strong>veloped could<br />
be improved by adding new components and new oxi<strong>de</strong>s according to<br />
Seger formula.<br />
CONCLUSIONS<br />
The software application allows a fast <strong>de</strong>termination of glazes or glass<br />
properties with a known composition, the optimization of glazes composition<br />
using the pre-<strong>de</strong>finite properties and calculation of necessary of raw materials<br />
using the composition of glazes and available raw materials.<br />
The main importance of this software application is to <strong>de</strong>crease the<br />
calculation time and the number of experiments which must be achieved for<br />
obtaining an optimal composition glaze.<br />
The <strong>de</strong>veloped software application is helpful for stu<strong>de</strong>nts, chemical<br />
engineering, and scientific researchers who work in oxi<strong>de</strong> materials science<br />
and not only. The using of application reduces significantly the necessary<br />
time for preparation of fabrication recipe.<br />
REFERENCES<br />
1. S. Stefanov, S.Batschwarov, “Ceramic Glazes”, Bauverlag GmbH, Wiesba<strong>de</strong>n<br />
und Berlin, 1988.<br />
2. I. Teoreanu, N.Ciocea, A. Barbulescu, N.Ciontea, “Tehnologia produselor<br />
ceramice si refractare”, Editura Tehnica, Bucuresti, 1985<br />
3. F. Goga, Teză <strong>de</strong> doctorat,”Sisteme oxidice vitroase cu rol <strong>de</strong> acoperiri<br />
ceramice” Cluj-Napoca, 2004.<br />
4. I. Ar<strong>de</strong>lean, R. Ciceo-Lucacel, “Fizica si tehnologia materialelor oxidice”,<br />
Cluj-Napoca, 2000.<br />
5. P. Baltă, “Tehnologia Sticlei”, Ed. Didactică <strong>şi</strong> Pedagogică, Bucureşti, 1986.<br />
141
142<br />
ANA-MARIA CORMOŞ, FIRUłA GOGA, JOSEPH GASPAR, DAN IRIDON<br />
6. A. Imre, P. Agachi, “Optimizarea proceselor din industria chimică”, Editura<br />
Tehnică, Bucureşti, 2002.<br />
7. L.A. Dobrozanski, R. Honysz, Z. Brytan, Journal of Achievements in<br />
Materials and Manufacturing Engineering, 2006, 17 (1-2), 429.<br />
8. ***, “MATLAB Users Gui<strong>de</strong>”, The MathWorks Inc, 2006.
STUDIA UNIVERSITATIS BABES-BOLYAI, CHEMIA, LIV, 1, 2009<br />
Dedicated to Professor Liviu Literat, at his 80 th anniversary<br />
MAGNETIC FLUIDS – MATERIALS WITH<br />
REMARKABLE APPLICATIONS<br />
ANDRA TĂMAŞ a , ZENO GROPŞIAN a , ROMULUS MINEA a<br />
ABSTRACT. The paper presents contributions to MF preparation through<br />
magnetite chemical co-precipitation followed by stabilization with oleic acid and<br />
dispersion into a carrier liquid, or through carrier liquid exchange technique<br />
(mineral or paraffin oil). Based on the estimation and correlation of fluid specific<br />
properties (concentration, <strong>de</strong>nsity, dynamic viscosity, the saturation magnetization)<br />
has been presented the posibility to intensify the separation of aqueous two-phase<br />
systems with oily compounds content un<strong>de</strong>r magnetic <strong>file</strong>d action. The <strong>de</strong>vice<br />
contains a separator with immersed permanent magnets for oily phase separation<br />
from waste waters. It was established the separation efficiency as a function of<br />
separator feeding specific flow.<br />
Keywords: extraction, magnetic fluids, magnetic separator, oily phase<br />
INTRODUCTION<br />
Magnetic fluids (MF) or ferrofluids (FF) are colloidal suspensions of<br />
ultrafine particles (~ 10 nm) of ferro- and ferri- magnetic materials stabilized<br />
and dispersed into a carrier liquid. MF represent macroscopic uniform twophase<br />
systems. One phase–the liquid carrier- <strong>de</strong>termines the chemical and<br />
mechanical properties of the system, the other–a ferromagnetic substance<br />
in ultradisperse state–specifies the magnetic properties of a system.<br />
In or<strong>de</strong>r to maintain the aggregative stability of MF the adsorption of<br />
surfactant molecules on the particle surface may be employed. Adsorption<br />
layers (their effective width varying between 3 and 100 nm as a function of the<br />
structure and molecular weight of the solvent and stabilization agent) form the<br />
potential barrier preventing particles from approaching each other. The layer<br />
width should be sufficient to keep the particles from approaching each other to<br />
the distance when the Van <strong>de</strong>r Waals and dipole interaction forces come into<br />
prominence. Besi<strong>de</strong>s, the adsorbed molecules should ensure the lyophilization<br />
of particles and their compatibility with the dispersion medium [1, 2].<br />
a Universitatea "Politehnica" din Timişoara, <strong>Facultatea</strong> <strong>de</strong> <strong>Chimie</strong> Industrială <strong>şi</strong> Ingineria Mediului,<br />
P-Ńa Victoriei 2, RO-300006 Timişoara, andra.tamas@chim.upt.ro; r.minea@rdslink.ro
ANDRA TĂMAŞ, ZENO GROPŞIAN, ROMULUS MINEA<br />
MF were obtained for the first time at NASA (1960) as part of the<br />
spatial technology researches to realize a system with the function of control<br />
the fluid fuels flow in impon<strong>de</strong>rability conditions.<br />
The most used magnetic particles to MF preparation are: transition<br />
metals (Fe, Co, Ni, Zn), alloys (Fe-Co, Ni-Fe, Fe-Co-Ni), iron oxi<strong>de</strong>s, magnetite,<br />
ferrite (Mex+yFe2O4; Me=Co, Ni, Zn, Mn, Cu, Ba; x + y = 1), nitri<strong>de</strong> (Fe3N),<br />
bori<strong>de</strong> (FeB), silica-coated iron particles [1-4].<br />
The particles used are, preferably, of iron oxi<strong>de</strong>s because of their<br />
resistance to oxidation, rather than the transition metals, which have the<br />
benefit of higher saturation magnetization [5].<br />
As stabilizers are used compounds with a COOH group able to fixed<br />
on the magnetic particle and a hydrocarbon chain which allows dispersion<br />
into a liquid carrier. Stabilizing effects were obtained using: fatty acids (oleic,<br />
elaidic, lauric, stearic, erucic, linoleic, linolenic) or their salts, nonylphenyl-<br />
polyethylene glycol, triethanolamine (TEA), glycol esters with dibasic fatty<br />
acids (adipic), perfluorocarboxylic acids salts (C ≥ 8).<br />
As carrier liquids are used: petroleum, hydrocarbons (B, T, X, hexane,<br />
heptane, <strong>de</strong>cane etc), fluorinated and chlorinated hydrocarbons (dichloroethane,<br />
carbon tetrachlori<strong>de</strong>, trichloroethane), C1-5 alcohols, water, ethylene glycol,<br />
oils (mineral, parafin or silicon), esters of adipic, sebacic, citric, ftalic acids [6].<br />
Preparation of magnetic colloids: the size reduction by grinding of<br />
magnetic pow<strong>de</strong>r in the presence of a carrier solvent and a surfactant<br />
dispersing agent, for long periods of time (~ 1000 hours); by thermal<br />
<strong>de</strong>composition of metal carbonyls (Fe(CO)5, Fe2(CO)9, Fe3(CO)12, Co2(CO)8,<br />
Co4(CO)12, Ni(CO)4) in various liquid organic media (B, T, pentane, alcohols<br />
etc), gases or in vacuum (as stabilizers are used different types of polymers<br />
which facilitates the formation of small particles, moreover, by adsorbing on<br />
the particles it furnishes the solution aggregative stability); stable ferromagnetic<br />
colloids of iron can be obtained using high-intensity ultrasound to sonochemically<br />
<strong>de</strong>compose volatile organometalic compounds [7]; the electrolytic <strong>de</strong>position<br />
of fine Fe, Co, Ni particles or their alloys on a catho<strong>de</strong> ma<strong>de</strong> by a solid (Ni,<br />
Ag or steel) or liquid (Hg) metal from an electrolyte which contains the<br />
respective ions) in presence of a diluted solution of surfactant (oleic acid) in<br />
an hydrocarbon medium; by evaporation of a metal by making use of the<br />
electric discharge and subsequent con<strong>de</strong>nsation of a vapour in the form of<br />
hyperfine drops. MF preparation methods based on magnetite chemical coprecipitation<br />
or carrier liquid exchange are well-known [2, 8].<br />
RESULTS AND DISCUSSION<br />
MF preparation by chemical co-precipitation technique consists of<br />
magnetite precipitating from Fe<br />
144<br />
2+ and Fe 3+ solutions (usually FeSO4, FeCl3)<br />
in alkali (usually NH4OH), followed by stabilization and precipitate washing<br />
and dispersion into <strong>de</strong>sired carrier liquid.
MAGNETIC FLUIDS – MATERIALS WITH REMARKABLE APPLICATIONS<br />
Method of carrier liquid exchange consists in flocculation of magnetic<br />
stabilized particles with polar agents (e.g. acetone), magnetic sedimentation<br />
and redispersal in a second carrier liquid. Sometimes it is necessary to use<br />
another type of stabilizer. In this manner were prepared MF with mineral oil,<br />
paraffin oil or dioctyladipate as carrier liquids.<br />
Physico-chemical properties of MF <strong>de</strong>pend on magnetic material<br />
type, its concentration, the way of stability and the dispersion medium. Also,<br />
extremely important are, chemical composition of the magnetic material. In<br />
the case of magnetic particles based on ferrite is important Fe 2+ :Fe 3+ ratio,<br />
or other metals (Ni, Cr, Co) for mixed ferrites.<br />
Magnetic component concentration has a direct effect on the liquid<br />
carrier <strong>de</strong>nsity modification. For MF based on stabilized magnetite dispersed<br />
in petroleum, it was established the relation:<br />
ρMF = ρ P + 0.<br />
97 ⋅θ<br />
(1)<br />
−3<br />
where:θ - magnetite concentration, [ kg ⋅ m ], ρ MF , ρ P - MF and liquid<br />
−3<br />
carrier <strong>de</strong>nsities, [ kg ⋅ m ].<br />
Magnetization M has the applied field direction and its value is<br />
equal to the magnetic moments ( m ) sum of the ” n ” particles contained in a<br />
volume unit:<br />
μ ⋅ M = n ⋅ m<br />
(2)<br />
0<br />
In this manner, the magnetic attraction force ( F m ) and pressure ( P m )<br />
have the next expressions:<br />
F μ ⋅ M ⋅ gradB ⋅V<br />
, P = −μ<br />
⋅ ∫ M ⋅ dH (3a, b)<br />
m = 0<br />
S<br />
where: gradB - magnetic field gradient, M s - the saturation magnetization,<br />
μ 0 - magnetic permeability and V d the drops volume with magnetic<br />
component content.<br />
Dynamic viscosity of MF, η , <strong>de</strong>pends on the liquid carrier viscosity,<br />
3 −3<br />
η , and the stabilized particles volumic concentration, Φ , [ m ⋅ m ]:<br />
0<br />
d<br />
m<br />
= 1 1+<br />
a ⋅ Φ + b ⋅ Φ<br />
0<br />
2<br />
η η0<br />
(4)<br />
where a and b are specifically constants.<br />
In nonmagnetic field, MF present a Newtonian behaviour. The<br />
temperature <strong>de</strong>pen<strong>de</strong>nce of dynamic viscosity was expressed as Arrhenius<br />
type equations:<br />
H<br />
0<br />
145
ANDRA TĂMAŞ, ZENO GROPŞIAN, ROMULUS MINEA<br />
=<br />
⋅<br />
Ea R⋅T<br />
η A e<br />
(5)<br />
This fact allows to calculate the viscous flow activation energy, E a ,<br />
−1<br />
[ kJ ⋅ mol ], (Table 1):<br />
Table 1. Some MF characteristics<br />
Liquid carrier Density, Magnetization, Gs Arrhenius type relation Ea,<br />
−3<br />
kg ⋅ m<br />
kJ ⋅ mol<br />
Petroleum 1085 300 −5<br />
1615/<br />
T<br />
η = 2. 38⋅10<br />
⋅e<br />
13.4<br />
Petroleum 1430 600 −5<br />
1685/<br />
T<br />
η = 2. 57⋅10<br />
⋅e<br />
14.0<br />
Toluene 1150 300 −5<br />
1385/<br />
T<br />
η = 2. 32⋅10<br />
⋅e<br />
11.5<br />
Mineral oil 1235 350 −6<br />
3100/<br />
T<br />
η = 1. 56⋅10<br />
⋅e<br />
25.7<br />
Paraffin oil 1220 400 −7<br />
4020/<br />
T<br />
η = 2. 33⋅10<br />
⋅e<br />
33.4<br />
The interactions between MF and the external applied magnetic field<br />
(permanent magnets or electromagnets) are basic for the main applications in<br />
technical and biomedical field. The most MF applications are based on the<br />
possibility to place and control magnetic materials using a magnetic field with a<br />
suitable flux distribution: magneto<strong>de</strong>nsimetric separation (based on the<br />
levitation effect of nonmagnetic or low magnetic bodies in ferrofluids un<strong>de</strong>r an<br />
external magnetic field action, applied to useful minerals with different<br />
<strong>de</strong>nsities separation); pressure transducers and magnetofluidic clinometers,<br />
magnetooptical sensors, electroacoustical transducers; pressure sealings<br />
(magnetic field placed the MF in the gap between the surfaces of mobile and<br />
stationary elements); ferrofluidic lubricating; ferrofluidic dampers (based on MF<br />
restraint in spaces subject to vibrations using magnetic field); liquid carriers<br />
for different heat-exchange <strong>de</strong>vices, especially in <strong>de</strong>vices for magnetocaloric<br />
energy conversion; biomedical applications (separation and purification<br />
processes, in immunoassays, as agents for the <strong>de</strong>struction of cells via<br />
magnetic fields, as contrast agents to enhance magnetic resonance imaging<br />
(MRI) and for targeted <strong>de</strong>livery of therapeutic agents, MF present good effects<br />
in the wound healing process of the skin lesions, anti-inflammatory effects<br />
and anti-radiation protection, as a magnet-controlled haemosorbent for<br />
extracorporeal <strong>de</strong>toxication of biological media); growth and organogenesis<br />
stimulation; vitroplants obtaining, intensification of two-phase systems<br />
separation (in mass transfer processes) [9-11].<br />
MF based on oily compounds (hydrocarbons, mineral oils) can be<br />
used for oily components restraint through dissolution from waste or<br />
acci<strong>de</strong>ntally impurified waters. This process consists in oily component<br />
146<br />
−1
MAGNETIC FLUIDS – MATERIALS WITH REMARKABLE APPLICATIONS<br />
distribution between the liquid carrier of the MF and the aqueous phase.<br />
The mass transfer process is amplified thanks to the intimate contact result<br />
from the strong phases mixing. This fact leads to some emulsions formation. It<br />
is possible to establish a correlation between the values of the separation<br />
time in gravitational ( τ g ) and magnetic ( τ m ) field, at different values of<br />
M s for the oily phase and different magnetic field values [12]:<br />
a<br />
τ τ =1 + K ⋅ gradB ⋅ M<br />
(6)<br />
g<br />
m<br />
The coefficient K and the exponents a,b are specific to the used emulsion.<br />
To intensify the separation of such two-phase system were tested<br />
separators based on electromagnets, rotating or immersed permanent<br />
magnets [12-15]. Through the direct setting between the magnet and the<br />
emulsion with MF content there is the possibility of a maximum attraction<br />
force <strong>de</strong>velopment in the liquid layers in contact with the whole surface of<br />
the magnet (internal, external, frontal). Thus, the MF drops are submitted to<br />
an intense coalescence process obtained in a zone around the magnet<br />
body. The amount of MF retained on the magnet surface is much increased<br />
when the magnet is immersed in the aqueous medium due to the<br />
Archime<strong>de</strong>an force. The <strong>de</strong>tailed scheme for the separator with immersed<br />
ring-shaped magnet (Dxdxh=130x60x54mm) is shown in Figure 1:<br />
Figure 1. Separator for emulsions with magnetic fluid content.<br />
The magnet (2) is placed into the cylindrical body of the separator<br />
(1) and the ring- shaped portion is continued, to the upper si<strong>de</strong>, with a bell<br />
(3). The role of this one is to direct the emulsion submitted to separation to<br />
the ring-shaped area between magnet and the separator body where it<br />
circulates <strong>de</strong>scending, through the inferior frontal portion (4), and after that<br />
the separated aqueous phase is collected in the inner part of the bell. The<br />
ferrofluid is collected as a continuous layer (6) on the magnet surface and<br />
is aspirated periodically. The separated water crosses the magnet inferior<br />
frontal portion and goes into the bell (route 5a), in direct contact with the<br />
magnet inner surface, to remove all the unseparated MF drops.<br />
147<br />
b<br />
S
ANDRA TĂMAŞ, ZENO GROPŞIAN, ROMULUS MINEA<br />
Magnetic field distribution in the inner (a) and outer (b) position of a<br />
ring-shaped magnet is presented in Figure 2.<br />
To establish the separation effect of the ring-shaped magnet, water<br />
with oil content (0.5÷2%) was used in which was ad<strong>de</strong>d the proper amount<br />
of magnetic fluid so that the MF/water ratio was 1÷ 5 ml MF/1000ml water.<br />
After a strong combined mixing (mixer and recirculating pump) the emulsion<br />
was led through the separator, with various flow values. The magnetic fluid<br />
is retained around the magnet and the water with a high epuration <strong>de</strong>gree<br />
is collected and analyzed.<br />
Figure 2. Magnetic field distribution.<br />
The equipment that containe the magnetic separator is shown in Figure 3:<br />
Figure 3. Pilot-equipment with magnetic separator (1-separator; 2- vessel with<br />
stirring; 3-stirrer; 4-recirculation pump; 5- tank for MF; 6- collecting vessel).<br />
148
MAGNETIC FLUIDS – MATERIALS WITH REMARKABLE APPLICATIONS<br />
From the photoresistive experimental values the oily phase<br />
concentrations in the preepurated water samples were established. Based on<br />
these results we calculated the remove efficiencies (the ratio between the<br />
separated oil fraction and the one existent initially in water) of the organic<br />
magnetic phase after the wastewater passed through the separator (Table 2).<br />
Table 2. The final concentrations of organic phase and the separation efficiencies<br />
Specific flow,<br />
3 −2 −1<br />
m ⋅ m ⋅ h<br />
Δ R<br />
R<br />
Organic phase concentration<br />
ml oil 1000 ml water<br />
Separation<br />
efficiency, %<br />
initial final<br />
3.47 0.316 0.67 96.6<br />
6.53 0.485 20<br />
1.30 93.5<br />
9.92 0.583<br />
1.75 91.2<br />
It was found that the specific flow increasing leads to a less efficient<br />
separation of the organic component from the system. This conclusion is<br />
proved both by the photoresistance value increasing due to the less emulsion<br />
transparency (MF presence) and the remove efficiency <strong>de</strong>creasing.<br />
CONCLUSIONS<br />
Using chemical co-precipitation technique and carrier liquid<br />
exchange were prepared MF with estimated concentrations/magnetizations<br />
and good stability.<br />
Petroleum, mineral or paraffin oil based MF present Newtonian behaviour,<br />
the temperature influence been represented by Arrhenius type equations.<br />
For biphasic systems with MF, the external magnetic field action has<br />
an intensifying effect to phase separation.<br />
It was built and tested a pilot-equipment for oily components recovery<br />
from waste waters using MF and a separator with immersed permanent<br />
magnet. The separation <strong>de</strong>gree as a function of the waste waters specific<br />
flow was established.<br />
EXPERIMENTAL SECTION<br />
For stabilized magnetite preparation, aqueous solutions of FeSO4<br />
(0.35M) and FeCl3 (0.7M), heated to 65°C were treated, un<strong>de</strong>r strong stirring,<br />
with a NH4OH solution (25%), 20% excess. Afterwards, oleic acid diluted in<br />
petroleum is ad<strong>de</strong>d (1:1). The heating is continued (t ~ 102°C) until the<br />
magnetic precipitate is separated in comparison with the aqueous solution<br />
which contained dissolved salts NH4Cl and (NH4)2SO4. Clarifying and<br />
recurrent washing of the stabilized magnetic precipitate are followed by its<br />
149
150<br />
ANDRA TĂMAŞ, ZENO GROPŞIAN, ROMULUS MINEA<br />
dispersion into the carrier liquid (petroleum), un<strong>de</strong>r heating and stirring.<br />
Through filtration (that can be intensified using magnetic field), is obtained MF<br />
whose concentration <strong>de</strong>pends on the ad<strong>de</strong>d amount of the carrier liquid.<br />
MF characterization required <strong>de</strong>nsity, dynamic viscosity, saturation<br />
magnetization and Fe(II): Fe(III) ratio <strong>de</strong>termination.<br />
From petroleum based MF were obtained mineral or paraffin oil<br />
based MF (MF-MO, MF-PO) through the carrier liquid exchange technique.<br />
REFERENCES<br />
1. E. Blums, A. Cebers, M.M. Maiorov, “Magnetic Fluids”, Walter <strong>de</strong> Gruyter<br />
Berlin, New York, 1997.<br />
2. R.E. Rosensweig, “Ferrohydrodynamics”, Dover Publications, Inc. Mineola,<br />
New York, 1997.<br />
3. S. Taketomi, Y. Ozaki, K. Kawasaki, S. Yuasa, H. Miyajima, J.Magn. Magn.<br />
Mater., 1993, 122, 6.<br />
4. L.N. Donselaar, “Silica-magnetite colloids and magnetic fluids: Synthesis<br />
and particle interactions”, PhD Thesis, Utrecht University, 1998.<br />
5. S.W. Charles, Romanian Reports in Physics, 1995, 47 (3-5), 249.<br />
6. D. Bica, R. Minea, Patent RO 93109, 1987.<br />
7. I. Bica, Romanian Reports in Physics, 1995, 47 (3-5), 273.<br />
8. E. Luca, Gh. Călugăru, R. Bă<strong>de</strong>scu, C. Cotae, V. Bă<strong>de</strong>scu, “Feroflui<strong>de</strong>le <strong>şi</strong><br />
aplicaŃiile lor în industrie”, Ed. Tehnică, Bucureşti, 1978.<br />
9. I. Anton, I. De Sabata, L. Vekas, Conf. Ma<strong>şi</strong>ni hidraulice <strong>şi</strong> hidrodinamică,<br />
IP Timisoara, 1985, 141.<br />
10. M. Şincai, D. Argherie, D. Gângă, D. Bica, L. Vekas, Proceedings of ISACB<br />
Congress, Gainesville, USA, 2002.<br />
11. R. Minea, A. Tămaş, M. Corneanu, G. Corneanu, Annals of West Univ. of<br />
Timisoara, Series Chemistry, 2003, 12(3), 1561.<br />
12. A. Tămaş, “ContribuŃii la obŃinerea <strong>şi</strong> caracterizarea flui<strong>de</strong>lor magnetice –<br />
Emulsii cu conŃinut <strong>de</strong> flui<strong>de</strong> magnetice”, Teză <strong>de</strong> doctorat, Univ. “Politehnica”<br />
Timisoara, 2004.<br />
13. Z. Grop<strong>şi</strong>an, R. Minea, E. Brînzei, A. Tămaş, Rev. Chim.(Bucuresti), 2004,<br />
55(8), 577.<br />
14. A. Tămaş, R. Minea, Romanian Reports in Physics, 2006, 58(3), 351.<br />
15. R. Minea, A. Tămaş, E. Brînzei, M. Şuta, “The behaviour of emulsions with<br />
ferrofluid content in magnetic field”, 4 th European Congress of Chemical<br />
Engineering, Granada, Spain, 2003.
STUDIA UNIVERSITATIS BABES-BOLYAI, CHEMIA, LIV, 1, 2009<br />
Dedicated to Professor Liviu Literat, at his 80 th anniversary<br />
THE INFLUENCE OF SOLID SURFACE ON THE<br />
ADSORPTION OF ANTI-C1Q MONOCLONAL ANTIBODY AT<br />
ISOELECTRIC pH<br />
IOAN BALEA a , MARIA TOMOAIA-COTIŞEL a* , OSSI HOROVITZ a ,<br />
GHEORGHE TOMOAIA b , AURORA MOCANU a<br />
ABSTRACT. The effect of solid surface and ionic strength, in a buffer solution<br />
at isoelectric pH (5.5), on the surface immobilization, and adsorption process<br />
of a mouse monoclonal antibody, type IgG1, anti-C1q, is investigated by<br />
atomic force microscopy (AFM). The adsorption is conducted on glass, amino<br />
silanized glass, and positively charged modified glass. The AFM images<br />
present a monolayer adsorption with a dominant lying flat orientation of the<br />
molecules. This suggests that van <strong>de</strong>r Waals interactions and possibly<br />
hydrogen bonds between antibody molecules and the solid substrate are the<br />
dominant interactions upon electrostatic forces, in conditions of rather low<br />
surface charge <strong>de</strong>nsities, high ionic strength of buffer solutions, and antibody<br />
molecules without a net charge.<br />
Keywords: anti-C1q monoclonal antibody, adsorption, AFM, ionic strength,<br />
surface charge<br />
INTRODUCTION<br />
Proteins and particularly antibodies are in the focus of interest for<br />
investigations by various mo<strong>de</strong>rn physical methods. Their immobilization in<br />
stable adsorption layers on solid surfaces is important in diverse applications,<br />
therefore the antibody adsorption has been un<strong>de</strong>rtaken on a variety of surfaces,<br />
such as mica, silica, glass and gold [1-3], by using different techniques. Among<br />
them, atomic force microscopy (AFM) has proved as a versatile technique<br />
capable of providing information at nanometer and molecular level, e.g. the<br />
structural morphology and the spatial distribution of antibody molecules as well<br />
as the antibody layer thickness and roughness on the solid surface [4-11].<br />
a Universitatea Babeş-Bolyai, <strong>Facultatea</strong> <strong>de</strong> <strong>Chimie</strong> <strong>şi</strong> <strong>Inginerie</strong> <strong>Chimică</strong>, Str. Kogălniceanu, Nr. 1,<br />
400048, Cluj-Napoca, Romania, mcotisel@chem.ubbcluj.ro<br />
b Universitatea <strong>de</strong> Medicină <strong>şi</strong> Farmacie, Str. Mosoiu , Nr. 47, 400132, Cluj-Napoca, Romania
IOAN BALEA, MARIA TOMOAIA-COTIŞEL, OSSI HOROVITZ, GHEORGHE TOMOAIA, AURORA MOCANU<br />
The anti-C1q monoclonal antibody, the object of our present<br />
investigation, is a Y-shaped protein molecule, having a molecular weight of<br />
150 KDa and an isoelectric pH of about 5.5. It is known that this antibody<br />
recognizes and reacts specifically with the globular heads of the C1q<br />
protein, which plays a central role in innate immunity, being involved in the<br />
early phase of the classical pathway of the complement system activation<br />
[12]. It is also known that the C1q protein is involved in the pathogenesis of a<br />
wi<strong>de</strong> range of diseases [13-15], such as Alzheimer`s disease, prionic diseases<br />
and lupus erythematosus systemic. Immunohistochemistry uses this monoclonal<br />
antibody specific for C1q protein in ELISA [16], RIA (radio immunoassay),<br />
Western blotting and flow cytometry methods [17]. For example, ELISA is a<br />
solid-phase immunoassay [16] frequently used in immunology, biochemistry,<br />
biophysics, medical diagnostics, and other areas of medical science. This<br />
immunoassay involves the immobilization of one reactant, such as a<br />
specific antibody, on the solid surface usually by adsorption.<br />
Usually in the antibody molecule we distinguish between the Fab<br />
fragment (antigen-binding fragment), which binds analyte (antigen) with high<br />
specificity, and the Fc fragment (constant fragment). For immunoassay<br />
applications, the control of adsorption and orientation of antibodies on surfaces<br />
is necessary to ensure that their active sites (the two “ends” of the Y-shaped<br />
molecule) are away from the surface and accessible to bulk solution, i.e. the<br />
Fc fragment (the “head” of the molecule) binds to the solid surface.<br />
Here we investigate the effects of various adsorption surfaces and<br />
physical factors such as ionic strength over the adsorption process of the<br />
anti-C1q monoclonal antibody at the isoelectric point (IEP), where the net<br />
charge of the antibody is almost zero (pH = 5.5). We employed AFM to<br />
image the morphology of the adsorbed layer and to observe adsorption<br />
patterns on a variety of hydrophilic solid surfaces, such as glass, silanized<br />
glass and positively charged glass and for ionic strengths of 0.031 and 0.055.<br />
AFM is used to evi<strong>de</strong>nce the relative changes in the thickness of the antibody<br />
adsorbed layers and the possible surface aggregation (i.e. surface clusters).<br />
RESULTS AND DISCUSSION<br />
Ionic strength of buffer solutions. The ionic strength of a solution is<br />
<strong>de</strong>fined as a function of the concentrations of all the ions present in a<br />
solution and of their charges:<br />
152<br />
= J<br />
1<br />
2<br />
∑<br />
where ci is the molar concentration of ion i (mol dm -3 ), zi is the charge<br />
number of that ion, and the sum is taken over all ions in the solution. In<br />
i<br />
c<br />
i i z<br />
2
THE INFLUENCE OF SOLID SURFACE ON THE ADSORPTION …<br />
or<strong>de</strong>r to calculate the ionic strength, a speciation of the buffer solutions had<br />
to be ma<strong>de</strong>. With use of the Hyperquad simulation and speciation (HySS)<br />
program [18], we obtain the distribution of species concentrations versus<br />
pH for the 10 mM solution of citric acid and citrates (Fig. 1). If we <strong>de</strong>note<br />
the citric acid C6H8O7 as H3A and its sodium salts by NaH2A, Na2HA and<br />
Na3A, the species present in the buffer solutions at different pH = 5.5 are<br />
calculated to be about: H2A - 10%; HA 2- 80%; A 3- 10%.<br />
Therefore, for the 10 mM buffer solution at pH = 5.5 the concentrations<br />
of the ionic species are: [H2A - ] = 1 mM; [HA 2- ] = 8 mM; [A 3- ] = 1 mM; [Na + ]<br />
= 1 + 8·2 + 1·3 = 20 mM. The ionic strength is here:<br />
1 2 2 2<br />
2 −3<br />
−2<br />
J = ( 1⋅1<br />
+ 8⋅<br />
2 + 1⋅<br />
3 + 20 ⋅1<br />
) ⋅10<br />
= 3.<br />
1⋅10<br />
M<br />
2<br />
Figure 1. Species distribution versus pH calculated for a 10 mM solution of<br />
citric acid (AH3) pKa1=3.13, pKa2 = 4.76, pKa3=6.40 and citrates.<br />
By adding 0.15 M NaCl solution (0.5 mL), J = 0.15, to 2 mL buffer solution,<br />
the ionic strength becomes: J = M<br />
153<br />
2<br />
2 2 − 0.<br />
5<br />
−<br />
3.<br />
1⋅<br />
10 + ⋅ 0.<br />
15 = 5.<br />
48⋅10<br />
.<br />
2.<br />
5 2.<br />
5<br />
Solid surface characteristics. The following surfaces were used for<br />
antibody adsorption: freshly cleaned optically polished glass plates, and<br />
modified glass (positively charged glass - enriched in Al 3+ ions, and amino<br />
silanized glass). It is known that glass plates in contact with water are<br />
negatively charged. The point of zero charge, i.e. the pH at which the surface<br />
<strong>de</strong>nsity of positive charges is equal to the surface <strong>de</strong>nsity of negative charges,<br />
for silica is around pH 2 to 3 [19, 20], that is at higher pH values the solid<br />
surface is negatively charged [21]. The same should apply to glass surfaces.<br />
The chemical reactions <strong>de</strong>scribing amino silanization are [22]:<br />
- the partial hydrolysis of the aminosilan with traces of water in the<br />
solvent (Scheme 1):
IOAN BALEA, MARIA TOMOAIA-COTIŞEL, OSSI HOROVITZ, GHEORGHE TOMOAIA, AURORA MOCANU<br />
Scheme 1<br />
- the binding on the glass surface (silicate ions) is given in Scheme 2:<br />
O-C2H5<br />
H2N-CH 2-CH2-CH2-Si-O-C2H5<br />
O-H + HO-Si-O-Si-<br />
O<br />
HO-Si-O-Si -<br />
Scheme 2<br />
O-C2H5<br />
H2N-CH 2-CH 2-CH 2-Si-O-C 2H5<br />
O-Si-O -Si-<br />
+ HO-Si-O-Si-<br />
Surface charge measurements indicated that aminosilanization<br />
converts the glass surface from negative to positive potentials at neutral pH<br />
values [23]. The equilibrium between protonated amine groups (NH3<br />
154<br />
+ ) and<br />
amine group (NH2) is characterized by the Ka value of the conjugated acid<br />
of the amine; this constant can be estimated as being of the or<strong>de</strong>r of<br />
magnitu<strong>de</strong> of the known value for propylamine [21]: pKa ≈ 10.2. That means<br />
that for a pH value of 10.2 there are around 50% uncharged –NH2 and 50%<br />
protonated –NH3 + groups. At lower pH values, most of the amine group are<br />
protonated, giving a net positive charge to the surface.<br />
As it was shown, only 30 to 50% of silanol groups are grafted during<br />
silanization reaction [24], and thus on an aminosilanized glass (or silica)<br />
surface, there are likely to be present both amine and silanol (Si-OH) groups.<br />
All the used surfaces are very hydrophilic (contact angle θ = 0 o ),<br />
except for amino silanized glass surfaces which are poorly wettable. For<br />
amino NH3 + terminated silane monolayers on silicon, a contact angle between<br />
θ = 42 o for completely ionized NH3 + groups (at low pH values) and θ = 62 o<br />
for non ionized NH2 groups (at high pH values) was reported [25]. The<br />
corresponding values for amino silanized glass surfaces should be similar.<br />
Characterization of the adsorbed antibody layers. The differences<br />
both in morphology and in the thickness of adsorbed antibody layers might<br />
arise from the different orientation of the molecules on the surface, but also<br />
from structural modification/<strong>de</strong>formation of adsorbed protein molecules<br />
associated with different electrostatic interactions (attractions or repulsions)<br />
between antibody molecules within the antibody layers as well as among<br />
the antibody molecules and the solid surface. In or<strong>de</strong>r to evi<strong>de</strong>nce the influence<br />
of different factors on the surface morphology and molecular orientation of the<br />
O<br />
+ H2O
THE INFLUENCE OF SOLID SURFACE ON THE ADSORPTION …<br />
antibody molecules adsorbed on various solid supports, the height and<br />
roughness (RMS) of adsorbed layers obtained from antibody solutions,<br />
estimated from AFM images, are presented in Table 1.<br />
Table 1. AFM characterization of anti-C1q antibody layers adsorbed on different<br />
solid surfaces at pH = 5.5 (scanned area 0.5 μm x 0.5 μm).<br />
Fig. J<br />
Solid surface Conc. Height Å RMS<br />
mol/L<br />
mg/L<br />
on area<br />
2 0.031 Silanized glass 2 40-54 1.1<br />
3 0.055 Silanized glass 1.6 40 0.7<br />
4 0.031 Positively charged glass 2 40-53 1.6<br />
5 0.055 Positively charged glass 1.6 40 0.9<br />
6 0.055 Glass 1.6 42 0.7<br />
The antibody adsorption was performed at three bulk antibody<br />
concentrations, at about 0.9, 1.6 and 2 mg/L in aqueous buffer solutions.<br />
An analysis of AFM images showed that the antibody adsorption reached a<br />
steady state saturation of the solid surface within 2 hours at 20 o C, in<br />
substantial agreement with its adsorption carried out for comparison at 17<br />
hours at 4 o C. This is also in general agreement with data reported for the<br />
adsorption of other proteins (e.g. storage protein from aleurone cells of<br />
barley) on solid surfaces [26, 27]. Thus, even at low bulk concentration this<br />
antibody exhibits a quite high affinity to solid surfaces used.<br />
Typical AFM images of antibody adsorption on amino silanized glass<br />
surface from a 2 mg/L solution (J = 0.031 M) are given in Fig. 2. For the same<br />
surface, but with a 1.6 mg/L antibody solution (J = 0.055 M), AFM images are<br />
given in Fig. 3. The main feature of the adsorbed layer is the almost uniform<br />
distribution of antibody particles on the silanized glass surface (Figs. 2 and 3;<br />
panels: a, b, c, d). The analysis of representative cross section pro<strong>file</strong>s (Fig. 2e<br />
and 3e) show that the antibodies films are about 40 to 54 Å high (Table 1). The<br />
antibody particles have lateral dimensions typically in the range of 15 to 30 nm.<br />
The anti C1q antibody belongs to the same type IgG1 as the mouse<br />
monoclonal antibody, anti-β-hCG [28]. For anti-β-hCG antibody on the<br />
basis of the X-ray crystallographic molecular dimensions of 3.8 x 8.5 x 14.2<br />
nm [28-31] are given. For fibrinogen molecules the corresponding data are<br />
4.5 x 4.5 x 47 nm [28, 32-34]. Consi<strong>de</strong>ring that the size of anti-C1q<br />
antibody is close to the anti-β-hCG antibody, it is reasonable to suggest<br />
that the observed antibody particles are predominantly monomers. The<br />
scan height of about 4 nm for anti-C1q antibody molecules is closed to the<br />
short axial length of 3.8 nm of the antibody molecule. This finding reveals<br />
that antibody molecules adsorbed in the flat-on orientation with the antibody<br />
molecules lying flat on the solid surface. However some particles are larger<br />
and could have a certain <strong>de</strong>clivity toward the surface. An almost compact<br />
155
IOAN BALEA, MARIA TOMOAIA-COTIŞEL, OSSI HOROVITZ, GHEORGHE TOMOAIA, AURORA MOCANU<br />
156<br />
a b c<br />
d e<br />
Figure 2. AFM images for antibody adsorbed on silanized glass from 2 mg/L<br />
antibody solution, J ≈ 0.031 M: a) 2D – topography; b) phase image; c) amplitu<strong>de</strong><br />
image; d) 3D-topography; e) pro<strong>file</strong> of the cross section along the arrow in fig. (a).<br />
a b c<br />
d e<br />
Figure 3. AFM images for antibody adsorbed on silanized glass from 1.6 mg/L<br />
antibody solution, J ≈ 0.055: a) 2D – topography; b) phase image; c) amplitu<strong>de</strong> image;<br />
d) 3D-topography; e) pro<strong>file</strong> of the cross section along the arrow in fig. (a).
THE INFLUENCE OF SOLID SURFACE ON THE ADSORPTION …<br />
layer of random orientations results, with representative granular structure<br />
in substantial agreement with the adsorption of IgG protein on silanized<br />
mica surface [35].<br />
In the case of the positively charged glass surface, enriched in Al 3+<br />
ions (Figs. 4 and 5), the observed heights (Table 1) are similar to those for<br />
the amino silanized surface, both for 0.031 M and 0.055 M ionic strength,<br />
suggesting that antibody molecules form a monolayer of rather “lying flat”<br />
molecular orientation.<br />
a b c<br />
d e<br />
Figure 4. AFM images for antibody adsorbed on glass (positively charged) from 2<br />
mg/L antibody solution, J ≈ 0.031: a) 2D – topography; b) phase image; c) amplitu<strong>de</strong><br />
image; d) 3D-topography; e) pro<strong>file</strong> of the cross section along the arrow in fig. (a).<br />
Generally, it is found that at the isoelectric point, where the net<br />
charge of the antibody is zero, the Fab fragments will still carry positive<br />
charge while the Fc fragment will carry negative charge [36-38], and<br />
therefore the antibody molecule has a nonzero dipole moment. Physical<br />
adsorption is affected by several factors, such as van <strong>de</strong>r Waals interaction,<br />
electrostatic interaction, hydrophobic effect, hydrogen bonding, pH values<br />
and ionic strength of the solution etc. A Monte Carlo simulation on mo<strong>de</strong>ls<br />
of antibody adsorption on charged surface [39] <strong>de</strong>scribed the orientation of<br />
adsorbed antibody molecules as a result from the compromise between<br />
electrostatic and van <strong>de</strong>r Waals interactions. The dipole moment of an<br />
antibody is an important factor for its orientation on charged surfaces when<br />
electrostatic interactions dominate. In this situation, on positively charged<br />
157
IOAN BALEA, MARIA TOMOAIA-COTIŞEL, OSSI HOROVITZ, GHEORGHE TOMOAIA, AURORA MOCANU<br />
solid surfaces the antibody molecules are oriented preferentially with the<br />
negative Fc “head” towards the surface, while on negatively charged<br />
surfaces the orientation with the positive Fab ends on the surface is<br />
preferred. These orientations are promoted by high surface charge <strong>de</strong>nsity,<br />
high dipole moments of molecules and low solution ionic strength, where<br />
electrostatic interactions dominate. At low surface charge <strong>de</strong>nsity and high<br />
solution ionic strength van <strong>de</strong>r Waals interactions dominate, and the<br />
antibody molecules have a “lying-flat’’ orientation on surfaces.<br />
Our results suggest that for the rather low positive charge <strong>de</strong>nsities<br />
on the modified glass surfaces and the quite high ionic strength of the solutions,<br />
the flat orientation is predominant. However, for the lower ionic strength (Figs.<br />
2 and 4) both the height of the layers and their roughness (as measured by the<br />
RMS values of the adsorbed layers) are somewhat greater than for the higher<br />
ionic strength (Figs. 3 and 5) as expected from the above mo<strong>de</strong>l.<br />
The AFM images for the adsorbed anti-C1q antibody molecules on<br />
glass surface (Fig. 6), negatively charged, look very similar to the corresponding<br />
images for adsorption on positively charged glass and the height is also the<br />
same (Table 1). The orientation of the molecules should however be in this<br />
case with the Fab ends toward the surface (“head on”), but for the quite<br />
158<br />
a b c<br />
d e<br />
Figure 5. AFM images for antibody adsorbed on glass (positively charged) from 1.6<br />
mg/L antibody solution, J ≈ 0.055: a) 2D – topography; b) phase image; c) amplitu<strong>de</strong><br />
image; d) 3D-topography; e) pro<strong>file</strong> of the cross section along the arrow in fig (a).
THE INFLUENCE OF SOLID SURFACE ON THE ADSORPTION …<br />
high ionic strength of the buffer solution, the flat orientation given by van<br />
<strong>de</strong>r Waals interactions dominates.<br />
The mo<strong>de</strong>l calculations [39] indicate that the intermolecular<br />
antibody-antibody interactions are much less important than antibody–solid<br />
surface interactions for the investigated systems, therefore protein–protein<br />
interactions do not significantly affect protein orientation even at high<br />
surface coverage and multilayer formation is not expected.<br />
CONCLUSIONS<br />
a b c<br />
d e<br />
Figure 6. AFM images for antibody adsorbed on glass from 1.6 mg/L antibody<br />
solution, J ≈ 0.055: a) 2D – topography; b) phase image; c) amplitu<strong>de</strong> image; d) 3Dtopography;<br />
e) pro<strong>file</strong> of the cross section along the arrow in fig (a).<br />
The interpretation of AFM images shows that anti-C1q monoclonal<br />
antibody adopts a flat on orientation with an average thickness of about 40<br />
Å, when adsorbed on amino silanized glass, glass negatively charged or<br />
glass positively charged for isoelectric pH (about 5.5) of aqueous buffer<br />
solution of antibody, for used bulk concentrations of antibody 2 mg/L and 1.6<br />
mg/L and at 0.031 M and 0.055 M ionic strengths. Only antibody monolayers<br />
seem to be formed on the used solid surfaces. At this isoelectric pH value, the<br />
anti-C1q antibody molecules are without net charge. Due to the uncharged<br />
antibody molecules, to the rather low surface charge <strong>de</strong>nsity, and to the<br />
high ionic strength of the solutions screening the electrostatic interactions,<br />
these forces are not the dominant factor in controlling the adsorption and<br />
orientation of antibody molecules in this case. Van <strong>de</strong>r Waals seems to play<br />
159
IOAN BALEA, MARIA TOMOAIA-COTIŞEL, OSSI HOROVITZ, GHEORGHE TOMOAIA, AURORA MOCANU<br />
here an important role in <strong>de</strong>termining the orientation of adsorbed antibodies, as<br />
well as hydrogen bonding.<br />
Thus, our data suggest that protein-solid surface attractive interactions,<br />
more than intermolecular protein-protein forces have a primary importance<br />
for molecular orientation within the adsorbed anti-C1q antibody layers.<br />
Further, the conformational changes induced in adsorbed anti-C1q antibody<br />
molecules due to the attractive interactions with the substrate might cause<br />
a distortion of the molecules.<br />
Investigations at other pH values of the solution, where the antibody<br />
molecules bear a net positive (lower pH values than the isoelectric pH) or<br />
negative (higher pH values) charge will complete the study of the factors<br />
making possible the control of the orientation, and conformation of antibodies<br />
upon adsorption. This is of outstanding importance for the numerous<br />
applications of antibodies in biotechnology and clinical medicine, where the<br />
antibody is employed as a molecular recognition element that binds<br />
specifically to its antigen with high affinity and is often required to be<br />
immobilized on a solid support.<br />
EXPERIMENTAL SECTION<br />
The antibody used in this study was a mouse monoclonal anti-C1q.<br />
The antibody was purchased (Cat. No. A201) from Qui<strong>de</strong>l Corporation (San<br />
Diego, CA, USA). It was used in 10 mM citric acid / sodium citrate buffer of<br />
pH value of 5.5. The ionic strength of the solution was adjusted by adding<br />
150 mM NaCl solution. Three antibody concentrations were prepared, about<br />
0.9, 1.6, 2 mg/L All chemicals used in the present work (citric acid, trisodium<br />
citrate, Na2HPO4, NaH2PO4, NaOH, NaCl) were of analytical reagent gra<strong>de</strong><br />
and used without further purification.<br />
Prior to each adsorption experiment, the glass surface (plates with<br />
an area of 2x2 cm 2 ) was cleaned un<strong>de</strong>r known protocol, followed by strong<br />
rinsing with <strong>de</strong>ionized water with resistivity bigger than 18 Mohm cm. Then,<br />
some clean glass surfaces were further modified as <strong>de</strong>scribed bellow.<br />
In or<strong>de</strong>r to obtain positively charged glass, the glass plates were<br />
washed with <strong>de</strong>tergent, rinsed with water and dried. After this, they were<br />
washed again with chromic mixture, rinsed with a lot of water, and dried. In<br />
the next step, the glasses were immersed in a 2 mM solution of Al(NO3)3 at<br />
90 o C for 30 min. Afterwards, the glass plates were washed with <strong>de</strong>ionized<br />
water and dried.<br />
The silanization was ma<strong>de</strong> using aminopropyltriethoxysilane [22, 40, 41]<br />
as follows. The glass plates we cleaned as shown above. Later, the glasses we<br />
boiled with chromic acid for one hour and cooled slowly to the room<br />
temperature. The glass plates were washed extensively with bidistilated water<br />
160
THE INFLUENCE OF SOLID SURFACE ON THE ADSORPTION …<br />
and dried at 100 o C for 1 hour. Then, the glass plates were immersed in a 1 %<br />
solution of aminopropilethoxysilan in methanol (freshly prepared) at room<br />
temperature for one hour. Further, the glass plates were washed with methanol,<br />
treated with ultrasounds in methanol medium and dried for one hour at 100 o C.<br />
The antibody coating layers on the solid substrates were prepared<br />
by immersing the solid substrate vertically in the antibody aqueous<br />
solutions at room temperature for 2 hours or for 17 hours at 4 o C. After the<br />
adsorption (incubation) time, each sample was withdrawn and gently rinsed<br />
with <strong>de</strong>ionized water and dried at room temperature, un<strong>de</strong>r a beaker and<br />
prepared for AFM investigation. As an alternative some samples were dried<br />
un<strong>de</strong>r a weak but stable nitrogen stream and then immediately subjected to<br />
AFM imaging. In the last situation, the drying took less than 0.5 min. As<br />
recently mentioned [28], such a short drying process does not provoke the<br />
antibody structural modifications or its surface aggregation.<br />
Then, all samples were investigated by AFM in tapping mo<strong>de</strong>, to<br />
minimize the force exerted from the scanning tip on the adsorbed antibody<br />
layers. The AFM imaging was performed on JEOL 4210 equipment. All<br />
measurements were performed in air at room temperature for high lateral<br />
image resolution. Standard cantilevers, non-contact conical shaped of<br />
silicon nitri<strong>de</strong> coated with aluminum, were used. The sharpened tips were<br />
on cantilevers with a resonant frequency in the range of 200 - 300 kHz and<br />
with a spring constant of 17.5 N/m. AFM images were collected at a scan<br />
angle 0 o and at a scan rate of about 1 Hz.<br />
To unravel structural features, the antibody adsorbed layers were<br />
visualized from large scan area of 20 x 20 µm 2 to relatively small areas of<br />
1x1 and 0.2 x 0.2 µm 2 . AFM observations were repeated on different areas of<br />
the same film. The images were obtained from at least five macroscopically<br />
separated areas on each sample. All images were processed using the<br />
standard procedures for AFM. AFM images consist of multiple scans<br />
displaced laterally from each other in y direction with 512 x 512 pixels. All<br />
AFM experiments were carried out un<strong>de</strong>r ambient laboratory conditions<br />
(about 20 o C) as previously reported [26, 27, 42]. The AFM images on<br />
samples prepared in both drying procedures show no observable drying<br />
patterns un<strong>de</strong>r the experimental working conditions. This study is done<br />
un<strong>de</strong>r comparable surface packing <strong>de</strong>nsity, at the same adsorption time (2<br />
hours at room temperature), at quasi saturation of surface with antibody.<br />
ACKNOWLEDGMENTS<br />
This research was realized having financial support from the Scientific<br />
research project no. 41-050/2007, within the PN2 Program.<br />
161
IOAN BALEA, MARIA TOMOAIA-COTIŞEL, OSSI HOROVITZ, GHEORGHE TOMOAIA, AURORA MOCANU<br />
162<br />
REFERENCES<br />
1. J. P. Gering, L. Quaroni, G. Chumanov, Journal of Colloid and Interface<br />
Science, 2002, 252, 50.<br />
2. Q. Weiping, X. Bin, W. Lei, W. Chunxiao, Y. Danfeng, Y. Fang, Y. Chunwei,<br />
W. Yu, Journal of Colloid and Interface Science, 1999, 214, 16.<br />
3. F. Caruso, E. Rodda, D. N. Furlong, Journal of Colloid and Interface<br />
Science, 1996, 178, 104.<br />
4. N. H. Thomson, Journal of Microscopy, 2005, 217, 193.<br />
5. A. S. Lea, A. Pungor, V. Hlady, J. D. Andra<strong>de</strong>, J. N. Herron, E. W. Voss, Jr.,<br />
Langmuir, 1992, 8, 68.<br />
6. J. N. Lin, B. Drake, A. S. Lea, P. K. Hansma, J. D. Andra<strong>de</strong>, Langmuir,<br />
1990, 6, 509.<br />
7. W. D. Marcus, H. Wang, S. M. Lindsay, M. R. Sierks, Nanomedicine:<br />
Nanotechnology, Biology, and Medicine, 2008, 4, 1.<br />
8. L. S. Shlyakhtenko, B. Yuan, S. Emadi, Y. L. Lyubchenko, M. R. Sierks,<br />
Nanomedicine: Nanotechnology, Biology, and Medicine, 2007, 3, 192.<br />
9. M. Targosz, A. Labuda, P. Czuba, R. Biedron, M. Strus, A. Gamian, J.<br />
Marcinkiewicz, M. Szymonski, Nanomedicine: Nanotechnology, Biology<br />
and Medicine, 2006, 2, 82.<br />
10. B. Walivaara, A. Askendal, I. Lundstrom, P. Tengvall, Journal of Colloid<br />
and Interface Science, 1997, 187, 121.<br />
11. R. M. MacCallum, A. C. R. Martin, J. M. Thornton, Journal of Molecular<br />
Biology, 1996, 262, 732.<br />
12. R. Ghai, P. Waters, L. T. Roumenina, M. Gadjeva, M. S. Kojouharova, K.<br />
B. Reid, R. B. Sim, U. Kishore, Immunobiology, 2007, 212, 253.<br />
13. A. J. Tenner, M. I. Fonseca, Advances in Experimental Medicine and<br />
Biology, 2006, 586, 153.<br />
14. L. Truedsson, A. A. Bengtsson, G. Sturfelt, Autoimmunity, 2007, 40, 560.<br />
15. H. Zanjani, C. E. Finch, C. Kemper, J. Atkinson, D. McKeel, J. C. Morris, J.<br />
L. Price, Alzheimer Disease & Associated Disor<strong>de</strong>rs, 2005, 19, 55.<br />
16. J. E. Butler, L. Ni, R. Nessler, K. S. Joshi, M. Suter, B. Rosenberg, J. Chang,<br />
W.R.Brown, L.A. Cantarero, Journal of Immunological Methods, 1992, 150, 77.<br />
17. E. Potlukova, P. Kralikova, Scandinavian Journal of Immunology, 2008,<br />
67, 423.<br />
18. L. Al<strong>de</strong>righi, P. Gans, A. Ienco, D. Peters, A. Sabatini. A. Vacca,<br />
Coordination Chemistry Reviews, 1999, 184, 311.<br />
19. G.A. Parks, Chemical Reviews, 1965, 65, 177.<br />
20. A. Carré, F. Roger, C. Varinot, Journal of Colloid and Interface Science,<br />
1992, 154, 174.<br />
21. A. Carré, V. Lacarrière, W. Birch, Journal of Colloid and Interface Science,<br />
2003, 260, 49<br />
22. J.A. Kiernan, Microscopy Today, 1999, 99, 22.<br />
23. E. Metwalli, D. Haines, O. Becker, S. Conzone, C. G. Pantano, Journal of<br />
Colloid and Interface Science, 2006, 298, 825.
THE INFLUENCE OF SOLID SURFACE ON THE ADSORPTION …<br />
24. E.F. Vansant, P. Van <strong>de</strong>r Voort, K.C. Vranken, „Characterization and<br />
Chemical Modification of the Silica”, in: Studies in Surface Science and<br />
Catalysis, Vol. 93, Elsevier, Amsterdam, 1995.<br />
25. A. Liebmann-Vinson, L. M. Lan<strong>de</strong>r, M. D. Foster, W. J. Brittain, E. A.<br />
Vogler, C. F. Majkrzak, S. Satija, Langmuir, 1996, 12, 2256.<br />
26. M. Tomoaia-Cotisel, A. Tomoaia-Cotisel, T. Yupsanis, Gh. Tomoaia, I.<br />
Balea, A. Mocanu, Cs. Racz, Revue Roumaine <strong>de</strong> <strong>Chimie</strong>, 2006, 51, 1181.<br />
27. M. Tomoaia-Cotisel, in: M. Zaharescu, E. Burzo, L. Dumitru, I. Kleps, D.<br />
Dascalu (Eds.), „Convergence of Micro-Nano-Biotechnologies”, Romanian<br />
Aca<strong>de</strong>my Press, Bucharest, 2006, pp. 147-161.<br />
28. X. Wang, Y. Wang, H. Xu, H. Shan, J. R. Lu, Journal of Colloid and<br />
Interface Science, 2008, 323, 18.<br />
29. E. W. Silverton, M. A. Navia, D. R. Davies, Proceedings of the National<br />
Aca<strong>de</strong>my of Sciences of the USA, 1977, 74, 5140.<br />
30. J. Deisenhofer, Biochemistry, 1981, 20, 2361.<br />
31. M. Marquart, J. Deisenhofer, R. Huber, W. Palm, Journal of Molecular<br />
Biology, 1980, 141, 369.<br />
32. A. Toscano, M. M. Santore, Langmuir, 2006, 22, 2588.<br />
33. P. Cacciafesta, A.D.L. Humphris, K. D. Jandt, M. J. Miles, Langmuir, 2000,<br />
16, 8167.<br />
34. K. L. Marchin, C. L. Berrie, Langmuir, 2003, 19, 9883.<br />
35. H. X. You and C. R. Lowe, Journal of Colloid and Interface Science, 1996,<br />
182, 586.<br />
36. J. Buijs, W. Nor<strong>de</strong>, J. W. T. Lichtenbelt, Langmuir 1996, 12, 1605.<br />
37. J. Buijs, P. A. W. van <strong>de</strong>n Berg, J. W. T. Lichtenbelt, W. Nor<strong>de</strong>, J.<br />
Lyklema, Journal of Colloid and Interface Science, 1996, 178, 594.<br />
38. F. Fogolari, R. Ugolini, H. Molinari, P. Viglino, G. Esposito, European<br />
Journal of Biochemistry, 2000, 267, 4861.<br />
39. J. Zhou, H.-K. Tsao, Y.-J. Sheng, S. Jiang, Journal of Chemical Physics,<br />
2004, 121, 1050.<br />
40. O. Seitz, M. M. Chehimi, E. Cabet-Deliry, S. Truong, N. Felidj, C. Perruchot, S.<br />
J. Greaves, J. F. Watts, Colloids and Surfaces A: Physicochemical and<br />
Engineering Aspects, 2003, 218, 225.<br />
41. J.A. Kiernan, “Histological and Histochemical Methods”, 3rd ed.<br />
Butterworth-Heinemann, Oxford, 1999.<br />
42. O. Horovitz, Gh. Tomoaia, A. Mocanu, T. Yupsanis, M. Tomoaia-Cotisel,<br />
Gold Bulletin, 2007, 40(4), 295.<br />
163
STUDIA UNIVERSITATIS BABES-BOLYAI, CHEMIA, LIV, 1, 2009<br />
Dedicated to Professor Liviu Literat, at his 80 th anniversary<br />
NO2 DISPERSION PROCESS SIMULATION IN URBAN<br />
AREAS BY ANALITICAL-EXPERIMENTAL METHODS<br />
DANA SILAGHI-PERJU a , HARIETA PÎRLEA b , GHEORGHIłA<br />
JINESCU c , GABRIELA-ALINA DUMITREL b , DELIA PERJU b<br />
ABSTRACT. In the current global context when the accent on environmental<br />
pollution problems are more and more pressing, the study of nitrogen dioxi<strong>de</strong><br />
emissions reduction possibilities as well as the mo<strong>de</strong>lling ways of the<br />
phenomenon that accompany the dispersion of this pollutant in its cycle in<br />
nature is current and of a particular importance. According to this approach, in<br />
the paper is presented a simulation method of nitrogen dioxi<strong>de</strong> pollution level<br />
in a certain reference point. The contribution of each pollution source at the<br />
global pollution in that point is also specified.<br />
Keywords: atmospheric pollution, NO2 dispersion process, mo<strong>de</strong>lling,<br />
simulation<br />
INTRODUCTION<br />
It was <strong>de</strong>termined that large cities are subjected to a higher <strong>de</strong>gree<br />
of air pollution due to industrial activities, traffic and heating systems.<br />
Timişoara is a city that belongs to this category. Therefore, knowing the level<br />
of pollution, and, more precisely, the origin of pollution, is highly important for<br />
finding ways to reduce or counteract the negative effects that it induces.<br />
In the following paper, simulation at a certain reference point of the<br />
pollution level by nitrogen dioxi<strong>de</strong> is carried out, stating the percentage<br />
share held by each pollution source taken into consi<strong>de</strong>ration. In or<strong>de</strong>r to do<br />
this, concentrations of nitrogen dioxi<strong>de</strong> were estimated at a certain reference<br />
point coming from: micro power plants, the two thermal power plants in<br />
a Universitatea POLITEHNICA din Timişoara, <strong>Facultatea</strong> <strong>de</strong> <strong>Inginerie</strong> Mecanică, Blv. Mihai Viteazu,<br />
Nr. 1RO-300222 Timişoara, Romania, dsilaghi@mec.upt.ro<br />
b Universitatea POLITEHNICA din Timişoara, <strong>Facultatea</strong> <strong>de</strong> <strong>Chimie</strong> Industrială <strong>şi</strong> Ingineria Mediului,<br />
PiaŃa Victoriei, Nr. 2, RO-300006 Timişoara, Romania, harieta.pirlea@chim.upt.ro<br />
c Universitatea Politehnica Bucureşti, <strong>Facultatea</strong> <strong>de</strong> <strong>Chimie</strong> Aplicată <strong>şi</strong> ŞtiinŃa Materialelor,<br />
Str. Polizu, Nr. 1, RO-011061 Bucureşti, Romania, jinescu_gheorghita@yahoo.com
D. SILAGHI-PERJU, H. PÎRLEA, G. JINESCU, G. A. DUMITREL, D. PERJU<br />
Timişoara and road traffic. The reference point chosen in the study was set<br />
in the center of the town, on Mihai Viteazul Boulevard, at the headquarters<br />
of the Environmental Protection Agency Monitoring Laboratory Timişoara.<br />
This point was chosen due to the fact that here there have been ma<strong>de</strong><br />
measurements of the concentrations of nitrogen dioxi<strong>de</strong> by the Environmental<br />
Protection Agency Timişoara, and the values obtained, based on sets of<br />
mathematical mo<strong>de</strong>ls, were compared with the latter.<br />
RESULTS AND DISCUSSION<br />
In or<strong>de</strong>r to simulate the NO2 dispersion processes in the urban area,<br />
the emissions coming from stationary and mobile sources were consi<strong>de</strong>red.<br />
The stationary sources which were taken into account for this<br />
study are: micro power plants, and the city’s two thermal power plants, CET<br />
Center and CET South. In the present paper, the generic “micro power<br />
plant” refers to the following sources of heat:<br />
⇒ resi<strong>de</strong>ntial micro power plants - providing heat for homes,<br />
⇒ small capacity industrial plants – providing heat in the industrial sector,<br />
⇒ stoves that operate with gas.<br />
The simplified assumptions used for the NO2 emission estimation coming<br />
from micro power plants are:<br />
- micro power plants were treated as 5 stationary point sources of<br />
pollution;<br />
- all micro power plants were consi<strong>de</strong>red to be of medium class,<br />
without filters, having a 90% efficiency (Hermann type);<br />
The algorithm used in the calculus of NO2 emissions coming from<br />
micro power plants is presented in the Figure 1 [1]:<br />
Figure 1. Algorithm used in the calculus of NO2 emissions coming from micro<br />
power plants.<br />
166
NO2 DISPERSION PROCESS SIMULATION IN URBAN AREAS …<br />
As concern the estimation of NO2 emission coming from the two<br />
thermal power plants of the city, the simplified assumptions were:<br />
- CET Center and CET South were studied as two stationary point<br />
sources of pollution;<br />
- The NO2 emission for each thermal power plant was calculated<br />
as the sum of NO2 emissions coming from all power plant boilers.<br />
The data coming from Colterm Timisoara, were generated according<br />
to the Romanian standards by EMPOL software [2-7].<br />
The values of NO2 emissions coming from the micro power plants<br />
and the two thermal power plants of the city were used in the Gaussian<br />
mo<strong>de</strong>l [8,9] in or<strong>de</strong>r to compute, in the reference point, the concentrations<br />
of nitrogen dioxi<strong>de</strong> emissions from the stationary sources for each day of<br />
the months: January, April, July and October 2004.<br />
As a result of these data, there have been performed monthly<br />
averages, as presented in Table 1.<br />
Month<br />
Table 1. Concentrations of NO2 at the reference point, from the 7 stationary<br />
sources [µg/m 3 ]<br />
Conc. <strong>de</strong>rived from micro power plants<br />
Conc. <strong>de</strong>rived from<br />
Cet’s<br />
North South East West Center CET CenterCET South<br />
NO2 total<br />
conc<br />
01 1.02E+001.17E-02 1.83E-02 1.03E+00 1.45E+00 3.49E+00 4.55E-02 7.06E+00<br />
04 7.22E-106.96E-02 2.88E-02 9.33E-02 4.99E-05 4.92E-01 1.06E-02 0.69E+00<br />
07 1.75E-091.27E-02 1.79E-03 1.08E-01 5.39E-06 1.65E-03 5.34E-04 0.13E+00<br />
10 5.51E-094.61E-01 2.65E-01 2.44E-01 7.64E-04 1.12E+00 0.00E+00 2.09E+00<br />
It has been <strong>de</strong>termined that, at the reference point, the highest<br />
value of the concentration of nitrogen dioxi<strong>de</strong> <strong>de</strong>rived from stationary<br />
sources has been recor<strong>de</strong>d in January. Of the stationary sources, CET<br />
Center is the source with the largest share of pollution in the city center.<br />
CET South has an almost undistinguishable influence, and, out of the micro<br />
power plants, the biggest influences have those situated in Centre and<br />
Western part of the town.<br />
In Figure 2 a), b), c) and d), the percentage share that each of the 7<br />
sources of pollution by nitrogen dioxi<strong>de</strong> at the reference point is shown,<br />
<strong>de</strong>rived from stationary sources.<br />
167
168<br />
49.40<br />
D. SILAGHI-PERJU, H. PÎRLEA, G. JINESCU, G. A. DUMITREL, D. PERJU<br />
January<br />
0.64<br />
Mi<br />
14.49 0.17<br />
20.50<br />
0.26<br />
14.55<br />
micro north micro south micro east micro west<br />
micro center CET center CET south<br />
1.32 0.00<br />
0.43<br />
0.00<br />
86.63<br />
70.84<br />
April<br />
1.53<br />
0.00 10.03<br />
4.15<br />
13.44<br />
0.01<br />
micro north micro south micro east micro west<br />
micro center CET center CET south<br />
a) b)<br />
July<br />
10.19 1.43<br />
micro north micro south micro east micro west<br />
micro center CET center CET south<br />
53.54<br />
October<br />
0.00<br />
0.04<br />
22.04<br />
11.68<br />
12.70<br />
micro north micro south micro east micro west<br />
micro center CET center CET south<br />
c) d)<br />
Figure 2. The percentage share held by each of the 7 stationary<br />
pollution sources with nitrogen dioxi<strong>de</strong>.<br />
From Figure 2, it can be noted that in the months in which temperatures<br />
require the operation of the two thermal power plants, the largest share of<br />
pollution from the stationary sources comes from CET Center. The<br />
influence of the second thermal power plant is not significant because it is<br />
located outsi<strong>de</strong> the city and the prepon<strong>de</strong>rant direction of the wind in<br />
Timişoara is not towards the reference point taken into account.<br />
By mobile sources one can un<strong>de</strong>rstand all motorized means of<br />
transport, noted generically by “road traffic”. The parameters nee<strong>de</strong>d to<br />
calculate the concentration of nitrogen dioxi<strong>de</strong> at the reference point taken<br />
into account from mobile sources are:<br />
• the quantitative emission of nitrogen dioxi<strong>de</strong> coming from road<br />
traffic. In or<strong>de</strong>r to establish the value of this emission, it was consi<strong>de</strong>red that all<br />
of Timişoara’s fleet and the transiting vehicles are equipped with EURO 3.
NO2 DISPERSION PROCESS SIMULATION IN URBAN AREAS …<br />
The current legislation provi<strong>de</strong>s that for cars equipped with EURO 3 the<br />
NO2 emission standard is 0.5 [g/Km] [10].<br />
• dispersion area volume. Since the emission standard estimated by<br />
specialized laws is expressed in [g/Km], it was necessary to establish an area<br />
of dispersion having a 1 Km length. It is known that the sensor for the analysis<br />
and <strong>de</strong>tection of nitrogen dioxi<strong>de</strong> is located at a height of 3 m. The <strong>de</strong>vice with<br />
which the measurements were ma<strong>de</strong> belongs to the Environmental Protection<br />
Agency Timişoara and it is located insi<strong>de</strong> its Monitoring Laboratory. The width<br />
of the road in this area of the city is 15 m. Therefore, the area of dispersion is<br />
located on Mihai Viteazul Boulevard, also the site of the reference point taken<br />
into account, and has the following characteristics: length - 1 Km, width – 15<br />
m, height – 3 m, thus the volume of dispersion is 45 000 m 3 .<br />
• the number of cars transiting the dispersion area taken into<br />
account in the time required the sensor to sample for an analysis. The<br />
sensor’s time sequence is 60 s.<br />
In or<strong>de</strong>r to estimate the concentrations of nitrogen dioxi<strong>de</strong> emissions<br />
coming from mobile sources (road traffic) at the point of reference the<br />
relation (1) [8] was used:<br />
where:<br />
6<br />
N ⋅10<br />
Cr<br />
= ⋅ n<br />
(1)<br />
V<br />
Cr – the concentration of NO2 in the reference point coming from traffic,<br />
[µg/m 3 ]<br />
N – the European emission standard, [g / km], N = 0.5 g / km<br />
V – volume of the dispersion area, [m 3 ], consi<strong>de</strong>red 45 000 m 3 ,<br />
n – number of mobile sources [pcs].<br />
The algorithm presented above was applied for the same months of<br />
2004, as in the case of stationary sources. Out of the values obtained, monthly<br />
averages were ma<strong>de</strong> of the concentrations of nitrogen dioxi<strong>de</strong> emissions<br />
from mobile sources (road traffic), and these are presented in Table 2. In<br />
calculating these values, the number of mobile sources was chosen according<br />
to the traffic specific of each month.<br />
Table 2. Concentrations of NO2 at the reference point, coming from road traffic<br />
Month Number of mobile sources/time<br />
sequence [pcs]<br />
Concentrations of NO2 at the<br />
reference point, coming from road<br />
traffic [µg/m 3 ]<br />
January 6.5 72.22<br />
April 4 44.44<br />
July 2.25 25.00<br />
October 3 33.33<br />
169
170<br />
D. SILAGHI-PERJU, H. PÎRLEA, G. JINESCU, G. A. DUMITREL, D. PERJU<br />
One can notice that the concentrations values of nitrogen dioxi<strong>de</strong><br />
coming from road traffic at the reference point are consi<strong>de</strong>rably higher than<br />
from those coming from stationary sources.<br />
The simulation of the pollution process by nitrogen dioxi<strong>de</strong> in the<br />
city of Timişoara, at a given point of reference, is done by estimating the<br />
concentrations of nitrogen dioxi<strong>de</strong> at that point of reference - <strong>de</strong>scribed at<br />
the beginning of this paper, coming from stationary and mobile sources. For<br />
this, the balance equation was <strong>de</strong>rived for this pollutant:<br />
where:<br />
C ref = C1<br />
+ C2<br />
+ C3<br />
+ C4<br />
+ C5<br />
+ C6<br />
+ C7<br />
+ Cr<br />
(2)<br />
Cref – total concentration of nitrogen dioxi<strong>de</strong> in the reference point, [µg/m 3 ].<br />
C1, C2, C3, C4, C5 – NO2 concentration in the reference point resulted from<br />
the north, south, east, west and center microplants [µg/m 3 ].<br />
C6, C7 – NO2 concentration in the reference point resulting from the Center<br />
CET and South CET, [µg/m 3 ].<br />
Cr – NO2 concentration in the reference point resulting from the road traffic,<br />
[µg/m 3 ]<br />
The total concentration of nitrogen dioxi<strong>de</strong> at the point of reference<br />
for the months taken into consi<strong>de</strong>ration, calculated using a mathematical<br />
mo<strong>de</strong>l [8] is presented in Table 3.<br />
Table 3. The nitrogen dioxi<strong>de</strong> concentrations values at the given global reference point<br />
Month NO2 concentration in<br />
the reference point<br />
resulting from the<br />
stationary sources<br />
[µg/m 3 ]<br />
NO2 concentration in the<br />
reference point resulting<br />
from the road traffic<br />
[µg/m 3 ]<br />
NO2 concentration in the<br />
reference point [µg/m 3 ]<br />
January 7.06 72.22 79.28<br />
April 0.70 44.44 45.14<br />
July 0.13 25.00 25.13<br />
October 2.09 33.33 35.42<br />
Comparing the influence of stationary and mobile sources on<br />
nitrogen dioxi<strong>de</strong> pollution at the given reference point, it has been<br />
<strong>de</strong>termined that mobile sources have an overwhelming weight in relation to<br />
the stationary ones (> 90%). In Figure 3 the share of stationary and mobile<br />
sources at NO2 pollution globally at the given reference point is presented.
NO2 DISPERSION PROCESS SIMULATION IN URBAN AREAS …<br />
Influence of stationary and mobile sources on Influence of stationary and mobile sources on<br />
nitrogen dioxi<strong>de</strong> pollution at the given reference nitrogen dioxi<strong>de</strong> pollution at the given reference<br />
point - January<br />
point - April<br />
91%<br />
9%<br />
Stationary sources Mobile sources<br />
Influence of stationary and mobile sources on<br />
nitrogen dioxi<strong>de</strong> pollution at the given reference<br />
point -July<br />
0%<br />
100%<br />
Stationary soures Mobile sources<br />
98%<br />
2%<br />
Stationary sources Mobile sources<br />
Influence of stationary and m obile sources on<br />
nitrogen dioxi<strong>de</strong> pollution at the given reference<br />
point -O ctober<br />
94%<br />
6%<br />
Stationary sources Mobile sources<br />
Figure 3. The share of stationary and mobile sources at NO2 pollution<br />
at the reference point.<br />
From the graph, one can notice that, in April and July, the stationary<br />
sources have a negligible influence on nitrogen dioxi<strong>de</strong> pollution in the town<br />
center.<br />
Testing the mathematical mo<strong>de</strong>l accuracy has been achieved by<br />
comparing the results obtained by applying the mo<strong>de</strong>l with the experimental<br />
ones, provi<strong>de</strong>d by the Environmental Protection Agency Timişoara (Table 4).<br />
Month Measured NO2<br />
concentration in the<br />
Table 4. Mathematical mo<strong>de</strong>l testing<br />
reference point [µg/m 3 ]<br />
Calculated NO2 concentration<br />
in the reference point [µg/m 3 ]<br />
Relative error,<br />
%<br />
January 81.48 79.28 2.70<br />
April 50.00 45.14 9.72<br />
July 28.11 25.13 10.60<br />
October 31.23 35.42 -13.42<br />
171
172<br />
D. SILAGHI-PERJU, H. PÎRLEA, G. JINESCU, G. A. DUMITREL, D. PERJU<br />
The small differences between the results as well as the values of<br />
relative errors confirm that the case study presented in this paper was<br />
properly addressed and the <strong>de</strong>veloped mathematical mo<strong>de</strong>ls characterize<br />
well enough the processes that accompany the NO2 pollution phenomenon<br />
from Timisoara city.<br />
CONCLUSIONS<br />
At studied reference point, the major influence on nitrogen dioxi<strong>de</strong><br />
pollution is held by mobile sources. The share of this pollution is >90%.<br />
Regarding the stationary sources, the largest share of nitrogen<br />
dioxi<strong>de</strong> pollution is held by the micro power plants from the city center and<br />
CET Center.<br />
By comparing the results of the mathematical mo<strong>de</strong>l characterizing<br />
the global pollution with nitrogen dioxi<strong>de</strong> with the experimental data, one<br />
can notice a good conformity between them, thus proving that the case<br />
study has been properly addressed.<br />
REFERENCES<br />
1. H. Pîrlea, D. Silaghi-Perju, D. Perju, C. Rusnac, Revista <strong>de</strong> chimie, 2006,<br />
57(7), 743.<br />
2. OrdonanŃă <strong>de</strong> urgenŃă nr. 152 din 10 noiembrie 2005 privind prevenirea <strong>şi</strong><br />
controlul integrat al poluării, 2005.<br />
3. Hotărâre Nr. 541 din 17 mai 2003 privind stabilirea unor măsuri pentru<br />
limitarea emisiilor în aer ale anumitor poluanŃi proveniŃi din instalaŃii mari <strong>de</strong><br />
ar<strong>de</strong>re - cu modificările aduse <strong>de</strong>: Hotărârea Guvernului nr. 322/2005 <strong>şi</strong><br />
Hotărârea Guvernului nr. 1502/2006.<br />
4. Anexa la ordinul 462/1993 - metodologia <strong>de</strong> <strong>de</strong>terminare a poluantilor<br />
atmosferici produsi <strong>de</strong> surse stationare, Institutul <strong>de</strong> Cercetari si Ingineria<br />
Mediului - Splaiul In<strong>de</strong>pen<strong>de</strong>ntei nr. 294, sector 6, Bucuresti.<br />
5. Ordinul Nr. 462 din 1 iulie 1993 pentru aprobarea Conditiilor tehnice privind<br />
protectia atmosferei si Normelor metodologice privind <strong>de</strong>terminarea<br />
emisiilor <strong>de</strong> poluanti atmosferici produsi <strong>de</strong> surse stationare.<br />
6. Colterm Timişoara, “Manual pentru centrale mari”, metodologie internă, 1992.<br />
7. Directiva europeană privitoare la emisiile <strong>de</strong> gaze poluante (NOx <strong>şi</strong> SOx)<br />
din termocentrale – Large Combustion Plant (LPC) Directive (2001/80/EC),<br />
Official Journal of the European Union, 2001, L. 309, 27/11/2001, 1.<br />
8. D. Perju, H. Pîrlea, G.A. Brusturean, D. Silaghi-Perju, S. Marinescu,<br />
Revista <strong>de</strong> chimie, 2008, 59 (10), 1112.<br />
9. H. Pirlea, G.A. Brusturean, D. Silaghi Perju, D. Perju, Chem. Bull.<br />
“Politehnica” Univ. Timişoara, 2008, 53(67), 244.<br />
10. Directiva 98/69/EC a Parlamentului <strong>şi</strong> Consiliului European din 13 Octombrie<br />
1998 privind măsurile măsurile ce trebuie luate împotriva poluării aerului cu<br />
emisii provenite <strong>de</strong> la autovehicule. Modifică Directiva Consiliului 70/220/EEC.
STUDIA UNIVERSITATIS BABES-BOLYAI, CHEMIA, LIV, 1, 2009<br />
Dedicated to Professor Liviu Literat, at his 80 th anniversary<br />
CLUJ POLYNOMIAL DESCRIPTION OF TIO2<br />
NANOSTRUCTURES<br />
ANIELA ELENA VIZITIU a AND MIRCEA V. DIUDEA a<br />
ABSTRACT. Operations on maps are well known theoretical tools for<br />
transforming a given polyhedral tessellation. In this article, we propose a<br />
new method to <strong>de</strong>sign a titanium nanostructure. To <strong>de</strong>scribe the topology<br />
of such structures, we applied Cluj counting polynomial.<br />
Keyords: TiO2 nanostructures, molecular <strong>de</strong>sign, polynomial <strong>de</strong>scription<br />
INTRODUCTION<br />
After the discovery of carbon nanotubes many researchers addressed<br />
the question about the possible existence of nanotubular forms of other<br />
elements and they tried to obtain inorganic nanostructures [1-3]. Among<br />
numerous oxi<strong>de</strong> nanostructures, the titanium nanotubular materials are of<br />
high interest due to their chemical inertness, endurance, strong oxidizing<br />
power, large surface area, high photocatalytic activity, non-toxicity and low<br />
production cost. The application of TiO2 nanotubes to photocatalysis, in solar<br />
cells, as nanoscale materials for lithium-ion batteries and as gas-sensing<br />
material was discussed in the literature [4–10]. The nanotubes (TiO2) were<br />
synthesized using various precursors [11–17], carbon nanotubes, porous<br />
alumina or polymer membranes as templates [8–24], fabrication by anodic<br />
oxidation of Ti [25–27], sol–gel technique [28–32] and sonochemical<br />
synthesis [33]. Mo<strong>de</strong>ls of possible growth mechanisms of titanium nanotubes<br />
are discussed [16, 17, 32] but the <strong>de</strong>tails of the atomic structure of the<br />
nanotube walls and their stacking mo<strong>de</strong> are unknown. TiO2 NTs are<br />
semiconductors with a wi<strong>de</strong> band gap and their stability increases with<br />
increasing of their diameters. The numerous studies for the use of nanotubular<br />
titania in technological applications require a lot of theoretical studies of<br />
stability and other properties of such structures. Theoretical studies on the<br />
a Universitatea Babeş-Bolyai, <strong>Facultatea</strong> <strong>de</strong> <strong>Chimie</strong> <strong>şi</strong> <strong>Inginerie</strong> <strong>Chimică</strong>, Str. Kogălniceanu,<br />
Nr. 1, RO-400084 Cluj-Napoca, Romania, diu<strong>de</strong>a@chem.ubbcluj.ro
174<br />
ANIELA ELENA VIZITIU AND MIRCEA V. DIUDEA<br />
stability and electronic characteristics of TiO2 nanostructures were presented<br />
in ref. [34, -36]. In the present paper we report a new method to <strong>de</strong>sign<br />
TiO2 nanostructures using map operations, and then we <strong>de</strong>scribe their<br />
topology by the Cluj polynomial.<br />
RESULTS AND DISCUSSION<br />
Mo<strong>de</strong>ls and computational method<br />
The titanium nanostructures can be achieved by map operations:<br />
the sequence consists of Du[Med(M )], applied on the polyhex tori or tubes<br />
(Figure 1).<br />
(a) Du[Med(TUH(8,8))]<br />
(b) Du[Med(H832)]<br />
Figure 1. TiO2 nanotube (a) and nanotorus (b).<br />
A map M is a combinatorial representation of a (closed) surface [37,38].<br />
Several transformations (i.e., operations) on maps are known and used for<br />
various purposes.<br />
Let us <strong>de</strong>note in a map: v – the number of vertices, e - the number<br />
of edges, f – the number of faces and d – the vertex <strong>de</strong>gree. A subscript “0”<br />
will mark the corresponding parameters in the parent map.<br />
Recall some basic relations in a map:<br />
∑ d vd<br />
= 2 e<br />
(1)<br />
∑ s f s = 2 e<br />
(2)<br />
where vd and fs are the number of vertices of <strong>de</strong>gree d and number of sgonal<br />
faces, respectively.
CLUJ POLYNOMIAL DESCRIPTION OF TIO2 NANOSTRUCTURES<br />
Medial Me<br />
Medial is achieved by putting new vertices in the middle of the<br />
original edges [38]. Join two vertices if the edges span an angle (and are<br />
consecutive within a rotation path around their common vertex in M).<br />
Medial is a 4-valent graph and Me(M) = Me(Du(M)), as illustrated in Figure<br />
2. The transformed map parameters are:<br />
Me(M): 0 e<br />
v = ; e = 2e0<br />
; f = f 0 + v0<br />
(3)<br />
The medial operation rotates parent s-gonal faces by π/s. Points in<br />
the medial represent original edges, thus this property can be used for<br />
topological analysis of edges in the parent polyhedron. Similarly, the points<br />
in dual give information on the topology of parent faces.<br />
(a) (b)Me[TUH(8,4)] (b)Me[H(8,8)]<br />
Dual Du<br />
Figure 2. Medials of a polyhex nanotube.<br />
The dualization of a map starts by locating a point in the center of<br />
each face. Next, two such points are joined if their corresponding faces<br />
share a common edge. It is the (Poincaré) dual Du(M). The vertices of<br />
Du(M) represent the faces of M and vice-versa [38].<br />
Figure 3. The duals of the Platonic polyhedra.<br />
175
176<br />
ANIELA ELENA VIZITIU AND MIRCEA V. DIUDEA<br />
Figure 4. The dual of medial of a polyhex nanotube.<br />
In the transformed map, the following relations exist:<br />
Du(M): f 0<br />
v = ; 0 e e = ; 0 v f = (4)<br />
Dual of the dual returns the original map: Du(Du(M)) = M.<br />
Tetrahedron is self dual while the other Platonic polyhedra form pairs:<br />
Du(Cube) = Octahedron; Du(Do<strong>de</strong>cahedron) = Icosahedron (Figure 3 ). The<br />
dual of medial of a polyhex nanotube will give a (4(3,6)) net which essentially<br />
correspond to the TiO2 lattice (Figure 4).<br />
Cluj polynomial<br />
Cluj polynomials are <strong>de</strong>fined on the basis of Cluj matrices as:<br />
∑<br />
k<br />
CJ ( G,<br />
x)<br />
= m(<br />
G,<br />
k)<br />
⋅ x<br />
(5)<br />
They count the vertex proximity of the vertex i with respect to any vertex j in<br />
G, joined by an edge {pe,i} (the Cluj-edge polynomials) or by a path {pp,i}<br />
(the Cluj-path polynomials), taken as the shortest (distance DI) or the<br />
longest (<strong>de</strong>tour DE) paths. In Equation (5), the coefficients m(G, k) are<br />
calculated from the entries of Cluj matrices.<br />
The summation runs up to the maximum k = {p}<br />
in G.<br />
CJ ,<br />
A Cluj fragment, [39-43] i,<br />
j p , collects vertices v lying closer to i<br />
than to j, the endpoints of a path p(i,j). Such a fragment collects the vertex<br />
proximity of i against any vertex j, joined by the path p, with the distances<br />
measured in the subgraph D(G-p), as shown in the following equation:<br />
k<br />
{ v v ∈V<br />
G);<br />
D ( i,<br />
v)<br />
< D ( j,<br />
v)<br />
}<br />
CJ i, j,<br />
p ( ( G−<br />
p)<br />
( G−<br />
p)<br />
= (6)
CLUJ POLYNOMIAL DESCRIPTION OF TIO2 NANOSTRUCTURES<br />
In graphs containing rings, more than one path could join the pair (i,<br />
j), resulting in more than one fragment related to i (with respect to j and a<br />
given path p). The entries in the Cluj matrix are taken, by <strong>de</strong>finition, as the<br />
maximum cardinality among all such fragments:<br />
[UCJ] = max CJ<br />
i, j<br />
i, j, p<br />
(7)<br />
p<br />
In trees, due to the unique nature of paths joining any two vertices<br />
CJ i,<br />
j,<br />
p represents the set of paths going to j through i. In this way, the path<br />
p(i,j) is characterized by a single endpoint, which is sufficient for the<br />
unsymmetrical matrix UCJ. When the path p belongs to the set of distances<br />
DI(G), the suffix DI is ad<strong>de</strong>d to the name of matrix, as in UCJDI. When path<br />
p belongs to the set of <strong>de</strong>tours DE(G), the suffix is DE. The Cluj matrices are<br />
<strong>de</strong>fined in any graph and, except for some symmetric graphs, are unsymmetrical<br />
and can be symmetries by the Hadamard multiplication with their transposes:<br />
SMp = UM • (UM) T (8)<br />
If the matrices calculated on edges (i.e., on adjacent vertex pairs)<br />
are required, the matrices calculated from paths must be multiplied by the<br />
adjacency matrix A (which has the non-diagonal entries of 1 if the vertices<br />
are joined by an edge and, otherwise, zero)<br />
SMe = SMp • A (9)<br />
The Cluj polynomials published previously [44] referred to some<br />
partitions of the Cluj matrices given by the layer/shell matrices, and provi<strong>de</strong><br />
no direct interpretation of the counting content.<br />
The polynomial coefficients are counted from the Cluj matrices by<br />
the TOPOCLUJ software program [45] and also by a simple routine for<br />
collecting the entries in the unsymmetrical matrices UCJ. In the case of the<br />
CJDIe polynomial, an orthogonal edge-cutting procedure can be used [46].<br />
The same procedure has been used by Gutman and Klavžar to calculate<br />
the Szeged in<strong>de</strong>x of polyhex graphs [47].<br />
Cluj polynomial in Tio2 nanotori<br />
Cluj polynomial in non-twisted toroidal TiO2 structures is composed<br />
by two terms, according to the proximities at the two ends of the edges (in a<br />
bipartite graph), which are topologically equivalent. Examples and formula<br />
for calculating CJ polynomial are given in Table 1. Observe there is no<br />
difference in CJ polynomial for the two different embeddings: H and V, in<br />
Diu<strong>de</strong>a’s nomenclature [48].<br />
177
178<br />
ANIELA ELENA VIZITIU AND MIRCEA V. DIUDEA<br />
Table 1. Data for the non-twisted toroidal TiO2 structures and analytical<br />
formula of Cluj CJe<br />
Tori H CJe Polynomial ToriV CJe Polynomial<br />
H[10,10] 300x 70 +300x 80<br />
V[10,10] 300x 70 +300x 80<br />
H[10,20] 600x 145 +600x 155 V[10,20] 600x 145 +600x 155<br />
H[8,8] 900x 220 +900x 230<br />
V[10,30] 900x 220 +900x 230<br />
H[12,12] 192x 44 +192x 52 V[10,50] 1500x 370 +1500x 380<br />
H[10,60] 432x 102 +432x 114 V[10,70] 2100x 520 +2100x 530<br />
CONCLUSIONS<br />
e k a e k b<br />
( , )<br />
C J e G x = b a ⋅ x + b b ⋅ x<br />
e = e ⋅ k + ( k −1 ) ⋅(<br />
c / 2)<br />
ka<br />
1<br />
e = e + c<br />
kb ka<br />
( / 2 ) ( / 2 1)<br />
2<br />
e1 c c c<br />
= − ⋅ +<br />
b = 3⋅<br />
c ⋅ n = b = b<br />
k = n / c<br />
a b<br />
A new method for <strong>de</strong>signing TiO2 nanotubular structures, based on<br />
map operations, was proposed. Cluj polynomial <strong>de</strong>scription proved to be a<br />
good tool for searching the topology of a nanostructure, particularly<br />
nanostructures of titania. Omega polynomial <strong>de</strong>scription of such nanostructures<br />
will be presented in a future paper.<br />
ACKNOWLEDGEMENTS<br />
The article is supported by the Romanian Grant PN II, No. 129/2009.<br />
REFERENCES<br />
1. R. Tenne, Chem. Eur. J., 2002, 8, 5296<br />
2. C. N. R. Rao, M. Nath, Dalton Trans. 2003, 1, 1.<br />
3. G. R. Patzke, F. Krumeich, R. Nesper, Angew. Chem., Int. Ed. 2002, 41, 2447.<br />
4. H. Imai, M. Matsuta, K. Shimizu, H. Hirashima, N. Negishi, Solid State<br />
Ionics, 2002, 151, 183.<br />
5. M. Adachi, Y. Murata, I. Okada, S. Yoshikawa, J. Electrochem. Soc. 2003, 150,<br />
G488.<br />
6. Y. Zhou, L. Cao, F. Zhang, B. He, H. Li, J. Electrochem. Soc. 2003, 150, A1246.
CLUJ POLYNOMIAL DESCRIPTION OF TIO2 NANOSTRUCTURES<br />
7. O. K. Varghese, D. Gong, M. Paulose, K. G. Ong, C. A. Grimes, Sens.<br />
Actuators B, 2003, 93, 338.<br />
8. O. K. Varghese, D. Gong, M. Paulose, K. G. Ong, E. C. Dickey, and C. A.<br />
Grimes, Adv. Mater. 2003, 15, 624.<br />
9. C. A. Grimes, K. G. Ong, O. K. Varghese, X. Yang, G. Mor, M. Paulose, E. C.<br />
Dickey, C. Ruan, M. V. Pishko, J. W. Kendig, A. J. Mason, Sensors, 2003, 3, 69.<br />
10. G. K. Mor, M. A. Carvalho, O. K. Varghese, M. V. Pishko, C. A. Grimes, J. Mater.<br />
Res. 2004, 19, 628.<br />
11. T. Kasuga, M. Hiramatsu, A. Hoson, T. Sekino, K. Niihara, Adv. Mater. 1999,<br />
11, 1307.<br />
12. S. Zhang, J. Zhou, Z. Zhang, Z. Du, A.V. Vorontsov, Z. Jin, Chin. Sci. Bull.<br />
2000, 45, 1533.<br />
13. G. H. Du, Q. Chen, R. C. Che, Z. Y. Yuan, L.-M. Peng, Appl. Phys. Lett. 2001,<br />
79, 3702.<br />
14. D.-S. Seo, J.-K. Lee, H. Kim, J. Cryst. Growth , 2001, 229, 428.<br />
15. C.-H. Lin, S.-H. Chien, J.-H. Chao, C.-Y. Sheu, Y.-C. Cheng, Y.-J. Huang,<br />
C.-H. Tsai, Catal. Lett. 2002, 80, 153 .<br />
16. B. D. Yao, Y. F. Chan, X. Y. Zhang, W. F. Zhang, Z. Y. Yang, N. Wang, Appl.<br />
Phys. Lett. 2003, 82, 281.<br />
17. W. Wang, O. K. Varghese, M. Paulose, C. A. Grimes, J. Mater. Res. 2004,<br />
19, 417.<br />
18. J. Sun, L. Gao, Q. Zhang, J. Mater. Sci. Lett. 2003, 22, 339.<br />
19. P. Hoyer, Langmuir, 1996, 12, 1411<br />
20. H. Imai, Y. Takei, K. Shimizu, M. Matsuda, H. Hirashima, J. Mater. Chem.<br />
1999, 9, 2971.<br />
21. S. M. Liu, L. M. Gan, L. H. Liu, W. D. Zhang, H. C. Zeng, Chem. Mater.<br />
2002, 14, 1391.<br />
22. Y.-L. Shi, X.-G. Zhang, H.-L. Li, Mater. Sci. Engin. A, 2002, 333, 239.<br />
23. X. H. Li, W. M. Liu, H. L. Li, Appl. Phys. A, 2003, 80, 317.<br />
24. T. Peng, H. Yang, G. Chang, K. Dai, K. Hirao, Chem. Lett. 2004, 33, 336.<br />
25. D. Gong, C. A. Grimes, O. K. Varghese, W. Hu, R. S. Singh, Z. Chen, E. C.<br />
Dickey, J. Mater. Res. 2001, 16, 3331.<br />
26. O. K. Varghese, D. Gong, M. Paulose, C. A. Grimes, E. C. Dickey, J. Mater.<br />
Res. 2003, 18, 156.<br />
27. G. K. Mor, O. K. Varghese, M. Paulose, N. Mukherjee, C. A. Grimes, J. Mater.<br />
Res. 2003, 18, 2588.<br />
28. B. B. Lakshmi, P. K. Dorhout, and C. R. Martin, Chem. Mater. 1997, 9, 857.<br />
29. T. Kasuga, M. Hiramatsu, A. Hoson, T. Sekino, K. Niihara, Langmuir, 1998,<br />
14, 3160.<br />
30. S. Kobayashi, K. Hanabusa, N. Hamasaki, M. Kimura, H. Shirai, Chem. Mater.<br />
2000, 12, 1523.<br />
31. M. Zhang, Y. Bando, K. Wada, J. Mater. Sci. Lett. 2001, 20, 167.<br />
32. Y. Q. Wang, G. Q. Hu, X. F. Duan, H. L. Sun, Q. K. Xue, Chem. Phys. Lett.<br />
2002, 365, 427.<br />
33. Y. Zhu, H. Li, Y. Koltypin, Y. R. Hacohen, A. Gedanken, Chem. Commun.<br />
2003, 2616.<br />
179
180<br />
ANIELA ELENA VIZITIU AND MIRCEA V. DIUDEA<br />
34. V. V. Ivanovskaya, A. N. Enyashin, A. L. Ivanovskii, Men<strong>de</strong>leev Comm. 2003,<br />
13, 5.<br />
35. V. V. Ivanovskaya, A. N. Enyashin, A. L. Ivanovskii, Russ. J. Inorg. Chem.<br />
2004, 49, 1.<br />
36. A. N. Enyashin, G. Seifert, Phys. Stat. Sol. 2005 , 242, 7, 1361.<br />
37. P. W. Fowler and T. Pisanski, J. Chem. Soc. Faraday Trans., 1994, 90, 2865.<br />
38. T. Pisanski and M. Randić, in Geometry at Work, (Ed. C. A. Gorini) M. A.<br />
A. Notes, 2000, 53, 174.<br />
39. M.V. Diu<strong>de</strong>a, I. Gutman, L. Jäntschi, Molecular Topology. Nova Science,<br />
Huntington, New York, 2001.<br />
40. M. V. Diu<strong>de</strong>a, Cluj Matrix Invariants. J. Chem. Inf. Comput. Sci. 1997, 37, 300.<br />
41. M. V. Diu<strong>de</strong>a, B. Parv, I. Gutman, Detour-Cluj Matrix and Derived Invariants.<br />
J. Chem. Inf. Comput. Sci. 1997, 37, 1101.<br />
42. M. V. Diu<strong>de</strong>a, G. Katona, I. Lukovits, N. Trinajstić, Detour and Cluj-Detour<br />
Indices. Croat. Chem. Acta, 1998, 71, 459.<br />
43. D. Opris, M. V. Diu<strong>de</strong>a, Pepti<strong>de</strong> Property Mo<strong>de</strong>ling by Cluj Indices.<br />
SAR/QSAR Environ. Res. 2001, 12, 159.<br />
44. M. V. Diu<strong>de</strong>a, Cluj Polynomials. Studia Univ. “Babes-Bolyai”, 2002, 47, 131.<br />
45. O. Ursu, M. V. Diu<strong>de</strong>a, TOPOCLUJ software program, Babes-Bolyai<br />
University, Cluj, 2005; Available, on line at http://chem.ubbcluj.ro/~diu<strong>de</strong>a.<br />
46. M. V. Diu<strong>de</strong>a, A. E. Vizitiu, D. Janežič, Cluj and related polynomials applied<br />
in correlating studies, J. Chem. Inf. Mo<strong>de</strong>l., 2007, 47(3), 864.<br />
47. I. Gutman, S. Klavzar, An Algorithm for the Calculation of the Szeged In<strong>de</strong>x of<br />
Benzenoid Hydrocarbons. J. Chem. Inf. Comput. Sci. 1995, 35, 1011.<br />
48. M. V. Diu<strong>de</strong>a, in: M. V. Diu<strong>de</strong>a, Ed., Nanostructures-Novel Architecture,<br />
NOVA, New York, 2005, 111.
STUDIA UNIVERSITATIS BABES-BOLYAI, CHEMIA, LIV, 1, 2009<br />
Dedicated to Professor Liviu Literat, at his 80 th anniversary<br />
WATER ACTIVITY – INDICATOR OF FOOD SAFETY AND<br />
THE FACTORS THAT INFLUENCE THE BIOCHEMICAL<br />
STABILITY OF SOFT DRINKS<br />
MIREL GLEVITZKY a , DELIA PERJU b , GABRIELA-ALINA<br />
DUMITREL b , MARIA POPA c , MIHAELA LAURA VICĂ a<br />
ABSTRACT. The aim of this paper is to evaluate the water activity value of<br />
different food products, as well as to test the different functional ingredients and<br />
the best preserving conditions that inhibit the <strong>de</strong>velopment of microorganisms in<br />
soft drinks – the analysed products that have the highest aw value. Using the<br />
experimental data, a sensitivity analysis with respect to water activity was<br />
performed. According to this analysis, the paper suggests the using of water<br />
activity value as indicator that ensure the sanitation of soft drinks.<br />
Keywords: water activity, soft drinks, microbiology, HACCP<br />
INTRODUCTION<br />
The moisture of foods is an important factor for the products stability or<br />
shelf-life. The limitations of water content measurement as an indicator of<br />
safety and quality are attributed to differences in the intensity which water<br />
associates with other components in the product [1].<br />
The osmotic pressure of food products can be measured by their water<br />
activity (aw) and is expressed as it follows:<br />
a<br />
w<br />
p ERH[%]<br />
= =<br />
(1)<br />
p 100<br />
0<br />
p – water-vapour pressure above the product surface at the given T<br />
temperature, [N/m 2 ];<br />
a DirecŃia Sanitar-Veterinară <strong>şi</strong> SiguranŃă Alimentară Alba, Str. Lalelelor, Nr. 7A, RO-510217<br />
Alba Iulia, Romania, glevitzky-alba@ansv.ro<br />
b Universitatea POLITEHNICA din Timişoara, <strong>Facultatea</strong> <strong>de</strong> <strong>Chimie</strong> Industrială <strong>şi</strong> Ingineria Mediului,<br />
PiaŃa Victoriei Nr. 2, RO-300006 Timişoara, Romania, alina.brusturean@chim.upt.ro<br />
c Universitatea “1 Decembrie 1918” din Alba Iulia, <strong>Facultatea</strong> <strong>de</strong> ŞtiinŃe, Str. Nicolae Iorga,<br />
Nr. 11-13, RO-510009 Alba Iulia, Romania, mpopa@uab.ro
MIREL GLEVITZKY, DELIA PERJU, GABRIELA-ALINA DUMITREL, MARIA POPA, MIHAELA LAURA VICĂ<br />
p0 – water-vapour pressure above the surface of pure water at the<br />
product temperature, [N/m 2 ].<br />
aw reflects the amount of free water in food products, which is available<br />
to microorganisms for chemical reactions, biochemical reactions, transfer of<br />
metabolites through the cell’s layers [1]. It corresponds to the equilibrium<br />
relative humidity, ERH [%] at the T temperature.<br />
By measuring and controlling the water activity, it is possible to predict<br />
and i<strong>de</strong>ntify the type of microorganism which could be a potential source of<br />
<strong>de</strong>gradation and infection [2, 3].<br />
The biological stability of soft drinks is influenced by: the level of initial<br />
contamination, the chemical composition of the drink, the thermal treatment,<br />
the preservatives adding and the storage temperature [4].<br />
The <strong>de</strong>crease of the water activity value <strong>de</strong>lays the growth of the<br />
microorganisms, it slows down the enzyme catalyzed reactions and eventually<br />
<strong>de</strong>lays the non-enzymatic browning. Another possibility for <strong>de</strong>creasing aw and<br />
thus for increasing the food shelf life is the use of additives with a higher<br />
capacity of keeping the water (sodium, sugar) [1].<br />
Microorganisms <strong>de</strong>velop within large pH limits. When the pH is acid<br />
(values of pH
WATER ACTIVITY – INDICATOR OF FOOD SAFETY …<br />
honey, Price nuts, spices–Mix Vegetal, Cazan pasta, pow<strong>de</strong>r eggs, Mio Delicia<br />
cookies, toast and pow<strong>de</strong>r milk). For each product the aw was <strong>de</strong>termined.<br />
In or<strong>de</strong>r to test the factors that can lead to the <strong>de</strong>crease of the water<br />
activity value, the product with the highest water activity was chosen from the list<br />
of the tested products (the soft drink with fruit content – Fruttia orange nectar).<br />
In or<strong>de</strong>r to test the influence of the ingredients on the water activity, 7<br />
soft drinks with 50% fruit content were prepared. In the composition of the 7<br />
samples, along with 93.12 g/l orange concentrate, respectively <strong>de</strong>ionized<br />
water, the ingredients presented in Table 1 were also ad<strong>de</strong>d:<br />
Table 1. Ingredients used in preparing the soft drinks with 50% fruit content<br />
Sample Ingredients Quantity, g/l<br />
1 (control sample) -<br />
2 Sugar syrup 65 0 Brix 120.22 (crystal sugar 78 g)<br />
3 Fructose 50<br />
4 Lemon concentrate 1.2<br />
5 Citric acid sol. 50% 1.6<br />
6 Sodium benzoate 0.15<br />
7 Potassium sorbate 0.15<br />
The ingredients were ad<strong>de</strong>d un<strong>de</strong>r stirring and pasteurized for 30<br />
seconds at 85 0 C. The each of 7 samples was divi<strong>de</strong>d in 4 fractions that were<br />
bottled in cold conditions in PET bottles. One fraction (which contains the 7<br />
samples) was immediately analyzed after the bottling, t0h, and the others were<br />
kept for 48 hours in closed bottles as it follows: refrigerating (+5 0 C), at room<br />
temperature (+25 0 C) and in a drying oven at +40 0 C. All the samples were<br />
brought before the analyses at the room temperature.<br />
The water activity (aw) was <strong>de</strong>termined with the Aquaspector apparatus<br />
AQS-2-TC [11] and the pH with the ph-metre WTW pH 340i and an<br />
electrochemical cell: Electro<strong>de</strong> SenTix 81. All the analyses were done three<br />
times, the final result being the average of the three analyses.<br />
The yeast and the mould (Y&M) were <strong>de</strong>termined through the following<br />
procedure: 1 mL of analyzed sample was transferred using a pipette into a Petri<br />
plate of 9 cm diameter. 15 ml of cultivation medium Yeast-Glucose-<br />
Chloramphenicol-Agar (Organics) melted and cooled to 45 0 C were poured,<br />
mixing homogenously. Incubation took place at 25 0 ±1 0 C for a period of 3-5 days.<br />
The yeasts and mould colonies grown on the cultivation medium could be easily<br />
<strong>de</strong>tected on the entire surface of the Petri plate. Evaluation: absent/mL [12].<br />
The total bacteria count (TCB) in the soft drinks with fruit content was<br />
calculated by introducing 1 ml of analysed sample into the Petri plate (9 cm in<br />
diameter), on which 12-15 ml of Orange Serum Agar (Merck) culture, melted<br />
and cold at 45 0 C is ad<strong>de</strong>d. The content is mixed up by stirring. The incubation<br />
is done at 30 0 C for 72±2 hours. After incubation period all the colonies growth<br />
on the Petri plate are counted. Evaluation: maximum 30 CFU/ml [13].<br />
183
MIREL GLEVITZKY, DELIA PERJU, GABRIELA-ALINA DUMITREL, MARIA POPA, MIHAELA LAURA VICĂ<br />
The coliform bacteria (Colif.) were <strong>de</strong>termined with the following<br />
procedure: 1 mL sample was transferred to a 9 cm-diameter Petri plate using a<br />
pipette. 12 ml of the cultivation medium Violet red bile lactose agar (VRBL<br />
agar) melted and cooled to 45 0 C were poured, mixing homogenously. After the<br />
complete solidification of cultivation medium, 4 ml VRBL agar was ad<strong>de</strong>d on<br />
the surface of existing medium. Incubation took place at 30 0 ±1 0 C for 24±2<br />
hours. The dark-red colonies with at least 0.5 mm diameter are counted.<br />
Evaluation: absent/mL [14].<br />
RESULTS AND DISCUSSION<br />
The values of the water activity for the studied food products are<br />
presented in Table 2, in a <strong>de</strong>creasing or<strong>de</strong>r of the water activity. This or<strong>de</strong>r<br />
was established on the basis of a qualitative sensitivity analysis [15].<br />
Table 2. Values of the water activity in<strong>de</strong>x for different types of food<br />
No. Food Water activity, aw<br />
1. Fruttia orange nectar 0.951<br />
2. Crimbo bacon 0.942<br />
3. Miacarn salami 0.908<br />
4. Unirea margarine 0.887<br />
5. FCOJ MTra<strong>de</strong> Juice 0.813<br />
6. 000 PF Brudar white flour 0.854<br />
7. Mib Prodcom strawberry jam 0.796<br />
8. Florisa honey 0.688<br />
9. Price nuts 0.639<br />
10. Mix Vegetal spices 0.504<br />
11. Cazan pasta 0.481<br />
12. Pow<strong>de</strong>r eggs 0.427<br />
13. Mio Delicia cookies 0.350<br />
14. Toast 0.336<br />
15. Pow<strong>de</strong>r milk 0.292<br />
The effect of the ingredients used for preparing the soft drinks was<br />
studied both by analysing the physico-chemical parameters: aw and pH (Table 3)<br />
and by microbiological control of the samples (Table 4).<br />
Table 3. The water activity value and the pH of the samples kept in different conditions<br />
aw<br />
pH<br />
Sample<br />
t0 h<br />
+5<br />
t48 h<br />
t48 h<br />
184<br />
0 C +25 0 C +40 0 C<br />
t0 h<br />
+5 0 C +25 0 C +40 0 C<br />
1 0.945 0.947 0.997 0.950 3.802 3.761 3.714 3.608<br />
2 0.934 0.953 0.986 0.980 3.737 3.587 3.612 3.400<br />
3 0.925 0.932 0.983 0.963 3.734 3.694 3.445 3.413<br />
4 0.910 0.916 0.947 0.924 3.387 3.390 3.328 3.232<br />
5 0.907 0.909 0.922 0.913 3.314 3.245 3.293 3.155<br />
6 0.911 0.914 0.918 0.917 3.701 3.640 3.681 3.464<br />
7 0.906 0.910 0.914 0.910 3.694 3.461 3.440 3.406
WATER ACTIVITY – INDICATOR OF FOOD SAFETY …<br />
The physico-chemical analyses performed immediately after<br />
preparation are presented comparatively to the ones carried out after 48<br />
hours of keeping at different temperatures. According to the storage<br />
temperature, we can notice an increase of the aw on the whole, but more<br />
emphasized at the samples kept at the room temperature. The pH values<br />
have a slight ten<strong>de</strong>ncy to <strong>de</strong>crease in time.<br />
Table 4. The result of the microbiological control of the samples kept in different conditions<br />
Sa<br />
mpl<br />
e<br />
t0 h t48 h (+5 0 C) t48 h (+25 0 C) t48 h (+40 0 C)<br />
Y&M TCB Colif. Y&M TCB Colif. Y&M TCB Colif. Y&M TCB Colif.<br />
1 >1000 >300 Abs >300 4 Abs >500 18 Abs >1000 >1000 Abs<br />
2 100 >300 Abs 25 Abs Abs 64 >300 Abs >300 >300 Abs<br />
3 >300 40 Abs 48 Abs Abs 100 50 Abs >300 39 Abs<br />
4 2 23 Abs Abs Abs Abs 2 32 Abs 5 26 Abs<br />
5 9 9 Abs 1 Abs Abs 5 Abs Abs >300 1 Abs<br />
6 4 18 Abs Abs 2 Abs 4 3 Abs >300 8 Abs<br />
7 3 4 Abs Abs Abs Abs 2 1 Abs 35 6 Abs<br />
At room temperature and at higher temperatures (+40<br />
185<br />
0 C) the<br />
enzymatic and microbiological reactions take place faster, which leads to the<br />
fast <strong>de</strong>gradation of the samples, as compared to the refrigerated samples.<br />
Sodium benzoate, potassium sorbate, citric acid or lemon concentrate<br />
<strong>de</strong>lay the growth of the microorganisms. The experimental data show that pH<br />
and water activity values <strong>de</strong>crease when citric acid or lemon concentrate are<br />
ad<strong>de</strong>d as acidifiants to the fruit juice (sample 4 and 5). The microbiological<br />
values, shown in Table 4, in correlation with water activity and pH values<br />
confirm that it’s useful to add acidifiants and preservatives to the fruit juice.<br />
The lemon concentrate (sample 4) - as a natural source of citric acid -<br />
can be used in juices with high content of fruit as a natural acidifier which also<br />
inhibit the microorganisms growth.<br />
The soft drinks with fruit content have a reduced pH level and contain<br />
consi<strong>de</strong>rable amounts of carbohydrates (sample 2 and 3), so that they become<br />
favourable selective environments for yeast growth. The alterations can be due<br />
to the yeast and bacteria that can come from sugar or microbiota of soft drinks.<br />
The quality management applications (TQM-total quality management)<br />
and the aspects related to food safety are at the moment a global concern that<br />
continues to increase due to their impact on international tra<strong>de</strong> [16]. Thus, the<br />
HACCP system is based on preventing and reducing the risks and<br />
<strong>de</strong>pen<strong>de</strong>nce on inspection and end-product testing [17]. A practical approach<br />
of the studies, involves a voluntary control of the stage corresponding to the<br />
storage of the end-product before bottling by preparing the sheet that tests<br />
the water activity value aw. According to the obtained product and based on
MIREL GLEVITZKY, DELIA PERJU, GABRIELA-ALINA DUMITREL, MARIA POPA, MIHAELA LAURA VICĂ<br />
the literature and history data (antece<strong>de</strong>nts) the limiting value of aw can be<br />
established in the company (regarding the studied soft drinks and taking into<br />
consi<strong>de</strong>ration the thermal treatment carried out, the maximum value of aw was<br />
set at 0.910).<br />
The plan for this new stage is presented in Table 5:<br />
Table 5. The analysis and the evaluation of the hazards of the cooling/storage stage of<br />
the soft drinks<br />
186<br />
Hazard<br />
Accept<br />
Type Description able<br />
level<br />
G 4 F 5 R 6<br />
Y&M 30 Med Low 2<br />
B 1<br />
C 2<br />
F 3<br />
Means of<br />
administra<br />
tion<br />
Colif. bacteria Abs Med Low 2<br />
TCB 2/cm 2 Med Low<br />
Staphylococcus<br />
Abs Med Low<br />
aureus<br />
Traces of<br />
2<br />
2<br />
PRP<br />
washing<br />
pow<strong>de</strong>rs /<br />
disinfectants<br />
Abs Low Low 1<br />
7<br />
Hygiene<br />
plan<br />
Fitting remains Abs Low Low 1 Maintenan<br />
ce plan<br />
Hairs (from the<br />
operator)<br />
Traces of<br />
vaseline /<br />
lubricant<br />
Abs Low Low 1 Hygiene<br />
plan<br />
Abs Low Low 1<br />
Glass pieces Abs Med Low 2<br />
Maintenan<br />
ce plan<br />
Preventive/con<br />
trol measures<br />
-Respecting<br />
and monitoring<br />
the<br />
temperature<br />
conditions<br />
when it is cold<br />
and the water<br />
activity in<strong>de</strong>x ≤<br />
0.910 when it<br />
is stored<br />
-Sensor –<br />
specific<br />
calibration<br />
-Personal<br />
instruction<br />
Document<br />
registration<br />
-Chart to<br />
monitor the<br />
water<br />
activity<br />
-PLC 8<br />
memory<br />
Respon<br />
sible<br />
B 1 -biological, C 2 -chemical, F 3 -physical, G 4 -gravity, F 5 - frequency of appearance, R 6 -<br />
risk, PRP 7 -preliminary programme, PLC 8 -Programme Logical Controller, Med-medium<br />
The analysis of this plan leads to i<strong>de</strong>a that the cooling/storage of soft<br />
drink constitutes PCC – critical control point with biological, chemical and<br />
physical risk for the safety of the food product, imposing monitoring at each<br />
charge. Based on this study, as well as on the analysis and evaluation of the<br />
hazards that may occur during the production of 50% fruit soft drinks, it has<br />
conclu<strong>de</strong>d that the cooling/storage stage of end-product must be integrated in<br />
the HACCP plan. Thus, a new phase of aw monitoring is proposed in the flow<br />
sheet. It is presented in Figure 1.<br />
Production responsible
WATER ACTIVITY – INDICATOR OF FOOD SAFETY …<br />
Figure 1. Flow sheet chart that inclu<strong>de</strong> aw monitoring.<br />
The inconvenience of this flow sheet chart is that the final product that<br />
doesn’t have the appropriate value of aw is not recycled. The cyclicity of the<br />
process is not possible because the soft drink quality would be consi<strong>de</strong>rably<br />
reduced by another thermal treatment.<br />
CONCLUSIONS<br />
The acidifiers, such as citric acid and lemon concentrate, as well<br />
another known additives with preservative proprieties are inhibitors of the<br />
microorganisms growth. Their functionality is un<strong>de</strong>r the influence of product pH<br />
and the conservation temperature, factors which contribute to the stability of<br />
the drink. The water activity can be reduced by replacing sugar with fructose or<br />
artificial sweeteners.<br />
The monitoring of the water activity value is favorable and a<strong>de</strong>quate for<br />
using it as a general method for ensuring the sanitation of soft drinks. The<br />
control of free water amount constitutes the only practical mechanism for<br />
ensuring food safety.<br />
REFERENCES<br />
1. A. X. Lupea, “Transformări ale biocompu<strong>şi</strong>lor procesaŃi în scop alimentar”,<br />
Publishing House CEP USM, Chi<strong>şi</strong>nău, 2004, 299.<br />
2. A. J. Fontana, “Water activity’s role in food safety and quality”, Deagon<br />
Devices, Washinton, accessed on: 01.02.2007.<br />
3. M. Glevitzky, I. Bogdan, G.-A. Brusturean, D. Perju, D. Silaghi-Perju,<br />
Revista <strong>de</strong> chimie, 2008, 59 (5), 595.<br />
187
MIREL GLEVITZKY, DELIA PERJU, GABRIELA-ALINA DUMITREL, MARIA POPA, MIHAELA LAURA VICĂ<br />
188<br />
4. V. Dan, “Microbiologia alimentelor” Publishing House Alma, GalaŃi, 2001, 175.<br />
5. S.J. Forsythe, P.R. Hayes, “Food Hygiene, microbiology and HACCP”,<br />
Aspen Publishers, Gaithersburg, Maryland, 1998.<br />
6. M.D. Ranken, R.C. Kill, C.G. Baker, “Food Industries Manual” 24th edition,<br />
Springer-Verlag, electronic release 2005.<br />
7. B.M. Lund, Tony C. Baird-Parker and all, “Microbiological Safety and<br />
Quality of food”, vol I, II, Springer-Verlag, electronic release 2005.<br />
8. S. Sureshkumar, V. Venkataramanujam, K. Dushyanthan, A. Kalaikannan,<br />
American Journal of Food Technology, 2006, 1(2), 166.<br />
9. Alonzo A. Gabriel, Food Chemistry, 2008,108, 1106.<br />
10. K. R. Dave, Journal of Applied Bacteriology, 1989, 67, 483.<br />
11. ***AOAC Official Methods 978.18. Water activity, 1995.<br />
12. SR ISO 7954:2001, “General guidance for the enumeration of yeasts and<br />
moulds”, 2001.<br />
13. SR EN ISO 4833:2003, “Horizontal method for the enumeration of<br />
microorganisms”, 2003.<br />
14. ISO 4832:2006, “Horizontal method for the enumeration of coliforms –<br />
colony count technique”, 2006.<br />
15. S. Ungureanu, “Sensibilitatea sistemelor dinamice”, Ed. Tehnica, Bucureşti,<br />
1988, 222.<br />
16. A.W. Barendsz, Food Control, 1998, 9(2-3), 163.<br />
17. ***Best practices in food safety. National gui<strong>de</strong>lines – The HACCP food<br />
safety system, Publishing House Uranus, Bucharest, 2007, 14.
STUDIA UNIVERSITATIS BABES-BOLYAI, CHEMIA, LIV, 1, 2009<br />
Dedicated to Professor Liviu Literat, at his 80 th anniversary<br />
SYNTHESIS AND CHARACTERIZATION OF SOME<br />
THERMORESISTANT PIGMENTS BASED ON THE<br />
Al 3+ → Cr 3+ SUBSTITUTION<br />
SILVANA IANOŞEV a , RADU LAZĂU a , MARIANA SUBA a ,<br />
CORNELIA PĂCURARIU a , IOAN LAZĂU a<br />
ABSTRACT. The paper presents the obtained results in the synthesis of some<br />
thermoresistant pink pigments with different structures, such as: corundum (Al2xCrxO3),<br />
spinel (ZnAl2-xCrxO4, MgAl2-xCrxO4) and perovskite (LaAl1-xCrxO3). An<br />
unconventional synthesis method has been used in or<strong>de</strong>r to increase the<br />
substitution of Al 3+ with Cr 3+ . The method used is based on the thermal<br />
<strong>de</strong>composition of organic complex combinations containing as ligand the<br />
2-<br />
glyoxylate dianion, (C2H2O4 ). The evolution of the crystalline phases with<br />
temperature has been investigated by XRD. The colorimetric characterization of<br />
the obtained pigments has been studied by diffuse reflectance spectrophotometry.<br />
Keywords: thermoresistant pink pigments, chromophore chromium (Cr 3+ , Cr 4+ ),<br />
mineralizers.<br />
INTRODUCTION<br />
Al 3+ → Cr 3+ substitution in the crystalline networks of some oxi<strong>de</strong><br />
compounds leads to a wi<strong>de</strong> range of pigments with colors varying from pink<br />
→ red → purple → chestnut red. These pigments <strong>de</strong>velop a special interest<br />
due to their color and difficulty to achieve constant nuances in a number as<br />
large as possible of vitreous compositions to be colored.<br />
The α-Al2O3 - α-Cr2O3 continuous isomorphy represents the basis of<br />
the Al 3+ → Cr 3+ substitution [1].<br />
In the crystalline structure of the two oxi<strong>de</strong>s, as well as in the solid<br />
solutions, they form, Al 3+ and Cr 3+ cations octahedrally coordinated. α-Cr2O3<br />
is green, whilst α-Al2-xCrxO3 solid solutions are pink for x ≤ 0.10. This major<br />
color difference is assigned to the compression of the Cr 3+ cations in the<br />
a Universitatea "Politehnica" din Timişoara, <strong>Facultatea</strong> <strong>de</strong> <strong>Chimie</strong> Industrială <strong>şi</strong> Ingineria Mediului,<br />
PiaŃa Victoriei Nr. 2, RO-300006 Timişoara, Romania, radulazau@gmail.com
190<br />
SILVANA IANOŞEV, RADU LAZĂU, MARIANA SUBA, CORNELIA PĂCURARIU, IOAN LAZĂU<br />
electrostatic field of the anions, when Cr 3+ cations take the place of Al 3+<br />
cations (with smaller ionic radius). The corresponding absorption bands in<br />
the VIS electronic spectrum move towards lower wavelengths and the color<br />
consequently changes from green (α-Cr2O3) to pink (α-Al2-xCrxO3) [2].<br />
The <strong>de</strong>velopment of the pink color requires the uniform (statistical)<br />
inclusion of Cr 3+ cations in the Al2-xCrxO3 network and thus, the initial raw<br />
materials mixture has to be as homogenous as possible. Nevertheless, the<br />
synthesis temperature has to ensure the structuring of the solid solution<br />
crystalline network.<br />
In the case of the classical (ceramic) method based on the thermal<br />
treatment of some Al2O3 and Cr2O3 mechanical mixtures, the temperatures<br />
required for the formation of the pink solid solutions are very high, often<br />
above 1300ºC. When the mixture is melting (which is the case of the ruby<br />
single crystals fabrication), the homogeneity is achieved in the melt and the<br />
specific color is ruby-red. Still, this requires temperatures above 2100ºC,<br />
which are not to be take into account in the case of thermoresistant<br />
pigments synthesis. A much more interesting and promising direction is<br />
represented by the unconventional methods. They start from highly<br />
homogenous precursors mixtures, usually at ionic scale.<br />
It is possible to obtain pink pigments not only by using Al 3+ → Cr 3+<br />
substitution in the Al2O3-Cr2O3 system, but also in more complex systems,<br />
which provi<strong>de</strong> appropriate host - crystalline networks for Cr 3+ . Among these,<br />
the most interesting crystalline network is that of spinel, in the ZnO-Al2O3-Cr2O3<br />
system [3]. Recently, the perovskite structure [4, 5] in the Ln2O3-Al2O3-Cr2O3<br />
system (Ln= Y, La, Nd, Dy, Gd) and also the cordierite structure 2MgO·(2x)Al2O3·<br />
xCr2O3·SiO2 [6-8] have <strong>de</strong>veloped practical interest.<br />
The aim of the paper is to highlight the particularity and the advantages<br />
offered by one of the unconventional methods currently used in the<br />
synthesis of the thermoresistant pigments based on the Al 3+ → Cr 3+<br />
substitution in various structures: corundum, spinel and perovskite. The<br />
effect of the mineralizer’s addition has also been studied.<br />
RESULTS AND DISCUSSION<br />
The unconventional method chosen to obtain the studied pigments<br />
is based on the annealing of the organic complex combinations formed<br />
during ethylene glycol oxidation by the <strong>de</strong>sired metal nitrates.<br />
The results mentioned in literature [9-11], as well as some of our<br />
own previous results [12-18], have proven the possibility to obtain oxi<strong>de</strong><br />
compounds by annealing these complex combinations at temperatures at<br />
least 200 - 300ºC lower than in the case of the classical method based on<br />
the annealing of mechanical mixtures of oxi<strong>de</strong>s and/or salts.
SYNTHESIS AND CHARACTERIZATION OF SOME THERMORESISTANT …<br />
The method is based on the 1,2-ethanediol to glyoxylate dianion<br />
oxidation reaction by the nitrate anion, according to the reaction:<br />
C2H4(OH)2 + → + 2NO +2H2O (1)<br />
One or more metallic nitrates can be used in the oxidation reaction,<br />
<strong>de</strong>pending on the <strong>de</strong>signed product. For example, in or<strong>de</strong>r to obtain<br />
ZnO·Al2O3 spinel, 1,2 - ethanediol is being oxidized by a mixture of Al(NO3)3<br />
and Zn(NO3)2 in the molar ratio 2:1. It has been established [19] that in this<br />
particular case the following reactions take place:<br />
Al(NO3)3 + H2O → Al(OH)(NO3)2 + HNO3 (2)<br />
6C2H4(OH)2 + 4 Al(OH)(NO3)2 + 2Zn(NO3)2 ⎯⎯ ⎯ →<br />
O xH2 → Al4Zn2(OH)4(C2H2O4)6·xH2O + 12NO + 12H2O (3)<br />
NO(g) + 1/2O2(g) → NO2(g) (4)<br />
During the reaction HNO3 and NO2 evolve and the complex<br />
combination separates as a solid product. This <strong>de</strong>composes during the<br />
annealing and an oxi<strong>de</strong> pow<strong>de</strong>r forms, together with CO2 and H2O. At the<br />
beginning the resulting pow<strong>de</strong>r is amorphous, but an increase in the<br />
temperature leads to the formation of the <strong>de</strong>signed oxi<strong>de</strong> compound (reaction 5):<br />
Al4Zn2(OH)4(C2H2O4)6 + 6O2<br />
⎯ °<br />
t> 250 C<br />
⎯⎯→ 2(ZnO⋅Al2O3) + 12CO2 + 8H2O (5)<br />
In the case of other metal nitrates, it may be possible that the<br />
oxidation reaction of 1,2 - ethanediol takes place differently, with the formation<br />
of carboxylates. Still, the intimate mixtures of the precursors preserve the<br />
advantage of the high initial homogeneity of the reaction mixtures and thus,<br />
enhance the reactions of the <strong>de</strong>signed products, which take place at<br />
temperatures 200 or 300ºC lower than in the case of the traditional method.<br />
In or<strong>de</strong>r to enhance the chromophore binding in the host-crystalline<br />
network, two of the common mineralizers have been used (CaF2 and LiF),<br />
as well as the recently mentioned in the literature Li2O. The latter is proven<br />
to <strong>de</strong>velop a very good effect on the obtaining of mauve pigments with<br />
cassiterite structure [20] and pink pigments with tin sphene structure [21].<br />
In Table 1 there are presented the studied compositions.<br />
The observations ma<strong>de</strong> on annealed samples at different temperatures,<br />
as well as on the color of the rinsing water, phase analysis and diffuse<br />
reflectance spectra are shown as follows.<br />
Trichromatic coordinates (L*a*b*) of some of the obtained samples<br />
are presented in Table 2. The three coordinates of CIELAB represent the<br />
lightness of the color (L* = 0 yields black and L* = 100 indicates diffuse<br />
white; specular white may be higher), its position between red/magenta and<br />
191
SILVANA IANOŞEV, RADU LAZĂU, MARIANA SUBA, CORNELIA PĂCURARIU, IOAN LAZĂU<br />
green (a*, negative values indicate green, while positive values indicate<br />
magenta) and its position between yellow and blue (b*, negative values<br />
indicate blue and positive values indicate yellow).<br />
Table 1. Studied compositions<br />
Molar ratio<br />
Sample<br />
number Ethylene<br />
Al(NO3)3 Cr(NO3)3Zn(NO3)2Mg(NO3)2 La(NO3)<br />
glycol<br />
Mineralizer<br />
(1%)<br />
Crystalline<br />
network<br />
0. - 2 - - - 3 -<br />
Corundum -<br />
eskolaite<br />
1.1. 1.90 0.10 - - - 2 - Corundum<br />
1.2. 1.90 0.10 - - - 2 CaF2 Corundum<br />
1.3. 1.90 0.10 - - - 2 Li2O Corundum<br />
1.4. 1.90 0.10 - - - 2 LiF Corundum<br />
1.5. 1.80 0.20 - - - 2 - Corundum<br />
1.6. 1.80 0.20 - - - 2 CaF2 Corundum<br />
1.7. 1.80 0.20 - - - 2 Li2O Corundum<br />
1.8. 1.80 0.20 - - - 2 LiF Corundum<br />
2.1. 1.90 0.10 1 - - 3 - Spinel<br />
2.2. 1.90 0.10 1 - - 3 CaF2 Spinel<br />
2.3. 1.90 0.10 1 - - 3 Li2O Spinel<br />
2.4. 1.90 0.10 1 - - 3 LiF Spinel<br />
3.1. 1.90 0.10 - 1 - 3 - Spinel<br />
3.2. 1.90 0.10 - 1 - 3 CaF2 Spinel<br />
3.3. 1.90 0.10 - 1 - 3 Li2O Spinel<br />
3.4. 1.90 0.10 - 1 - 3 LiF Spinel<br />
4.1. 0.95 0.05 - - 1 2.5 - Perovskite<br />
4.2. 0.95 0.05 - - 1 2.5 CaF2 Perovskite<br />
4.3. 0.95 0.05 - - 1 2.5 Li2O Perovskite<br />
4.4. 0.95 0.05 - - 1 2.5 LiF Perovskite<br />
a) Pigments with corundum structure Al2-xCrxO3<br />
All the samples within the series 1 (1.1 ÷ 1.8) are amorphous after<br />
annealing at 500ºC. At 900ºC δ-Al2O3 is present in the XRD pattern and<br />
after annealing at 1000ºC α-Al2O3 is present as single phase.<br />
The color of the samples within the series 1 varies much, <strong>de</strong>pending<br />
on the composition and annealing temperature.<br />
The free chromium as soluble Cr<br />
192<br />
6+ (aluminium chromate), assessed<br />
by the color of the rinsing water varies with the annealing temperature and<br />
the mineralizer used. Since the objective was to reach an advanced<br />
chromium binding <strong>de</strong>gree in the crystalline network of corundum, we consi<strong>de</strong>red<br />
the quantitative assessment of free chromium was not necessary. The<br />
purpose was to find the working conditions to allow the <strong>de</strong>velopment of an
SYNTHESIS AND CHARACTERIZATION OF SOME THERMORESISTANT …<br />
intense color by the homogenous inclusion of the chromophore Cr 3+ in the<br />
host crystalline network. From this point of view, the color of the samples is<br />
more intense at 1100ºC than at 1000ºC, and there is no significant<br />
difference between the colors at 1200ºC compared to 1100ºC.<br />
Sample<br />
number<br />
Table 2. CIELAB trichromatic coordinates of the samples annealed<br />
at different temperatures<br />
Sample<br />
Mineralizer<br />
[wt.%]<br />
Temperatur<br />
e<br />
[ºC]<br />
L* a* b*<br />
0. Cr2O3 - 1100 44.4697 -14.8240 16.7534<br />
1.5. Al1.80Cr0.20O3 - 1100 67.3149 2.8066 2.0216<br />
1.6. Al1.80Cr0.20O3 CaF2 1100 66.4278 4.2003 1.2662<br />
1.7. Al1.80Cr0.20O3 Li2O 1100 65.7919 3.1277 1.2063<br />
1.8. Al1.80Cr0.20O3 LiF 1100 66.4393 1.9980 1.7037<br />
2.1. ZnAl1.90Cr0.10O4 - 1100 79.4996 15.2079 2.3690<br />
2.2. ZnAl1.90Cr0.10O4 CaF2 1100 87.7384 9.8321 2.9288<br />
2.3. ZnAl1.90Cr0.10O4 Li2O 1100 82.4761 15.6099 2.5786<br />
2.4. ZnAl1.90Cr0.10O4 LiF 1100 85.6378 11.8808 1.8574<br />
3.1. MgAl1.90Cr0.10O4 - 1200 85.1272 5.8948 0.6873<br />
3.4. MgAl1.90Cr0.10O4 LiF 1200 80.0045 6.8176 1.8102<br />
4.1. LaAl0.95Cr0.05O3 - 1000 81.9325 7.5195 7.7448<br />
4.2. LaAl0.95Cr0.05O3 CaF2 1000 67.7153 8.9423 4.0135<br />
4.1. LaAl0.95Cr0.05O3 - 1200 52.6236 13.9397 5.9973<br />
4.2. LaAl0.95Cr0.05O3 CaF2 1200 42.4616 14.8593 6.0388<br />
Interesting differences have been noted between samples obtained<br />
with mineralizer addition:<br />
- The samples with 1% CaF2, which is consi<strong>de</strong>red in the literature<br />
as a highly efficient mineralizer, show a less intense color than in the case<br />
of the similar sample without CaF2 content (within series 1). Accordingly,<br />
the samples with CaF2 show higher free soluble chromium content.<br />
- Samples with 1% Li2O present a more intense color and lower<br />
free soluble chromium content than in the case of samples with CaF2 or<br />
without mineralizer.<br />
- Samples with LiF are very similar to those with Li2O.<br />
The negative effect of CaF2 is assigned to the Ca 2+ cation, with<br />
marked alkaline nature, which <strong>de</strong>termines the calcium chromate (CaCrO4)<br />
formation, enhancing the displacement of the Cr 6+ ↔ Cr 3+ equilibrium<br />
towards Cr 6+ .<br />
193
194<br />
SILVANA IANOŞEV, RADU LAZĂU, MARIANA SUBA, CORNELIA PĂCURARIU, IOAN LAZĂU<br />
The increase of the Cr 3+ content in the series 1.5 ÷ 1.8 leads to<br />
impurifying of the pink color with green.<br />
The explanation of the pink color in the case of the solid solutions<br />
resulted by the substitution of Al 3+ with Cr 3+ cations lays in the higher Cr 3+<br />
radius ( r = 0,<br />
62 Å, r = 0,<br />
53 Å after Shannon and Kingery cited in [22]).<br />
3 +<br />
Cr<br />
3 +<br />
Al<br />
Thus, Cr 3+ cations are subjected to compression, which leads to a more<br />
intense electrostatic repulsion between the load of the oxygen anions in the<br />
corners of the coordination polyhedron (octahedron) and the 3d electrons of<br />
the chromophore, implicitly increasing the splitting parameter ∆o. The effect<br />
of ∆o increase is a displacement of the absorption bands corresponding to the<br />
3d 3 electrons transitions towards higher frequencies (∆E=hν), lower<br />
wavelengths respectively, with a change in color from green (α-Cr2O3) to pinkred<br />
(ruby, α-Al2-xCrxO3). This displacement of the absorption bands may be<br />
easily observed on the diffuse reflectance spectra presented in Figure 1.<br />
Figure 1. Diffuse reflectance spectra of samples 1.5-1.8 annealed at 1200ºC<br />
and α-Cr2O3.<br />
b) Spinel structure pigments<br />
The compositions presented in Table 1 show two groups of spinel<br />
structure pigments:
SYNTHESIS AND CHARACTERIZATION OF SOME THERMORESISTANT …<br />
- <strong>de</strong>rived from zinc spinel ZnAl2-xCrxO4, samples 2.1. ÷ 2.4;<br />
- <strong>de</strong>rived from magnesium spinel MgAl2-xCrxO4, samples 3.1 ÷ 3.4.<br />
In both series, the effect of mineralizer addition (CaF2, Li2O, LiF)<br />
upon the color <strong>de</strong>velopment has been studied.<br />
There is very few information in literature concerning the use of<br />
magnesium spinel for thermoresistant pigments. Usually, the zinc spinel is<br />
the one used for obtaining a wi<strong>de</strong> range of colors by Al 3+ , Zn 2+ or both<br />
cations substitution with different chromophore cations (Cr 3+ , Fe 3+ , Co 2+ ,<br />
Ni 2+ , Mn 2+ , etc.). This situation is due to both experimental results and to<br />
thermodynamic calculus. Starting from the thermodynamic standard<br />
functions of each chemical compound [23] and consi<strong>de</strong>ring the relations for<br />
the temperature <strong>de</strong>pen<strong>de</strong>nce of the thermal effects (∆rH 0<br />
T ) and Gibbs<br />
energy (∆rG 0<br />
T ) [24], the thermodynamic calculations have been done. The<br />
∆rH 0<br />
T = f(T) <strong>de</strong>pen<strong>de</strong>nce (Figure 2) calculated for zinc and magnesium<br />
spinels show that the reaction of the spinel starting from oxi<strong>de</strong>s as raw<br />
materials (the classical method) is more exothermal for ZnAl2O4 than for<br />
MgAl2O4. Moreover, the ∆rG 0<br />
T = f(T) calculated <strong>de</strong>pen<strong>de</strong>nce show that zinc<br />
spinel forms easier than magnesium spinel (Figure 3).<br />
Δ H r o<br />
T [ kJ mol-1 ]<br />
-20<br />
-22<br />
-24<br />
-26<br />
-28<br />
-30<br />
-32<br />
-34<br />
-36<br />
-38<br />
-40<br />
-42<br />
-44<br />
-46<br />
-48<br />
MgAl 2 O 4<br />
ZnAl 2 O 4<br />
-50<br />
200 300 400 500 600 700 800 900 1000 1100<br />
T [ K ]<br />
Figure 2. ∆rH 0<br />
T =f(T) <strong>de</strong>pen<strong>de</strong>nce for<br />
the reactions of zinc and magnesium<br />
spinels.<br />
Δ G r o<br />
T [ kJ mol-1 ]<br />
-20<br />
-22<br />
-24<br />
-26<br />
-28<br />
-30<br />
-32<br />
-34<br />
-36<br />
-38<br />
-40<br />
-42<br />
-44<br />
200 300 400 500 600 700 800 900 1000 1100<br />
T [ K ]<br />
MgAl 2 O 4<br />
ZnAl 2 O 4<br />
Figure 3. ∆rG 0<br />
T = f(T) <strong>de</strong>pen<strong>de</strong>nce for<br />
the reactions of zinc and magnesium<br />
spinels.<br />
ZnAl2O4 formation by solid state reaction takes place quite easily<br />
and thus, the zinc spinel represents an accessible base for thermoresistant<br />
pigments, whilst MgAl2O4 is more difficult to obtain.<br />
195
196<br />
SILVANA IANOŞEV, RADU LAZĂU, MARIANA SUBA, CORNELIA PĂCURARIU, IOAN LAZĂU<br />
Pink pigments <strong>de</strong>rived from MgAl2O4 have been obtained by the<br />
method based on annealing the complex combinations, which enhances<br />
the formation of the <strong>de</strong>signed products.<br />
The results of the XRD phase analysis in the case of the samples<br />
annealed at temperatures comprised between 500ºC and 1000ºC confirmed<br />
the easier formation of the zinc spinel (samples 2.1 ÷ 2.4). At 600ºC this is<br />
present as single phase in the XRD pattern. In the case of MgAl2O4<br />
(samples 3.1÷ 3.4) the pow<strong>de</strong>r is amorphous. The spinel presents a good<br />
crystallization <strong>de</strong>gree at 800ºC.<br />
One notes that in the case of the traditional synthesis method, when<br />
starting from a mixture of MgCO3 and aluminum hydroxi<strong>de</strong>, the spinel is still<br />
not the single phase present at 1200ºC [25].<br />
The diffuse reflectance spectra of the synthesized zinc and<br />
magnesium spinels are presented in Figures 4 and 5.<br />
Figure 4. Diffuse reflectance spectra of<br />
samples 2.1 ÷ 2.4 annealed at 1100°C.<br />
Figure 5. Diffuse reflectance spectra of<br />
samples 3.1 and 3.4 annealed at 1200°C.<br />
From the point of view of the pink color <strong>de</strong>velopment via the<br />
Al 3+ → Cr 3+ partial substitution, the observations are similar to those ma<strong>de</strong> in<br />
the case of the corundum solid solutions:<br />
- the temperature required to obtain an intense pink is 1100°C. It is<br />
only in the case of the magnesium spinel, when raising the temperature up<br />
to 1200°C leads to a color enhancement. This may be assigned to the specific<br />
MgAl2O4 formation conditions, which are more sensitive to temperature.
SYNTHESIS AND CHARACTERIZATION OF SOME THERMORESISTANT …<br />
- the effect of mineralizers additions is similar to the 1. series –<br />
negative for CaF2 and positive for Li2O and LiF, with the same explanation<br />
for the negative role of Ca 2+ ions.<br />
c) Perovskite structure pigments<br />
The crystalline structure of perovskite is one of the most recent<br />
used in thermoresistant pigments synthesis [26-28]. Starting from the ABO3<br />
stoichiometry, where A 3+ = Y 3+ , La 3+ , Nd 3+ , etc. (large radius cations) –<br />
do<strong>de</strong>cahedrally coordinated, and B 3+ = Al 3+ (relatively small radius cations)<br />
octahedrally coordinated, there may be obtained pink pigments by<br />
Al 3+ → Cr 3+ partial substitution.<br />
The formation of the above-mentioned pigments (samples 4.1 – 4.4)<br />
via thermal <strong>de</strong>composition of the complex combinations, as well as the<br />
influence of the mineralizers upon the color, were studied.<br />
The diffuse reflectance spectra of the samples with no mineralizer,<br />
respectively with CaF2 as mineralizer, at 1000 and 1200°C there are<br />
presented in Figures 6 and 7.<br />
Figure 6. Diffuse reflectance spectra<br />
of samples 4.1 and 4.2 annealed at<br />
1000°C.<br />
Figure 7. Diffuse reflectance spectra<br />
of samples 4.1 and 4.2 annealed at<br />
1200°C.<br />
These spectra are practically i<strong>de</strong>ntical with those of the same<br />
pigments obtained by the traditional method at 1400°C [4].<br />
197
198<br />
SILVANA IANOŞEV, RADU LAZĂU, MARIANA SUBA, CORNELIA PĂCURARIU, IOAN LAZĂU<br />
One can note the presence of the specific wi<strong>de</strong> absorption band<br />
between 450 and 600nm. At both 1000 and 1200°C samp les with CaF2<br />
show lower reflectance values, which indicate more intense colors than in<br />
the case of the samples with no mineralizer addition.<br />
The XRD patterns presented in figure 8 show that the sample<br />
annealed at 600°C is amorphous and starting with 75 0°C perovskite is the<br />
single phase in the sample. The yellow color of the sample annealed at 600°C<br />
is assigned to Cr 6+ as lanthanum chromate and the pink color at 750°C is<br />
associated with the presence of perovskite.<br />
Regarding the oxidation number of chromium, which is substituting<br />
the octahedrally coordinated Al 3+ cations in the perovskite network, the<br />
literature data are still controversial. Some authors [29-31] consi<strong>de</strong>r that<br />
chromium is trivalent. But if one takes into account the diffuse reflectance<br />
spectra of these pigments (Figures 6 and 7), which are essentially different<br />
from those of the pink pigments with corundum and spinel pigments, this<br />
hypothesis is questionable.<br />
Figure 8. XRD patterns of La 3+ , Al 3+ and Cr 3+ glyoxilate annealed at different<br />
temperatures.
SYNTHESIS AND CHARACTERIZATION OF SOME THERMORESISTANT …<br />
The diffuse reflectance spectrum of pink perovskite pigments show<br />
a large absorption band between 380 and 600nm, very similar to that of the<br />
tin sphene (CaO·SnO2·SiO2) pigments – in which the presence of octahedrally<br />
coordinated Cr 4+ is already accepted, as a result of the Sn 4+ → Cr 4+<br />
substitution [32-35]. Based on this analogy, one can assume the presence<br />
of Cr 4+ as well in the pink perovskite pigments. As a matter of fact, Pavlov<br />
[34] indicates the presence of Cr 4+ in YAlO3, in which Al 3+ is partly<br />
substituted by chromium. The overall structure is electrically neutral due to<br />
cationic vacancies generated by the substitution 4Al 3+ → 3Cr 4+ . Another<br />
possibility is the coupled substitution (La 3+ + Al 3+ ) → (Ca 2+ + Cr 4+ ), where<br />
Ca 2+ cations come from the used mineralizer (CaF2) – a plausible<br />
hypothesis taking into account the marked positive influence of CaF2 upon<br />
the color of these pigments. Unlike the case of corundum and spinel<br />
pigments, where CaF2 has a negative effect, in the case of perovskite the<br />
La 3+ → Ca 2+ substitution (as A – type cations) enhances the Al 3+ → Cr 4+<br />
substitution and hence, the color. La 3+ → Ca 2+ substitution is possible due to<br />
the close values of the ionic radius of the two cations and also to the Ca 2+<br />
possibility to form a perovskite network (see the case of CaTiO3 – where<br />
the tetravalent B cations are octahedrally coordinated).<br />
CONCLUSIONS<br />
The method based on the annealing glyoxylate-like complex combinations<br />
enables the chromium (Cr 3+ , Cr 4+ ) containing pigments formation at temperatures<br />
at least 200-300ºC lower than in the case of the classical method.<br />
Zinc spinel (ZnAl2O4) and the pink pigments <strong>de</strong>rivated from this are<br />
easier to obtain than magnesium spinel (MgAl2O4), which is in accordance<br />
with the thermodynamic data.<br />
The method used ilustrates the possibility to obtain magnesium<br />
spinel and substitute Al 3+ with Cr 3+ even at 800°C, whilst in the traditional<br />
method temperatures above 1200°C are nee<strong>de</strong>d.<br />
Choosing the right mineralizers to enhance the color and reduce the<br />
soluble chromium ratio must be done according to the crystalline network<br />
type, basicity of the host-network cations, <strong>de</strong>sired substitutions and final<br />
chromophore oxidation number.<br />
CaF2 is not recommen<strong>de</strong>d in the case of corundum and spinel<br />
structure pigments. The use of LiF or Li2O leads to the <strong>de</strong>sired pink pigments<br />
at temperatures between 1000 and 1100°C.<br />
199
200<br />
SILVANA IANOŞEV, RADU LAZĂU, MARIANA SUBA, CORNELIA PĂCURARIU, IOAN LAZĂU<br />
In the case of perovskite, the use of CaF2 clearly enhances the<br />
specific color of these pigments.<br />
EXPERIMENTAL SECTION<br />
Organic combinations obtained by the oxidation reaction of 1,2ethanediol<br />
with the <strong>de</strong>sired metal nitrates according to the reactions (1), (2),<br />
(3), (4) and (5) were dried in a drying oven at 110°C and annealed in<br />
porcelain crucibles at temperatures between 500°C a nd 1200°C in static air<br />
using an electrical (Nabertherm) furnace.<br />
The free chromium content (soluble Cr 6+ ) after annealing the<br />
samples has been assessed by the colour of the rinsing water. After drying,<br />
the samples were subjected to colorimetric characterization by diffuse<br />
reflectance spectrophotometry – using a Varian CARY 300 spectrophotometer<br />
with integration sphere, D65 illuminant at 10 <strong>de</strong>grees observer’s angle. The<br />
CIELAB trichromatic coordinates L*a*b* were established using Varian CARY<br />
WinUV Color 3.1. software. The phase composition analysis of the samples<br />
was investigated by XRD, using a DRON 3 diffractometer with CuKα radiation.<br />
REFERENCES<br />
1. E. M. Levin, C. R. Robbins, H. F. McMurdie, ”Phase Diagrams for Ceramists”<br />
The American Ceramic Society, Ohio, 1964, 309.<br />
2. L. E. Orgel, Nature, 1957, 179, 1348.<br />
3. R. A. Eppler, "Ullman’s Encyclopedia of Industrial Chemistry", VCH<br />
Verlagsge-sellschaft mbH, D-6940, Weinheim, 1986, A5, 545.<br />
4. G. Baldi, N. Dolen, , Mater. Eng., 1999, 2, 151.<br />
5. G. Monros, CIMTEC 2002 -10 th International Ceramics Congress International<br />
Symposium, "Science for new Technology of Silicate Ceramics" , Advances in<br />
Science and Technology, Florence, Italy, 2002, 34, 255.<br />
6. V. P. Pîrkov, L. I. Cerepanina, A. N. Denisov, L. A. Bizir, Steklo i Keramika,<br />
1981, 5, 22.<br />
7. I. Lazău, C. Păcurariu , R. M. Jurca, G. Kovacs, J. Building Mater., 1999,<br />
29, 85.<br />
8. S. Ianoşev, I. Lazău, C. Păcurariu, A. Avramescu, Process. Applic. Ceram.,<br />
2008, 2, 39.<br />
9. M. Bîrzescu, M. Cristea, M. Ştefănescu, Gh. Constantin, Brevet Rom. 1990,<br />
102501.<br />
10. M. Ştefănescu, V. Sasca, M. Bîrzescu, D. Crişan, M. Mracec, "Rev. Roum.<br />
Chim., 1998, 40, 788.<br />
11. M. Bîrzescu, C. Păcurariu, M. Ştefănescu, Chem. Bull. POLITEHNICA<br />
Univ.(Timisoara),1996, 41, 80.
SYNTHESIS AND CHARACTERIZATION OF SOME THERMORESISTANT …<br />
12. C. Păcurariu, Teză <strong>de</strong> doctorat, Universitatea "Politehnica" Timişoara, 1997.<br />
13. C. Păcurariu, I. Lazău, D. Becherescu, I. Boboş, Rev. Roum. Chim., 1997,<br />
42, 447.<br />
14. C. Păcurariu, M. Bîrzescu, I. Lazău, M. Brezeanu, D. Becherescu, Mater.<br />
Eng., 2000, 11, 129.<br />
15. C. Păcurariu, M. Ştefănescu , I. Lazău, M. Bîrzescu, Key Eng. Mater.<br />
Trans. Tech. Publications, Switzerland, 1997, 113,132.<br />
16. I. Lazău, C. Păcurariu, R. Lazău, Interceram, 2002, 51, 266.<br />
17. C. Păcurariu, I. Lazău, D. Becherescu, R. Lazău, Mater. Eng., 2003, 14, 97.<br />
18. S. Ianoşev, I. Lazău, C. Păcurariu, A. Goleanu, Proceedings of 2 nd International<br />
Congress on Ceramics, Verona, Italy, 2008.<br />
19. M. Bîrzescu, M. Ştefănescu, M. Brezeanu, M. Andruh, The 3 rd Ntional<br />
Congress of Chemistry, Bucharest, 1988, 46.<br />
20. T. Bartiş, R. I. Lazău, D. Becherescu, I. Lazău, C. Păcurariu, O. Matea,<br />
Rev. Chim., 2007, 58, 1035.<br />
21. T. Bartiş, R.I. Lazău, D. Becherescu, I. Lazău, C. Păcurariu, O. Matea,<br />
Rom. J. Mater, 2007, 37, 113.<br />
22. W. Richerson, D.David, ”Mo<strong>de</strong>rn Ceramic Engineering”, Marcel Dekker<br />
Inc., New York, 1992.<br />
23. O. Knache, K. Kubaschewski, K. Hesselmann, "Thermochemical Properties<br />
of Inorganic Substances", Second Edition, Springer-Verlag, Berlin, 1991.<br />
24. R. Ianoş, I. Lazău, C. Păcurariu, "Sinteza compu<strong>şi</strong>lor oxidici prin metoda<br />
combustiei", Editura Politehnica, 2008.<br />
25. M. F. M. Zawrah, A. A. El Kheshen, Br. Ceram. Trans., 2002, 101, 71.<br />
26. G. Baldi, N. Dolen, Mater. Eng., 1999, 2, 151.<br />
27. G. Monros, CIMTEC 2002 -10 th International Ceramics Congress International<br />
Symposium, "Science for new Technology of Silicate Ceramics", Advances<br />
in Science and Technology, Florence, Italy, 2002, 34, 255.<br />
28. R. Olazcuaga, A. El Kira, P. Maestro, R. Tastu, G. Le Flem, Rev. Chim.<br />
Minerale, 1984, 21, 221.<br />
29. I. Rotsche, R. Schro<strong>de</strong>r, I. Reichel, Silikattechnik, 1985, 10, 316.<br />
30. E. A. Filipova, A. I. Glebîceva, L. A. Bizir, N. N. Kazakova, Steklo i<br />
Keramika, 1983, 7, 23.<br />
31. L. Tcheichvili, W. A. Weyl, The Glass Industry, 1963, 208.<br />
32. M. A. Heyns, P. M. Har<strong>de</strong>n, J. Phys. Chem. Solids, 1999, 60, 277.<br />
33. I. Shingo, K. Shigeto, K. Ikuo, H. Masahiko, J. Ceram. Soc. Japan, 1986,<br />
94, 457.<br />
34. R. S. Pavlov, V. B. Marzá, JB. Carda, J.Mater. Chem., 2002, 12, 2825.<br />
35. R. Lazău, Teză <strong>de</strong> doctorat, Ed. Politehnica, Timişoara, 2007.<br />
201
STUDIA UNIVERSITATIS BABES-BOLYAI, CHEMIA, LIV, 1, 2009<br />
Dedicated to Professor Liviu Literat, at his 80 th anniversary<br />
MASS TRANSFER IN SUBLIMATION PROCESS<br />
MIRELA SMARANDOIU a , IOAN MAMALIGA a ,<br />
STELIAN PETRESCU<br />
ABSTRACT. This paper is a study of mass transfer in entrainer sublimation,<br />
when the solid-gas interface is plane. A mathematical mo<strong>de</strong>l is established, that<br />
allows the calculation of the sublimation process time, or the sublimation front<br />
position as a time function. The mathematical mo<strong>de</strong>l is experimentally checked,<br />
using naphthalene cylindrical particles, fixed on special supports, with are<br />
offering a plane surface in contact with the entrainer, here is hot air. It is also<br />
studied the influence of temperature and entrainer flowrate on sublimation rate.<br />
Keywords: entrainer sublimation, mass transfer<br />
INTRODUCTION<br />
The sublimation is a physical process used for separation or<br />
purification of solid chemical substances. Although it is a technical process,<br />
the literature contains a small number at papers regarding mass and heat<br />
transfer [1-17].<br />
Regarding the mass transfer, the existing papers focus both a<br />
theoretical and experimental studies [1-6], at a single particle level, or<br />
group of particles in fixed or fluidized bed. Some authors [10-17] approach<br />
the simultaneous mass and heat transfer in sublimation processes.<br />
The present paper is a study of mass transfer in entrainer sublimation,<br />
when the solid-gas interface is plane. A mathematical mo<strong>de</strong>l is established,<br />
that allows the calculation of the sublimation process time, or the sublimation<br />
front position as a time function. The mathematical mo<strong>de</strong>l is experimentally<br />
checked, using naphthalene cylindrical particles, fixed on special supports,<br />
with are offering a plane surface in contact with the entrainer and here is<br />
hot air. It is also studied the influence of temperature and entrainer flow rate<br />
on sublimation rate.<br />
a Universitatea Tehnica “Gh. Asachi” din Ia<strong>şi</strong>, <strong>Facultatea</strong> <strong>de</strong> <strong>Inginerie</strong> <strong>Chimică</strong> <strong>şi</strong> ProtecŃia Mediului,<br />
Bd. D. Mangeron, Nr. 71, RO-700050, Ia<strong>şi</strong>, Romania, imamalig@ch.tuiasi.ro
MIRELA SMARANDOIU, IOAN MAMALIGA, STELIAN PETRESCU<br />
Mathematical mo<strong>de</strong>l<br />
Figure 1 presents the physical mo<strong>de</strong>l of entrainer sublimation with<br />
plane solid-gas interface. According to this mo<strong>de</strong>l, the entrainer moves<br />
towards the solid surface. At interface it is formed a limit diffusion layer,<br />
with δ thickness. The partial pressure of sublimation substance (A) at<br />
i<br />
∞<br />
interface is p A , and the gas phase volume is p A . The mass transfer<br />
direction from the interface to the gas phase volume is Oz.<br />
Figure1. The physical mo<strong>de</strong>l for mass transfer<br />
at entrainer sublimation.<br />
Since the mathematical mo<strong>de</strong>ling used in this paper looks to find one<br />
equation to <strong>de</strong>termine the process time, at the sublimation front position,<br />
the starting point is the convective diffusion equation:<br />
∂p<br />
∂t<br />
A<br />
= D<br />
2<br />
A<br />
2<br />
The initial and at limit terms, are:<br />
t = 0,<br />
h = H<br />
(2)<br />
t ><br />
0,<br />
z =<br />
h,<br />
In or<strong>de</strong>r to simplify solving the differential equation, we adopt pseudostationary<br />
condition, consi<strong>de</strong>ring the partial pressure constant on an infinitesimal<br />
204<br />
A<br />
∂<br />
p<br />
∂z<br />
p<br />
D<br />
A<br />
A<br />
RT<br />
= p<br />
∂p<br />
i<br />
A<br />
A<br />
∂z<br />
= ρ<br />
∞<br />
> 0,<br />
z = H1,<br />
p A = p A<br />
S<br />
dh<br />
dt<br />
(1)<br />
(3)<br />
t (4)
MASS TRANSFER IN SUBLIMATION PROCESS<br />
time interval. Solving the equation (1) un<strong>de</strong>r these conditions leads to the<br />
following solution:<br />
p − p<br />
p (5)<br />
i ∞<br />
A =<br />
A A<br />
∞<br />
( z − H1)<br />
+ p A<br />
h − H1<br />
Deriving the equation (5) in relation to z it gives:<br />
dp<br />
dz<br />
A<br />
i<br />
p A − p<br />
=<br />
h − H<br />
The limiting condition (3) it can be written:<br />
D A<br />
i<br />
p A p<br />
RT h − H<br />
− A<br />
∞<br />
The integration of equation (7) comes to:<br />
1<br />
∞<br />
A<br />
1<br />
= −ρ<br />
S<br />
dh<br />
dt<br />
(6)<br />
(7)<br />
ρSRT<br />
t = ( H − h)<br />
(8)<br />
i ∞<br />
k(<br />
p − p )<br />
A<br />
The distance from the interface, h, can be represented as a function of the<br />
sublimation <strong>de</strong>gree, <strong>de</strong>fined by the relation:<br />
Replacing relation (10) in (8) gets to:<br />
A<br />
0<br />
0<br />
m A − mA<br />
VS<br />
− VS<br />
h<br />
η A = = = 1−<br />
(9)<br />
0<br />
0<br />
m V H<br />
A<br />
S<br />
= H(<br />
1−<br />
η )<br />
(10)<br />
h A<br />
ρ RTH<br />
t = ηA<br />
(11)<br />
∞<br />
k(<br />
p − p )<br />
S<br />
i<br />
A<br />
Using equation (9) and (11), one can calculate the duration of sublimation<br />
process function of h and ηA, or the sublimation front position (expressed by<br />
h) as a function of time.<br />
RESULTS AND DISCUSSIONS<br />
It was experimentally <strong>de</strong>termined the mass variation of each<br />
naphthalene support in time, at variable temperature and air flow rate values.<br />
The results are presented in Table 1.<br />
205<br />
A
206<br />
MIRELA SMARANDOIU, IOAN MAMALIGA, STELIAN PETRESCU<br />
Using those data and equation (9), was <strong>de</strong>termined the variation of<br />
sublimation <strong>de</strong>gree for the naphthalene from supports, in time. The results<br />
are presented in Table 2.<br />
Mv<br />
(m 3 /h)<br />
1.5<br />
2.0<br />
2.5<br />
3.0<br />
3.5<br />
Mv<br />
(m3/h)<br />
1.5<br />
2.0<br />
2.5<br />
3.0<br />
3.5<br />
Table1. Mass variation at three temperatures (50°C, 60°C and 70°C)<br />
and entrainer flow rate in the range 1.5 -3.5 m 3 /h<br />
T<br />
(<br />
t (min)<br />
o C) 5 10 15 20 25<br />
50 0.0057 0.0130 0.0153 0.0367 0.0394<br />
60 0.0059 0.0348 0.0384 0.0716 0.1119<br />
70 0.0200 0.0844 0.1234 0.1701 0.2336<br />
50 0.0154 0.0198 0.0337 0.0389 0.0537<br />
60 0.0220 0.0404 0.0537 0.786 0.1151<br />
70 0.0358 0.0740 0.1117 0.1518 0.2360<br />
50 0.0163 0.0176 0.0264 0.0280 0.0657<br />
60 0.0136 0.0264 0.0592 0.0782 0.1254<br />
70 0.0410 0.0790 0.1208 0.1620 0.2395<br />
50 0.0094 0.0196 0.0306 0.0416 0.0592<br />
60 0.0209 0.0480 0.0655 0.0916 0.1311<br />
70 0.0386 0.0829 0.1420 0.1763 0.2511<br />
50 0.0106 0.0217 0.0343 0.0437 0.0666<br />
60 0.0215 0.0488 0.0795 0.0945 0.1547<br />
70 0.0481 0.0920 0.1313 0.1934 0.2886<br />
Table 2. Degree of sublimation at three temperatures (50°C,<br />
60°C and 70°C) and entrainer flow rate in the range 1.5 -3.5 m 3 /h<br />
T<br />
(<br />
t (s)<br />
o C) 300 600 900 1200 1500<br />
50 0.0063 0.0144 0.0170 0.0408 0.0438<br />
60 0.0065 0.0386 0.0420 0.0796 0.1244<br />
70 0.0224 0.0938 0.1372 0.1890 0.2597<br />
50 0.0171 0.0220 0.0370 0.0432 0.0597<br />
60 0.0244 0.0449 0.0597 0.0874 0.1279<br />
70 0.0398 0.0822 0.1241 0.1688 0.2624<br />
50 0.0181 0.0195 0.0293 0.015 0.0730<br />
60 0.0151 0.0293 0.0658 0.0869 0.1394<br />
70 0.0455 0.0878 0.1343 0.1801 0.2663<br />
50 0.0104 0.0217 0.0340 0.0462 0.0658<br />
60 0.0232 0.0533 0.0728 0.1018 0.1457<br />
70 0.0429 0.0921 0.1579 0.1960 0.2792<br />
50 0.0117 0.0241 0.0381 0.0485 0.0740<br />
60 0.0239 0.0542 0.0884 0.1050 0.1720<br />
70 0.0534 0.1023 0.1460 0.2150 0.3209
MASS TRANSFER IN SUBLIMATION PROCESS<br />
The variation of sublimation <strong>de</strong>gree for naphthalene is a measure<br />
for the time evolution of the sublimation process.<br />
The Figures 2 and 3 are graphical representation for h=f(t) functions,<br />
with the specified values for temperature and different air flow rate. As one<br />
can see, the height of sublimation front drops in time, regard less the<br />
temperature and entrainer flow rate values. As temperature rise, the height<br />
of sublimation front gets small, the reduction being pronounced at greater<br />
temperatures. The entrainer flow rate <strong>de</strong>termines a positive influence on<br />
sublimation front height.<br />
10 3 h, m<br />
11<br />
10<br />
9<br />
8<br />
7<br />
6<br />
5<br />
0<br />
T = 50 C<br />
0<br />
T = 60 C<br />
0 T = 70 C<br />
0 5 10 15 20 25 30<br />
t, min<br />
Figure 2. Sublimation front vs time at three temperatures (50°C,<br />
60°C and 70°C) and entrainer flow rate MV =1.5 m 3 /h.<br />
In continuation, was <strong>de</strong>termined the average sublimation rate, using<br />
the relation:<br />
t<br />
1<br />
v s = ∫ v s(<br />
t)<br />
dt<br />
(12)<br />
t<br />
The sublimation rate vs(t) were computed with the relation:<br />
v s(<br />
t)<br />
0<br />
dm<br />
= −<br />
(13)<br />
S ⋅ dt<br />
207
208<br />
MIRELA SMARANDOIU, IOAN MAMALIGA, STELIAN PETRESCU<br />
Figures 4 and 5 contain the <strong>de</strong>pen<strong>de</strong>ncies vs=f(Mv ) for many different<br />
temperatures, and vs =f(T) at different entrainer flow rate values. One can<br />
note that both entrainer <strong>de</strong>bit and temperature have a positive influence on<br />
average sublimation rate. In the entrainer flow rate variation range between<br />
1.5-3.5 m 3 /h, which is equivalent to entrainer velocity values through<br />
sublimation room between (0.409-0.955) m/s, the entrainer flow rate has a<br />
low influence on the sublimation rate. Temperature ranging from 50-70 0 C<br />
has a greater influence.<br />
10 3 h, m<br />
11<br />
10<br />
9<br />
8<br />
7<br />
6<br />
5<br />
o T = 50 C<br />
T = 60 o C<br />
o T = 70 C<br />
0 5 10 15 20 25 30<br />
t, min<br />
Figure 3. Sublimation front vs time at three temperatures(50°C,<br />
60°C and 70°C) and entrainer flow rate MV =3.5 m 3 /h.<br />
Figure 4. Sublimation rate as function of air flow rate<br />
at three temperatures (50°C, 60°C and 70°C).
10 3 v s, kg/m 2 s<br />
2.5<br />
2<br />
1.5<br />
1<br />
0.5<br />
0<br />
MASS TRANSFER IN SUBLIMATION PROCESS<br />
Based on average sublimation rate values, was <strong>de</strong>termined the<br />
individual mass transfer coefficient, using mass transfer equation:<br />
k i ∞<br />
= ( pA<br />
− p )<br />
(14)<br />
RT<br />
vs A<br />
The calculation of mass transfer coefficient involves knowledge of<br />
partial pressure values at gas-solid interface, which <strong>de</strong>pends on the<br />
temperature at interface Ti. In or<strong>de</strong>r to <strong>de</strong>termine the temperature at interface,<br />
the following equations were used:<br />
k i ∞<br />
α(<br />
T∞<br />
− Ti<br />
) = ( p A − p A ) ΔHs<br />
(15)<br />
RT<br />
lnp = 31.<br />
2352 − 8587 / T<br />
(16)<br />
i<br />
A<br />
3<br />
Mv = 1,5 m /h<br />
3 Mv = 3 m /h<br />
3<br />
Mv=3,5 m /h<br />
40 45 50 55 60 65 70 75<br />
T, o C<br />
Figure 5. Sublimation rate as function of temperature<br />
at three air flow rates (1.5, 3.0 and 3.5 m 3 /h).<br />
0.<br />
4<br />
i<br />
⎛ Pr ⎞<br />
Nu = ⎜ ⎟ Sh<br />
(17)<br />
⎝ Sc ⎠<br />
−7<br />
D A = 8.<br />
177 ⋅10<br />
⋅<br />
T<br />
1.<br />
983<br />
The equations (16), (17) and (18) were taken from literature [12].<br />
(18)<br />
209
210<br />
MIRELA SMARANDOIU, IOAN MAMALIGA, STELIAN PETRESCU<br />
The values for individual mass transfer coefficient obtained, are presented<br />
in Table 3. The results from this table show similar <strong>de</strong>pen<strong>de</strong>ncies of<br />
coefficient K, similar to sublimation rate.<br />
10 k,<br />
( m /<br />
2 ⋅ calculated at three<br />
Table 3. Individual mass transfer coefficient s)<br />
values of temperature and air flow rate in the range 1.5 – 3.5 m 3 /h<br />
MV (m 3 T ( /h)<br />
o C)<br />
1.5 2.0 2.5 3.0 3.5<br />
50 5.611 7.647 9.356 8.430 9.485<br />
60 7.393 7.604 8.285 8.662 10.222<br />
70 7.712 7.793 7.904 8.291 9.529<br />
Figure 6. Comparison between<br />
experimental and calculated data at<br />
three temperatures (50°C, 60°C and<br />
70°C) and air flow rate MV =2.0 m 3 /h.<br />
Then we passed to check the<br />
mathematical mo<strong>de</strong>l earlier<br />
obtained. To check the<br />
mathematical mo<strong>de</strong>l of sublimation<br />
process, the duration for same<br />
sublimation <strong>de</strong>gree values were<br />
calculated. The results are plotted in<br />
diagrams tcom=f(texp). The obtained<br />
data are presented in the figures 7<br />
and 8. As one can observe, the<br />
mathematical mo<strong>de</strong>l gives a good<br />
enough Figure verification 7. Comparison for experimental<br />
between<br />
data. experimental and calculated data at<br />
three temperatures (50°C, 60°C and<br />
CONCLUSIONS<br />
70°C) and air flow rate MV =3.0 m 3 /h.<br />
In this paper was studied the mass transfer at entrainer sublimation<br />
on plane solid-gas interface. A mathematical mo<strong>de</strong>l for the sublimation<br />
process was established, which allow <strong>de</strong>termination of process duration, or<br />
sublimation front height, or sublimation <strong>de</strong>gree as a function.<br />
Using naphthalene filled supports, which provi<strong>de</strong> plane surface in<br />
contact with the entrainer, it was experimentally <strong>de</strong>termined the variation of<br />
sublimation <strong>de</strong>gree and sublimation front height in time, at numerous<br />
values for entrainer (air) temperature and velocity. It was also <strong>de</strong>termined<br />
the average sublimation rate, and individual mass transfer coefficient, both<br />
on the same values for entrainer temperature and flow rate.
MASS TRANSFER IN SUBLIMATION PROCESS<br />
The results show that flow rate and temperature have a positive<br />
influence on sublimation rate and individual mass transfer coefficient.<br />
By comparing the experimental data with these calculated using the<br />
mathematical mo<strong>de</strong>l, a good concordance is obtained.<br />
List of symbols<br />
pA - component A partial pressure, N/m 2<br />
DA - component A diffusion coefficient, m 2 /s<br />
t - time, s<br />
H -support slot height, m<br />
h -sublimation front height, m<br />
R - universal gas constant, J/kgK<br />
ρs -component a <strong>de</strong>nsity in solid state, kg/m 3<br />
δ -limit diffusion layer thickness, m<br />
k - individual mass transfer coefficient, m/s<br />
m 0 A – component A mass at the initial moment, kg<br />
mA- component A mass at the given time t=t, kg<br />
ηA- component A sublimation gra<strong>de</strong><br />
i -symbol for interface<br />
∞ -symbol for gas phase volume<br />
VS 0 - initial solid phase volume, m 3<br />
VS –solid phase volume at t=t, m 3<br />
S -mass transfer surface area, m 2<br />
∆m –naphthalene support mass variation, kg<br />
∆t -time interval, s<br />
α - heat transfer individual coefficient, W/m 2 K<br />
∆HS- latent sublimation heat, J/kg<br />
T -temperature<br />
α<br />
=<br />
λ<br />
l<br />
Nu - Nusselt number<br />
kl<br />
Sh = - Sherwood number<br />
D A<br />
η<br />
=<br />
λ<br />
p C<br />
Pr - Prandtl number<br />
η<br />
Sc = - Schmidt number<br />
ρD<br />
A<br />
η -gas phase dynamic viscosity, Pa*s<br />
ρ -gas phase <strong>de</strong>nsity, kg/m 3<br />
Cp -gas phase specific heat, J/kg K<br />
211
212<br />
MIRELA SMARANDOIU, IOAN MAMALIGA, STELIAN PETRESCU<br />
l -characteristic length, m<br />
λ -gas phase thermal conductivity coefficient, W/m K<br />
EXPERIMENTAL SECTION<br />
In or<strong>de</strong>r to make the experiments, we used the laboratory installation<br />
presented in the Figure 8. According to Figure 8, the installation is composed<br />
from a cylindrical column (1), ma<strong>de</strong> from heat resistant glass, and which<br />
represents the sublimation chamber, the air heating room (the entrainer) (2),<br />
the fan for air transportation (3), the rotameter for air flow rate measurements<br />
(4), the thermometers (5) and (6), the valve which regulates the air flow rate<br />
(7), and the autotransformer used to adjust the temperature in sublimation<br />
chamber. The sublimation chamber is equipped insi<strong>de</strong> with a <strong>de</strong>vice (1a) to<br />
hold the support on which the sublimation particle will be fixed. The entrainer<br />
(air) gets in the sublimation chamber through a coupling positioned in upper<br />
si<strong>de</strong>, and gets out through the existing at lower si<strong>de</strong>. The heating room makes<br />
the entrainer warm using an electrical resistance powered by the current<br />
supply through autotransformer (8).<br />
Figure 8. Experimental setup. 1 - cylindrical column, 2 –, air heating room<br />
3 – fan, 4 –rotameter, 5, 6 – thermometers, 7 – valve, 8 – autotransformer.
MASS TRANSFER IN SUBLIMATION PROCESS<br />
For the experiments it was used naphthalene, with air as entrainer. The<br />
naphthalene was inserted melted in the cylindrical slot of each support. The<br />
support allows the contact with the gaseous entrainer only on the frontal<br />
si<strong>de</strong> of the naphthalene cylin<strong>de</strong>r solidified in the slot. This has a diameter<br />
d=10 mm and height H=100 mm.<br />
In each of the experiments a single naphthalene support was used.<br />
The temperature in sublimation room during each experiment was kept<br />
constant. Three temperatures were used: 50 0 C, 60 0 C, 70 0 C and several<br />
values of entrainer flow rate (air):1.5, 2.0, 2.5, 3.0 and 3.5 m 3 /h.<br />
REFERENCES<br />
1. E. Bratu, “Operatii unitare in ingineria chimica”, E.T. Bucuresti, 1985,<br />
chapter 28.<br />
2. J. H. Perry, “Perry’ Chemical Engineers’ Handbook” 4 th Ed., Mc Graw Hill,<br />
New York, 1963, section 17.<br />
3. P. K. Hal<strong>de</strong>r, D. Amitara, Proc. Int. Conf. Fluid. Bed. Combust. 12 th, 1993,<br />
2, 1223.<br />
4. J. J. Lombrano, M. C. Villaran, J. Chem. Eng. Jpn., 1993, 26(4), 389.<br />
5. F. W. Larry, W. Bruce, D. J. William, Appl. Energy, 1993, 46(2), 161.<br />
6. N. J. Nassif, W. S. Janna, G. S. Jakubowski, Int. Heat Mass Transfer, 1995,<br />
38(4), 691.<br />
7. C. Keumnam T. F. Irvine Jr., J. Karni, International Journal of Heat and Mass<br />
Transfer, 1992, 35(4), 957.<br />
8. H. H. Songin, J. Heat Transfer, 1991, 113(3), 772.<br />
9. S. W. Peng, G. Q. Chen, International Journal of Energy Research, 1993,<br />
17(3), 193.<br />
10. S. W. Peng, G. Q. Chen, J. Heat Transfer, 1994, 116(1), 215.<br />
11. R. Joulie, G. M. Rios, Drying Technology, 1993, 11(1), 157.<br />
12. S. P. R. Men<strong>de</strong>s, Exp. Therm. Fluid. Sci., 1991, 4(5), 510.<br />
13. S. Zhai, H. Su, R R. Taylor, N.K.H. Slater, Chem. Eng. Sci., 2005, 60, 1167.<br />
14. J. Y. Kim, T. H. Song, Int. J. Heat Mass Transfer, 2003, 46, 3051.<br />
15. S. D. Hwang, I. H. Jang, H. H. Cho, Int. J. Heat Fluid Flow, 2006, 27, 21.<br />
16. M. A. Siddiqi, B. Atakan, Thermochimica Acta, 2006, 452, 44.<br />
17. H. Wu, Z. Tao, G. Chen, H. Deng, G. Xu, S. Ding, Chem. Eng. Sci., 2004,<br />
59, 2921.<br />
213
STUDIA UNIVERSITATIS BABES-BOLYAI, CHEMIA, LIV, 1, 2009<br />
Dedicated to Professor Liviu Literat, at his 80 th anniversary<br />
MOLECULAR DYNAMICS SIMULATION OF THE HEAT<br />
TRANSFER BY NATURAL CONVECTION<br />
SOARE GHEORGHE a<br />
ABSTRACT. The heat transfer by natural convection between a surface of Cu<br />
(001) and water was studied with molecular dynamics simulation. A temperature<br />
gradient in a metal wall generates an electric charges gradient. On the cold face<br />
of the wall there are more electrons, as a result of the Thomson effect. On metal<br />
surface there are <strong>de</strong>fects (dislocations, steps, terraces, kinks) and the electrons<br />
are not uniformly distributed. On the high <strong>de</strong>fects there are more electrons than<br />
on the <strong>de</strong>ep <strong>de</strong>fects. From energetically point of view the metal surface is<br />
inhomogeneous. The molecules of the liquid are adsorbed on the metal surface<br />
and a small fraction of the molecular orbital overlaps on the orbital of the metal.<br />
The overlap allows the phonon exchange process between the adsorbed liquid<br />
molecules and the metal atoms. The proposed mo<strong>de</strong>l takes into account both<br />
the process of metal surface reconstruction and the process of molecular cluster<br />
formation in liquid. The high <strong>de</strong>fects are active centres which generate the<br />
movement of the liquid clusters over the metal surface. The results of the<br />
simulations show that the combination of these processes can gives a<br />
consistent prediction of the heat transfer coefficient by natural convection.<br />
Keywords: convection, heat transfer, mo<strong>de</strong>lling, molecular scale<br />
INTRODUCTION<br />
It is an indubitable fact that flow and thermal phenomena can be<br />
only un<strong>de</strong>rstood fundamentally by a molecular approach. Unfortunately,<br />
very few works were <strong>de</strong>dicated to study heat transfer mechanism through<br />
natural convection to molecular scale. A molecular mo<strong>de</strong>l of the convection<br />
heat transfer mechanism is proposed in an anterior work [1], and a modality<br />
of calculation of the heat transfer efficiency in the molecular mechanism<br />
was analyzed in the work [2]. In an other work [3], the equilibrium of heat<br />
conduction in a very thin solid film, using molecular dynamics simulation<br />
with different boundary conditions, material, parameters and lattice configurations<br />
a Universitatea Politehnica din Bucureşti, <strong>Facultatea</strong> <strong>de</strong> <strong>Chimie</strong> Aplicată <strong>şi</strong> ŞtiinŃa Materialelor,<br />
Str. Polizu, Nr. 1, RO-011061 Bucureşti, Romania, g_soare@chim.upb.ro
216<br />
SOARE GHEORGHE<br />
was studied. Many issues involved in the convection heat transfer are common<br />
and other scientific fields such as nano-tribology. Some of them are:<br />
adsorption of the molecules of lubricant on the solid surface and molecularly<br />
arrangement and flow of the lubricant in the boundary layer. More works were<br />
published in the area of the nanotribology [4-11]. In these works different<br />
aspects of the friction have been approached at molecular scale: static<br />
lubrication, dynamic lubrication, lubrication in boundary regime, the influence of<br />
molecule configuration, molecular rearrangements in a molecularly thin film<br />
between two solid surfaces during shear, etc.<br />
In the present work a physical mo<strong>de</strong>l and a mathematical mo<strong>de</strong>l of<br />
convection heat transfer at molecular scale are proposed. The mo<strong>de</strong>ls take in<br />
consi<strong>de</strong>ration the elementary phenomena which take place on the solid fluid<br />
interface: adsorption, diffusion over surface, solid surface reconstruction and the<br />
transfer of the phonons to the adsorbed molecules of fluid. Molecular dynamics<br />
simulation helps to clarify some aspects of the convection mechanism.<br />
RESULTS AND DISCUSSION<br />
Physical mo<strong>de</strong>l<br />
To formulate physical mo<strong>de</strong>l consi<strong>de</strong>r metal flat plate of Figure 1, in<br />
contact with two fluids (a hot fluid with temperature t1 and a cold fluid with<br />
temperature t2). The surfaces of the wall are heterogeneous in terms of<br />
energy. The heat transfers from hot fluid to cold fluid, in conformity with the<br />
molecular mechanism which was formulated by author in [1] and [2], and<br />
shown in Figure 1. An improved version of the physical mo<strong>de</strong>l will be<br />
presented briefly below. The existence of a temperature gradient in<br />
direction of the solid wall thickness, (tw1 > tw2), generates a gradient of<br />
<strong>de</strong>nsity of the free electrons of metal (Thomson effect), so on the col<strong>de</strong>r<br />
surface the <strong>de</strong>nsity of the free electron N2 is greater than the <strong>de</strong>nsity of the<br />
electrons which are on the warmer surface, N1.<br />
Figure 1. Physical mo<strong>de</strong>l.
MOLECULAR DYNAMICS SIMULATION OF THE HEAT …<br />
Figure 2. a) Possible <strong>de</strong>fects of the solid surface. For simplicity, the atoms<br />
of the solids were represented as a parallelepiped,<br />
b) Molecular multilayer adsorbed on the surface. The two arrows<br />
indicate the flow of the molecules and clusters of molecules.<br />
The cold face is loa<strong>de</strong>d with negative electrical charges and the hot<br />
face remains positively charged. Free electrons can not be spread evenly<br />
on the surface of the metal because the surface is not a perfect plane.<br />
Because of surface <strong>de</strong>fects (dislocations, terraces, stairs, corners), see<br />
Figures 1 and 2, these electrons are preferentially distributed on the surface.<br />
On the high <strong>de</strong>fects the electron <strong>de</strong>nsity is greater than the electron <strong>de</strong>nsity<br />
on both <strong>de</strong>ep <strong>de</strong>fects and the terraces which exist on the metal surface. For<br />
this reason, on the high <strong>de</strong>fects is a greater intensity of the electric field<br />
which is generated by these electric charges. The molecules of liquid are<br />
adsorbed on the metal surface. Adsorbed molecules move over the surface<br />
and capture phonons from the crystalline metal. The movement is a result<br />
of the following forces action:<br />
- the forces of attraction and repulsion between molecules in fluid;<br />
- the forces of attraction and repulsion between the molecule of the<br />
fluid and solid;<br />
- the forces of attraction and repulsion between the adsorbed molecule<br />
and nearest high <strong>de</strong>fects, where the electric field is more intense.<br />
Movement of the adsorbed molecules is directed towards nearest high<br />
<strong>de</strong>fect, which becomes an active centre that generates natural convection.<br />
Migration of the molecules over the surface, un<strong>de</strong>r the action of the<br />
above-mentioned forces, intensifies the emission of the phonons. Permanent<br />
dipoles molecules can migrate more quickly than originally non polar<br />
molecules. But a non polar molecule becomes a polar one as a result of an<br />
217
218<br />
SOARE GHEORGHE<br />
inductive polarization process. In accordance with the mechanism<br />
proposed in this theory, the process of heat transfer by natural convection<br />
implies: adsorption, polarization and an induced movement towards the<br />
active centres of the solid surface, the phonons capture and expulsion of<br />
molecules outsi<strong>de</strong> the solid-fluid interface.<br />
Effectiveness of the phonons absorption process<br />
The absorption of the phonons is conditioned by adsorption of liquid<br />
molecules on the solid surface, and it involves formation of bounds between the<br />
fluid molecules and metal atoms. These bounds imply overlapping of atomic and<br />
molecular orbital. If the overlapping <strong>de</strong>gree is higher, the capture of the phonon<br />
is more efficient, meaning that will increase the quantity of transferred energy.<br />
Also, the overlapping of the orbital allows an exchange of electrons between the<br />
molecules and atoms of metal, which means an energy exchange process.<br />
In this work we consi<strong>de</strong>r that the <strong>de</strong>gree of overlapping orbital is, in<br />
conformity with [2]:<br />
EB<br />
ms η =<br />
(1)<br />
Ems<br />
where:<br />
Em<br />
− m<br />
EBms =<br />
2<br />
0<br />
+ Es<br />
( 1 − CF<br />
) + −<br />
In which: CF Vs<br />
= 2 ( 1 −<br />
N<br />
)<br />
E ms<br />
A<br />
2<br />
γ P ( χ m WFs<br />
) (2)<br />
12 6<br />
⎡⎛<br />
σ ⎞ ⎛ σ ⎞ ⎤<br />
= 4ε<br />
⎢⎜<br />
⎟ −⎜<br />
⎟ ⎥<br />
(3)<br />
⎢⎣<br />
⎝ r ⎠ ⎝ r ⎠ ⎥⎦<br />
In equations (1 – 3) EBms is the energy of a hypothetical chemical bond of<br />
molecule with solid surface [12], Ems is the Lennard-Jones (LJ) 12-6<br />
potential energy between molecule and solid surface, Em-m is moleculemolecule<br />
bond energy, E o S – electron energy on surface, NA - a constant,<br />
WFS - work function of the metal surface (energy), r - current distance<br />
surface-molecule, Vs - valence of the solid, γP – a constant, χ - electronegativity,<br />
ε – LJ energy parameter, σ - LJ length parameter.<br />
Solid surface reconstruction<br />
The reconstruction of the surface of the metal should be un<strong>de</strong>rstood<br />
as a change in topography of the surface, imposed by the forces which act
MOLECULAR DYNAMICS SIMULATION OF THE HEAT …<br />
on the solid-fluid interface during the convection heat transfer [13]. Un<strong>de</strong>r<br />
the action of such forces, <strong>de</strong>ep <strong>de</strong>fects and high <strong>de</strong>fects are continuing to<br />
appear on the solid surface. The probability with which an atom of a crystal<br />
forms a high <strong>de</strong>fect is given by Boltzmann factor:<br />
Ed −<br />
K T<br />
B P = e<br />
(4)<br />
In which: Ed is the energy of displacement of a particle, KB - Boltzmann<br />
constant, T - absolute temperature.<br />
If there are NS atoms per unit area of solid, the number nS of <strong>de</strong>fects is:<br />
N<br />
ES<br />
n −<br />
S<br />
KB<br />
T<br />
S<br />
− n<br />
S<br />
= e<br />
But nS is much smaller than NS and then we can write:<br />
n<br />
S<br />
S<br />
ES<br />
−<br />
KB<br />
T<br />
(5)<br />
= N e<br />
(6)<br />
The high <strong>de</strong>fects appear together with the Schottky <strong>de</strong>fects too, by<br />
bringing of an atom from the crystal at surface. The number of these<br />
<strong>de</strong>fects, in a similar way, is expressed as follows:<br />
n<br />
V<br />
V<br />
EV<br />
−<br />
K B T<br />
= N e<br />
(7)<br />
In which: EV is the energy necessary to transport an atom from insi<strong>de</strong> of the<br />
crystal to the surface, and NV - the number of atoms insi<strong>de</strong> unit volume per<br />
unit surface. The total number of high <strong>de</strong>fects on the solid surface, in<br />
thermal equilibrium, is:<br />
n = n + n<br />
(8)<br />
T<br />
Mathematical mo<strong>de</strong>l<br />
On the base of the physical mo<strong>de</strong>l, presented above, was formulated<br />
the mathematical mo<strong>de</strong>l, taking into account all this elementary processes<br />
and the assumptions which follow:<br />
- the temperature of the surface of the wall is constant;<br />
- in solid, the transversal acoustic phonons are only consi<strong>de</strong>red;<br />
- the attractive and repulsive forces, presented above, are electrostatic<br />
in nature.<br />
Mathematical mo<strong>de</strong>l is formed, mainly, from equations (1-11).<br />
The convection heat transfer coefficient is expressed in the classical way:<br />
S<br />
V<br />
219
SOARE GHEORGHE<br />
Q<br />
α =<br />
(9)<br />
A<br />
( t − t )<br />
In equation (9), A is the heat transfer area, Q – heat flow rate, tw –<br />
temperature of the surface of the wall, and tf - fluid temperature.<br />
The heat flow rate is the energy of the absorbed phonons in the<br />
interval of time in which the molecules are adsorbed on the solid surface.<br />
The energy of a phonon is:<br />
The basis of the calculations<br />
In or<strong>de</strong>r to calculate the convection heat transfer coefficient it was<br />
consi<strong>de</strong>red the surface of copper Cu (001), a face-centered-cubic metal.<br />
On this surface high <strong>de</strong>fects are placed in the four tips of a square. In our<br />
simulations, we consi<strong>de</strong>red that all high <strong>de</strong>fects are in the same form and<br />
contain the same number of atoms, namely 50 atoms in a conical<br />
arrangement with four layers. The surface of the copper is in a process of<br />
restructuring and the number of <strong>de</strong>fects is a function of temperature, as<br />
equations (6) and (7) show, and the topological data of the surface are in a<br />
continuous change when temperature changes. The <strong>de</strong>fects can diffuse<br />
over copper surface [14]. Rising of the temperature leads to rising of the<br />
number of <strong>de</strong>fects, but the form and dimensions of the <strong>de</strong>fects are<br />
conserved. It was not taken into account reduction in the number of <strong>de</strong>fects<br />
(active centres) by the phenomenon of self-coalescence. In or<strong>de</strong>r to<br />
calculate the force which acts on the clusters we consi<strong>de</strong>red the closest 25<br />
active centres around a cluster. The molecules of liquid form cluster with<br />
variables size. The energy of the clusters was calculated with a Lennard-Jones<br />
220<br />
w<br />
f<br />
ε = hυ<br />
(10)<br />
In which: h is Plank constant and υ - phonon frequency.<br />
The time in which the molecules of fluid are adsorbed on the surface is<br />
calculated with velocity of the molecules. The velocity is a result of the<br />
forces which act on the molecules [3].<br />
The coverage <strong>de</strong>gree xa of metal surfaces by adsorption molecules of liquid<br />
has been calculated with a specific equation [17]:<br />
x<br />
a<br />
=<br />
k0<br />
⎛ Ea<br />
⎞<br />
exp<br />
⎜<br />
⎟<br />
T ⎝ K B T ⎠<br />
(11)<br />
In which: k0 is a constant, T - absolute temperature and Ea – adsorption energy.<br />
The equation inclu<strong>de</strong>s the influence of temperature, so that coverage<br />
of the surface with adsorbed molecules of liquid is a function of both the<br />
temperature and the topology of the surface of the wall.
MOLECULAR DYNAMICS SIMULATION OF THE HEAT …<br />
potential, and the energy of adsorption metal-cluster was calculated with a<br />
Lennard-Jones potential too, [6] and [15]. The number of molecules in an<br />
adsorbed cluster on the surface <strong>de</strong>creases because of the shear stress that<br />
appears during of the flowing. In the dynamic simulation of their diffusion, the<br />
liquid clusters have a rectilinear trajectory and the velocity is a function of time.<br />
Results of simulations<br />
The convection heat transfer coefficient was calculated with an own<br />
computer program of calculation, based on the mathematical mo<strong>de</strong>l <strong>de</strong>scribed<br />
above, and using MATLAB programming language. The heat transfer<br />
process by natural convection from the surface of Cu (001) to water was<br />
simulated. Calculus of the convection heat transfer coefficient was ma<strong>de</strong> in<br />
the assumption that water forms linear clusters with 6 molecules<br />
(hexamers), which are oriented perpendicularly to the surface of heat<br />
transfer. Figure 3 shows the convection heat transfer coefficient as a<br />
function of difference between the solid temperature and the liquid temperature.<br />
Values obtained with the classical equations (12, 13) [16], and those<br />
obtained with the proposed mo<strong>de</strong>l are in good harmony.<br />
1/<br />
4 ( Gr Pr)<br />
4<br />
for 10 < Pr<br />
7<br />
10<br />
1/<br />
3<br />
. 15(<br />
Gr Pr)<br />
for Pr<br />
7<br />
10<br />
Nu = 0 . 54<br />
Gr <<br />
(12)<br />
Nu = 0 Gr ><br />
(13)<br />
Figure 3. Heat transfer coefficient by natural convection in the system water / Cu (001).<br />
221
222<br />
SOARE GHEORGHE<br />
The sinuosity of the curve obtained with the proposed mo<strong>de</strong>l in this<br />
work is due to the phenomenon of surface reconstruction and is frequently<br />
observed in experimental measurements.<br />
Figure 4. The restructuring of the copper surface quantitatively expressed by the<br />
number of active centres involved in the convection heat transfer.<br />
As noted above, surface reconstruction is the modification of copper<br />
surface topology as a result of the copper atoms diffusion to the surface.<br />
Increasing of the metal temperature leads to increasing of the number of<br />
high <strong>de</strong>fects, which are in fact cluster of atoms of copper. The result of the<br />
copper surface restructuring simulation is quantitatively expressed by the<br />
number of active centres involved in the convection heat transfer. Figure 4<br />
shows this phenomenon.<br />
But, increasing the number of active centres increase intensity of<br />
heat transfer process by natural convection, Figure 5.<br />
Through the phenomenon of surface reconstruction, the natural<br />
convection mechanism is similar to the mechanism of heat transfer in boiling.<br />
The intensity of the heat transfer in boiling increases with the difference<br />
temperature because the number of nucleation centres increases.
MOLECULAR DYNAMICS SIMULATION OF THE HEAT …<br />
Another issue consi<strong>de</strong>red is that of changing the thickness of adsorbed<br />
molecular layer, flowing on the surface solid. In the process of heat transfer,<br />
the thickness of the adsorbed fluid multilayer does not remain constant.<br />
Figure 5. Reconstruction of the surface affects intensity<br />
of the natural convection.<br />
We consi<strong>de</strong>red that water molecular clusters initially consist in six<br />
molecules linearly arranged. The thickness of this layer of molecules varies<br />
due the impulse transfer process, which implies a shear stress. Figure 6<br />
shows this change in thickness of the layer, for a difference between the<br />
temperature of the wall and the temperature of the water of 5K.<br />
The heat transfer coefficient data, presented above in Figure 3,<br />
were obtained, taking account changing in the thickness of the layer of<br />
water molecules adsorbed in the form of cluster. Results of simulations<br />
show that cluster mass strongly influences the convection heat transfer<br />
coefficient, i.e. increases with <strong>de</strong>creasing of the cluster’s mass.<br />
223
224<br />
SOARE GHEORGHE<br />
Figure 6. Changing the thickness of the water multilayer during<br />
of the convection heat transfer.<br />
This change in thickness of the multimolecular layer is similar to that<br />
of reducing the hydrodynamic boundary layer, known from boundary layer<br />
theory, when the flow changes from laminar regime to turbulent regime.<br />
CONCLUSIONS<br />
A physical and a mathematical mo<strong>de</strong>l of convection heat transfer, at<br />
molecular scale, were formulated.<br />
Using molecular dynamics method and with an own computer<br />
program, the convection heat transfer and the surface reconstruction of the<br />
Cu (001) were simulated. The convection system which was investigated is<br />
water on Cu (001). The mass and dimensions of the molecular clusters<br />
largely affect the rate of heat transfer. If the mass <strong>de</strong>creases, the convection<br />
heat transfer coefficient increases.<br />
The phenomenon of surface reconstruction, its influence on the<br />
intensity of convection heat transfer process, and continuously changing of<br />
the boundary layer thickness were outlined quantitatively.
MOLECULAR DYNAMICS SIMULATION OF THE HEAT …<br />
Simulation of the process at molecular scale emphasizes the<br />
conclusion that between the mechanism of natural convection and the<br />
mechanism of heat transfer in boiling there is an obvious similarity.<br />
The results of the simulations show that combining all these processes<br />
we can give a consistent prediction of the heat transfer coefficient by<br />
natural convection.<br />
Proposed mo<strong>de</strong>l is a more realistic image of the process of natural<br />
convection than the boundary layer theory.<br />
REFERENCES<br />
1. G. Soare, Proceedings of the 15-th International Congress of Chemical and<br />
Process Engineering 25-29 August 2002, Praha, Czech Republic.<br />
2. G. Soare, Proceedings of the 4-th European Congress of Chemical Engineering,<br />
21-25 Sept 2003, Granada, Spain.<br />
3. H. Xue, C. Shu, Int. J. Num. Meth. Heat Fluid Flow, 1999, 9, 60.<br />
4. J. Gao, W. D. Luedtke, D. Gourdon, M. Ruths, U. Landman, J. Phys. Chem. C,<br />
2004, 108, 3410.<br />
5. T. S. Cui, C. McCabe, P. T. Cummings, H. D. Cochran, J. Chem. Phys. 2003,<br />
118, 8941.<br />
6. G. He, M. H. Muser, M. O. Robbins, Science, 1999, 284, 1650.<br />
7. E. A., Jagla, Phys. Rev. Lett., 2002, 88, 5504.<br />
8. Z. R. Lei, J. A. Gellman, F. C. McFa<strong>de</strong>n, Langmuir, 2001, 17, 6240.<br />
9. E. Manias, I. Bitsanis, G. Hadziioannou, G. Ten Brinke, Langmuir, 1996,<br />
12, 4587.<br />
10. E. Manias, I. Bitsanis, G. Hadziioannou, G. Ten Brinke, Europhys. Lett.,<br />
1996, 33, 371.<br />
11. R. I. Masel, “Principles of Adsorption and Reaction on Solid Surfaces”,<br />
John Wiley & Sons, Inc., NY, 1996, chapter 3.<br />
12. M. Muser, O. M. Robbins, Phys. Rev. B, 2000, 61, 2335.<br />
13. C. Kittel, “Introduction to Solid State Physics”, 5-th Ed., John Wiley & Sons,<br />
Inc., NY, 1976, chapter 17.<br />
14. J. Yang, W. Hu, M. Xu, Applied Surface Science, 2008, 255, 1736.<br />
15. J. Shuz, O. J. Davies, Phys. Stat. Sol. A, 1983, 78, 595.<br />
16. P. F. Incropera, P. D. DeWitt, “Introduction to Heat Transfer”, John Wiley &<br />
Sons, Inc., NY, 2002, chapter 9.<br />
17. M. S. Pierce, K-C. Chang, D. C. Hennessy, V. Komanicky, A. Menzel, H.<br />
You, J. Phys. Chem. C. Lett., 2008, 112, 2231.<br />
225
STUDIA UNIVERSITATIS BABES-BOLYAI, CHEMIA, LIV, 1, 2009<br />
Dedicated to Professor Liviu Literat, at his 80 th anniversary<br />
SIMULATION OF A POLYMERIZATION LAMINAR<br />
FLOW REACTOR<br />
IONUł BANU ab , SORIN BÎLDEA a , GRIGORE BOZGA a ,<br />
JEAN-PIERRE PUAUX b<br />
ABSTRACT. The paper presents a simulation study of the methyl methacrylate<br />
solution polymerization process occurring in a laminar flow tubular reactor. The<br />
simulation results are evi<strong>de</strong>ncing the main particularities of the polymerization<br />
process induced by the laminar flow of the reaction mixture, as well as the<br />
practical suitability of this operating regime. The influence of the main process<br />
parameters on the reactor behavior is investigated. Also a comparison of the<br />
process simulation results obtained in laminar flow and plug flow assumptions<br />
is presented.<br />
Keywords: MMA polymerization, laminar flow reactor<br />
INTRODUCTION<br />
The poly-methyl methacrylate (PMMA) is a polymer with good optical<br />
and mechanical properties. Currently it is obtained by free-radical polymerization<br />
of the methyl methacrylate (MMA), which can be performed in batch or tubular<br />
reactors. Solution polymerization is a convenient technique to avoid the usual<br />
heat transfer difficulties specific for bulk polymerization. The usual solvents for<br />
polymerization of MMA are toluene [1, 2] and ethyl acetate [3, 4], while azobisisobutyronitrile<br />
(AIBN) or benzoyl peroxi<strong>de</strong> (BPO) are used as initiators. One of<br />
the difficulties in mo<strong>de</strong>ling MMA polymerization system is the <strong>de</strong>scription of<br />
diffusion phenomenon in viscous reaction mixture (the so-called gel effect or<br />
Trommsdorf effect) [5]. For bulk polymerization, the gel effect is important at<br />
high monomer conversions. For solution polymerization, it is significant at high<br />
monomer to solvent ratios. A complete study of the behavior of a MMA semibatch<br />
polymerization reactor with solvent and monomer addition in different<br />
operating conditions was published by Louie and Soong [6].<br />
a Universitatea Politehnica din Bucureşti, <strong>Facultatea</strong> <strong>de</strong> <strong>Chimie</strong> Aplicată <strong>şi</strong> ŞtiinŃa Materialelor,<br />
Str. Polizu, Nr. 1, RO-011061 Bucureşti, Romania, g_bozga@chim.upb.ro<br />
b Université <strong>de</strong> Lyon, Université Clau<strong>de</strong> Bernard, Lyon, France
228<br />
IONUł BANU, SORIN BÎLDEA, GRIGORE BOZGA, JEAN-PIERRE PUAUX<br />
The <strong>de</strong>scription of the mixture flow is one of the most important issues in<br />
the building of a mathematical mo<strong>de</strong>l for the polymerization processes<br />
taking place in tubular reactors. I<strong>de</strong>al flow mo<strong>de</strong>ls were used by Baillgou et<br />
Soong [7], Ponnuswamy et al [1] and Crowley et Choi [8]. They consi<strong>de</strong>red<br />
constant axial flow velocities with small corrections due to the <strong>de</strong>nsity<br />
change [7, 9]. The complexity of the kinetic mechanism and the heat<br />
transfer which is hin<strong>de</strong>red by the varying viscosity also make difficult the<br />
<strong>de</strong>velopment of the mass and heat balance equations.<br />
It is well known that, on axial direction of a tubular reactor, the<br />
convective transport is dominant, while in the radial direction the transport by<br />
diffusion mechanism is more important. The validity of these hypotheses was<br />
verified in the published literature [10, 11]. Cintron-Cor<strong>de</strong>ro et al [12]<br />
<strong>de</strong>veloped a two-dimensional flow mo<strong>de</strong>l and compared the flow equations<br />
with or without the convective terms in radial direction. They observed that the<br />
errors are smaller than 3 % when the radial convection was neglected. Lynn et<br />
al [13] showed that the hypothesis of constant axial velocity will generate some<br />
errors due to the large variations in viscosity of the reaction mixture. They also<br />
proposed a method to calculate the pro<strong>file</strong> of the axial velocity in a twodimensional<br />
mo<strong>de</strong>l, which was implemented in other published studies<br />
(Wyman et Carter [14], Baillagou et Soong [2]). If the axial dispersion is taken<br />
into account, the solution is obtained by discretization of both axial and radial<br />
directions [9, 11]. If axial dispersion is not consi<strong>de</strong>red, the method of lines is<br />
commonly used for the discretization in radial direction [15].<br />
The objective of this study is to theoretically investigate the main<br />
features of the MMA solution polymerization process in a laminar flow tubular<br />
reactor. The kinetic mo<strong>de</strong>l for the MMA solution polymerization process was<br />
chosen in one of our previous papers [16] by reviewing the published kinetic<br />
mo<strong>de</strong>ls. Further it is used to solve the mathematical mo<strong>de</strong>l of MMA laminar<br />
flow polymerization reactor. The mathematical mo<strong>de</strong>l and the solution<br />
method are discussed. Afterwards, the results of the simulation study as<br />
well as the influence of various operating parameters on the reactor behavior<br />
are presented and analyzed.<br />
RESULTS AND DISCUSSIONS<br />
Mathematical mo<strong>de</strong>l of the MMA polymerization process in a<br />
laminar flow tubular reactor<br />
The polymerization technique investigated in this work is the<br />
steady state MMA polymerization in solution. The kinetic mo<strong>de</strong>l published<br />
by Baillagou and Soong [7, 17] is used. The gel effect is <strong>de</strong>scribed by the<br />
mo<strong>de</strong>l proposed by Chiu et al [5], the constitutive equations being<br />
presented in Table 1. The characteristics of the reactor are displayed in
SIMULATION OF A POLYMERIZATION LAMINAR FLOW REACTOR<br />
Table 2. Because of the strong exothermicity of the polymerization reaction,<br />
a high value of length to diameter ratio is chosen, which provi<strong>de</strong>s a sufficiently<br />
high heat transfer area.<br />
kt,0<br />
kt<br />
=<br />
; k<br />
kt,0θ<br />
tλ0<br />
1+<br />
D<br />
Table 1. Gel effect constitutive equations [17]<br />
ef<br />
p<br />
k p,0<br />
=<br />
k p,0θ pλ0<br />
1+<br />
D<br />
1<br />
θ t =<br />
18 ⎛ 17413 ⎞<br />
4.4533× 10 cI<br />
,0 exp⎜<br />
− ⎟<br />
⎝ T ⎠<br />
1<br />
θ p =<br />
15 ⎛ 14092 ⎞<br />
2.5292× 10 exp⎜<br />
− ⎟<br />
⎝ T ⎠<br />
ef<br />
( ) 2<br />
A = − × T − T ; B = 0.03<br />
−6<br />
0.168 8.21 10 gp<br />
;<br />
D<br />
Table 2. Reactor characteristics<br />
ef<br />
⎛ 2.3φ<br />
⎞ m<br />
= exp⎜<br />
⎟<br />
⎝ A + Bφm<br />
⎠<br />
Process parameter Numerical value<br />
Total mass flow rate / [kg/s] 10 -3<br />
Feed initiator concentration (cI0) / [mole/L] 0.05<br />
Toluene mass fraction in the feed 0.5<br />
Reactor length / [m] 8<br />
Reactor diameter (dt) / [m] 2×10 -2<br />
Feed temperature / [ O C] 80<br />
Thermal agent temperature / [ O C] 80<br />
The radial convection terms are ignored because the tube length is<br />
much larger than the radius. In the axial direction, mass diffusion and heat<br />
conduction are assumed to be negligible compared to the convective terms.<br />
Variations of monomer conversion and consequently of mixture viscosity<br />
and <strong>de</strong>nsity produce strong variations in the axial velocities. The flow is<br />
consi<strong>de</strong>red fully <strong>de</strong>veloped at the reactor entrance and the velocity pro<strong>file</strong>s<br />
along the reactor axis are calculated using the method proposed by Lynn<br />
and Huff [13]. The physical properties (<strong>de</strong>nsity, viscosity, thermal conductivity)<br />
of the reaction mixture are estimated using relations published in literature<br />
[2, 7, 17, 18].<br />
229
230<br />
IONUł BANU, SORIN BÎLDEA, GRIGORE BOZGA, JEAN-PIERRE PUAUX<br />
The mathematical mo<strong>de</strong>l of the polymerization process inclu<strong>de</strong>s the<br />
mass balance equations for initiator (1) and monomer (2), the equations<br />
<strong>de</strong>scribing the evolutions of the m-moments (m=0, 1, 2) of live and <strong>de</strong>ad<br />
polymer molecular weight distribution (3) and (4), as well as heat balance<br />
equation (5).<br />
∂c c ∂u 1 ⎛ D ∂c ∂ c ⎞ r<br />
∂z u ∂z u ⎝ r ∂r ∂r<br />
⎠ u<br />
2<br />
I = − I z + ⎜<br />
I + D I<br />
2 ⎟ + I<br />
z z z<br />
∂c c ∂u 1 ⎛ D ∂c ∂ c ⎞ r<br />
∂ ∂ ⎝ ∂ ∂ ⎠<br />
M M = −<br />
z u z<br />
z + ⎜<br />
z uz r<br />
M + D<br />
r<br />
2<br />
M M<br />
2 ⎟ +<br />
r uz<br />
∂λ λ ⎛ ∂λ ∂ λ ⎞ r<br />
∂z u ∂z u ⎝ r ∂r ∂r<br />
⎠ u<br />
m = − m ∂uz<br />
+<br />
1 D<br />
⎜<br />
m + D<br />
2<br />
m<br />
2 ⎟ +<br />
λm<br />
z z z<br />
∂μ μ ⎛ ∂μ ∂ μ ⎞ r<br />
∂z u ∂z u ⎝ r ∂r ∂r<br />
⎠ u<br />
m = − m ∂uz<br />
+<br />
1 D<br />
⎜<br />
m + D<br />
2<br />
m<br />
2 ⎟ +<br />
μm<br />
z z z<br />
∂T ⎛ k ∂T ∂ T ⎞<br />
= + +<br />
∂z ρc u ⎝ r ∂r ∂r<br />
⎠ ρc<br />
u<br />
1<br />
⎜ k<br />
2<br />
2 ⎟<br />
rT<br />
p z p z<br />
Axial symmetry, the absence of the mass transfer through the<br />
reactor wall and the continuity of heat flux at the reactor wall impose the<br />
following boundary conditions:<br />
r = 0 :<br />
∂cM ∂r ∂cI ∂λm ∂μm<br />
∂T<br />
= = = = = 0<br />
∂r ∂r ∂r ∂r<br />
r = R :<br />
∂cM ∂r ∂cI ∂λm ∂μm<br />
∂T<br />
U<br />
= = = = 0, =<br />
∂r ∂r ∂r ∂r<br />
k<br />
Tb −T<br />
The inlet boundary conditions are:<br />
( )<br />
z = 0 : c = c , c = c , λ = 0 , μ = 0 , T = T (7)<br />
M M 0 I I 0 m m f<br />
(1)<br />
(2)<br />
(3)<br />
(4)<br />
(5)<br />
(6)
SIMULATION OF A POLYMERIZATION LAMINAR FLOW REACTOR<br />
It is consi<strong>de</strong>red that the main resistance to the heat transfer occurs<br />
insi<strong>de</strong> the reactor. Therefore, the overall heat transfer coefficient, U, is<br />
approximated by the internal partial heat transfer coefficient calculated by<br />
the equation (8), where the variation of the viscosity at the wall is neglected<br />
and the ratio η / η p approaches unity [18]:<br />
0.8<br />
⎛ α d 0.19 ⎛ η ⎞<br />
t ⎞ Gz<br />
Nu ⎜ ⎟ = 3.66 + 0.467 ⎜ ⎟<br />
⎝ k ⎠ 1+ 0.177Gz<br />
⎜η ⎟<br />
⎝ p ⎠<br />
The generating terms rp (with p = I, M, λ m , μ m , T) in equations (1) -<br />
(5) are [1]:<br />
0.14<br />
(8)<br />
rI = − kdcI (9)<br />
( ) 0<br />
r = − k + k c λ<br />
(10)<br />
M p tm M<br />
r = fk c − k λ<br />
(11)<br />
λ<br />
0<br />
2 d I t<br />
2<br />
0<br />
( )( )<br />
rλ = fk c + k c λ + k c + k c λ − λ − k λ λ (12)<br />
2<br />
1 d I p M 0 tm M ts S 0 1 t 0 1<br />
( ) ( )( )<br />
rλ = 2 fk c + 2λ<br />
+ λ k c + k c + k c λ − λ − k λ λ (13)<br />
2 d I 1 0 p M tm M ts S 0 2 t 0 2<br />
0<br />
( ) ( 0.5 )<br />
rμ = k c + k c λ + k + k λ<br />
(14)<br />
tm M ts S 0 td tc<br />
2<br />
0<br />
( )<br />
rμ = k c + k c λ + k λ λ<br />
(15)<br />
1 tm M ts S 1 t 0 1<br />
( )<br />
rμ = k c + k c λ + k λ λ<br />
(16)<br />
2 tm M ts S 2 t 0 2<br />
In the energy balance, as generally accepted, only the heat<br />
generated in propagation reactions and chain transfer to monomer is<br />
consi<strong>de</strong>red [7, 17]:<br />
r = −Δ H k + k c λ<br />
(17)<br />
( ) 0<br />
T p p tm M<br />
231
232<br />
IONUł BANU, SORIN BÎLDEA, GRIGORE BOZGA, JEAN-PIERRE PUAUX<br />
The polymerization enthalpy,<br />
Δ H = − × , is taken<br />
p<br />
4<br />
5.48 10 J / mol<br />
from the reference [19]. The same diffusivity coefficient having a value of<br />
D = 10 -10 m 2 /s is used in equations (1) - (4) for all the species [2].<br />
In this work the <strong>de</strong>rivatives with respect to the radial direction are<br />
approximated by a second or<strong>de</strong>r finite difference scheme. After discretization,<br />
the equation (1) becomes:<br />
dc 1 1 ⎛ ∂u<br />
⎞ 1 r<br />
= c A + c − − B + c C +<br />
dz u u ⎝ z ⎠ u u<br />
M , i z, i M , i<br />
M , i+ 1 i M , i ⎜ i ⎟ M , i−1 i<br />
z, i z, i ∂<br />
z, i z, i<br />
Where the coefficients Ai, Bi, Ci are given by:<br />
D D 2D<br />
D D<br />
A = + ; B = − ; C = − + , i = 2,3,.., N<br />
( Δr) ( Δr ) ( Δr)<br />
i 2 i 2 i<br />
2<br />
2ri Δr 2ri<br />
Δr<br />
(18)<br />
(19)<br />
At i =1 the equation (1) becomes in<strong>de</strong>terminate since both r and<br />
∂cM<br />
be-come zero. Applying the l’Hospital rule and assuming symmetry<br />
∂r<br />
about the centerline [20]:<br />
4D 4D<br />
A = ; B = − ; C = 0<br />
( Δr) ( Δr)<br />
1 2 1 2 1<br />
To minimize the calculation effort, the <strong>de</strong>rivative<br />
approximated by finite difference ratios:<br />
∂u u − u<br />
=<br />
∂z z − z<br />
z, k z, k z, k −1<br />
k k −1<br />
∂u<br />
(20)<br />
z<br />
∂ z<br />
was<br />
(21)<br />
where k refers to integration steps in the axial direction.<br />
As a result, the original PDE’s were transformed into a system of<br />
ODE’s along the axial coordinate. The ODE’s were solved by a Runge-<br />
Kutta procedure method implemented in MATLAB ® [21].<br />
Reactor simulation<br />
In or<strong>de</strong>r to select the number of intervals on the radial coordinate, a<br />
comparison of different discretization grids was performed. Practically<br />
i<strong>de</strong>ntical results were obtained when the number of grid points was increased<br />
over 50. Therefore, a number of 50 radial points was chosen, as a compromise<br />
between accuracy and calculation effort.
SIMULATION OF A POLYMERIZATION LAMINAR FLOW REACTOR<br />
Figure 1. Pro<strong>file</strong>s for monomer conversion (left) and axial velocity (right),<br />
at different positions (z) along the reactor.<br />
Figure 2. Number-average molecular weights (left) and temperature (right)<br />
pro<strong>file</strong>s, at different positions (z) along the reactor.<br />
Figures 1 and 2 present simulation results for the reactor with<br />
characteristics given in Table 2. The radial conversion pro<strong>file</strong>s are relatively<br />
abrupt, with a fast transition from small values to almost complete<br />
conversion (Figure 1). As seen from Figure 1, two flowing zones are <strong>de</strong>veloped<br />
insi<strong>de</strong> the tubular reactor: a central zone where the fluid velocity is relatively<br />
high and a peripheral (plugged) zone where the fluid velocity is relatively<br />
low, approaching zero in the proximity of the wall. Consequently, the maximum<br />
resi<strong>de</strong>nce time occurs in the neighborhood of the wall, and minimum one in the<br />
center of tube. The differences in resi<strong>de</strong>nce times give monomer conversions<br />
that drastically vary in radial direction, with values smaller than 10 % in the<br />
central zone and nearly 100% in the peripheral zone.<br />
Figure 2 presents radial pro<strong>file</strong>s of the number average molecular<br />
weights and temperature. In the plugged region close to the wall the polymer<br />
number-average molecular weight drastically <strong>de</strong>creases. This could be explained<br />
233
234<br />
IONUł BANU, SORIN BÎLDEA, GRIGORE BOZGA, JEAN-PIERRE PUAUX<br />
by the small ratio of propagation to the termination rate, unfavorable to the<br />
formation of long chains, in the last two thirds of reactor length. Due to low<br />
amounts of monomer, the polymer radicals initiated in this region present a<br />
slow growth. Moreover, the high concentration of solvent promotes termination<br />
by chain transfer to solvent, finishing prematurely the newly produced chains.<br />
Due to the high ratio of heat transfer area to reaction volume, only a<br />
mo<strong>de</strong>rate rise of the reaction temperature along the reactor is observed<br />
(Figure 2). The radial temperature pro<strong>file</strong> presents a maximum, which moves<br />
from the neighborhood of the wall towards the center, as the axial position<br />
increases. This is explained by the heat generation rate, higher in the peripheral<br />
zone corresponding to the first meters of reactor length.<br />
Influence of heat transfer area<br />
To investigate the influence of the ratio between heat transfer area<br />
and reaction volume, the reactor diameter and length were varied keeping<br />
constant the mean resi<strong>de</strong>nce time (<strong>de</strong>fined as the ratio between the reactor<br />
volume and feed volumetric flow) of the reaction mixture through the<br />
polymerization reactor. The dimensions of the reactors used in these simulations<br />
are presented in Table 3, the other process parameters being specified in<br />
Table 2. In this section, only the results for extremes configurations are presented<br />
(Reactor 2 and Reactor 3), the others being already presented above.<br />
Table 3. Reactor configurations<br />
Reactor configuration Length, [m] Diameter, [m]<br />
Reactor 1 8 2 x 10 -2<br />
Reactor 2 2 4 x 10 -2<br />
Reactor 3 32 1 x 10 -2<br />
The results illustrated in Figures 3 to 5 prove that the reactor with high<br />
ratio of heat transfer area to reactor volume produces more homogenous final<br />
products and assures a more even thermal regime. The homogeneity is<br />
proved by the values of polydispersion in<strong>de</strong>x, a maximum value of 5 being<br />
obtained for Reactor 2 comparatively with a maximum value of 3 for Reactor 3.<br />
As seen from Figure 5, the temperature pro<strong>file</strong>s in Reactor 3 are<br />
more uniform due to a higher heat transfer area that is allowing a more<br />
efficient evacuation of the reaction heat. Moreover, the maximum value is<br />
located at the reactor centerline.<br />
Comparatively, the temperature pro<strong>file</strong>s in the Reactor 2 case<br />
present an evi<strong>de</strong>nt maximum, shifted to the centerline only with advancement<br />
of the polymerization mixture along the axial coordinate of the reactor. A<br />
rise in temperature of almost 3 °C for Reactor 3 pr oduces higher molecular<br />
weight polymer close to the reactor wall, due to the small influence of chain<br />
transfer to solvent reaction in this region.
SIMULATION OF A POLYMERIZATION LAMINAR FLOW REACTOR<br />
Figure 3. Radial pro<strong>file</strong>s of monomer conversion, at different positions along<br />
the reactor. Left: Reactor 2; Right: Reactor 3.<br />
Figure 4. Radial pro<strong>file</strong>s for number-average molecular weights, at different<br />
positions (z) along the reactor. Left: Reactor 2; Right: Reactor 3.<br />
=z / [m]<br />
z / [m]=<br />
Figure 5. Radial pro<strong>file</strong>s for temperature, at different positions (z)<br />
along the reactor. Left: Reactor 2; Right: Reactor 3.<br />
235
236<br />
IONUł BANU, SORIN BÎLDEA, GRIGORE BOZGA, JEAN-PIERRE PUAUX<br />
Influence of initiator concentration<br />
The initiator concentration has an important role in MMA polymerization,<br />
higher initiator concentrations producing polymers with lower molecular weights.<br />
Three values for the initiator concentrations (0.025, 0.05 and 0.1 mole/L)<br />
were tested for the Reactor 1 configuration (Table 3).<br />
Figure 6. Monomer conversion pro<strong>file</strong>s for initial initiator concentration<br />
of 0.025 mole/L (left) and 0.1 mole/L (right).<br />
Figure 7. Number average molecular weight pro<strong>file</strong>s for initial initiator<br />
concentration of 0.025 mole/L (left) and 0.1 mole/L (right).<br />
Small initiator concentrations lead to a low initiation rate, and<br />
consequently to a small number of live polymer chains. This has two effects:<br />
first, a <strong>de</strong>crease of propagation rate having as result a low monomer conversion<br />
on the first 2 m of the reactor (Figure 6); second, an important increase of<br />
final polymer molecular weight (Figure 7). Also a small propagation rate<br />
<strong>de</strong>creases the amount of heat generated (low temperature levels) with an
SIMULATION OF A POLYMERIZATION LAMINAR FLOW REACTOR<br />
increasing effect on the polymer molecular weight. Consequently, the initial<br />
initiator concentration proves to be an important parameter to control the<br />
final molecular weights of the polymer.<br />
Influence of solvent concentration<br />
It is well known that higher solvent fraction improves the heat<br />
transfer but also induces higher solvent separation costs. Three solvent<br />
mass fractions were tested for Reactor 1 configuration (Table 3).<br />
Figure 8. Monomer conversion pro<strong>file</strong>s for smallest (ws = 0.3, left) and highest<br />
(ws = 0.7, right) feed weight solvent fraction.<br />
Figure 9. Number-average molecular weight for smallest (ws = 0.3, left) and<br />
highest (ws = 0.7, right) feed solvent fraction.<br />
Increasing the fraction of solvent leads to lower reaction temperature<br />
through two mechanisms: a) less heat is generated due to lower amount of<br />
monomer; b) heat transfer through the wall is improved due to a lower<br />
resistance. Because the propagation step has a higher activation energy<br />
237
238<br />
IONUł BANU, SORIN BÎLDEA, GRIGORE BOZGA, JEAN-PIERRE PUAUX<br />
compared to the termination reactions, the conversion is lower (Figure 8)<br />
and shorter chains are obtained (Figure 9). Smaller monomer concentration<br />
additionally contributes to lower propagation rates, with the same effect.<br />
It should be remarked that increasing the solvent concentration<br />
leads to a polymer product with a more homogeneous molecular weight<br />
distribution. Thus, the polydispersion in<strong>de</strong>x is 7.65 and 2.27, for solvent<br />
fraction of 0.3 and 0.7, respectively.<br />
The simulation results presented above are evi<strong>de</strong>ncing that the<br />
velocity pro<strong>file</strong> of the laminar flow leads to a polymer of lower quality and<br />
the reactor volume is less efficiently used. This drawback becomes more<br />
important when the reaction mixture contains less solvent. The use of static<br />
mixers could change the velocity pro<strong>file</strong> in or<strong>de</strong>r to approach the i<strong>de</strong>al case<br />
of plug-flow. This will be analyzed in the following section.<br />
Comparison between laminar flow and plug flow reactor<br />
A comparison between the simulation results obtained in the plug<br />
flow and laminar flow assumptions was finally performed (Figure 10). For<br />
the laminar flow polymerization tubular reactor, the values of monomer<br />
conversion and number-average molecular weight presented here are<br />
averages over the reactor cross-section.<br />
Figure 10. Plug flow and laminar flow reactor simulated monomer conversion and<br />
Text, text, number-average text, text, text , text, molecular text, text, weights text axial , text, pro<strong>file</strong>s text, text, (Reactor text , 1).<br />
text, tex<br />
The two mo<strong>de</strong>ls predict similar values for the monomer conversion.<br />
However, the plug-flow reactor produces a polymer with a higher molecular<br />
weight and a narrow distribution (the polydispersion in<strong>de</strong>x of the final<br />
product is 2.13, compared to 3.21 for the laminar flow reactor). This is an<br />
argument for the practical effectiveness of static mixers in tubular reactors,<br />
in or<strong>de</strong>r to promote velocity pro<strong>file</strong>s that approach the plug-flow.
SIMULATION OF A POLYMERIZATION LAMINAR FLOW REACTOR<br />
CONCLUSIONS<br />
In this paper the mo<strong>de</strong>ling of a tubular reactor for MMA polymerization<br />
was performed, consi<strong>de</strong>ring laminar flow conditions. The influence of the<br />
main operating parameters (initiator and solvent concentration, heat transfer<br />
area) on the reactor behavior was studied.<br />
Small diameter reactors (large specific heat-transfer areas) are<br />
more efficient from the point of view of heat transfer, the radial temperature<br />
variations are smaller and a product with more homogenous molecular<br />
weight is obtained. However, the main drawback of a small diameter is the<br />
large pressure drop induced by high flow velocity.<br />
The results illustrate that laminar flow gives an inefficient utilization<br />
of the reaction volume, particularly at small solvent to monomer ratios. Due<br />
to low velocities near the wall, the polymer accumulates in this region and<br />
the heat transfer becomes less efficient.<br />
These inconveniences could be removed by a reactor with a relatively<br />
large diameter but equipped with static mixers which homogenize the reaction<br />
mixture and improve the radial heat transfer through the polymer layer.<br />
The trends of the main changes induced by the use of static mixers<br />
were evi<strong>de</strong>nced by a comparative simulation of the same process in a plug<br />
flow tubular reactor. A polymer with higher molecular weight and smaller<br />
polydispersion in<strong>de</strong>x was predicted in the plug-flow reactor simulation,<br />
practically at the same final monomer conversion.<br />
Symbols used<br />
cM [mole/L] monomer concentration<br />
cI [mole/L] initiator concentration<br />
cS [mole/L] solvent concentration<br />
dt [m] reactor diameter<br />
D, Def [m 2 /s] mass diffusion coefficients<br />
f [-] initiator efficiency<br />
Gz [-] Graetz number<br />
k [W·m -1 ·K -1 ] thermal conductivity<br />
kd [s -1 ] initiation rate constant<br />
kp, kp,0 [L·mole -1 ·s -1 ] chain propagation rate constant<br />
kt ,kt,0, ktc, ktd [L·mole -1 ·s -1 ] termination rate constant (global, by<br />
combination and by disproportionation,<br />
respectively)<br />
ktm [L·mole -1 ·s -1 ] chain transfer to monomer rate<br />
constant<br />
kts [L·mole -1 ·s -1 ] chain transfer to solvent rate constant<br />
Mn [kg/kmole] number-average molecular weight<br />
239
240<br />
IONUł BANU, SORIN BÎLDEA, GRIGORE BOZGA, JEAN-PIERRE PUAUX<br />
Nu [-] Nusselt number<br />
r [m] radial coordinate<br />
T, Tf, Tb [K] reaction, feed and jacket temperature<br />
uz [m·s -1 ] axial velocity<br />
z [m] axial coordinate<br />
Greek symbols<br />
α [W·m -2 ·K -1 ] partial heat transfer coefficient<br />
Δ H [J·mol -1 ] polymerization enthalpy<br />
p<br />
η [Pa·s -1 ] reaction mixture viscosity<br />
λm [-] m th or<strong>de</strong>r moments for free-radicals<br />
concentrations distribution (m = 0, 1, 2)<br />
µm [-] m th or<strong>de</strong>r moments for polymer<br />
concentrations distribution (m = 0, 1, 2)<br />
φm, φp [-] monomer and polymer volumetric<br />
fractions<br />
REFERENCES<br />
1. S. R. Ponnuswamy, "On-line measurements and control of a batch<br />
polymerization reactor", University of Alberta, Edmonton, 1984, 252.<br />
2. P. E. Baillagou, D. S. Soong, Polymer Engineering & Science, 1985, 25(4), 212.<br />
3. A. D. Schmidt, A.H. Ray, Chemical Engineering Science, 1981, 36, 1401.<br />
4. S.-M. Ahn, S.-P. Chang, H.-K. Rhee, Journal of Applied Polymer Science<br />
1998, 69, 59.<br />
5. W. Y. Chiu, G. M. Carrat, D.S. Soong, Macromolecules, 1983, 16, 348.<br />
6. B. M. Louie, D. S. Soong, Journal of Applied Polymer Science, 1985, 30, 3707.<br />
7. P. E. Baillagou, D. S. Soong, Chemical Engineering Science, 1985, 40(1), 75.<br />
8. T. J. Crowley, K. Y. Choi, Ind. Eng. Chem. Res., 1997, 36, 3676.<br />
9. A. Husain, A. E. Hamielec, AiChE Symposium Series, 1976.<br />
10. J. S. Vrentas, C. H. Chu, Chemical Engineering Science, 1987, 42(5), 1256.<br />
11. J. S. Vrentas, W. J. Huang, Chemical Engineering Science, 1986, 41(8), 2041.<br />
12. R. Cintron-Cor<strong>de</strong>ro, R. A. Mostello, J. A. Biesenberger, Can. J. Chem. Eng,<br />
1968, 46.<br />
13. S. Lynn, J. E. Huff, AIChE Journal, 1971, 17(2), 475.<br />
14. C. E. Wyman, L. F. Carter, AiChE Symposium Series, 1976.<br />
15. J. W. Hamer, W. H. Ray, Chemical Engineering Science, 1986, 41(12), 3083.<br />
16. I.Banu, G. Bozga, I. Nagy, J. P. Puaux, Chemical Engineering and Technology,<br />
2008, 31(10), 1516.
SIMULATION OF A POLYMERIZATION LAMINAR FLOW REACTOR<br />
17. P. E. Baillagou, D. S. Soong, Chemical Engineering Science 1985, 40(1), 87.<br />
18. R. H. Perry, D. W. Green, J. O. Maloney, "Perry's Chemical Engineer's<br />
Handbook", McGraw Hill, New York.1997, chapter 5.<br />
19. J. Brandrup, E. H. Immergut, E.A. Grulke, "Polymer Handbook" John Wiley<br />
and Sons, Inc., New York, 1999, section II.<br />
20. B. E. Nauman, "Chemical Reactor Design, Optimization, and Scale up",<br />
McGraw-Hill, 2002, chapter 8.<br />
21. The MathWorks, I., MATLAB Documentation, 1984-2008.<br />
241
STUDIA UNIVERSITATIS BABES-BOLYAI, CHEMIA, LIV, 1, 2009<br />
Dedicated to Professor Liviu Literat, at his 80 th anniversary<br />
ELECTROCHEMICAL BEHAVIOR AND APPLICATIONS OF<br />
PHENOTHIAZINE DERIVATIVES BASED ON BIS-(10H-<br />
PHENOTHIAZIN-3-YL)-METHANE<br />
ALEXIA BONNIFET a , DELIA GLIGOR b , CASTELIA CRISTEA b<br />
LIANA MARIA MUREŞAN b<br />
ABSTRACT. The electrochemical behavior of two phenothiazine <strong>de</strong>rivatives,<br />
bis-(10H-phenothiazin-3-yl)-methane (I) and 1,1-bis-(10H-phenothiazin-3-yl)ethane<br />
(II), was studied comparatively by cyclic voltammetry in dimethylsulfoxi<strong>de</strong><br />
solution and adsorbed on graphite electro<strong>de</strong>s. Compound I presents a more<br />
favorable electrochemical behavior than compound II, both in solution or<br />
adsorbed. The obtained modified electro<strong>de</strong>s present electrocatalytic activity<br />
towards NADH oxidation. Their electrocatalytic efficiency, evaluated from cyclic<br />
voltammetry, revealed the following <strong>de</strong>creasing sequence: I > II.<br />
Keywords: Phenothiazine <strong>de</strong>rivatives, Modified electro<strong>de</strong>s, NADH electrocatalytic<br />
oxidation.<br />
INTRODUCTION<br />
The employment of various organic compounds as mediators in<br />
facilitating electron transfer from enzyme molecules to electro<strong>de</strong> surface<br />
including phenothiazine <strong>de</strong>rivatives has been reported in the literature [1]. It<br />
is known that phenothiazine <strong>de</strong>rivatives, a pharmaceutically important class<br />
of heterocycles, with electron-rich sulfur and nitrogen heteroatoms, have<br />
been used as electron donor components. [2].<br />
The cyclic voltammetric responses for phenothiazine <strong>de</strong>rivatives adsorbed<br />
onto graphite electro<strong>de</strong>s recommend them for the low potential, sensitive and<br />
stable <strong>de</strong>termination of dihydronicotinami<strong>de</strong> a<strong>de</strong>nine dinucleoti<strong>de</strong> (NADH) [3-7].<br />
The <strong>de</strong>termination of NADH is very important because NADH and its<br />
oxidized form, NAD + , are the coenzymes for a large number of <strong>de</strong>hydrogenase<br />
a Université <strong>de</strong> Rouen, I.U.T. <strong>de</strong> Rouen, Mont-Saint-Aignan, France<br />
b Universitatea Babeş-Bolyai, <strong>Facultatea</strong> <strong>de</strong> <strong>Chimie</strong> <strong>şi</strong> <strong>Inginerie</strong> <strong>Chimică</strong>, Str. Kogălniceanu,<br />
Nr. 1, RO-400084 Cluj-Napoca, Romania, limur@chem.ubbcluj.ro
244<br />
ALEXIA BONNIFET, DELIA GLIGOR, CASTELIA CRISTEA, LIANA MARIA MUREŞAN<br />
enzymes (more than 300) and components of biomarker systems. However,<br />
the direct electrochemical oxidation of NADH at a bare electro<strong>de</strong> takes<br />
place at high overpotential. So, much effort has been <strong>de</strong>voted to reduce the<br />
overpotential of the oxidation of NADH by using redox mediators, including<br />
phenothiazine <strong>de</strong>rivatives [8].<br />
In this context, the aim of this work is the study of the electrochemical<br />
properties of two new phenothiazine <strong>de</strong>rivatives, bis-(10H-phenothiazin-3yl)-methane<br />
(I) and 1,1-bis-(10H-phenothiazin-3-yl)-ethane (II), in solution and<br />
adsorbed on graphite electro<strong>de</strong>s as possible mediators for NADH oxidation.<br />
Cyclic voltammetry measurements (CV) were used to investigate the<br />
electrochemical behavior of compounds I and II un<strong>de</strong>r various experimental<br />
conditions (different potential scan rates). The modified electro<strong>de</strong>s obtained<br />
by adsorption of these new phenothiazine <strong>de</strong>rivatives on graphite electro<strong>de</strong>s<br />
were tested for electrocatalytic oxidation of NADH.<br />
RESULTS AND DISCUSSION<br />
Electrochemical behavior of compounds in solution<br />
Variable experimental conditions (pH, and scan rates) were employed<br />
for the investigation of the electrochemical behavior of compounds I and II by<br />
CV in DMSO solution. Figure 1 presents the cyclic voltammograms obtained<br />
for compounds I and II in DMSO solution, on graphite electro<strong>de</strong>s. The cyclic<br />
voltammograms are characterized by two peak pairs, with formal standard<br />
potential vs. Ag/AgCl/KClsat in the positive domain (Table 1).<br />
I / μA<br />
100<br />
0<br />
A<br />
-100<br />
0 400 800 1200<br />
E / mV vs. Ag/AgCl/KCl sat<br />
I / μA<br />
100 B<br />
0<br />
0 400 800 1200<br />
E / mV vs. Ag/AgCl/KCl sat<br />
Figure 1. Cyclic voltammograms recor<strong>de</strong>d on graphite electro<strong>de</strong> for compounds I<br />
(A) and II (B), dissolved in DMSO. Experimental conditions: starting potential, 0 mV<br />
vs. SCE; potential scan rate, 10 mV s -1 ; supporting electrolyte, dimethylsulfoxi<strong>de</strong> +<br />
10 -1 M KCl, pH 7.
ELECTROCHEMICAL BEHAVIOR AND APPLICATIONS …<br />
Table 1. Electrochemical parameters of the voltammetric response of compounds<br />
I-II in solution. Experimental conditions: as in Figure 1<br />
Compound Peak Epa (mV)* Epc (mV)* ΔEpeak (mV)<br />
I<br />
II<br />
* mV vs. Ag|AgCl/KClsat<br />
1 349 208 141<br />
2 722 602 120<br />
1 290 212 78<br />
2 667 543 124<br />
The first oxidation peak, may be assigned to one-electron oxidation<br />
leading to the formation of a stable radical cation (labeled a in Scheme 1)<br />
generated by one phenothiazine structural unit present in the molecular<br />
structure (EI 0/+1 = 349 mV and EII 0/+1 = 290 mV). The second oxidation peak<br />
appears shifted anodically (EI 0/+2 = 722 mV and EII 0/+2 = 667 mV) and may be<br />
assigned to two-electron oxidation leading the formation of phenazathionium<br />
cation (labeled b in Scheme 1). These oxidation potentials values are in<br />
agreement with the reported electrochemical data for unsubstituted<br />
phenothiazine (E 0/+1 = 270 mV and E 0/+2 = 750 mV vs. Ag/AgCl/KClsat [9]. In the<br />
CV of compound I, presented in figure 1, a peak characterized by lower current<br />
intensities appears at intermediate values (aprox. 500 mV) and could be<br />
assigned to the formation of a bis-radical-cation (labeled c in Scheme 1).<br />
Scheme 1<br />
The values of ΔEpeak showed that compounds I and II presents<br />
irreversible electrochemical behavior (∆Ep > 59 mV) on graphite.<br />
A small positive shift of the Epa values for compound I was observed<br />
(see Table 1) as compared with compound II, suggesting that the latter is<br />
245
246<br />
ALEXIA BONNIFET, DELIA GLIGOR, CASTELIA CRISTEA, LIANA MARIA MUREŞAN<br />
oxidized easier taking benefit of a weak inductive electron donor effect of<br />
the alkyl substituent.<br />
Electrochemical behavior of adsorbed compounds<br />
Figure 2 shows the voltammetric response corresponding to<br />
compounds I and II, adsorbed on the surface of graphite electro<strong>de</strong>, in a<br />
phosphate buffer solution (pH 7). The voltammogram of compound I<br />
(Figure 2A) shows one well-<strong>de</strong>fined peak pair and one oxidation shoul<strong>de</strong>r.<br />
The oxidation waves can be assigned to the formation of stable radical<br />
cations generated by the two phenothiazine structural units present in the<br />
molecular structure. The first oxidation wave (Epa 0/+1 = 89 mV vs. SCE) can<br />
be assigned to the radical cation formation of one phenothiazine unit in the<br />
molecular structure. The shoul<strong>de</strong>r (Epa +1/+2 = 400 mV vs. SCE), involving the<br />
oxidation of the phenothiazinium radical cation to the bis-phenothiazinium<br />
dication appears shifted anodically and it is characterized by a much lower<br />
current intensity, may be due to the electron withdrawing effect induced by<br />
the positive charge in the radical cation.<br />
Figure 2B shows the cyclic voltammograms of compound II containing<br />
a principal oxidation peak Epa 0/+1 situated close to 5 mV vs. SCE. Thus,<br />
compound II appear to un<strong>de</strong>rgo oxidation processes slightly easier as<br />
compared to the compound I, presenting the same behavior as in solution.<br />
I / μA<br />
A<br />
E / mV vs. SCE<br />
-400 0 400<br />
Figure 2. Cyclic voltammograms of compounds I (A) and II (B) adsorbed on<br />
graphite. Experimental conditions: starting potential, -500 mV vs. SCE; potential<br />
scan rate, 50 mV s -1 (A) and 10 mV s -1 (B); supporting electrolyte, 0.1 M phosphate<br />
buffer, pH 7.<br />
I / μμA<br />
10<br />
0<br />
-10<br />
-20<br />
B<br />
E / mV vs. SCE
ELECTROCHEMICAL BEHAVIOR AND APPLICATIONS …<br />
The voltammetric behavior of compounds I and II, characterized by the<br />
electrochemical parameters summarized in Table 2, points out to an<br />
irreversible process (ΔEp > 59 mV), for each investigated compound. The<br />
values of the standard formal potentials E 0’ show greater values for<br />
compounds I and II in comparison with pure phenothiazine, which is<br />
characterized by standard formal potential value E 0’ = -107 mV vs. SCE, in the<br />
same experimental conditions. This fact suggests the more difficult oxidation of<br />
both studied compounds as compared to the parent unsubstituted<br />
phenothiazine. This behavior can be explained by the bigger size of compound<br />
I and its different steric orientation towards the electro<strong>de</strong> surface and reflects<br />
the increased stability of compound I. It can be observed also from Table 2<br />
that the supplementary substitution with methyl groups of compound II leads to<br />
a <strong>de</strong>crease of ΔEpeak although compound I exhibits the relative current ratio<br />
Ipa/Ipc close to one, specific to adsorbed conditions [10].<br />
Table 2. Electrochemical parameters of the voltammetric response for graphite<br />
electro<strong>de</strong>s modified with compounds I-II. Experimental conditions: scan rate, 10<br />
mV s -1 ; supporting electrolyte 0.1 M phosphate buffer, pH 7<br />
Compound Epa (mV)* Epc (mV)* ΔEpeak<br />
(mV)<br />
E 0’<br />
(mV)<br />
EFWHM (mV)<br />
anodic cathodic<br />
Ipa/Ipc<br />
I 89 -59 148 15 206 169 1.00<br />
II 5 -95 100 -45 200 107 3.82<br />
* mV vs. SCE<br />
As expected for surface confined redox species [11], the cyclic<br />
voltammograms recor<strong>de</strong>d in a wi<strong>de</strong> range of potential scan rates (10-400<br />
mV s -1 ) showed a linear <strong>de</strong>pen<strong>de</strong>nce of the peak currents (Ip) on the<br />
electro<strong>de</strong> potential scan rate (v) (results not shown), for compounds I and II<br />
adsorbed on graphite electro<strong>de</strong>s. The slopes of the log Ip vs. log v plots for<br />
the compounds I and II were close to the theoretical value (1), in phosphate<br />
buffer pH 7.<br />
For both studied compounds, the width at half peak height (EFWHM)<br />
was different to that corresponding to the i<strong>de</strong>al case (EFWHM = 90.6/n mV,<br />
where n is the number of electrons). The observed discrepancies prove the<br />
existence of repulsive interactions between the adsorbed redox species<br />
(radical cations generated in the anodic process) [11,12]. Additionally, as<br />
expected for lateral interaction [10], it was noticed that the peak parameters<br />
were affected by the surface coverage.<br />
247
248<br />
ALEXIA BONNIFET, DELIA GLIGOR, CASTELIA CRISTEA, LIANA MARIA MUREŞAN<br />
In conclusion, compound I presents a more favorable electrochemical<br />
behavior than compound II, both in solution and adsorbed on graphite<br />
electro<strong>de</strong>s.<br />
Electrocatalytic activity for NADH oxidation<br />
Starting from the favorable electrochemical behavior of the<br />
compounds I and II adsorbed on graphite, their electrocatalytic activity<br />
towards NADH oxidation was tested by CV. As can be seen from Figure 3,<br />
an enhancement of the anodic peak current, observed in the NADH<br />
presence, associated with the progressive diminishing of the cathodic one,<br />
proved the electrocatalytic effect for compounds I and II. The electrocatalytic<br />
efficiency, estimated as the ratio (Icat)NADH/(Icat) was found <strong>de</strong>creasing in the<br />
following sequence: I (1.70, measured at -38 mV vs. SCE) > II (1.12,<br />
measured at +28 mV vs. SCE).<br />
I / μA<br />
A<br />
Figure 3. Cyclic voltammograms of compounds I (A) and II (B) adsorbed on<br />
graphite electro<strong>de</strong>s, in absence and in presence of NADH 5 M. Experimental<br />
conditions: starting potential, –200 mV vs. SCE (A) and –500 mV vs. SCE (B); scan<br />
rate, 10 mV s -1 ; supporting electrolyte, 0.1 M phosphate buffer, pH 7.0.<br />
CONCLUSIONS<br />
E / mV vs. SCE<br />
By comparing the electrochemical behavior of two new<br />
phenothiazine <strong>de</strong>rivatives, bis-(10H-phenothiazin-3-yl)-methane (I) and 1,1-bis-<br />
(10H-phenothiazin-3-yl)-ethane (II), it was put on evi<strong>de</strong>nce that compound I is<br />
more difficult to oxidize than compound II, on graphite electro<strong>de</strong>s. in the same<br />
experimental conditions (in solution and in adsorbed state). However, the<br />
catalytic efficiency of compound I adsorbed on graphite toward NADH<br />
oxidation was better than that of compound II. Both graphite electro<strong>de</strong>s<br />
I / μA<br />
B<br />
E / mV vs. SCE
ELECTROCHEMICAL BEHAVIOR AND APPLICATIONS …<br />
modified with compounds I and II present electrocatalytic effect towards<br />
NADH oxidation.<br />
EXPERIMENTAL SECTION<br />
Materials<br />
Bis-(10H-phenothiazin-3-yl)-methane (I) and 1,1-bis-(10H-phenothiazin-<br />
3-yl)-ethane (II) (Scheme 2) are the two phenothiazine <strong>de</strong>rivatives used for<br />
electrochemical studies.<br />
H<br />
N<br />
S<br />
H<br />
N<br />
H<br />
N<br />
S<br />
S<br />
I II<br />
Scheme 2<br />
The supporting electrolyte for voltammetric measurements in solution<br />
was dimethylsulfoxi<strong>de</strong> (DMSO, Merck, Darmstadt, Germany) containing 0.1 M<br />
KCl and for adsorbed system, phosphate buffer solutions. Phosphate buffer<br />
solutions were prepared using Na2HPO4·2H2O and NaH2PO4·H2O from<br />
Merck (Darmstadt, Germany).<br />
β-Nicotinami<strong>de</strong> a<strong>de</strong>nine dinucleoti<strong>de</strong>, reduced form (NADH) was<br />
purchased from Sigma (St. Louis, MO, USA) as disodium salt. All other<br />
reagents were of analytical gra<strong>de</strong> and used as received.<br />
Synthesis and characterization<br />
Bis-(10H-phenothiazin-3-yl)-methane (I) was synthesized by the<br />
con<strong>de</strong>nsation of phenothiazine with formal<strong>de</strong>hy<strong>de</strong> according to previously<br />
reported procedures [13]. 1,1-bis-(10H-phenothiazin-3-yl)-ethane (II) was<br />
synthesized according to similar procedures by the con<strong>de</strong>nsation of<br />
phenothiazine with acetal<strong>de</strong>hy<strong>de</strong> in the presence of catalytic amounts of<br />
methanesulfonic acid (Scheme 3).<br />
Scheme 3<br />
H<br />
N<br />
S<br />
249
250<br />
ALEXIA BONNIFET, DELIA GLIGOR, CASTELIA CRISTEA, LIANA MARIA MUREŞAN<br />
The structure assignment of I and II is supported by spectroscopic<br />
data. FT-IR spectroscopy indicates the stretching vibration of N-H bonds by<br />
the absorption band situated at about 3330 cm -1 . In particular, II can be clearly<br />
i<strong>de</strong>ntified by the appearance of the aliphatic protons in NMR spectra. 300 MHz<br />
1 H-NMR spectrum shows a quartet signal situated at 4.5 ppm and a doublet<br />
signal situated 1.22 ppm for the four protons of the ethyli<strong>de</strong>ne group. For the<br />
NH groups in the two equivalent phenothiazine units the signal of the protons<br />
appears situated at 8.5 ppm. The substitution in position 3 of the phenothiazine<br />
units was assigned according to the aromatic protons coupling pattern<br />
observed for the signals situated in the 6.5-7 ppm range in the<br />
homocorrelation COSY–45 spectrum.<br />
NMR spectra were recor<strong>de</strong>d using a 300 MHz Brucker NMR<br />
spectrometer.<br />
FT-IR spectra were recor<strong>de</strong>d using a Brucker Vector 22 FT-IR<br />
spectrometer.<br />
1,1-Bis-(10H-phenothiazin-3yl)-ethane (II)<br />
10H-phenothiazine (2.5 mmol) solved in ethanol (20 mL), acetal<strong>de</strong>hy<strong>de</strong><br />
(1 mmol) and methanesulfonic acid (1 mL) were heated to reflux for 12 hours<br />
and generated a green precipitate which was filtered. The precipitate was<br />
thoroughly washed with cold ethanol and then it was solubilized in<br />
tetrahidrofurane. The insoluble part was removed by filtration. After removing<br />
the solvent, 0.25 g green precipitate was obtained (yield 60%).<br />
1 H-NMR (300MHz, DMSO-d6): δ=1.22 ppm (d, 3H), 4.50 ppm (q, 1H),<br />
6.66 ppm (d, J=6.20 Hz, 2H), 6.76 ppm (d, J=6 Hz, 2H), 6.79 (m, 4H), 6.82 (d,<br />
J=6.2 Hz, 2H), 6.96 ppm (d, J=5.8 Hz, 2H), 7.05 (t, 2H), 8.52ppm (s, 2H).<br />
Electro<strong>de</strong>s preparation<br />
A spectrographic graphite rod (Ringsdorff-Werke, GmbH, Bonn-Bad<br />
Go<strong>de</strong>sberg, Germany), of ~ 3 mm diameter, was wet polished on fine (grit 400<br />
and 600) emery paper (Buehler, Lake Bluff, Ill., USA). Then, a graphite piece<br />
of suitable length was carefully washed with <strong>de</strong>ionized water, dried, and finally<br />
press-fitted into a PTFE hol<strong>de</strong>r in or<strong>de</strong>r to obtain a graphite electro<strong>de</strong> having,<br />
in contact with the solution, a flat circular surface of ~ 0.071 cm 2 .<br />
The modified graphite electro<strong>de</strong>s were obtained by spreading onto<br />
the electro<strong>de</strong> surface 2 µl of 1 mM phenothiazine <strong>de</strong>rivative solution in<br />
dimethylsulfoxi<strong>de</strong> and leaving them for 20 minutes at room temperature to<br />
evaporate the solvent. Before immersion in the test solution the modified<br />
electro<strong>de</strong>s were carefully washed with <strong>de</strong>ionized water.
ELECTROCHEMICAL BEHAVIOR AND APPLICATIONS …<br />
Electrochemical measurements<br />
CV measurements were carried out in a conventional three-electro<strong>de</strong><br />
electrochemical cell. A saturated calomel electro<strong>de</strong> (SCE) served as reference<br />
electro<strong>de</strong> and a coiled Pt wire served as counter electro<strong>de</strong>. The cell was<br />
connected to computer-controlled voltammetric analyzers (Autolab-<br />
PGSTAT10, Eco Chemie, Utrecht, Netherlands or Voltalab, Radiometer).<br />
ACKNOWLEDGMENTS<br />
Financial support from CNCSIS (Project ID_512) is gratefully<br />
acknowledged.<br />
REFERENCES<br />
1. Y. E. Sorunmu, M. Nguyen, J. P. Sapp, W. Gorski, T. D. Phan, X. Wei,<br />
Electroanalysis, 2006, 18, 2375.<br />
2. L. Yang, J.-K. Feng, A.-M. Ren, J. Org. Chem., 2005, 70, 5987.<br />
3. J. Kulys, G. Gleixner, W. Schuhmann, H. L. Schmidt, Electroanalysis, 1993,<br />
5, 201.<br />
4. A. A. Karyakin, E. E. Karyakina, W. Schuhmann, H. L. Schmidt, S. D.<br />
Varfolomeyev, Electroanalysis, 1994, 6, 821.<br />
5. D. Dicu, L. Muresan, I. C. Popescu, C. Cristea, I. A. Silberg, P. Brouant,<br />
Electrochim. Acta, 2000, 45, 3951.<br />
6. D. Gligor, L. Muresan, I. C. Popescu, I. A. Silberg, Rev. Roum. Chim., 2002,<br />
47, 953.<br />
7. D. Gligor, L. Muresan, I. C. Popescu, I. A. Silberg, Rev. Roum. Chim., 2003,<br />
48, 463.<br />
8. S. A. Kumar, S.-M. Chen, Sensors, 2008, 8, 739.<br />
9. J. P. Billon, Bull. Soc. Chim. Fr., 1960, 1784.<br />
10. M. J. Honeychurch, G. A. Rechnitz, Electroanalysis, 1998, 5, 285.<br />
11. R. W. Murray, "Techniques of Chemistry", Wiley, 1992, chapter XXII.<br />
12. E. Laviron, L. Roulier, J. Electroanal. Chem., 1979, 101, 19.<br />
13. C. Cristea, G. Cormos, D. Gligor, I. Filip, L. Muresan, I. C. Popescu, J.<br />
New Mat. Electrochem. Sys., accepted, 2008.<br />
251
STUDIA UNIVERSITATIS BABES-BOLYAI, CHEMIA, LIV, 1, 2009<br />
Dedicated to Professor Liviu Literat, at his 80 th anniversary<br />
MINERALOGY OF DEGRADATION PROCESSES<br />
AFFECTING THE MORTAR FROM BURU DAM (ARIEŞULUI<br />
VALLEY, CLUJ COUNTY)<br />
NICOLAE HAR a , MARIA GOREA b , MARCEL BENEA a<br />
ABSTRACT. The objective un<strong>de</strong>r study is represented by the dam construction<br />
work across Arieş River on the area of Buru locality (Cluj County). The mortar<br />
used in dam construction is affected by carbonation, sulphates attack and alkalisilica<br />
reactions. Carbonation is materialized by calcite precipitation in matrix<br />
mortar, visible as efflorescences on surface and along the fissures within the<br />
mortar. Sulphate attack results in ettringite II genesis, located in the pores of the<br />
mortar. The alkali-silica reactions lead to the formation of silica gels <strong>de</strong>posited on<br />
the internal walls of the pores where they progressively crystallize and turn into<br />
cryptocrystalline silica. There are various causes for alteration processes, from<br />
atmospheric factors to the microenvironment resulted from the high polluants<br />
concentration into the Arieş River water.<br />
Keywords: mortar, carbonation, sulphate attack, alkali – silica reactions<br />
INTRODUCTION<br />
The <strong>de</strong>gradation processes affecting mortars represent the major<br />
factor <strong>de</strong>termining their durability. These are controlled by both the exploitation<br />
condition for the works consisting of building materials and hydraulic bin<strong>de</strong>rs,<br />
and the structural-textural and compositional properties of the mortar.<br />
Concrete is a complex composite material used in various construction<br />
works, thus exposed to a wi<strong>de</strong> range of <strong>de</strong>structive factors. The complexity<br />
of concrete types increased in time, due to increasing social requirements.<br />
The concrete applications and the exposure conditions represent great<br />
challenges for concrete durability. Thus it is important to be forseen the <strong>de</strong>fects<br />
that may occur during the exploitation and that possibly can damage the<br />
concrete structure.<br />
a Universitatea Babeş – Bolyai, <strong>Facultatea</strong> <strong>de</strong> Biologie <strong>şi</strong> Geologie, Str. Kogălniceanu, Nr. 1,<br />
RO – 400084, Cluj-Napoca, Romania, har@bioge.ubbcluj.ro<br />
b Universitatea Babeş – Bolyai, <strong>Facultatea</strong> <strong>de</strong> <strong>Chimie</strong> <strong>şi</strong> <strong>Inginerie</strong> <strong>Chimică</strong>, Str. Kogălniceanu,<br />
Nr. 1, RO – 400084, Cluj-Napoca, Romania, mgorea@chem.ubbcluj.ro
254<br />
NICOLAE HAR, MARIA GOREA, MARCEL BENEA<br />
Atmospheric factors such as rain – some of them acid, wind, dryingwetting<br />
or frost-thaw cycles affect the external surface of concrete in a large<br />
extent. Dissolution and gradual leaching of concrete un<strong>de</strong>r the action of<br />
slightly acid rains, or physical <strong>de</strong>gradation due to drying-wetting cycles are<br />
easily predictable. The surface of concrete saturated in water is vulnerable<br />
to frost-thaw cycles which can trigger other <strong>de</strong>structive mechanisms [1].<br />
The most frequent process brought about the atmospheric factors is<br />
concrete carbonation, this leading to a <strong>de</strong>crease of the concrete pH value<br />
from 13 to 8; and so initiates the steel reinforcement corrosion [2]. In<br />
concrete, the formation of carbonates is caused by the reaction between the<br />
product of cement hydration, Ca(OH)2, and aggressive atmospheric or water<br />
dissolved CO2. of The first phase of the process is calcite; it precipitates in the<br />
pores of the concrete, leading to its compaction and thus to an increase of its<br />
mechanical resistance. However, aggressive waters with variable contents<br />
of CO2 can also infiltrate insi<strong>de</strong> the concrete and dissolve the Ca(OH)2. The<br />
higher rate of dissolution process consi<strong>de</strong>rably increases the pores water<br />
pressure, and consequently the concrete wall can be crossed by water.<br />
CO2 reacts with Ca(OH)2 forming a new calcite generation.<br />
The following chemical reactions are responsible for these processes:<br />
Ca(OH)2 + CO2 = CaCO3 + H2O<br />
CaCO3 + CO2 + H2O = Ca(HCO3)2<br />
Another cause for concrete <strong>de</strong>gradation is the SO4 2- bearing water.<br />
This ion reacts with Ca(OH)2 from concrete, resulting a wi<strong>de</strong> range of<br />
sulphate minerals. Gypsum (CaSO4·2H2O) is the most wi<strong>de</strong>spread mineral<br />
i<strong>de</strong>ntified in the strengthened concrete pores; its crystallization accompanied<br />
by a volume increase further intensify the internal tensions that possibly<br />
result in the concrete <strong>de</strong>struction. Another potential phase the ettringite<br />
(Ca6Al2O6(SO4)3·31H2O) that forms according to the reaction:<br />
Ca3Al2O6 6 H2O + 3 Ca 2+ + 3 SO4 2- + 25 H2O = Ca6Al2O6(SO4)3 31H2O<br />
The solid state reaction is accompanied by large volume variations<br />
that finally can damage the concrete or mortar. The intensity of the sulphate<br />
attack <strong>de</strong>pends on SO4 2- concentration in the water, as well as the presence of<br />
other cations and anions in the solution. The presence of primary ettringite<br />
resulted from the reaction of the calcium hydroaluminates from the cement<br />
matrix with the gypsum ad<strong>de</strong>d for controlling the concrete strengthening<br />
and that of the secondary ettringite formed by water-related sulphate attack<br />
has been already evi<strong>de</strong>nced [3].
MINERALOGY OF DEGRADATION PROCESSES AFFECTING …<br />
Concrete composition<br />
Concrete is a composite material consisting of cement matrix and<br />
natural or synthetic aggregates, the latter contributing up to 70 % to its<br />
mass, and having various grain sizes according to the concrete type and<br />
usage. Cement stone is obtained by hydration of mineralogical components<br />
of cement via an exothermal reaction leading to the formation of calcium<br />
hydrosilicates, hydroaluminates or hydroferrites that confer the final strength to<br />
the products [4]. The reactions are not a linear combination of hydration<br />
processes affecting individual components; for example, during the hydration<br />
of Ca3SiO5 and Ca2 SiO4 an amount of Ca(OH)2 is released, which is not<br />
formed in the hydration of Ca3Al2O3 and respectively Ca4 Al2Fe2O10. The<br />
aggregates are particles of various sizes of sand, fragments of natural rocks,<br />
synthetic materials, or waste materials, the most usual types being represented<br />
by natural rocks. The type of aggregate and its grain size <strong>de</strong>pend on the<br />
composition and type of concrete.<br />
The composition of a regular Portland cement stone is assumed to<br />
consist of 70 % C-S-H (calcium hydrosilicates) gels, 20 % portlandite,<br />
Ca(OH)2, 3 % calcium hydroaluminates and sulpho-hydroaluminates and 3 %<br />
non-hydrated material [5]. Calcium hydrosilicates with high CaO content<br />
release a higher amount of Ca(OH)2 as compared to those with low content of<br />
CaO, or to other hydrocomponents in the system [6]. Portlandite, Ca(OH)2,<br />
from the cement matrix is concentrated at the interface with the aggregate<br />
particles giving birth to an aureole, or at the bor<strong>de</strong>r of the pores resulted after<br />
the release of porosity water [7]. In contact with infiltration waters, Ca(OH)2<br />
gradually passes into solution until reaching its solubility limit, moment when<br />
the dissolution process ends. The solutions saturated in calcium hydroxi<strong>de</strong><br />
react with atmospheric, or the dissolved CO2 with the bicarbonate ion<br />
from the infiltration waters leading to the formation of CaCO3 and the<br />
<strong>de</strong>crease of the solution’s pH; these processes finally result in the concrete<br />
<strong>de</strong>gradation.<br />
The aim of this study was to try to i<strong>de</strong>ntify of <strong>de</strong>gradation processes<br />
that altering the mortar used in the Buru dam (Cluj County), and the<br />
alteration minerals. The dam was ma<strong>de</strong> of concrete and finished by mortar<br />
(Figure 1). The dam mortar <strong>de</strong>gradation si visible mainly due to the white<br />
efflorescences <strong>de</strong>veloped along irregular fissures cutting the mortar. The<br />
fissures affect the whole thickness of the mortar; they form a network<br />
imprinting a mosaic-like aspect enhanced by the presence, along their<br />
trajectory, of striking whitish carbonate <strong>de</strong>posits contrasting with the darkgrey<br />
colour of the mortar. Destruction processes show various intensities,<br />
from poorly-fissured areas to the <strong>de</strong>tachment of irregular mortar fragments<br />
from the surface of the mortar layer. Samples were collected from intenselyfissured<br />
areas bearing white carbonate crusts. Sampling concerned the whole<br />
thickness of the mortar layer.<br />
255
256<br />
NICOLAE HAR, MARIA GOREA, MARCEL BENEA<br />
Figure 1. Fissures with carbonate <strong>de</strong>posits at the base of Buru dam (Cluj County).<br />
RESULTS AND DISCUSSION<br />
Petrographical features of the mortar. The Buru dam consists of<br />
concrete finished with mortar. The mortar layer up to 1 cm thickness consists<br />
of aggregate (65 %) and matrix (35 %). Structurally (Figure 2), the mortar is<br />
porphyroclastic (clasts -Terminology used in the petrography of natural rocks<br />
where clast means a fragment with variable composition and/or shape.<br />
Porphiritic refers to size-related features, suggesting inechigranular patterns,<br />
i.e. large sizes of the clasts as compared to the grains of the matrix of<br />
aggregate - of various compositions bound in a fine, crystallized matrix) and<br />
shows a porous texture. The primary pores are filled by secondary minerals<br />
resulted from <strong>de</strong>gradation processes.<br />
The aggregate consists of fragments of minerals and rocks. The mineral<br />
fragments are up to 1.0 mm in size and they are represented by quartz,<br />
microcline, plagioclase feldspar, muscovite, biotite, chlorite, green hornblen<strong>de</strong>,<br />
garnet, vesuvianite etc. The lithic fragments consist of quartzites, micaschists,<br />
sericitic schists, gneisses, sandstones with carbonate cement, limestones.<br />
As a rule, the rock fragments are roun<strong>de</strong>d but also angular in some cases;<br />
they show variable sizes, up to 1.5 – 3 mm. The mineralogic and petrographic<br />
characteristics of the aggregate suggest its source in the alluvia of the Arieş<br />
Valley. Granular fragments of non-hydrated clinker have been i<strong>de</strong>ntified in<br />
the mortar, consisting of alite, belite and brownmillerite (Figure 3).<br />
The matrix is finely-crystallized and microscopically it shows variable<br />
colouring. The carbonated areas are dominantly colourless, while the noncarbonated<br />
ones show brownish hues due to the co-existing iron hydroxi<strong>de</strong>s.
MINERALOGY OF DEGRADATION PROCESSES AFFECTING …<br />
Figure 2. Porphyroclastic features of the mortar in the Buru dam. The matrix is<br />
finely-crystallized and impregnated with iron hydroxi<strong>de</strong>s (N+).<br />
Figure 3. Non-hydrated clinker fragment in the matrix of the mortar (N+):<br />
A – alite, B – belite, Br – brownmillerite<br />
Mineralogical features of the <strong>de</strong>gradation processes. Mineralogic<br />
and petrographic studies on the mortar of Buru dam have evi<strong>de</strong>nced several<br />
<strong>de</strong>gradation processes. Genetically, two types could be separated:<br />
257
258<br />
NICOLAE HAR, MARIA GOREA, MARCEL BENEA<br />
- Mechanical processes caused by frost-thaw phenomena. They<br />
are illustrated by the occurrence of fissures in the mortar mass,<br />
as well as at the concrete/mortar interface;<br />
- Chemical–mineralogical processes: carbonation, sulphate attack<br />
and formation of silica gels following the alkalies – silica reactions<br />
(ASR). These processes are favoured by the mechanical ones and<br />
they consist in specific reactions between the hydration components<br />
of the mortar matrix and the various ions dissolved by the infiltration<br />
waters percolating through the pores and fissures within the mortar.<br />
They result in neoformation minerals specific to each <strong>de</strong>gradation<br />
process. The spatial relationships among the new formed minerals<br />
and the primary components of the mortar, as well as those among<br />
new formed minerals typical to each <strong>de</strong>gradation process allowed the<br />
chronological reconstruction of the alteration processes pathway.<br />
Carbonation represents spatially, the most wi<strong>de</strong>spread <strong>de</strong>gradation<br />
process. It was i<strong>de</strong>ntified both macroscopically and microscopically and it<br />
consists in the impregnation of the mortar matrix and primary pores with<br />
granular calcite aggregates, as well as in the occurrence of crustiform white<br />
efflorescences along the fissures and in their proximity. It has to be noticed<br />
that carbonation occurs at the mortar/air, as well as to the mortar/concrete<br />
interfaces. The investigated samples pointed to a clear zonation of the<br />
carbonation process. Two distinctive areas could be i<strong>de</strong>ntified in thin sections,<br />
un<strong>de</strong>r the microscope (Figure 4):<br />
- Zone I – <strong>de</strong>veloped at the surface of the mortar, consisting of<br />
crustiform efflorescences built-up of successive layers of calcite<br />
with porous-spongy features. This particular texture of the crustiform<br />
calcite does not allow a good conservation of the material when<br />
thin sections are prepared transversal to the mortar layer. The<br />
stratified <strong>de</strong>position of the secondary calcite is also obvious along<br />
the internal walls of the fissures within the mortar (Figure 5). X-ray<br />
diffractograms on samples from the white crusts have evi<strong>de</strong>nced the<br />
presence of calcite and quartz, i<strong>de</strong>ntified based on their specific d/n<br />
(Å) values (Figure 6). The source for quartz was, most probably, the<br />
sand used when the mortar was prepared.<br />
- Zone II – occurs at the external margin of the mortar layer. It is<br />
up to 3 mm thick and it is characterized by the presence of finely<br />
granular calcite massively impregnating the mortar matrix. Calcite<br />
from zone II has been also i<strong>de</strong>ntified in the pores of the mortar,<br />
where it fills the central area (Figure 8).
MINERALOGY OF DEGRADATION PROCESSES AFFECTING …<br />
Figure 4. Zonation of the carbonation process (N+).<br />
Figure 5. Stratified <strong>de</strong>posits of calcite along the walls of the fissures in the mortar,<br />
and as impregnations in the matrix (N+).<br />
The formation of the secondary carbonates is attributed, mainly to<br />
the reaction between Ca(OH)2 and the atmospheric CO2.<br />
A previous paper [8] has evi<strong>de</strong>nced the presence of large concentration<br />
in anions: HCO3 - (162 mg/l), SO4 2- (~ 64 mg/l), and cations: Ca 2+ (~ 49 mg/l),<br />
Mg 2+ (7.1 mg/l), Na + (7.3 mg/l), in Arieş water (pH=7.4); these ions are<br />
responsible for the <strong>de</strong>gradation process. The Arieş River pollution is caused<br />
by both mining activities in the area, as well as by the dissolution of some<br />
host rocks (carbonate rocks, an<strong>de</strong>sitic rocks etc) in the neighbourhood.<br />
259
260<br />
NICOLAE HAR, MARIA GOREA, MARCEL BENEA<br />
Figure 6. X-ray pattern of the carbonate crust <strong>de</strong>veloped along the fissures in the<br />
mortar (Cc – calcite, Q – quartz)<br />
The sulphate attack has been evi<strong>de</strong>nced during the microscopic study.<br />
Ettringite II results from this process; it is <strong>de</strong>posited in the primary pores of the<br />
mortar, where it is associated with calcite and secondary silica. Ettringite occurs<br />
as acicular crystals with random or sometimes radial orientation (Figure 7).<br />
Un<strong>de</strong>r polarized light it is characterized by parallel extinction, low birefringence<br />
and positive relief. Most probably, secondary ettringite forms as a product<br />
of the reaction between the calcium hydroaluminates from the cement matrix<br />
and SO4 2- and Ca 2+ present in the river water. The non-hydrated cement<br />
grains from the matrix, also gradually hydratea lead to the formation of<br />
calcium hydrosilicates and hydroaluminates, with the release of Ca(OH)2.<br />
Thus, the sulphatation of hydrates represents a continuous process that<br />
follows alkali-silica reactions, as pointed out by the succession of layers in<br />
the primary pores of the mortar, images by optical microscopy.<br />
Alkali-silica reactions (ASR) are poorly-represented in the studied<br />
samples; they have been i<strong>de</strong>ntified only by optical microscopy, and resulted<br />
in the formation of cryptocrystalline silica <strong>de</strong>posited on the mortar pores.
MINERALOGY OF DEGRADATION PROCESSES AFFECTING …<br />
Figure 7. Acicular-fibrous crystals of ettringite (Et) in the primary pores of the<br />
matrix (N+). Cryptocrystalline silica covers the internal wall of the pores (S).<br />
Cryptocrystalline silica represents the first product of the alteration<br />
process; un<strong>de</strong>r polarized light it shows low birefringence and relief (Figure 7). It<br />
forms by crystallization of silica gels present in mortar due to the interaction<br />
between alkalies from cement and the various species of active silica of the<br />
aggregate. The resulted gels have migrated from the mortar matrix towards<br />
the pores and fissures where they have gradually crystallized.<br />
Figure 8. Pore in the mortar matrix filled by ettringite (Et) and calcite (Cc)<br />
in the central area (N+).<br />
261
262<br />
NICOLAE HAR, MARIA GOREA, MARCEL BENEA<br />
The spatial relationships between the alteration phases precipitated<br />
in the primary pores of the concrete have allowed the recognition of the<br />
temporal stages. Thus, the presence of the cryptocrystalline secondary<br />
silica (Figure 7) on the walls of the primary pores, points that it is the first<br />
product of alteration processes. It was followed by the ettringite II, which<br />
frequently fills completely the pores. Sometimes, the calcite resulted by<br />
carbonation appear as the latter filling of the central part of the pores<br />
(Figure 8). This succession indicated that carbonation followed the alkalisilica<br />
reactions and the sulphate attack.<br />
CONCLUSIONS<br />
The fissures produced within the concrete structure and the<br />
finishing mortar mainly resulted via frost-thaw cycles; additional to the<br />
primary porosity, they represented the access pathways for infiltration<br />
fluids. These fluids contain various ions from the Arieş River and the<br />
precipitation waters, as well as from the matrix of the mortar. Both CO2 from<br />
the atmosphere and dissolved in the water, and SO4 2- , Na + and Ca 2+ ions<br />
contributed to the <strong>de</strong>but and progress of <strong>de</strong>gradation processes<br />
(carbonation, sulphate attack, and alkali-silica reactions). The presence of<br />
SO4 2- and Ca 2+ in the mortar leads to the formation of ettringite II.<br />
The original <strong>de</strong>position of silica gels insi<strong>de</strong> the pores suggests that<br />
the first reaction taking place in the concrete was between the silica in the<br />
aggregates and the alkalies from the matrix and from the infiltration waters.<br />
The silica gels are partly crystallized and they build-up the first (most<br />
internal) layer lining the pores. The high amounts of SO4 2- and Ca 2+ from the<br />
river waters as well as the retar<strong>de</strong>d hydration of cement some compounds<br />
have facilitated the formation of secondary ettringite that represents the<br />
second layer within the pores.<br />
The high concentration of HCO3 – points to relatively lower amounts<br />
of aggressive CO2, thus to its <strong>de</strong>layed reaction with Ca(OH)2 resulting in the<br />
formation of CaCO3 (calcite) consisting the last product precipitated within<br />
the pores.<br />
The intense carbonation at the surface and in the fissures of the<br />
mortar suggest a strong diffusion of Ca(OH)2 through the fissures and its<br />
reaction with atmospheric CO2 during drying-wetting cycles.<br />
The following time succession for the formation of secondary products<br />
could be documented: cryptocrystalline silica resulted by crystallization of<br />
silica gels is <strong>de</strong>posited along the internal walls of the voids, as a result of<br />
the first <strong>de</strong>gradation process (alkali-silica reactions). This is followed by<br />
sulphate attack with the formation of ettringite II; the youngest stage was<br />
represented by carbonation. This precipitation succession is particular for
MINERALOGY OF DEGRADATION PROCESSES AFFECTING …<br />
the specific in situ microenvironmental conditions. In the case of the dam<br />
from Buru, the pollution <strong>de</strong>gree of waters from Arieş River plays a dominant<br />
role in the succession of formation of secondary minerals. This pattern may<br />
differ in case of subaerial exposure, when the interaction with infiltration<br />
fluids containing dissolved ions is an intermittent process [ 3].<br />
EXPERIMENTAL SECTION<br />
Analytical methods. Several investigation methods were used<br />
complementary in the view of establishing the structural, textural and<br />
mineralogical characteristics of the mortar, as well as of the secondary<br />
minerals resulted by <strong>de</strong>gradation processes. Macroscopic observations<br />
concerned the dam un<strong>de</strong>r study, which were used for selective sampling<br />
(mortar and material from the white efflorescences) in the view of laboratory<br />
study. These samples were cut into thin sections (25-30 microns) used for<br />
microscopic investigations. The study of the thin sections evi<strong>de</strong>nced spatial<br />
relationships between the products of the various <strong>de</strong>gradation processes,<br />
thus allowing a chronology of the <strong>de</strong>position of neoformed (secondary)<br />
minerals to be established. These studies were carried out by optical<br />
microscopy un<strong>de</strong>r polarized light (Nikon Eclipse E 2000 microscope), un<strong>de</strong>r<br />
crossed (N+) or parallel (1N) nicols. The i<strong>de</strong>ntification of secondary mineral<br />
species was additionally based on the results of X-ray diffraction investigation<br />
performed by using Dron 3 diffractometer with Cu anticatho<strong>de</strong> in the 5 – 64 o<br />
2θ interval.<br />
ACKNOWLEDGEMENTS<br />
We acknowledge the support of the CNCSIS Grant 1741. All our<br />
thanks to Dr. Dana Pop (“Babeş – Bolyai” University, Department of Mineralogy)<br />
for the translation of the manuscript.<br />
REFERENCES<br />
1. Ian Sims, Proceedings of Challenges of concrete construction. Repair,<br />
rejuvenation and enhancement of concrete, Thomas Telford, London, 2002, 11.<br />
2. M. Muntean, N. Noica, L. Radu, I. Ropotă, A. Ionescu, O. Muntean,<br />
Romanian Journal of Materials, 2008, 38(4), 284.<br />
3. N. Har, R. Bindiu, M. Gorea, M. Benea, Romanian Journal of Materials, 2007,<br />
37(3), 228.<br />
4. W. Michael, Della M. Roy Grutzeck, “Portland Cement Mineralogy”, Hutchinson<br />
Ross Publishing Company, 1981, chapter II.<br />
263
264<br />
NICOLAE HAR, MARIA GOREA, MARCEL BENEA<br />
5. G. Macleod, A.J. Hall, E.A. Fallick, Mineralogical Magazine, 1990, 54, 637.<br />
6. I. Teoreanu, “Basis of inorganic bin<strong>de</strong>r technology”, Didactical and Pedagogical<br />
Publishing House, Bucharest, 1993, chapter V.<br />
7. S.V. Harutyunyan, S.A. Abovyan, J.M.P. Monteiro, P.V. Mkrtchyan, K.M.<br />
Balyan, P.A. Aivazyan, J. Am.Ceram. Soc., 2003, 86(12), 2162.<br />
8. F.L. Forray, D.K. Hallbauer, Environmental Geology, 2000, 39(12), 1372.