new insights into the prevention and treatment of bulimia nervosa
new insights into the prevention and treatment of bulimia nervosa
new insights into the prevention and treatment of bulimia nervosa

You also want an ePaper? Increase the reach of your titles
YUMPU automatically turns print PDFs into web optimized ePapers that Google loves.
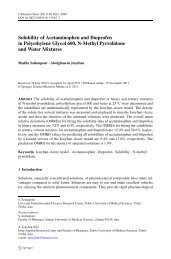
Practical Screening Methods for Eating Disorders for Collegiate Athletics<br />
BMI SILs Anchor Means (kg/m2) Year 1 Year 2<br />
All Females Males All Females Males<br />
(n = 355) (n = 243) (n = 112) (n = 340) (n = 208) (n = 132)<br />
M SD M SD M SD M SD M SD M SD<br />
Self-Reported BMI<br />
SIL Friends<br />
23.1 3.7 22.0 3.0 25.4 3.9 23.5 3.5 22.3 2.7 25.4 3.8<br />
Actual 22.0 2.6 21.4 2.5 23.4 2.5 22.4 2.8 21.7 2.6 23.6 2.7<br />
Ideal<br />
SIL Parents<br />
21.7 2.3 21.0 1.9 23.3 2.1 22.1 2.2 21.3 1.9 23.4 1.9<br />
Actual 22.1 2.7 21.5 2.6 23.3 2.7 22.3 2.6 21.7 2.6 23.3 2.2<br />
Ideal<br />
SIL Coach<br />
21.7 2.2 20.9 1.9 23.2 2.1 22.1 2.3 21.1 1.7 23.5 2.2<br />
Actual 22.3 2.8 21.7 2.7 23.5 2.7 22.6 3.1 22.0 2.7 23.7 3.3<br />
Ideal 31.3 21.4 20.5 2.0 23.2 2.0 21.8 2.8 20.7 1.7 23.8 3.0<br />
Likert SIL Anchor Means<br />
All Females Males All Females Males<br />
M SD M SD M SD M SD M SD M SD<br />
SIL Friends<br />
Actual 3.5 1.1 3.5 1.1 3.5 1.1 3.7 1.1 3.4 .96 4.1 1.1<br />
Ideal<br />
SIL Parents<br />
3.4 1.0 3.4 1.0 3.4 1.0 3.6 .87 3.4 .75 4.1 .84<br />
Actual 3.5 1.1 3.6 1.1 3.5 1.1 3.6 .97 3.5 .91 4.0 .98<br />
Ideal<br />
SIL Coach<br />
3.4 .99 3.4 .98 3.4 1.0 3.6 .92 3.2 .74 4.1 .93<br />
Actual 3.6 1.1 3.6 1.1 3.6 1.2 3.8 1.0 3.6 .96 4.1 1.1<br />
Ideal 3.3 1.1 3.2 1.1 3.3 1.1 3.5 1.0 3.0 .82 4.2 .95<br />
Table 5. Descriptive statistics for self-report-BMI <strong>and</strong> Likert SILs for perceptions by o<strong>the</strong>rs<br />
(e.g., friends, parents, <strong>and</strong> coaches).<br />
O<strong>the</strong>r studies, have examined eating disorder risk across categorized sport groups or<br />
specific individual team sports (Black et al., 2003; Sundgot-Borgen & Torstveit, 2004; Torres-<br />
McGehee et al., 2009; Torres-McGehee et al., In Press; Torres-McGehee et al., n.d). More<br />
specifically, Black <strong>and</strong> et al., (2003) estimated <strong>the</strong>ir highest eating disorder prevalence to be<br />
among cheerleaders (33%), while also finding disordered eating occurring frequently among<br />
gymnasts (50%), modern dancers (45%), <strong>and</strong> cross country athletes (45%). Similarly to Black<br />
et al. (2003), Torres-McGehee <strong>and</strong> colleagues (2009, In Press, n.d) estimated high risk among<br />
collegiate dancers (29%), cheerleaders (33%) <strong>and</strong> equestrian athletes (42%). Whereas,<br />
Sundgot-Borgen & Torstveit (2004) revealed eating disorder prevalence among categorized<br />
athletic sport groups vs. individual sports <strong>and</strong> revealed eating disorder risk in <strong>the</strong> following:<br />
technical sports (17%; e.g., bowling, golf), ball game sports (16%; e.g., team h<strong>and</strong>ball, soccer,<br />
tennis, volleyball); aes<strong>the</strong>tic sports (42%; e.g., gymnastics, dancing, figure skating, diving)<br />
<strong>and</strong> endurance sports (24%; e.g., aerobics, long-distance running).<br />
61


![focuspdca.ppt [Compatibility Mode]](https://img.yumpu.com/22859457/1/190x146/focuspdcappt-compatibility-mode.jpg?quality=85)