new insights into the prevention and treatment of bulimia nervosa
new insights into the prevention and treatment of bulimia nervosa
new insights into the prevention and treatment of bulimia nervosa

You also want an ePaper? Increase the reach of your titles
YUMPU automatically turns print PDFs into web optimized ePapers that Google loves.
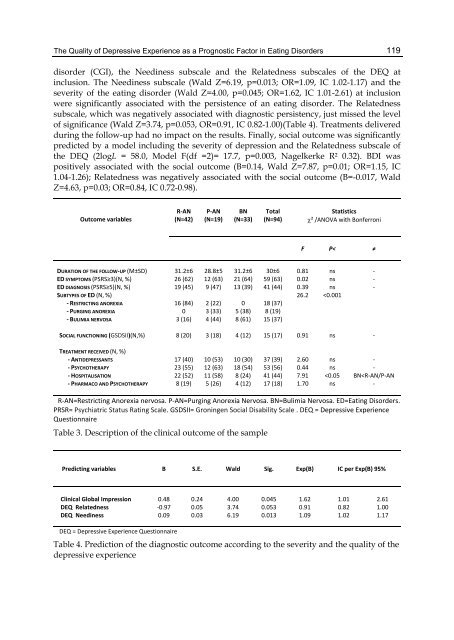
The Quality <strong>of</strong> Depressive Experience as a Prognostic Factor in Eating Disorders<br />
disorder (CGI), <strong>the</strong> Neediness subscale <strong>and</strong> <strong>the</strong> Relatedness subscales <strong>of</strong> <strong>the</strong> DEQ at<br />
inclusion. The Neediness subscale (Wald Z=6.19, p=0.013; OR=1.09, IC 1.02-1.17) <strong>and</strong> <strong>the</strong><br />
severity <strong>of</strong> <strong>the</strong> eating disorder (Wald Z=4.00, p=0.045; OR=1.62, IC 1.01-2.61) at inclusion<br />
were significantly associated with <strong>the</strong> persistence <strong>of</strong> an eating disorder. The Relatedness<br />
subscale, which was negatively associated with diagnostic persistency, just missed <strong>the</strong> level<br />
<strong>of</strong> significance (Wald Z=3.74, p=0.053, OR=0.91, IC 0.82-1.00)(Table 4). Treatments delivered<br />
during <strong>the</strong> follow-up had no impact on <strong>the</strong> results. Finally, social outcome was significantly<br />
predicted by a model including <strong>the</strong> severity <strong>of</strong> depression <strong>and</strong> <strong>the</strong> Relatedness subscale <strong>of</strong><br />
<strong>the</strong> DEQ (2logL = 58.0, Model F(df =2)= 17.7, p=0.003, Nagelkerke R² 0.32). BDI was<br />
positively associated with <strong>the</strong> social outcome (B=0.14, Wald Z=7.87, p=0.01; OR=1.15, IC<br />
1.04-1.26); Relatedness was negatively associated with <strong>the</strong> social outcome (B=-0.017, Wald<br />
Z=4.63, p=0.03; OR=0.84, IC 0.72-0.98).<br />
Outcome variables<br />
R-AN<br />
(N=42)<br />
P-AN<br />
(N=19)<br />
BN<br />
(N=33)<br />
Total<br />
(N=94)<br />
Statistics<br />
² /ANOVA with Bonferroni<br />
F P< ≠<br />
DURATION OF THE FOLLOW-UP (M±SD) 31.2±6 28.8±5 31.2±6 30±6 0.81 ns -<br />
ED SYMPTOMS (PSRS≥3)(N, %) 26 (62) 12 (63) 21 (64) 59 (63) 0.02 ns -<br />
ED DIAGNOSIS (PSRS≥5)(N, %) 19 (45) 9 (47) 13 (39) 41 (44) 0.39 ns -<br />
SUBTYPES OF ED (N, %) 26.2


![focuspdca.ppt [Compatibility Mode]](https://img.yumpu.com/22859457/1/190x146/focuspdcappt-compatibility-mode.jpg?quality=85)