

National Minimum Wage
National Minimum Wage
National Minimum Wage

You also want an ePaper? Increase the reach of your titles
YUMPU automatically turns print PDFs into web optimized ePapers that Google loves.
<strong>National</strong> <strong>Minimum</strong> <strong>Wage</strong><br />
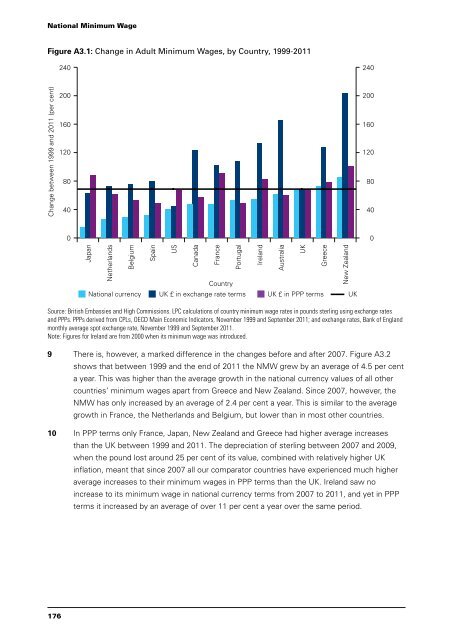
Figure A3.1: Change in Adult <strong>Minimum</strong> <strong>Wage</strong>s, by Country, 1999-2011<br />
Change between 1999 and 2011 (per cent)<br />
176<br />
240<br />
200<br />
160<br />
120<br />
80<br />
40<br />
0<br />
Japan<br />
Netherlands<br />
Belgium<br />
Spain<br />
US<br />
Canada<br />
France<br />
Country<br />
<strong>National</strong> currency UK £ in exchange rate terms UK £ in PPP terms UK<br />
Source: British Embassies and High Commissions. LPC calculations of country minimum wage rates in pounds sterling using exchange rates<br />
and PPPs. PPPs derived from CPLs, OECD Main Economic Indicators, November 1999 and September 2011; and exchange rates, Bank of England<br />
monthly average spot exchange rate, November 1999 and September 2011.<br />
Note: Figures for Ireland are from 2000 when its minimum wage was introduced.<br />
9 There is, however, a marked difference in the changes before and after 2007. Figure A3.2<br />
shows that between 1999 and the end of 2011 the NMW grew by an average of 4.5 per cent<br />
a year. This was higher than the average growth in the national currency values of all other<br />
countries’ minimum wages apart from Greece and New Zealand. Since 2007, however, the<br />
NMW has only increased by an average of 2.4 per cent a year. This is similar to the average<br />
growth in France, the Netherlands and Belgium, but lower than in most other countries.<br />
10 In PPP terms only France, Japan, New Zealand and Greece had higher average increases<br />
than the UK between 1999 and 2011. The depreciation of sterling between 2007 and 2009,<br />
when the pound lost around 25 per cent of its value, combined with relatively higher UK<br />
inflation, meant that since 2007 all our comparator countries have experienced much higher<br />
average increases to their minimum wages in PPP terms than the UK. Ireland saw no<br />
increase to its minimum wage in national currency terms from 2007 to 2011, and yet in PPP<br />
terms it increased by an average of over 11 per cent a year over the same period.<br />
Portugal<br />
Ireland<br />
Australia<br />
UK<br />
Greece<br />
New Zealand<br />
240<br />
200<br />
160<br />
120<br />
80<br />
40<br />
0