

National Minimum Wage
National Minimum Wage
National Minimum Wage

You also want an ePaper? Increase the reach of your titles
YUMPU automatically turns print PDFs into web optimized ePapers that Google loves.
Appendix 3: <strong>Minimum</strong> <strong>Wage</strong> Systems in Other Countries<br />
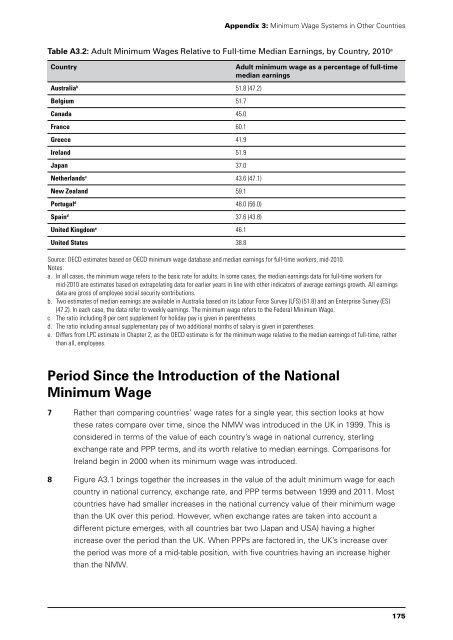
Table A3.2: Adult <strong>Minimum</strong> <strong>Wage</strong>s Relative to Full-time Median Earnings, by Country, 2010 a<br />
Country Adult minimum wage as a percentage of full-time<br />
median earnings<br />
Australia b 51.8 (47.2)<br />
Belgium 51.7<br />
Canada 45.0<br />
France 60.1<br />
Greece 41.9<br />
Ireland 51.9<br />
Japan 37.0<br />
Netherlands c 43.6 (47.1)<br />
New Zealand 59.1<br />
Portugal d 48.0 (56.0)<br />
Spain d 37.6 (43.8)<br />
United Kingdom e 46.1<br />
United States 38.8<br />
Source: OECD estimates based on OECD minimum wage database and median earnings for full-time workers, mid-2010.<br />
Notes:<br />
a. In all cases, the minimum wage refers to the basic rate for adults. In some cases, the median earnings data for full-time workers for<br />
mid-2010 are estimates based on extrapolating data for earlier years in line with other indicators of average earnings growth. All earnings<br />
data are gross of employee social security contributions.<br />
b. Two estimates of median earnings are available in Australia based on its Labour Force Survey (LFS) (51.8) and an Enterprise Survey (ES)<br />
(47.2). In each case, the data refer to weekly earnings. The minimum wage refers to the Federal <strong>Minimum</strong> <strong>Wage</strong>.<br />
c. The ratio including 8 per cent supplement for holiday pay is given in parentheses.<br />
d. The ratio including annual supplementary pay of two additional months of salary is given in parentheses.<br />
e. Differs from LPC estimate in Chapter 2, as the OECD estimate is for the minimum wage relative to the median earnings of full-time, rather<br />
than all, employees.<br />
Period Since the Introduction of the <strong>National</strong><br />
<strong>Minimum</strong> <strong>Wage</strong><br />
7 Rather than comparing countries’ wage rates for a single year, this section looks at how<br />
these rates compare over time, since the NMW was introduced in the UK in 1999. This is<br />
considered in terms of the value of each country’s wage in national currency, sterling<br />
exchange rate and PPP terms, and its worth relative to median earnings. Comparisons for<br />
Ireland begin in 2000 when its minimum wage was introduced.<br />
8 Figure A3.1 brings together the increases in the value of the adult minimum wage for each<br />
country in national currency, exchange rate, and PPP terms between 1999 and 2011. Most<br />
countries have had smaller increases in the national currency value of their minimum wage<br />
than the UK over this period. However, when exchange rates are taken into account a<br />
different picture emerges, with all countries bar two (Japan and USA) having a higher<br />
increase over the period than the UK. When PPPs are factored in, the UK’s increase over<br />
the period was more of a mid-table position, with five countries having an increase higher<br />
than the NMW.<br />
175