A Robust, Non-Parametric Method to Identify Outliers ... - CS Mantech
A Robust, Non-Parametric Method to Identify Outliers ... - CS Mantech
A Robust, Non-Parametric Method to Identify Outliers ... - CS Mantech

You also want an ePaper? Increase the reach of your titles
YUMPU automatically turns print PDFs into web optimized ePapers that Google loves.
Abstract<br />
A <strong>Robust</strong>, <strong>Non</strong>-<strong>Parametric</strong> <strong>Method</strong> <strong>to</strong> <strong>Identify</strong> <strong>Outliers</strong> and Improve Final<br />
Yield and Quality<br />
Neill Patterson<br />
TriQuint Semiconduc<strong>to</strong>r, Hillsboro Oregon, USA (neill.patterson@tqs.com, 503-615-9338)<br />
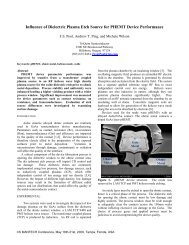
This paper discusses the shortcomings of two widelyused<br />
outlier detection methods, and then introduces a<br />
more robust non-parametric algorithm that can better<br />
handle the wide variety of non-standard distributions<br />
seen in the semiconduc<strong>to</strong>r manufacturing industry.<br />
When applied <strong>to</strong> test data gathered at a wafer sort step,<br />
this algorithm allows for the removal of outlier die (that<br />
otherwise passed test limits) in order <strong>to</strong> improve quality<br />
and yield in the final product.<br />
The algorithm was designed <strong>to</strong> be as simple as possible,<br />
with a minimum number of assumptions about the<br />
underlying dataset. Its design was inspired by the<br />
human ability <strong>to</strong> identify outliers almost instantaneously<br />
from almost any distribution. It will be presented first<br />
in mathematically-informal, yet easily-unders<strong>to</strong>od<br />
terms, with a more rigorous mathematical definition <strong>to</strong><br />
follow.<br />
INTRODUCTION<br />
The problem of outliers has long plagued statisticians,<br />
scientists, and engineers of all disciplines. It is of no help<br />
that there is no formal mathematical definition of an outlier,<br />
and the entire endeavor of outlier identification will always<br />
remain somewhat subjective.<br />
Perhaps the most popular outlier identification method in<br />
use <strong>to</strong>day is the Six Sigma method developed by<br />
Mo<strong>to</strong>rola, with talk of process capability (Cpk) being<br />
ubiqui<strong>to</strong>us throughout many industries. The Six Sigma<br />
method is an example of a parametric method that relies on<br />
assumptions about the underlying probability distribution –<br />
in this case, that it is Gaussian. <strong>Parametric</strong> methods are<br />
very powerful when the underlying assumptions are true,<br />
but are often woefully inadequate otherwise.<br />
<strong>Method</strong>s relying on assumptions of normality are poor<br />
candidates at TriQuint Semiconduc<strong>to</strong>r, where highly nonnormal<br />
distributions are commonplace. And as more and<br />
more tests are added <strong>to</strong> a die or test structure, the odds of<br />
finding at least one distribution that is multi-modal, highlyskewed<br />
or heavy-tailed increase and the ability <strong>to</strong> exclude<br />
die based on methods that assume normality is highly<br />
diminished.<br />
Another approach tried at TriQuint Semiconduc<strong>to</strong>r was<br />
based on Tukey’s box-plot method, which defines outliers<br />
as being outside the interval [Q1 – 1.5∙IQR, Q3 + 1.5∙IQR],<br />
where “Q” stands for “quartile” and “IQR” stands for<br />
“interquartile range”. This method was modified at<br />
TriQuint <strong>to</strong> define outliers as being outside the interval [Q1<br />
– 3.95∙IQR, Q3 + 3.95∙IQR]. The change <strong>to</strong> the IQRmultiplier<br />
was made so that if the underlying distribution is<br />
Gaussian, then this method yields the exact same results as<br />
using ±6σ limits, thus keeping with the spirit of the Six<br />
Sigma method. This is an example of a non-parametric<br />
method that does not make any assumptions about the<br />
underlying probability distribution (for this reason, nonparametric<br />
methods are called “distribution-free”). Its main<br />
advantage over the Six Sigma method is that it is much<br />
more adept at dealing with non-symmetric distributions<br />
with heavy tails. It is a rather robust method with low<br />
computational complexity and suitable for use in many<br />
industries, but unfortunately it <strong>to</strong>o is unable <strong>to</strong> handle the<br />
sheer variety of non-standard distributions seen at TriQuint.<br />
A MORE HUMAN METHOD<br />
<strong>CS</strong> MANTECH Conference, April 23rd - 26th, 2012, Bos<strong>to</strong>n, Massachusetts, USA<br />
When shown a his<strong>to</strong>gram of almost any dataset, even an<br />
average human with little-<strong>to</strong>-no training in statistics is able<br />
<strong>to</strong> identify outliers almost immediately. It is posited that the<br />
human algorithm for identifying outliers is <strong>to</strong> first identify<br />
the main distribution, presumably based on the region with<br />
the most area under the curve and then following that region<br />
out in both directions until the bin count drops <strong>to</strong> zero. In<br />
very simple human terms then, the definition of an outlier is<br />
a data point not connected <strong>to</strong> the main probability<br />
distribution.
A computer implementation of this algorithm is quite<br />
easy <strong>to</strong> produce. Binning the data and identifying bin<br />
counts of zero is trivial. Estimating area as a Riemann sum<br />
of bin counts between regions bounded by bin counts of<br />
zero and finding the main distribution is not exceedingly<br />
difficult either, but a very simple shortcut is achieved by<br />
making the following assumption: that the median value is<br />
contained within the main probability distribution. This is<br />
the one and only assumption made by the algorithm, and<br />
can be dispensed with at the cost of some computational<br />
complexity. This assumption is remarkably robust, and it<br />
takes a very extreme type of multi-modal distribution with<br />
clear separation between the modes <strong>to</strong> invalidate it. To<br />
date, such distributions have not been observed but seem<br />
likely <strong>to</strong> occur in multi-site measurements at the extreme<br />
limits of tester capability. For this reason, special rules are<br />
implemented <strong>to</strong> ensure that the sensitivity of the algorithm<br />
does not exceed the capability of the measurement.<br />
In more formal mathematical terms, definitions for the<br />
main distribution and outliers for are as follows. An<br />
ordered set of elements {x1, x2 , … xN} of size N form a<br />
group if, for a chosen є > 0, xi-xi-1 < є for all I ≤ N. The<br />
main distribution is the group with the highest number of<br />
cardinal elements and outliers are simply defined as any<br />
elements that are outside of this group. By definition,<br />
outliers are at a distance of at least є from the end points of<br />
the main distribution. Note that є is the bin width, and<br />
choice of є controls the sensitivity of the algorithm.<br />
IMPLEMENTATION<br />
As it was specifically designed <strong>to</strong> be simple, software<br />
implementations of the proposed algorithm can be created<br />
quickly and in a variety of programming languages. In the<br />
case of TriQuint Semiconduc<strong>to</strong>r a software implementation<br />
was created using Perl.<br />
A greater challenge is incorporating a new metric of yield<br />
and quality in<strong>to</strong> existing databases and infrastructure. An<br />
audience of engineers or analysts accus<strong>to</strong>med <strong>to</strong> viewing<br />
yield and quality problems solely through the lens of test<br />
limits must be given special <strong>to</strong>ols <strong>to</strong> see how dynamicallygenerated<br />
outlier limits are affecting yield and quality. And<br />
any expected yield loss at wafer sort must be fed back <strong>to</strong><br />
those in an operational planning capacity.<br />
IMPLICATIONS<br />
Outlier devices are assumed <strong>to</strong> be defective in some<br />
way, even though they might pass the test limits. The<br />
ability <strong>to</strong> detect and remove outliers at an intermediate test<br />
step (such as wafer sort) should theoretically lead <strong>to</strong> higher<br />
yields at subsequent test steps. Furthermore, the removal of<br />
outliers is expected <strong>to</strong> lead <strong>to</strong> an improvement in outgoing<br />
quality, as many manufacturing defects are so readily<br />
detected and screened.<br />
At the time of writing, experiments are being planned <strong>to</strong><br />
study the yield and quality levels of outlier devices at final<br />
test. A cost-benefit analysis will be performed <strong>to</strong> decide<br />
whether the increased yield loss at wafer sort is paid for by<br />
yield gains and quality improvements at final test.<br />
APPLICATIONS<br />
The proposed algorithm cannot be run in real-time, since<br />
data for the entire data set must be processed before<br />
identifying outliers. As such, it is not suitable for use as an<br />
outlier removal <strong>to</strong>ol for a test step where the unique identity<br />
of passing units is lost, or where the cost of later extraction<br />
is prohibitively high. At the final test step at TriQuint<br />
Semiconduc<strong>to</strong>r, for example, passing units are immediately<br />
placed on<strong>to</strong> a reel and sealed with carrier tape, making the<br />
later removal of outliers impractical. At the wafer sort step,<br />
however, the unique identity of passing die is retained, and<br />
the later extraction of outliers is done electronically, at no<br />
cost, by adjusting the wafer map.<br />
Even when a post-processing algorithm such as this one<br />
cannot be used <strong>to</strong> remove outliers in real time, it can still<br />
have many practical benefits as a data analysis <strong>to</strong>ol. For<br />
example, a process moni<strong>to</strong>r can be created <strong>to</strong> track the<br />
failure rate of outlier die, which can be used as an early<br />
detection system for future yield or quality problems at final<br />
test, as well as a <strong>to</strong>ol for spotting manufacturing defects and<br />
driving process improvements.<br />
<strong>CS</strong> MANTECH Conference, April 23rd - 26th, 2012, Bos<strong>to</strong>n, Massachusetts, USA
EVALUATION<br />
Because the algorithm is not a function of any measure<br />
of distribution spread (e.g. variance, IQR, etc), it handles<br />
asymmetrical distributions very well compared <strong>to</strong> other<br />
methods. Figure 1 shows the left and right sides of a longtailed<br />
distribution receiving radically different treatments,<br />
as is appropriate for this kind of distribution.<br />
In addition <strong>to</strong> detecting random defects, the proposed<br />
algorithm has been useful in detecting recurring patterns of<br />
failing die that were not detectable using test limits alone.<br />
Such recurring regions of failing die are often caused by a<br />
particular <strong>to</strong>ol, and this kind of information can be used <strong>to</strong><br />
drive process improvements. Figure 2 shows an example of<br />
a non-random pattern of failing die that was visible across<br />
several wafers of the same type.<br />
CONCLUSIONS<br />
With a relatively small amount of computational effort,<br />
it is possible <strong>to</strong> implement a non-parametric (distributionfree)<br />
algorithm <strong>to</strong> identify outliers in a data set. This<br />
algorithm can be used solely for data analysis purposes, or<br />
can also be used <strong>to</strong> actively eliminate outlier die at wafer<br />
sort and a corresponding improvement in final yield and<br />
quality can be expected.<br />
ACKNOWLEDGEMENTS<br />
The author would like <strong>to</strong> thank Bill Adams for providing<br />
the software implementation of this algorithm, and for his<br />
patience in accommodating the numerous experiments and<br />
tweaks that were requested.<br />
ACRONYMS<br />
Cpk: Process Capability<br />
Q1: First Quartile<br />
Q3: Third Quartile<br />
IQR: Interquartile Range (Q3-Q1)<br />
Figure 1 – A Typical Long-Tailed Asymmetrical Distribution<br />
Figure 2 - A Systemic Pattern Revealed By Outlier Limits<br />
<strong>CS</strong> MANTECH Conference, April 23rd - 26th, 2012, Bos<strong>to</strong>n, Massachusetts, USA