Management Accounting and Financial Analysis
Management Accounting and Financial Analysis
Management Accounting and Financial Analysis

You also want an ePaper? Increase the reach of your titles
YUMPU automatically turns print PDFs into web optimized ePapers that Google loves.
PAPER – 2 : MANAGEMENT ACCOUNTING AND FINANCIAL ANALYSIS<br />
QUESTIONS<br />
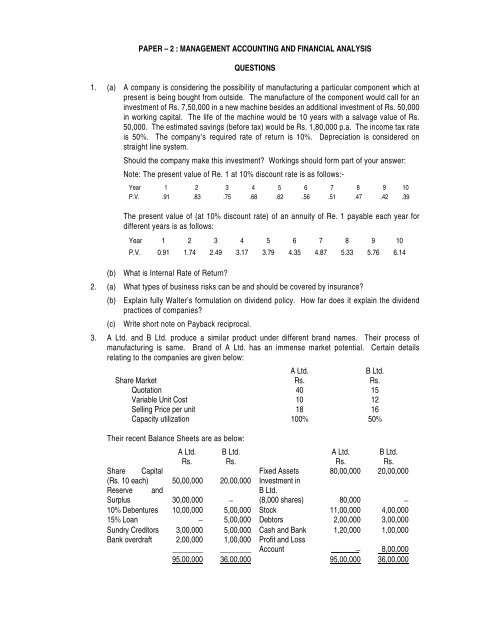
1. (a) A company is considering the possibility of manufacturing a particular component which at<br />
present is being bought from outside. The manufacture of the component would call for an<br />
investment of Rs. 7,50,000 in a new machine besides an additional investment of Rs. 50,000<br />
in working capital. The life of the machine would be 10 years with a salvage value of Rs.<br />
50,000. The estimated savings (before tax) would be Rs. 1,80,000 p.a. The income tax rate<br />
is 50%. The company’s required rate of return is 10%. Depreciation is considered on<br />
straight line system.<br />
Should the company make this investment? Workings should form part of your answer:<br />
Note: The present value of Re. 1 at 10% discount rate is as follows:-<br />
Year 1 2 3 4 5 6 7 8 9 10<br />
P.V. .91 .83 .75 .68 .62 .56 .51 .47 .42 .39<br />
The present value of (at 10% discount rate) of an annuity of Re. 1 payable each year for<br />
different years is as follows:<br />
Year 1 2 3 4 5 6 7 8 9 10<br />
P.V. 0.91 1.74 2.49 3.17 3.79 4.35 4.87 5.33 5.76 6.14<br />
(b) What is Internal Rate of Return?<br />
2. (a) What types of business risks can be <strong>and</strong> should be covered by insurance?<br />
(b) Explain fully Walter’s formulation on dividend policy. How far does it explain the dividend<br />
practices of companies?<br />
(c) Write short note on Payback reciprocal.<br />
3. A Ltd. <strong>and</strong> B Ltd. produce a similar product under different br<strong>and</strong> names. Their process of<br />
manufacturing is same. Br<strong>and</strong> of A Ltd. has an immense market potential. Certain details<br />
relating to the companies are given below:<br />
A Ltd. B Ltd.<br />
Share Market Rs. Rs.<br />
Quotation 40 15<br />
Variable Unit Cost 10 12<br />
Selling Price per unit 18 16<br />
Capacity utilization 100% 50%<br />
Their recent Balance Sheets are as below:<br />
A Ltd. B Ltd. A Ltd. B Ltd.<br />
Rs. Rs. Rs. Rs.<br />
Share Capital<br />
Fixed Assets 80,00,000 20,00,000<br />
(Rs. 10 each) 50,00,000 20,00,000 Investment in<br />
Reserve <strong>and</strong><br />
B Ltd.<br />
Surplus<br />
30,00,000 − (8,000 shares) 80,000<br />
−<br />
10% Debentures 10,00,000 5,00,000 Stock 11,00,000 4,00,000<br />
15% Loan − 5,00,000 Debtors 2,00,000 3,00,000<br />
Sundry Creditors 3,00,000 5,00,000 Cash <strong>and</strong> Bank 1,20,000 1,00,000<br />
Bank overdraft 2,00,000 1,00,000 Profit <strong>and</strong> Loss<br />
________ ________ Account − 8,00,000<br />
95,00,000 36,00,000 95,00,000 36,00,000
85<br />
A Ltd. proposes to take advantage of its market potential by making arrangement with or by<br />
acquiring B Ltd.:-<br />
(a) Suggest different ways in which the objective can be fulfilled.<br />
(b) Discuss possible advantages <strong>and</strong> disadvantages that can arise under the different schemes<br />
from operational, financial, marketing <strong>and</strong> tax angles.<br />
(c) Assuming that B Ltd. is to be absorbed by A Ltd. by exchange of shares on the basis of<br />
market quotations for the respective shares, prepare the Balance Sheet of A Ltd. after such<br />
absorption.<br />
4. (a) A company is considering the replacement of its existing machine by a new one. The written<br />
down value of the existing machine is Rs. 50,000 <strong>and</strong> its cash salvage value is Rs. 20,000.<br />
The removal of this machine would cost Rs. 5,000 by way of labour charges, etc. The<br />
purchase price of the new machine is Rs. 20 lakh <strong>and</strong> its expected life is 10 years. The<br />
company follows straight line depreciation without considering scrap value. The other<br />
expenses associated with the new machine are: Carriage inward <strong>and</strong> installation charges<br />
Rs. 15,000, cost of training workers to h<strong>and</strong>le the new machine Rs. 5,000, additional working<br />
capital Rs. 10,000 (which is assumed to be received back by sale of scraps in last year) <strong>and</strong><br />
the fees paid to a consultant for his advice to buy the new machine Rs. 10,000. The annual<br />
savings (before tax) from the new machine would amount to Rs. 2,00,000. The income tax<br />
rate is 50%. The company’s required rate of return is 10%.<br />
Should the new machine be bought?<br />
Note: Present value of Re. 1 at 10% discount rate are as follows:<br />
Year 1 2 3 4 5 6 7 8 9 10<br />
P.V. .91 .83 .75 .68 .62 .56 .51 .47 .42 .39<br />
(b) Write a short note on <strong>Financial</strong> Risk.<br />
(c) Write short notes on the following:<br />
(i) R<strong>and</strong>om Walk theory….<br />
(ii) Right Debentures.<br />
5. (a) Given below is the Balance Sheet of X Ltd. as on 31.3.2005 <strong>and</strong> Profit <strong>and</strong> Loss Statement<br />
for the year ended 31.3.2005 .<br />
Balance Sheet<br />
Liabilities Rs. in lakhs Assets Rs. in lakhs Rs.in lakhs<br />
Share Capital 40,00 Gross Block 70,00<br />
Reserve 20,00 Less: Accumulated Depreciation 20,00 50,00<br />
Profit <strong>and</strong> Loss Account 5,00 Stock 25,00<br />
20% Loan 5,00 Debtors 15,00<br />
Sundry Creditors 34,00 Cash at Bank 15,00<br />
Tax provision<br />
(net of advance tax)<br />
1,00<br />
______<br />
105,00 105,00<br />
Profit <strong>and</strong> Loss Statement<br />
Rs. in lakhs Rs. in lakhs<br />
Sales 58,00<br />
Less: Cost of goods sold 46,00<br />
12,00<br />
Less: Administrative Expenses 1,00
86<br />
Selling & Distribution Expenses 2,50<br />
Depreciation 1,12<br />
Research <strong>and</strong> Development Expenses 48<br />
Finance Charge 1,00 6,10<br />
Profit Before Tax 5,90<br />
Tax Provision 2,95<br />
Profit After Tax 2,95<br />
The company wants to diversify <strong>and</strong> as per new investment plan, it has to collect Rs. 500<br />
lakhs for fixed assets <strong>and</strong> Rs. 100 lakhs for working capital. Also it wants to maintain the<br />
present level of current ratio.<br />
For the year 2005-2006, the finance department supplies the following information:<br />
(i) Sales will be increased by 50%, in volume <strong>and</strong> 25% in price.<br />
(ii) Cost of goods sold to be increased by 20% in terms of price.<br />
(iii) Administrative <strong>and</strong> selling <strong>and</strong> Distribution Expenses will be increased by 5%.<br />
(iv) The Finance Department also plans that the percentage of stock <strong>and</strong> sundry debtors to<br />
sales <strong>and</strong> sundry creditors to cost of goods sold are to be maintained.<br />
Prepare the projected fund flow statement <strong>and</strong> find out the fund to be raised to finance the<br />
new investment plan.<br />
(b) Given below is the capital structure of S Ltd. as on 31.3.2005 (Rs. in thous<strong>and</strong>)<br />
Equity share capital (Shares of Rs. 10 each) 40,000<br />
Share premium 30,000<br />
General Reserve 40,000<br />
Revaluation Reserve 40,000<br />
14% fully convertible debentues 40,000<br />
14% convertible debentures are of Rs. 100 each <strong>and</strong> as per agreement those debentures<br />
will be converted into 5 equity shares. The company earned profit after tax amounting Rs.<br />
20,000 (thous<strong>and</strong>s) during 2005. You are required to calculate EPS of the company as well<br />
as the fully diluted EPS. Calculate fair value of equity shares on fully diluted basis. Use<br />
12% capitalize factor.<br />
6. (a) Distinguish between amalgamation in the nature of merger <strong>and</strong> amalgamation in the nature<br />
of purchase.<br />
(b) Given below is the Balance Sheets of A Ltd. <strong>and</strong> B Ltd. as on 31.3.2005.<br />
Balance Sheets<br />
A Ltd. B Ltd.<br />
(Rs. in thous<strong>and</strong>s)<br />
Share Capital 10,000 12,000<br />
General Reserve 5,000 4,000<br />
Export profit reserve 2,000 3,000<br />
(Statutory reserve as per Income Tax Law)<br />
14% debentures 5,000 5,000<br />
Sundry Creditor 2,000 1,000<br />
Provisions 2,000 2,000<br />
Proposed dividends 2,500 3,000<br />
28,500 30,000
87<br />
Assets:<br />
Fixed Assets 16,500 18,000<br />
Investments 5,000 −<br />
Stock 5,000 5,000<br />
Debtors 1,500 6,500<br />
Cash <strong>and</strong> bank balance 500 500<br />
28,500 30,000<br />
Shares of A Ltd. <strong>and</strong> B Ltd. are of Rs. 10 each. A Ltd. held 15% shares of B Ltd. AB Ltd.<br />
has been formed for the purpose of amalgamation which took over A Ltd. <strong>and</strong> B Ltd. <strong>and</strong> in<br />
exchange shares of AB Ltd. were issued. Expenses for amalgamation were Rs. 100<br />
thous<strong>and</strong>. You are required to prepare post-amalgamation balance sheet of AB Ltd. Show<br />
also the purchase consideration <strong>and</strong> exchange ratio. Detail out no. of shares to be issued to<br />
the shareholders of the amalgamated company without increasing the issued capital.<br />
7. (a) The existing capital structure of XYZ Ltd. is as under:<br />
Rs.<br />
Equity Shares of Rs. 100 each 40,00,000<br />
Retained Earnings 10,00,000<br />
9% Preference Shares 25,00,000<br />
7% Debentures 25,00,000<br />
The existing rate of return on the company’s capital is 12% <strong>and</strong> the income-tax rate is 50%.<br />
The company requires a sum of Rs. 25,00,000 to finance its expansion programme for<br />
which it is considering the following alternatives:<br />
(i) Issue of 20,000 equity shares at a premium of Rs. 25 per share.<br />
(ii) Issue of 10% preference shares.<br />
(iii) Issue of 8% debentures.<br />
It is estimated that the P/E ratios in the cases of equity, preference <strong>and</strong> debenture financing<br />
would be 20, 17 <strong>and</strong> 16 respectively.<br />
Which of the above alternatives would you consider to be the best?<br />
(b) Give reasons for your choice in (a) above.<br />
(c) Write short note on Social Cost Benefit <strong>Analysis</strong>.<br />
8. Welcome Limited is considering the manufacture of a new product. The accountant has prepared<br />
the following estimate of profit in the first year of manufacture:<br />
Rs. Rs.<br />
Sales 9,000 units @ Rs. 32 2,88,000<br />
Cost of goods sold:<br />
Labour 40,000 hours @ Rs. 3.50 per hour 1,40,000<br />
Materials <strong>and</strong> other variable costs 65,000<br />
Depreciation 45,000<br />
2,50,000<br />
Less: Closing stock 25,000 2,25,000<br />
Net Profit 63,000<br />
The product is expected to have a life of four years. Annual sales volume is expected to be<br />
constant over that period at 9,000 units. Production which was estimated at 10,000 units in the<br />
first would be only 9,000 units each in year two <strong>and</strong> three <strong>and</strong> 8,000 units in year four. Debtors at<br />
the end of each year would be 20 per cent of sales during the year; creditors would be 10 per cent
88<br />
of materials <strong>and</strong> other variable costs. If sales differed from the forecast level, stocks would be<br />
adjusted in proportion.<br />
Depreciation relates machinery which would be purchased especially for the manufacture of the<br />
new product <strong>and</strong> is calculated on the straight line basis assuming that the machinery would last<br />
for four years <strong>and</strong> have no terminal scrap value. Fixed costs are included in labour cost.<br />
There is a high level of confidence concerning the accuracy of all the above estimates except the<br />
annual sales volume. Cost of capital is 20 per cent per annum. You may assume that debtors are<br />
realized <strong>and</strong> creditors are paid in the following year. No changes in the prices of inputs or outputs<br />
are expected over the next four years.<br />
You are required to show whether the manufacture of the new product is worthwhile. Ignore<br />
taxation.<br />
Note: Present values Re. 1 at 20% discount rate are as follows:<br />
Year 1 2 3 4 5<br />
P.V. .83 .69 .58 .48 .40<br />
9. Your company manufactures a range of men’s overcoat which are sold directly to retail stores.<br />
The main order for any particular pattern is 10 overcoats but in practice this has become the<br />
general level of most orders. As the management accountant you have been asked to investigate<br />
the effect of increasing the minimum order to 20 overcoats.<br />
From the following data you are required to:<br />
1. Prepare a summary for management showing the following information per overcoat:<br />
Column 1 Column 2 Column 3<br />
Selling price Profit Profit as % of investment<br />
Using the following bases:<br />
(a) Current ‘minimum 10 orders’.<br />
(b) proposed ‘minimum 20 orders’, assuming that present selling price is unchanged.<br />
(c) Proposed ‘minimum 20 orders’, when the selling price will leave unchanged the present<br />
level per overcoat of:<br />
(i) Profit;<br />
(ii) Profit as % of total costs;<br />
(iii) Profit as percentage of investments;<br />
(iv) Contribution;<br />
(v) Percentage mark-up on direct costs.<br />
2. State briefly the circumstances in which management would use basis 1 c (iv) above for<br />
fixing future selling prices.<br />
The current data for overcoat for ‘minimum 10 orders’ are:<br />
Rs.<br />
Direct material cost 3<br />
Direct wages cost 4<br />
Direct selling cost 1<br />
Additional Overhead:<br />
Supervision 1<br />
Depreciation .50<br />
Interest charge .50<br />
Investment 50
Profit amounts to 20% of selling price.<br />
89<br />
The effect of changing to ‘minimum 20 orders’ are:<br />
(i) Reduction of 10% in material usage reflecting a more economical cutting pattern.<br />
(ii) Saving 5% in wages cost due to less set-up time.<br />
(iii) Average selling cost reduced by 25% when booking double-sized orders.<br />
(iv) A 10% saving per overcoat in supervisory cost.<br />
(v) Depreciation cost per overcoat reduced by 10% resulting from better machines<br />
utilisation.<br />
(vi) A 20% reduction in indirect charges due to less stock held to meet urgent orders.<br />
(vii) Investment down by Rs. 10 per overcoat as more stock is carried by retailers.<br />
10. (a) Explain the concept of ‘wealth’ in the context of wealth maximisation objective.<br />
(b) The earnings per share of a company are Rs. 16. The market rate of discount applicable to<br />
the company is 12.5%. Retained earnings can be employed to yield a return of 10%. The<br />
company is considering a payout of 25%, 50% <strong>and</strong> 75%. Which of these would maximize<br />
the wealth of shareholders?<br />
11. (a) Discuss briefly the Modigliani-Miller approach to capital structure <strong>and</strong> cost of capital.<br />
(b) From the following data, find out the value of each firm as per the Modigliani-Miller<br />
approach:<br />
Firm A Firm B Firm C<br />
Rs. Rs. Rs.<br />
EBIT 13,00,000 13,00,000 13,00,000<br />
No. of shares 3,00,000 2,50,000 2,00,000<br />
12% Debenture 9,00,000 10,00,000<br />
Every firm expects 12% return on investment.<br />
12. (a) The abridged Balance Sheet as at 31st March, 2005 of a company is as under:<br />
Liabilities Rs. Assets Rs.<br />
Share capital-equity shares of Rs. 10 each 1,00,000 Fixed Assets 1,80,000<br />
Revenue Reserves 1,50,000 Current Assets:<br />
Trade Creditors 50,000 Stocks 70,000<br />
_______ Debtors 50,000 1,20,000<br />
3,00,000 3,00,000<br />
The company in the next year plans to undertake a major capital investment which will, by<br />
31st March, 2006 increase the fixed assets by Rs. 70,000. Turnover for the year is expected<br />
to go up by 50% <strong>and</strong> the profits before interest <strong>and</strong> taxes also are anticipated to increase by<br />
the same percentage, as will the creditors, stock <strong>and</strong> debtors.<br />
The earnings before tax for the year ended 31st March, 2005 were Rs. 60,000 <strong>and</strong> the rate<br />
of company taxation was 50%. Dividends at the rate of Re. 1 per share were paid at the end<br />
of that year. Dividends per share for the year 2005-06 will be at the same rate per share.<br />
Tax rate is not expected to change.<br />
The company needs large funds for the expansion programme <strong>and</strong> the finance division is<br />
examining the following alternatives for implementation.<br />
(a) issue of 10% convertible debentures for Rs. 2 lakhs; each Rs. 1,000 debenture is<br />
convertible into 80 equity shares;<br />
(b) issue of debentures for Rs. 2 lakhs with interest warrants attached. Interest rate is to<br />
be fixed at 13% p.a. <strong>and</strong> each Rs. 1,000 debenture will enable the holder to purchase
50 equity shares at Rs. 15 each.<br />
90<br />
(c) making a rights issue, which would allow shareholders to buy 8 new shares at Rs.<br />
12/50 each for every five shares presently held.<br />
You are required to consider each of the alternatives separately. You are requested to<br />
indicate the effect of each financing method on the Balance Sheet as at 31st March, 2006<br />
<strong>and</strong> also indicate the underlying earnings per share (earnings per share based on the<br />
number of shares that have been issued as at 31st March, 2006).<br />
You are to assume that the debentures <strong>and</strong> rights issue will be made on 1st April, 2005. In<br />
the case of convertible debentures, assume that all the debentures are converted on 1st<br />
October, 2005. If funds are raised in excess of the needs of the company for 2005-06, you<br />
can assume that they will be held in the form of cash.<br />
(b) Write short note on Current purchasing power method.<br />
13. (a) Why is the capital budgeting decision such an important exercise?<br />
(b) How should the comparison of two mutually exclusive projects be treated when:<br />
(i) they are of unequal investment size?<br />
(ii) they are of unequal lives?<br />
(c) What is desirability factor? How is it determined?<br />
14. (a) A company is considering expansion. Fixed costs amount to Rs. 4,20,000 <strong>and</strong> are expected<br />
to increase by Rs. 1,25,000 when plant expansion is completed. The present plant capacity<br />
is 80,000 units a year. Capacity will increase by 50 per cent with the expansion. Variable<br />
costs are currently Rs. 6.80 per unit <strong>and</strong> are expected to go down by Rs. 0.40 per unit with<br />
the expansion. The current selling price is Rs. 16 per unit <strong>and</strong> is expected to remain same<br />
under either alternative. What are the break even points under either alternative? Which<br />
alternative is better <strong>and</strong> why?<br />
(b) Lately companies are resorting to internal financing for their long term funds. Explain with<br />
arguments whether this is a healthy development.<br />
15. (a) Firm A is studying the possible acquisition of Firm B by way of merger, the following data<br />
are available:<br />
Firm After tax earnings No. of equity shares Market price per share<br />
Rs. Rs.<br />
A 10,00,000 2,00,000 75<br />
B 3,00,000 50,000 60<br />
(i) If the merger goes through by exchange of equity shares <strong>and</strong> the exchange ratio is set<br />
according to the current market prices, what is the new earning per share for Firm A?<br />
(ii) Firm B wants to be sure that its earning per share is not diminished by the merger.<br />
What exchange ratio is relevant to achieve the objective?<br />
(b) ‘ROI is not an adequate measure for judging the financial performance of a business<br />
undertaking’. Comment.<br />
16. (a) Define ‘cost break-even point’. Find the cost break-even points between each pair of plants<br />
whose cost functions are:<br />
Plant A : Rs. 6,00,000 + Rs. 12x<br />
Plant B : Rs. 9,00,000 + Rs. 10x<br />
Plant C : Rs. 15,00,000 + Rs. 8x<br />
(where x is the number of units produced)
91<br />
(b) A firm has Rs. 10,00,000 invested in its plant <strong>and</strong> sets a goal of a 15 per cent annual return<br />
on investment. Fixed costs in the factory presently amount to Rs. 4,00,000 per year <strong>and</strong><br />
variable costs amount to Rs. 15 per unit produced. In the past year the firm produced <strong>and</strong><br />
sold 50,000 units at Rs. 25 each <strong>and</strong> earned a profit of Rs. 1,00,000. How can management<br />
achieve their target profit goal by varying different variables, like fixed costs, variable costs,<br />
quantity sold or increasing the price per unit.<br />
17. A firm is considering to install either of the two machines which are mutually exclusive. The<br />
details of their purchase price <strong>and</strong> operating costs are:<br />
Year Machine X Machine Y<br />
Purchase cost 0 Rs. 10,000 Rs. 8,000<br />
Operating cost 1 Rs. 2,000 Rs. 2,500<br />
Operating cost 2 Rs. 2,000 Rs. 2,500<br />
Operating cost 3 Rs. 2,000 Rs. 2,500<br />
Operating cost 4 Rs. 2,500 Rs. 3,800<br />
Operating cost 5 Rs. 2,500 Rs. 3,800<br />
Operating cost 6 Rs. 2,500 Rs. 3,800<br />
Operating cost 7 Rs. 3,000<br />
Operating cost 8 Rs. 3,000<br />
Operating cost 9 Rs. 3,000<br />
Operating cost 10 Rs. 3,000<br />
Machine X will recover salvage value of Rs. 1,500 in the year 10, while Machine Y will recover Rs.<br />
1,000 in the year 6. Determine which machine is cheaper at 10 per cent cost of capital assuming<br />
that both the machines operate at the same efficiency. Present value of Re. 1 at 10% discounting<br />
factor.<br />
Year Factor<br />
1 .9091<br />
2 .8264<br />
3 .7513<br />
4 .6830<br />
5 .6209<br />
6 .5645<br />
7 .5132<br />
8 .4665<br />
9 .4241<br />
10 .3855<br />
Present value of an annuity of Re. 1 per period at 10% discounting factor:<br />
At the end of year 6 = 4.3553<br />
At the end of year 10 = 6.1446<br />
Capital recovery factor at 10%<br />
For 6 years = .2296<br />
For 10 years = .1628<br />
18. (a) A company needs Rs. 12 lakhs for the installation of a new factory which would yield an<br />
annual EBIT of Rs. 2,00,000. The company has the objective of maximizing the earnings<br />
per share. It is considering the possibility of issuing equity shares plus raising a debt of Rs.<br />
2,00,000, Rs. 6,00,000 or Rs. 10,00,000. The current market price per share is Rs. 40 which
92<br />
is expected to drop to Rs. 25 per share if the market borrowings were to exceed Rs.<br />
7,50,000. Cost of borrowings are indicated as under:<br />
Upto Rs. 2,50,000 − 10% p.a.<br />
Between Rs. 2,50,001 <strong>and</strong> Rs. 6,25,000 − 14% p.a.<br />
Between Rs. 6,25,001 <strong>and</strong> Rs. 10,00,000 − 16% p.a.<br />
Assuming a tax rate of 50%, work out the EPS <strong>and</strong> the scheme which would meet the<br />
objective of the management.<br />
(b) What is a decision-tree approach in capital budgeting <strong>and</strong> how is this useful?<br />
19. Garden Products Limited manufacture the “Rainpour” garden spray. The accounts of the<br />
Company for the year 2005 are expected to reveal a profit of Rs. 14,00,000 from the manufacture<br />
of “Rainpour” after charging fixed costs of Rs. 10,00,000. The “Rainpour” is sold for Rs. 50 per<br />
unit <strong>and</strong> has a variable unit cost of Rs. 20.<br />
Market sensitivity tests suggest the following responses to price changes:-<br />
Alternatives Selling price reduced by Quantity sold increased by<br />
A 5% 10%<br />
B 7% 20%<br />
C 10% 25%<br />
Evaluate these alternatives <strong>and</strong> state which, on profitability consideration, should be adopted for<br />
the forthcoming year, assuming cost structure unchanged from 2005.<br />
20. The following is the Balance Sheet as at 31st March, 2005 of Y Manufacturing Company Ltd.<br />
Liabilities<br />
Authorised Share<br />
Capital:<br />
Rs. Assets Rs.<br />
7,500 Equity shares<br />
Fixed Assets:<br />
of Rs. 100 each<br />
7,50,000 L<strong>and</strong><br />
50,000<br />
5,000, 13.5%<br />
cumulative<br />
preference shares of<br />
Rs. 100 each<br />
5,00,000<br />
12,50,000<br />
Issued, Subscribed<br />
<strong>and</strong> Paid up:<br />
5,000 Equity shares<br />
of Rs. 100 each, Rs.<br />
50 per shares called<br />
<strong>and</strong> paid up<br />
3,000, 13.5%<br />
2,50,000<br />
cumulative<br />
preference shares of<br />
Rs. 100 each, Rs. 75<br />
per share called <strong>and</strong><br />
paid up<br />
Reserves <strong>and</strong><br />
Surplus:<br />
2,25,000<br />
General Reserve 3,00,000<br />
Profit <strong>and</strong> Loss<br />
Account<br />
Secured Loan:<br />
2,00,000 5,00,000<br />
Buildings<br />
Plant <strong>and</strong><br />
Machinery<br />
Patents<br />
Current Assets:<br />
Sundry Debtors<br />
Stock in trade<br />
Cash at Bank<br />
Cash in h<strong>and</strong><br />
1,25,000<br />
2,75,000<br />
50,000<br />
4,20,000<br />
5,75,000<br />
1,10,000<br />
40,000<br />
5,00,000<br />
11,45,000
13½% Debentures<br />
First Issued, secured<br />
on fixed assets<br />
Current Liabilities:<br />
Creditors for goods 75,000<br />
Bills payable 1,20,000<br />
Others 75,000<br />
4,00,000<br />
93<br />
2,70,000 ________<br />
16,45,000 16,45,000<br />
The company has an expansion scheme under consideration which will require an investment of<br />
Rs. 4 lakhs in additional plant <strong>and</strong> machinery, Rs. 2 lakhs in additional buildings, Rs. 1 lakh for<br />
acquisition of patent rights, Rs. 2 lakhs in additional investment in stocks <strong>and</strong> Rs. 1 lakh in<br />
working capital. You are informed that the company cannot cut short its investments in present<br />
inventories or quicken the pace of collection of Sundry Debtors. The present holdings of cash <strong>and</strong><br />
bank balances are available for utilization.<br />
The company’s shares are widely held <strong>and</strong> a similar undertaking engaged in the same business<br />
as the company, has its Rs. 100 fully paid equity shares quoted on the Stock Exchange at Rs.<br />
160 each, on a dividend yield of Rs. 20 per share. Y Company’s shares are presently quoted on<br />
the Exchange at Rs. 75 per share, which ratio the management does not want to be disturbed.<br />
The expansion scheme proposed is expected to yield immediate results <strong>and</strong> additional profits of<br />
Rs. 2.5 lakhs are expected for the year ended 31st March, 2006 <strong>and</strong> annually every subsequent<br />
year.<br />
The company’s banker, when approached for assistance, has agreed to a long term loan at 20%<br />
interest per annum. The company can also raise public deposits at 15% per annum or in the<br />
alternative float additional debentures.<br />
As the finance manager of the company, what would be your recommendation for sources of<br />
financing? You are informed that the company will not be able to increase the authorized capital.<br />
Assume an average income-tax rate of 50% <strong>and</strong> that the entire additional net profits generated<br />
will be available for distribution. Give reasons for your answer.<br />
21. A Limited manufactures three different products <strong>and</strong> the following information has been collected<br />
from the books of accounts:<br />
Product<br />
S T Y<br />
Sales mix 35% 35% 30%<br />
Selling price Rs. 30 40 20<br />
Variable cost Rs. 15 20 12<br />
Total fixed costs Rs. 1,80,000<br />
Total sales Rs. 6,00,000<br />
The company has currently under discussion, a proposal to discontinue the manufacture of<br />
product Y <strong>and</strong> replace it with product M, when the following results are anticipated:<br />
Product<br />
S T M<br />
Sales mix 50% 25% 25%<br />
Selling price Rs. 30 40 30<br />
Variable cost Rs. 15 20 15<br />
Total fixed costs Rs. 1,80,000<br />
Total sales Rs. 6,40,000
94<br />
Will you advise the company to changeover to production of M? Give reasons for your answer.<br />
22. Calculate cost of a project of a 30,000 tpa carbon black project in Orissa from the following<br />
figures. You may assume appropriate percentages wherever necessary.<br />
1. L<strong>and</strong> 80 bighas @ Rs. 30,000 per bigha.<br />
2. Site development charges – Rs. 20 lakhs.<br />
3. Interest during construction period – Rs. 1 crore.<br />
4. Preliminary expenses – Rs. 15 lakhs.<br />
5. Building <strong>and</strong> civil works – 15% of plant <strong>and</strong> equipment including spares.<br />
6. Plant <strong>and</strong> machinery including spares ex-works – Rs. 50 cores (Average Excise duty @<br />
20%)<br />
7. Start up <strong>and</strong> commissioning - @12% of ex-works price of plant <strong>and</strong> equipment.<br />
8. Construction, water, power <strong>and</strong> approach road etc. – Rs. 15 lakhs.<br />
9. Engineering consultancy fee @ 3% of applicable project cost.<br />
10. Foreign technical know-how <strong>and</strong> training – US $ 80,000. The present dollar rate is @ US $<br />
= Rs. 45.<br />
11. Provision of contingencies to be provided @ 6% on l<strong>and</strong>, building <strong>and</strong> site development <strong>and</strong><br />
on balance @ 10%.<br />
12. Miscellaneous Fixed Assets – Rs. 45 lakhs.<br />
13. Environment – Cost Rs. 300 lakhs.<br />
14. Working Capital – Rs. 2,500 lakhs.<br />
You are required to prepare a statement of cost of project in a manner as desired by financial<br />
institutions. The cost of octroi, if any, may be ignored. Figures may also be rounded up wherever<br />
appropriate.<br />
23. M.M. Kusha Ltd. is being set up to manufacture an item. The expected cost <strong>and</strong> proposed<br />
financing pattern during the construction period <strong>and</strong> first operating year are shown below:<br />
(Rs. in lakhs)<br />
Proposed outlays Construction period 1st operating year<br />
L<strong>and</strong> 150 −<br />
Building 750 −<br />
Plant <strong>and</strong> Machinery 3,000 −<br />
Miscellaneous Fixed Assets 500 −<br />
Preliminary Expenses 250 −<br />
Pre-operative Expenses 650 −<br />
Current Assets (other than cash) − 2,700<br />
5,300 2,700<br />
Financing pattern:<br />
Equity share capital 2,200<br />
Term loans from financial institutions 3,100 900<br />
Borrowings from banks − 1,800<br />
5,300 2,700<br />
The following additional information may be considered while preparing projected financial<br />
statements.<br />
(i) The construction will be completed in a year’s time commencing on April 1st, 2005 <strong>and</strong><br />
ending on March 31st , 2006.
95<br />
(ii) The first operating year will begin on April 1st , 2006 <strong>and</strong> end on March 31st , 2007.<br />
(iii) The financial institutions have extended the term loan @ 18% interest repayable in 16 equal<br />
<strong>and</strong> semi annual instalments after a grace period of 3 years. The interest on term loan<br />
during the construction period is included in pre-operative expenses. The term loan<br />
financing of Rs. 900 lakhs in the first operating year will be from April 1st , 2006.<br />
(iv) Bank borrowings of Rs. 1,800 lakhs will also be from April 1st , 2006 at the rate of 16%.<br />
(v) Pre-operative expenses may be allocated to l<strong>and</strong>, building, plant <strong>and</strong> machinery <strong>and</strong><br />
miscellaneous fixed assets in proportion of their values.<br />
(vi) The expected revenues <strong>and</strong> cost of sales (excluding depreciation, other amortisation <strong>and</strong><br />
interest) for the first operating year are Rs. 5,500 lakhs <strong>and</strong> Rs. 3,500 lakhs respectively.<br />
(vii) The depreciation rates to be followed are<br />
Building 5.00%<br />
Plant <strong>and</strong> Machinery 10.00%<br />
Miscellaneous Fixed Assets 10.00%<br />
(viii) There will be no tax liability for the first operating year.<br />
(ix) Preliminary expenses are to be written off over a period of 10 years.<br />
You are required to prepare the following statements:<br />
(a) Projected income statement for the first operating year.<br />
(b) Projected cash flow statement for the construction period <strong>and</strong> first operating year.<br />
(c) Balance Sheet as at March 31st , 2006 <strong>and</strong> 2007.<br />
Note: Figures may be rounded up wherever necessary.<br />
24. A firm is contemplating import of a consignment from the USA for a value of US dollars 10,000.<br />
The firm requires 90 days to make payment. The supplier has offered 60 days interest-free credit<br />
<strong>and</strong> is willing to offer additional 30 days credit at an interest rate of 6% per annum. The bankers<br />
of the firm offer a short loan for 30 days at 9% per annum. The bankers’ quotation for foreign<br />
exchange is:<br />
Spot 1 USD = Rs. 46.00<br />
60 day forward 1 USD = Rs. 46.20<br />
90 day forward 1 USD = Rs. 46.35<br />
You are required to advise the firm as to whether it should<br />
(i) pay the supplier in 60 days, or<br />
(ii) avail the supplier’s offer of 90 days credit. Show your calculations.<br />
25. An investor is concerned with the investment of Rs. 1,00,000. He has two securities, A <strong>and</strong> B, for<br />
this purpose. Data in respect of these securities is as follows:<br />
A B<br />
Expected Return 12% 20%<br />
St<strong>and</strong>ard Deviation of return 10% 18%<br />
Co-efficient of correlation,<br />
r, between A <strong>and</strong> B = 0.15<br />
The investor has decided to consider only five portfolios of A <strong>and</strong> B as follows:<br />
(i) All funds invested in A<br />
(ii) 50% of funds in each of A <strong>and</strong> B
(iii) 75% of funds in A <strong>and</strong> 25% in B<br />
(iv) 25% of funds in A <strong>and</strong> 75% in B<br />
(v) All funds invested in B.<br />
You are required to calculate:<br />
96<br />
(a) The expected return under different portfolios.<br />
(b) Risk factor associated with these portfolios.<br />
(c) Which portfolio is best for him from the point of risk, <strong>and</strong><br />
(d) Which portfolio is best for him from the point of view of return.<br />
26. Cascade Ltd. is planning to import a multi-purpose machine from Japan at a cost of 3,400 lakhs<br />
yen. The company can avail loans at 18% interest per annum with quarterly rests with which it<br />
can import the machine. However, there is an offer from Tokyo branch of an Indian based bank<br />
extending credit of 180 days at 2% per annum against opening of an irrevocable letter of credit.<br />
Other information:<br />
• Present exchange rate Rs. 100 = 340 yen<br />
• 180 days forward rate Rs. 100 = 345 yen<br />
• Commission charges for letter of credit at 2% per 12 months<br />
Advise whether offer from the foreign branch should be accepted.<br />
1. (a) Workings:<br />
SUGGESTED ANSWERS/HINTS<br />
Cost less salvage value<br />
Annual depreciation<br />
=<br />
Estimated life<br />
Rs. 7,50,000 − Rs. 50,000<br />
=<br />
= Rs. 70,000<br />
10<br />
Computation of Net Present Value of Machine:<br />
Cash outflow at the outset: P.V. factor at Present value<br />
10% of cash flows<br />
Rs. Rs.<br />
Cost of machine 7,50,000<br />
Additional investment in working capital 50,000 _______<br />
Cash inflows:<br />
8,00,000 1.00 8,00,000<br />
(i) Annual cash inflows for 10 years<br />
Savings before tax 1,80,000<br />
Less: Income tax (50%) 90,000<br />
90,000<br />
Add: Depreciation 70,000<br />
1,60,000 6.14 9,82,400<br />
(ii) Cash inflows at the end of year 10:<br />
Salvage value 50,000<br />
Release of investment from working capital 50,000<br />
1,00,000 0.39 39,000<br />
Total present value of cash inflows 10,21,400<br />
Net present value 2,21,400<br />
Since the investment in new machine will generate a net present value of Rs. 2,21,400, the<br />
company should make the investment.
(b) Internal Rate of Return:<br />
97<br />
Internal Rate of Return is that rate at which the sum of discounted cash inflows equals the<br />
sum of discounted cash outflows. Normally a discounting rate equivalent to the cost of<br />
capital of the company is used for working out the present values of the cash inflows <strong>and</strong><br />
cash outflows. It is quite likely that this process gives a positive or a negative net present<br />
value. To equalize the outflows <strong>and</strong> the inflows, if the net present value is positive, a higher<br />
discounting rate may be used to work out the present value. The internal rate of return will<br />
be that rate of discount at which the discounted cash inflows <strong>and</strong> the discounted cash<br />
outflows are equal.<br />
In case an undertaking has two or more projects competing for the funds at its disposal, the<br />
question of choosing a project arises. The ranking of projects can be done on the basis of<br />
either the net present value method or internal rate of return. A problem may, however,<br />
arise as given below:<br />
Project A Project B<br />
Net present value 1,20,000 80,000<br />
Internal Rate of Return 16% 20%<br />
Which of the two projects is better? To underst<strong>and</strong> the relative merits of internal rate of return<br />
<strong>and</strong> net present value (the latter is based on discounting at the cut of rate or at a fixed rate, one<br />
has to consider the basic presumption behind all discounting, i.e., the cash inflows must be<br />
reinvested to yield the discounting rate. It is obvious that reinvestment of funds at the cut off rate<br />
is more possible than at the internal rate of return which is very high in the given case. Hence,<br />
the net present values being obtained from discounting at a fixed cut off rate are more reliable in<br />
ranking two or more projects than the internal rate of return.<br />
2. (a) A large types of business risks can be covered by insurance. Today, it is possible to cover<br />
almost any type of risk by a suitable insurance policy. A prudent businessman should,<br />
therefore, protect himself against the various risks connected with his business. The various<br />
types of risks which he can cover by the suitable insurance policy are accident insurance,<br />
cash in transit policy, goods in transit policy, stock declaration policy, loss of profit policy,<br />
third party risk insurance, fidality guarantee policy, plate-glass insurance etc. Many<br />
businessmen take out all risk insurance policy. This policy covers loss or damage by fire,<br />
theft etc. A very common risk insured by business man is loss by fire to the premises. A<br />
new type of policy is now becoming popular covering the loss of profit consequent on fire.<br />
The object of this type of policy is to protect the business against loss of profit occasioned by<br />
fire. For example, if property housing a factory is damaged by fire it may result in the factory<br />
not being able to operate for sometime <strong>and</strong> cause loss of profit which would otherwise have<br />
been made. In addition to such loss, there are certain st<strong>and</strong>ing charges such as rent, wages<br />
etc, which may still have to be paid. All this can be covered by a suitable insurance policy.<br />
In marine insurance there are two distinguished branches namely, Cargo Insurance <strong>and</strong> Hull<br />
Insurance. Cargo Insurance deals with insurance of Cargo in transit. Hull Insurance deals<br />
with insurance of vessels or steamers against marine risks.<br />
The premium charged by insurance company depends upon the nature <strong>and</strong> the extent of the<br />
risk. It is the duty of the insurance manager to minimize the risks of business by taking<br />
adequate insurance policies against the risk, which cannot be avoided. But at the same time<br />
he has also to consider the incidence of premiums.<br />
In many cases it may be beneficial not to insure at all with outside insurers. For example,<br />
very strict safeguard <strong>and</strong> extremely efficient fire fighting service arrangements made obviate<br />
the necessity of insurance against fire. In deciding what type of business risks should be<br />
covered by insurance the company should base its decision primarily on a pay off between<br />
the nature <strong>and</strong> the quantum of risk that exists for an undertaking <strong>and</strong> the amount of premium<br />
required to be paid to protect it against that risk. Thus in the case of large organizations<br />
who may have assets of such huge values that paying insurance premiums to outside<br />
insurers may be much more expensive than the possible loss that may reasonably occur
98<br />
annually on account of fire, theft or accident etc. As such these organizations may not find it<br />
profitable to take an insurance policy.<br />
(b) Walter’s formulation on dividend policy:<br />
The formula given by Prof. James E. Walter shows how the dividend policy can be used to<br />
maximize the wealth position of the equity holders. He argues that in the long run, the share<br />
prices reflect only the present value of the expected dividends. Retentions influence share<br />
price through their effect on further dividends.<br />
According to him, the relationship between dividends <strong>and</strong> share prices can be shown on the<br />
basis of the following formula:<br />
R a<br />
D +<br />
R c<br />
Vc<br />
=<br />
R<br />
Where,<br />
( E − D)<br />
c<br />
Vc = Markets value of the ordinary shares of the company.<br />
Ra = Return on internal retention, i.e., the rate company earns on retained profits.<br />
Rc = Capitalisation rate, i.e., the rate expected by the investors by way of return<br />
from the particular category of shares.<br />
E = Earnings per share.<br />
D = Dividend per share.<br />
A close study of the formula would indicate that Professor Walter emphasizes two factors<br />
which influence the market price of a share. The first is the dividend per share <strong>and</strong> the<br />
second is the relationship between internal return on retained earnings <strong>and</strong> the market<br />
expectation from that company as reflected in the capitalization rate. In other words, if the<br />
internal return of retained earnings is higher than the market capitalisation rate, the value of<br />
the ordinary shares would be high even if the dividends are low. However, if the internal<br />
return within the business is lower than what the market expects, the value of the share<br />
would be low. In such a case, the share holders would prefer that a higher dividend is<br />
declared so that they can utilise the funds so obtained elsewhere in more profitable<br />
opportunities.<br />
The above formula given by Prof. Walter explains to a great extent the dividend practices of<br />
companies. The formula explains that the growth companies may even pay lows dividends,<br />
still the prices of their shares will not come down rather they will go up. It also explains why<br />
the market price of shares of certain companies who pay higher dividends <strong>and</strong> retain very<br />
low profits is also high. In fact, the market price of shares is dependent upon two factors:<br />
firstly, the quantum of dividend <strong>and</strong> secondly, the profitable opportunities available to the<br />
company in investing the monies retained. When a company retains a part of its profits, it<br />
has to think in terms of the cost of such retention. The retention of profits depends upon<br />
whether it is cheaper <strong>and</strong> more profitable for the shareholders of the company to have the<br />
corporate earnings retained in the business or get the same in the form of cash dividend.<br />
This involves a comparison between the cost of retained earnings <strong>and</strong> the cost of distributing<br />
them. The cost of retained earnings, therefore, involves, an opportunity cost, i.e., the<br />
benefits which the shareholders forego in terms of the leaving funds in the business. These<br />
considerations help the companies shaping their dividend policies.<br />
(c) Payback reciprocal: As the name indicates it is the reciprocal of payback period. A major<br />
drawback of the payback period method of capital budgeting is that it does not indicate any<br />
cut-off period for the purposes of investment decisions. It is, however, argued that the<br />
reciprocal of the payback would be a close approximation of the internal rate of return if the<br />
life of the project is at least twice the payback period <strong>and</strong> the project generates equal<br />
amount of annual cash inflows. In practice, the payback reciprocal is a helpful tool for
99<br />
quickly estimating the rate of return of a project provided its life is at least twice the payback<br />
period. The payback reciprocal can be calculated as follows:<br />
Average annual cash inflows<br />
Initial investment<br />
Suppose a project requires an initial investment of Rs. 20,000 <strong>and</strong> it would give an annual<br />
cash inflow of Rs. 4,000. The useful life of the project is estimated to be 5 years. In this<br />
example, payback reciprocal will be:<br />
Rs. 4,000<br />
Rs. 20,000<br />
= 20%<br />
The above payback reciprocal provides a reasonable approximation of the internal rate of<br />
return i.e. 19%.<br />
3. (a) The following are the important possible ways in which the objectives can be fulfilled.<br />
(1) Making arrangement with B Ltd. by entering into a contract for production of ‘A’ Ltd.’s<br />
br<strong>and</strong>.<br />
(2) By increasing the share holding <strong>and</strong> then by making common programme of production<br />
<strong>and</strong> marketing.<br />
(3) By making B Ltd. a subsidiary company <strong>and</strong> then making arrangement as in (2) above,<br />
i.e., common programme of production <strong>and</strong> marketing.<br />
(4) By merger by way of absorption of B Ltd. into A Ltd.<br />
(b) The possible advantages <strong>and</strong> disadvantages that can arise under the different schemes<br />
stated in (a) above from operational financial marketing <strong>and</strong> tax angles are discussed below:<br />
(1) Entering into a contract: Presently the selling price per unit of B Ltd.’s product is less<br />
<strong>and</strong> its variable cost is high in comparison to that of A Ltd. Under the arrangements, A<br />
Ltd., will be able to take advantage of its market potential by supplying a large volume<br />
of product; the additional dem<strong>and</strong> being met out of the production made by B Ltd. for A<br />
Ltd. It is assumed that B Ltd. will continue to produce A Ltd.’s br<strong>and</strong> at its current price<br />
i.e. Rs. 16 per unit. A Ltd.’s selling price is Rs. 18 per unit. The difference between the<br />
two prices will generate profit for A Ltd. The arrangement would not put any pressure<br />
on A Ltd. in terms of need for greater finances <strong>and</strong> creation of other facilities.<br />
Alternatively, A Ltd. may arrange to supply the raw material <strong>and</strong> get the product<br />
manufactured by B Ltd., against reasonable manufacturing expenses. The<br />
arrangement would also benefit B Ltd. as it would be able to recover more of its fixed<br />
costs as a result of increased capacity utilization; at the same time being assured of<br />
permanent marketing outlet for its product.<br />
It is however, possible that in the long run when customers of A Ltd. comes to know<br />
that there is no difference between the products of A Ltd.. <strong>and</strong> B Ltd. continues to<br />
market its product at Rs. 16 per unit, the customers of A Ltd. also may start purchasing<br />
the product from B Ltd. itself. Once this happens the arrangement will not be of any<br />
advantage to A Ltd.<br />
(2) Acquisition of control by increasing shareholding or by making B Ltd. a subsidiary<br />
company: Under this scheme, A Ltd. will be able to draw a common programme of<br />
production <strong>and</strong> marketing. This would enable A Ltd., to take advantage of its market<br />
potential to the benefit of both the companies. A Ltd. can also ask B Ltd. to scrutinize<br />
its cost structure, particularly the variable cost per unit. If B Ltd. can also reduce its<br />
variable cost to Rs. 10 as that of A Ltd., Company B will get more strength from<br />
operational st<strong>and</strong>point.<br />
However, to gain control over B Ltd., A ltd. will have to part with funds to purchase<br />
more shares in B Ltd. In the present circumstances when B Ltd. is incurring losses, it<br />
may not be considered profitable to increase investment in B Ltd. There is however,
100<br />
hope that economies of scale in procurement <strong>and</strong> production will cause reduction in the<br />
variable cost <strong>and</strong> give an opportunity to the companys to have balanced production <strong>and</strong><br />
pricing policy. Common marketing strategies <strong>and</strong> concerted financial planning may in<br />
the long run improve the profitability of B Ltd. B Ltd. has necessary extra capacity <strong>and</strong><br />
A Ltd. has an immense marketing potential.<br />
(3) Merger by Way of Absorption: This way of achieving objective i.e. to take advantage of<br />
immense market potential will have all the benefits which are available in other<br />
schemes stated above. This scheme will also not subject the company to the<br />
disadvantages mentioned under scheme (1) above. Once B Ltd. is merged in A Ltd., A<br />
Ltd. will be in a better position to take advantage of economies of scale in procurement<br />
<strong>and</strong> production for reduction of variable cost, balanced production <strong>and</strong> pricing policy<br />
<strong>and</strong> appropriate market strategies. The greatest advantage of adopting the scheme of<br />
merger may be to derive the benefits under Section 72A of the Income Tax Act. This<br />
section provides that the amalgamated company can carry-forward <strong>and</strong> set-off the<br />
accumulated losses <strong>and</strong> unabsorbed depreciation allowance of the amalgamating<br />
company subject to compliance with certain conditions. According to this section, the<br />
accumulated losses <strong>and</strong> the unabsorbed depreciation allowance, if any, of B Ltd. shall<br />
be treated as the loss or depreciation allowance of A Ltd., for the previous year in<br />
which the amalgamation is effected.<br />
(c) Workings:<br />
(i) On the basis of market quotations for respective shares, the exchange ratio will be : 3<br />
shares of A Ltd. as against 8 shares of B Ltd.<br />
(ii) Shares to be issued: (2,00,000 – 8,000) × 3/8 = 72,000. Value at par Rs. 7,20,000.<br />
(iii) Net assets to be acquired Rs. 12,00,000 (Rs. 28,00,000 – Rs. 16,00,000).<br />
(iv) Capital Reserve : Net assets – Par value of shares issued – Investment In B Ltd.<br />
= Rs. 12,00,000 – Rs. 7,20,000 – Rs. 80,000<br />
= Rs. 4,00,000.<br />
Balance Sheet of A Ltd. (after absorption)<br />
Liabilities Rs. Assets Rs.<br />
Share Capital (Rs. 10 each) 57,20,000 Fixed Assets 1,00,00,000<br />
Reserve <strong>and</strong> Surplus 34,00,000 Stock 15,00,000<br />
10% Debentures 15,00,000 Debtors 5,00,000<br />
15% Loan 5,00,000 Cash <strong>and</strong> Banks 2,20,000<br />
Sundry creditors 8,00,000<br />
Bank Overdraft 3,00,000 _________<br />
1,22,20,000 1,22,20,000<br />
Note: In the above solution balance sheet has been prepared on the assumption that entry<br />
for issue of shares to settle purchase consideration has been made at par value. However,<br />
on the basis of market value of the shares of A Ltd., the total value of the purchase<br />
consideration comes to Rs. 28,80,000 (i.e. 72,000 × Rs. 40). Alternatively, one may<br />
consider purchase consideration to be Rs. 28,80,000. In that case, a sum of Rs. 21,60,000<br />
(Rs. 28,80,000 – Rs. 7,20,000) may be shown as share premium <strong>and</strong> a sum of Rs.<br />
17,60,000 as goodwill in the balance sheet.<br />
4. (a) Cash outlay associated with the new machine<br />
(Assumed to be at the beginning)<br />
Rs. Rs.<br />
Purchase price of the machine 20,00,000<br />
Add: Carriage inward <strong>and</strong> installation charges 15,000
101<br />
Cost of training workers<br />
Additional working capital (This will also be treated as<br />
5,000<br />
cash inflow in the last year of the new machine life)<br />
10,000<br />
Fees paid to the consultant for his advise to buy the<br />
new machine<br />
10,000<br />
20,40,000<br />
Less: Cash salvage value of the old machine 20,000<br />
Less: Cost of removal<br />
Add: Tax shield on loss on the old machine 50% of<br />
5,000<br />
15,000<br />
(Rs. 50,000 – Rs. 15,000) = Rs. 35,000<br />
17,500 32,500<br />
Net investment in the new machine…………….. 20,07,500<br />
Cash inflows associated with the new machine<br />
Savings before tax<br />
Rs.<br />
2,00,000<br />
Less: Tax (50%) 1,00,000<br />
1,00,000<br />
Add: Depreciation (10% of Purchase price plus Carriage inward plus<br />
Cost of training workers plus fees paid to consultant)<br />
2,03,000<br />
Net annual cash inflow 3,03,000<br />
Thus, on an investment of Rs. 20,07,500, the new machine would yield Rs. 3,03,000 each<br />
year. In addition, the working capital of Rs. 10,000 would also be treated as cash inflow at<br />
the end of the tenth year.<br />
At 10% discount rate, the present value of annual cash inflows would be:<br />
Rs.<br />
Rs. 3,03,000 × 6.14 = 18,60,240<br />
Add: P.V. of Rs. 10,000 received in the 10th year Rs. 10,000 × 0.39 3,900<br />
Present value of all cash inflows 18,64,320<br />
Thus, the Net Present Value = Rs. 18,64,320 – Rs. 20,07,500<br />
= –Rs. 1,43,180.<br />
Since the NPV is negative, the new machine should not be bought.<br />
(b) <strong>Financial</strong> risk encompasses the volatility of earnings available to the equity shareholders as<br />
well as the probability of cash insolvency. Thus the financial risk is of two types (i) Risk of<br />
variations in the expected earnings available to equity shareholders <strong>and</strong> (ii) the risk of cash<br />
insolvency.<br />
(i) The risk of variations in expected earnings available to equity shareholders: If a firm<br />
has higher debt, the risk of variations in expected earnings available to equity<br />
shareholders will be higher. This is because of trading on equity or financial leverage.<br />
We know that financial leverage works both ways, i.e. it enhances the shareholders’<br />
return by a high magnitude or brings it down sharply depending upon whether the<br />
return on investment is higher or lower than the rate of interest. Thus there will be<br />
lower probability that the equity shareholders will enjoy a stable dividend if the debt<br />
content is higher in the capital structure. In other words, the relative dispersion of<br />
expected earnings available to equity share-holders will be greater if the capital<br />
structure of a firm has a higher debt content.<br />
(ii) The risk of cash insolvency: As a firm raises more debt, its risk of cash insolvency
102<br />
increases. This is due to two reasons. Firstly, higher proportion of debt increases the<br />
commitments of the company with regard to fixed charges. This means that a company<br />
st<strong>and</strong>s committed to pay higher amount of interest irrespective of the fact whether it<br />
has cash or not. Secondly, the possibility that the supplier of funds may withdraw the<br />
funds at any given point of time also raises the risk of cash insolvency. Thus the long<br />
term creditors may have to be paid back in instalments, even if sufficient cash to do so<br />
does not exist. This risk is not there in the case of equity shares.<br />
The financial risk involved in various sources of finance can be understood by taking<br />
the example of debentures. A company has to pay interest charges on debentures even<br />
when it does not make any profits. Also the principal sum has to be repaid under the<br />
stipulated agreement. The debentureholders also have a charge against the assets of<br />
the company. Thus, they can enforce a sale of the assets in case the company fails to<br />
meet its contractual obligations. Debentures also increase the risk of variations in the<br />
expected earning available to the shareholders through leverage effect i.e., if return on<br />
investment remains higher than the interest rate, the shareholders will get a high return;<br />
but if reverse is the case, the shareholders may get no return at all.<br />
(c) (i) R<strong>and</strong>om Walk theory: Many investment managers <strong>and</strong> stock market analysts believe<br />
that the stock market prices can never be predicted because they are not a result of<br />
any underlying factors but are mere statistical ups <strong>and</strong> downs. This hypothesis is<br />
known as R<strong>and</strong>om Walk Hypothesis which states that the behaviour of stock market<br />
prices is unpredictable <strong>and</strong> that there is no relationship between the present prices of<br />
the shares <strong>and</strong> their future prices. Proponents of this hypothesis argue that stock<br />
markets prices are independent. A British Statistician, M.G. Kendell, found that<br />
changes in security prices behave nearly as if they are generated by a suitably<br />
designed roulette wheel for which each outcome is statistically independent of the past<br />
history. In other words, the fact that there are peaks <strong>and</strong> troughs in the stock exchange<br />
prices is a mere statistical happening-successive peaks <strong>and</strong> troughs are unconnected.<br />
In the layman’s language it may be said that the prices on the stock exchange behave<br />
exactly the way a drunk would behave while walking in a blind lane, i.e. up <strong>and</strong> down,<br />
with an unsteady gait going in any direction he likes, bending on one side once <strong>and</strong> on<br />
the other side the second time.<br />
(ii) Right Debentures: A public Limited Company can issue rights debentures to finance<br />
permanent working capital requirements on a long-term basis. It may enable the<br />
company to reduce its dependence on other forms of financing for working capital<br />
requirements. The issue of rights debentures is governed by the debentures issue<br />
guidelines. According to these guidelines, the right debentures can be issued to<br />
augment working capital on long-term basis. The amount of such debentures shall not<br />
exceed 20% of gross current assets, loans <strong>and</strong> advances. The debt equity ratio<br />
including the proposed debentures issue will not normally exceed 2 : 1. Debentures<br />
can be convertible or non-convertible. In the case of convertible debentures, the rate of<br />
interest shall not exceed 13.5% per annum. In the case of non-convertible debentures,<br />
the rate of interest shall not exceed 15% per annum. The debentures shall not<br />
normally be redeemable before the expiry of 7 years. A premium upto 5% of the face<br />
value can be allowed at the time of redemption, in the case of non-convertible<br />
debentures only. The face value of debentures will ordinarily be Rs. 100 each <strong>and</strong> they<br />
will normally be listed on the stock exchange. Only secured debentures will be<br />
permitted for issue to the public. The issue of debentures will be underwritten. The<br />
relaxation may be permitted in this regard if the SEBI is otherwise satisfied.
103<br />
5. (a) Projected Profit <strong>and</strong> Loss Statement<br />
for the year ended 31.3.2006<br />
Rs. in lakhs Rs. in lakhs<br />
Sales (5,800 × 1.5 × 1.25) 108,75<br />
Less: Cost of goods sold (4,600 × 1.5 × 1.2) 82,80<br />
Gross profit 25,95<br />
Less: Administrative Expenses (100 × 1.05) 1,05<br />
Selling & Distribution Expenses (250 × 1.05) 2,62.5<br />
Research <strong>and</strong> Development Expenses 48<br />
Depreciation 1,12<br />
Finance Charge 1,00 6,27.50<br />
19,67.50<br />
Less: Tax provision 9,83.75<br />
Profit After Tax 9,83.75<br />
Projected Balance Sheet as on 31.3.2006<br />
Liabilities Rs. in lakhs Assets Rs. in lakhs Rs.in lakhs<br />
Share Capital 40,00.00 Gross Block 70,00<br />
Reserve 20,00.00 Less: Accumulated Depreciation 21,12 48,88.00<br />
Profit <strong>and</strong> Loss Account (500 + 983.75)<br />
Stock (10,875 × 43.10%)<br />
46,87.13<br />
14,83.75 Debtors (10,875 × 25.86%)<br />
28,12.28<br />
20% Loan 5,00.00 Cash at Bank 17,16.09<br />
Sundry Creditors<br />
(8,280 × 73.91%)<br />
61,19.75<br />
________<br />
141,03.50 141,03.50<br />
Statement showing changes in Working Capital<br />
Particulars 31.3.2005 31.3.2006 Increase Decrease<br />
(Rupees in lakhs)<br />
Current Assets 25,00 46,87.13 21,87.13<br />
Debtors 15,00 28,12.28 13,12.28<br />
Cash at Bank 15,00 17,16.09 21,6.09<br />
55,00 92,15.50<br />
Less: Sundry Creditors 34,00 61,19.75 _______ 27,19.75<br />
Working Capital 21,00 30,95.75 37,15.50 27,19.75<br />
Increase in working capital 9,95.75<br />
Projected Fund Flow Statement<br />
Rs. in lakhs Rs. in lakhs<br />
Sources:<br />
Trading operations at a profit<br />
Profit as per projected Profit <strong>and</strong> Loss Statement 9,83.75<br />
Add: Depreciation 1,12.00<br />
Add: Tax Provision<br />
Applications: Payment of tax<br />
9,83.75 20,79.50<br />
For 2005 1,00.00<br />
For 2006 9,83.75 10,83.75<br />
Increase in working capital 9,95.75<br />
20,79.50
104<br />
The company earlier maintained current ratio at the level of 1.62 but during 2006, it is<br />
expected that the current ratio will fall down to the level of 1.50. So, to maintain the same<br />
liquidity level, the current assets should be Rs. 99,14 lakhs approximately. So it has to<br />
invest Rs. 598.5 lakhs other than Rs. 100 lakhs in working capital <strong>and</strong> new investment of Rs.<br />
500 lakhs in fixed assets from long term sources to maintain the current ratio at 1.62 level.<br />
The details of funds to be raised by the company are as follows:<br />
For investment in fixed assets Rs. 500 lakhs<br />
For investment in working capital Rs. 100 lakhs<br />
Additional investment in working capital Rs. 598.5 lakhs<br />
Rs. 1,198.5 lakhs<br />
Thus, funds flow to the extent of Rs. 1,198.5 lakhs is necessary.<br />
4,00,00,000<br />
(b) No. of FCD = = 4,00,000<br />
100<br />
No. of equity shares to be issued (4,00,000 × 5) 20,00,000<br />
Capital structure after dilution of FCD (‘000 Rs.)<br />
Equity share capital (60,00,000 Equity shares of Rs. 10 each) 60,000<br />
Share Premium (30,000 + 20,000) 50,000<br />
General Reserve 40,000<br />
Revaluation Reserve 40,000<br />
1,90,000<br />
19,00,00,000<br />
Net Assets value per share = (a) Rs. 31.67<br />
60,00,000<br />
2,00,00,000<br />
Fully diluted EPS = Rs. 3.33<br />
60,00,000<br />
Rs. 3.33<br />
Profit eraning capacity value = (a) Rs. 27.75<br />
.12<br />
Rs. 31.67 + Rs. 27.75<br />
Fully diluted fair value =<br />
= Rs. 29.71<br />
2<br />
6. (a) Refer to Final Course Study material.<br />
(b) Balance Sheet of AB Ltd. (‘000 Rs.)<br />
Sources of funds<br />
Shareholders’ funds 22,000<br />
Reserves <strong>and</strong> Surplus<br />
General Reserve less amalgamation expenses 8,900<br />
Export Profit Reserve 5,000<br />
35,900<br />
14% Debentures 10,000<br />
45,900<br />
Application of funds<br />
Fixed Assets 34,500<br />
Investments 5,000<br />
Current Assets, Loans <strong>and</strong> Advances<br />
Stock 10,000<br />
Debtors 8,000
105<br />
Cash <strong>and</strong> Bank 900<br />
18,900<br />
Less: Current Liabilities <strong>and</strong> provisions<br />
Sundry creditors 3,000<br />
Provisions 4,000<br />
Proposed dividend 5,500<br />
12,500<br />
Working Notes:<br />
6,400<br />
45,900<br />
(i) Net Assets (‘000 Rs.)<br />
A B<br />
Gross Assets 28,500 30,000<br />
Less: Outside Liabilities <strong>and</strong> Proposed Dividend 11,500 11,000<br />
17,000 19,000<br />
No. of shares 10,00,000 12,00,000<br />
NAV per share Rs. 17.00 Rs. 15.83<br />
17<br />
Relative Exchange Ratio = 1.0739<br />
15.83<br />
For every share issued to the erstwhile shareholders of B Ltd., there should be an issue<br />
of 1.0739 shares to the erstwhile shareholders of A Ltd.<br />
(ii) Shareholders’ proceeds of AB Ltd. AB Ltd.<br />
Share capital (Shares of Rs. 10) 22,000<br />
General reserve (5,000 + 4,000) 9,000<br />
Export profit reserve (2,000 + 3,000) 5,000<br />
36,000<br />
(iii) Exchange of shares<br />
Total shares of AB Ltd. 22,00,000<br />
No. of shares in A Ltd. 10,00,000<br />
No. of shares in B Ltd. 12,00,000<br />
Let the shares be issued against 1 share held in B Ltd. So 1.0739 x shares be issued<br />
against 1 share held in B Ltd.<br />
12,00,000 x + 10,00,000 x + 1.0739 x = 22,00,000<br />
or, 22,73,900 x = 22,00,000<br />
22,00,000<br />
or, x =<br />
22,73,900<br />
= 0.9675<br />
1.0739 x = 1.0390<br />
No. of shares to be issued to the erstwhile shareholders of B Ltd.<br />
12,00,000 × 0.9675 = 11,61,000<br />
No. of shares to be issued to the erstwhile shareholders of A Ltd.
10,00,000 × 1.0390 = 10,39,000<br />
106<br />
7. (a) An alternative which ensures the highest market price per share should be considered the<br />
best. This analysis is carried out below:<br />
Estimated earnings per share (EPS) <strong>and</strong> Market price per share<br />
under the various Financing Plans<br />
At present Equity Preference Debentures<br />
Shares Plan shares plan plan<br />
Rs. Rs. Rs. Rs.<br />
Earnings before interest <strong>and</strong> taxes<br />
(EBIT) @ 12%<br />
Less: Interest<br />
12,00,000 15,00,000 15,00,000 15,00,000<br />
Old 1,75,000 1,75,000 1,75,000 1,75,000<br />
New − − − 2,00,000<br />
Profit before tax (PBT) 10,25,000 13,25,000 13,25,000 11,25,000<br />
Less: Tax @ 50% 5,12,500 6,62,500 6,62,500 5,62,500<br />
Profit after tax (PAT)<br />
Less: Preference dividend<br />
5,12,500 6,62,500 6,62,500 5,62,500<br />
Old 2,25,000 2,25,000 2,25,000 2,25,000<br />
New − − 2,50,000 −<br />
Profit for equity shares 2,87,500 4,37,500 1,87,500 3,37,500<br />
No. of equity shares 40,000 60,000 40,000 40,000<br />
E.P.S. (Rs.) 7.19 7.29 4.69 8.44<br />
P/E Ratio − 20 17 16<br />
Market price per share (Rs.) 145.80 79.73 135.04<br />
Since the market price per share is the highest when expansion is financed by issuing equity<br />
shares, the Equity Plan may be considered to be the best.<br />
(b) The objective of financial management is to maximize the wealth of its owners which in the<br />
context of companies means maximizing the market price of the company’s equity shares.<br />
From the analysis in (a) above, we find that the market price per share is the highest in the<br />
case of equity financing. As such equity financing is the best.<br />
(c) Students are advised to refer to study material of MAFA.<br />
8. Evaluation whether the manufacture of the new products is worth-while<br />
Cash inflows: 1 2<br />
(YEARS)<br />
3 4 5<br />
Receipts:<br />
Rs. Rs. Rs. Rs. Rs.<br />
Sales 2,88,000 2,88,000 2,88,000 2,88,000 −<br />
Debtors<br />
(Increase)/Decrease<br />
(57,600) − − − 57,600<br />
Total cash receipts (A)<br />
Payments:<br />
2,30,400 2,88,000 2,88,000 2,88,000 57,600<br />
Materials <strong>and</strong> other<br />
variable costs<br />
65,000 58,500 58,500 52,000<br />
Creditors<br />
(Increase)/Decrease<br />
(6,500) 650 − 650 5,200<br />
58,500 59,150 58,500 52,650 5,200<br />
Labour 1,40,000 1,26,000 1,26,000 1,12,000 −<br />
Total cash payments (B) 1,98,500 1,85,150 1,84,500 1,64,650 5,200
107<br />
Net cash inflow (A – B) 31,900 1,02,850 1,03,500 1,23,350 52,400<br />
P/V factor at 20% .83 .69 .58 .48 .40<br />
Present value of net<br />
cash inflows<br />
26,477 70,967 60,030 59,208 20,960<br />
Rs.<br />
Total present value cash inflows for 5 years 2,37,642<br />
Initial investment (Rs. 45,000 × 4) 1,80,000<br />
Net present value (NPV) of investment 57,642<br />
The cash flows from the project, discounted at the company’s cost of capital of 20 per cent show<br />
a positive net present value. Therefore, it is worthwhile to manufacture the new product.<br />
Notes:<br />
(i) Cash receipts: Receipts on the last day of year 1 represent 80% of sales; receipts from<br />
debtors in respect of year 4 sales are assumed to occur at the end of year 5, i.e. annually in<br />
arrear.<br />
(ii) Material <strong>and</strong> other variables: Year 2 payment represents opening creditors (Rs. 6,500) plus<br />
production costs (90% of 65,000) less closing creditors (10% of production costs).<br />
(iii) Labour: Though in the question it is stated that a fixed costs are included in labour cost,<br />
however in the absence of the amount of fixed costs, labour cost has been assumed to vary<br />
proportionately with the change in production volume.<br />
9. Workings:<br />
Cost data for 10 <strong>and</strong> 20 overcoats:<br />
Variable Costs For minimum 10<br />
overcoats<br />
For minimum 20<br />
overcoats<br />
Rs. Rs.<br />
Direct material 3.00 2.70<br />
Direct Wages 4.00 3.80<br />
Direct selling cost 1.00 .75<br />
Total variable costs (A) 8.00 7.25<br />
Fixed Costs absorbed:<br />
Supervision 1.00 0.90<br />
Depreciation .50 .45<br />
Interest .50 .40<br />
Total fixed costs (B) 2.00 1.75<br />
Total cost (A + B) 10.00 9.00<br />
Profit 20% of selling price or 25% of cost 2.50<br />
Selling price (C) 12.50<br />
Contribution (C – A) 4.50<br />
Investment 50.00 40.00
(1) Summary for <strong>Management</strong>:<br />
108<br />
(Assuming that prices do influences sales level)<br />
(1) (2) (3)<br />
Selling Profit Profit as% of<br />
price<br />
investment<br />
Rs. Rs. Rs.<br />
(a) Current (Minimum 10) 12.50 2.50 5.00<br />
(b) Minimum 20 assuming that selling price is<br />
unchanged<br />
12.50 3.50<br />
8.75<br />
(c) Minimum 20 when selling price will leave<br />
unchanged the present level per overcoat of:<br />
(i) Profit 11.50 2.50 6.25<br />
(ii) Profit as % of total cost (25%) 11.50 2.50 6.25<br />
(iii) Profit as % of investment (5%) 11.00 2.00 5.00<br />
(iv) Contribution (Rs. 4.50) 11.75 2.75 6.875<br />
(v) Percentage % mark-up on direct costs<br />
(56¼%)<br />
11.33 2.33<br />
5.825<br />
(2) The unit contribution is a more dependable factor in pricing policy than unit profit because of<br />
the shifty nature of the latter. The unit contribution approach is associated with unit variable<br />
costs or direct costs which are easily identifiable <strong>and</strong> determinable. However, this approach<br />
ignores two important factors (i) that prices must be competitive, <strong>and</strong> (ii) that low unit<br />
contribution linked with high volume may be more profitable than the reverse combination. If<br />
these limitations do not exist, the management may use unit contribution as basis for fixing<br />
future selling prices successfully. In other words, if the product is not subject to competitive<br />
market <strong>and</strong> volume is unchangeable, the management may fix future selling price on the<br />
basis of 1c (iv) above i.e. contribution.<br />
10. (a) The concept of wealth in the context of wealth maximisation objective refers to the<br />
shareholders wealth as reflected by the price of their shares in the share market. Therefore,<br />
wealth maximisation means maximization of the market price of the equity shares of the<br />
company. However, this maximisation of the price of the ordinary share of the company<br />
should be in the long run. The long run implies a period which is long enough to reflect the<br />
normal market price of the shares irrespective of short-term fluctuations. The long run price<br />
of the ordinary shares reflects the considered appraisal of the investors regarding the overall<br />
performance of the company <strong>and</strong> its growth prospects. In fact, such a price of equity shares<br />
serves as an index of the company management. By following policies which increase the<br />
earnings per share in the long run <strong>and</strong> which reduce the overall risk class in which the<br />
investors place the company, a financial manager can help the company in achieving its<br />
objective of wealth maximization.<br />
(b) Wealth of shareholders will be maximized only when the market value of each share is<br />
maximized. For finding out the impact of the pay-out on market price of shares, we have to<br />
use Walter’s formula which is as follows:<br />
R a<br />
D +<br />
R c<br />
Vc<br />
=<br />
R<br />
Where,<br />
( E − D)<br />
c<br />
Vc = Market value of the ordinary share of the company.<br />
Ra = Return on internal retention, i.e. the rate company earns on retained profits.<br />
Rc = Capitalisation rate, i.e. the rate expected by the investors or market rate of<br />
discount applicable to the company.
E = Earnings per share.<br />
D = Dividend per share.<br />
109<br />
Market value of shares under different payout options:<br />
(i) 25% pay-out.<br />
V c<br />
(ii) 50% pay-out.<br />
V c<br />
(iii) 75% pay-out.<br />
V c<br />
.10<br />
4 +<br />
=<br />
.125<br />
.125<br />
.10<br />
8 +<br />
=<br />
.125<br />
.125<br />
.10<br />
12 +<br />
=<br />
.125<br />
.125<br />
( 16 − 4)<br />
( 16 − 8)<br />
( 16 −12)<br />
= Rs. 108.80<br />
= Rs. 115.20<br />
= Rs. 121.60<br />
The above computations show that the pay-out ratio of 75% would maximize the wealth<br />
of the shareholders.<br />
11. (a) According to Modigliani <strong>and</strong> Miller, the total market value of the firm <strong>and</strong> the cost of capital<br />
are independent (exclusive of tax considerations) of its capital structure. They represent by<br />
far the most sophisticated support to the thesis that the cost of capital cannot be varied by<br />
changing the capital structure of the firm. If their thesis is accepted, it would seem that no<br />
capital structure is inherently more desirable than any other.<br />
Their approach is based on the following assumptions:<br />
(i) Capital markets are perfect, information is costless <strong>and</strong> readily available to all<br />
investors; there are no transaction costs; <strong>and</strong> all securities are infinitely divisible,<br />
investors are assumed to be rational, <strong>and</strong> to behave accordingly.<br />
(ii) Investors have homogeneous expectations. They hold identical subjective probability<br />
distributions about future operating earnings.<br />
(iii) Firms are grouped into equivalent return classes with every firm in each class<br />
susceptible to the same degree of business risk.<br />
(iv) The corporate income taxes are assumed to be absent. MM removed this assumption<br />
later.<br />
Modigliani <strong>and</strong> Miller make a formidable attack on the traditional view by offering behavioural<br />
justification for having the cost of capital Ko remain constant throughout all the degrees of<br />
leverage. They argue that the total risk for all security holders of a firm is not changed by a<br />
variation in capital structure. Therefore, the total value of the firm remains the same<br />
irrespective of its financing mix. The support for this hypothesis lies in the presence of<br />
arbitrage in the capital markets. They contend that arbitragers will substitute personal<br />
leverage for corporate leverage.<br />
The following propositions summarise the Modigliani-Miller argument about the relationship<br />
of capital structure to the cost of capital <strong>and</strong> the market value of the firm:<br />
(1) The cost of capital <strong>and</strong> the market value of a firm have no relation with its capital<br />
structure. The market value of a firm is ascertained by capitalising its expected return<br />
at the appropriate discount rate for its class.<br />
(2) The second proposition maintains that expected yield on a share or stock (Ke) is equal<br />
to the appropriate capitalization rate for a pure equity stream for that class plus a<br />
premium, related to financial risk, which equals the debt-equity ratio times the spread
110<br />
between the capitalization rate (Ke) <strong>and</strong> yield on debt (Ki). In other words, the impact of<br />
a smaller Ki on cost of capital (Ko) is offset by an increase in Ke.<br />
(3) The cut off point for investment in the firm is always the capitalization rate, which is<br />
independent of the way in which an investment is financed.<br />
These propositions have been attacked by numerous authorities. Most criticisms are about<br />
the perfect market assumption <strong>and</strong> the arbitrage argument.<br />
Modigliani <strong>and</strong> Miller argue that through personal arbitrage, investors would quickly eliminate<br />
any inequalities between the value of levered firms <strong>and</strong> the value of unlevered firms in the<br />
same risk class. The basic argument here is that individuals (arbitragers), through the use<br />
of personal leverage can alter corporate leverage. This argument is not tenable in the<br />
practical world, for it is extremely doubtful that personal investors would substitute personal<br />
leverage for corporate, since they do not have the same risk characteristics. The M & M<br />
approach assumes availability of free <strong>and</strong> up-to-date information. This also is not normally<br />
valid. Thus, it seems that the criticism made against Modigliani <strong>and</strong> miller thesis is valid.<br />
However, it is useful to study their thesis to better underst<strong>and</strong> the theory of capital structure.<br />
(b) Value of each firm as per the Modgliani-Miller Approach<br />
EBIT<br />
Market vlue of the firm, Vm<br />
=<br />
K<br />
Where EBIT = Earnings before interest <strong>and</strong> taxes<br />
o<br />
Ko = Expected rate of return on investment or overall cost of capital.<br />
Firm A Firm B Firm C<br />
Rs. Rs. Rs.<br />
(i) EBIT 13,00,000 13,00,000 13,00,000<br />
(ii) Expected return on investment 12% 12% 12%<br />
(iii)<br />
12. (a) Working Notes:<br />
Total value of each firm<br />
i<br />
ii<br />
1,08,33,333<br />
1,08,33,333<br />
1,08,33,333<br />
(i)<br />
1<br />
Earning before interest <strong>and</strong> tax Rs. 60,000×<br />
1<br />
2<br />
Rs.<br />
= 90,000<br />
(ii) Interest on convertible debentures for 6 months:<br />
10 1<br />
Rs. 2,00,000×<br />
×<br />
100 2<br />
= 10,000<br />
(iii)<br />
13<br />
Interest warrant : Rs. 2,00,000 ×<br />
100<br />
= 26,000<br />
(iv) No. of shares under alternative (a):<br />
No. of existing shares:<br />
= 10,000<br />
Add shares to be allotted on conversion:<br />
2,00,000 × 80<br />
1,000<br />
= 16,000<br />
No. of shares on 31.3.2006 26,000<br />
(v) No. of shares under alternative (b):<br />
No. of existing shares:<br />
= 10,000<br />
Add shares issued to debenture holders :<br />
2,00,000 × 50<br />
1,000<br />
= 10,000<br />
No. of shares on 31.3.2006 20,000
(vi) No. of shares under alternative (c):<br />
No. of existing shares:<br />
10,000×<br />
8<br />
Rights issue :<br />
5<br />
111<br />
= 10,000<br />
= 16,000<br />
No. of shares on 31.3.2006 26,000<br />
(vii) Computation of Earnings per share <strong>and</strong> retained profits<br />
Alternatives<br />
(a) (b) (c)<br />
(Issue of (Issue of 13% (Rights<br />
10% debentures with the issue)<br />
convertible option to purchase<br />
debentures) equity shares)<br />
Rs. Rs. Rs.<br />
Earning before interest <strong>and</strong> tax 90,000 90,000 90,000<br />
Less: Debenture Interest 10,000 26,000 −<br />
Earning before tax 80,000 64,000 90,000<br />
Taxation @ 50% 40,000 32,000 45,000<br />
Profit after tax 40,000 32,000 45,000<br />
No. of shares : (Nos.) 26,000 20,000 26,000<br />
Earning per share 1.54 1.60 1.73<br />
Dividend paid @ Re. 1 per share* 26,000 20,000 26,000<br />
Profit retained after dividend 14,000 12,000 19,000<br />
*It has been assumed that dividend at the rate of Re. 1 per share will be paid to all the<br />
shareholders as on 31st March, 2006.<br />
(viii) Cash Balances under various financing plans<br />
Receipts (a) (b) (c)<br />
Rs. Rs. Rs.<br />
Debenture issue 2,00,000 2,00,000 −<br />
Share Capital − 1,00,000 1,60,000<br />
Share premium − 50,000 40,000<br />
Retained profit after dividend 14,000 12,000 19,000<br />
Total receipts (A) 2,14,000 3,62,000 2,19,000<br />
Payments<br />
Fixed Assets (acquired) 70,000 70,000 70,000<br />
Purchase of stocks (increase in stock) 35,000 35,000 35,000<br />
Total payments (B) 1,05,000 1,05,000 1,05,000<br />
Cash on h<strong>and</strong> (A – B) 1,09,000 2,57,000 1,14,000<br />
(ix) Value of various assets <strong>and</strong> liabilities on 31.3.2006:<br />
Fixed assets: Rs. 1,80,000 + Rs. 70,000 = Rs. 2,50,000<br />
Stock:<br />
1<br />
Rs. 70,000×<br />
1<br />
2<br />
= Rs. 1,05,000<br />
Debtors:<br />
1<br />
Rs. 50,000×<br />
1<br />
2<br />
= Rs. 75,000<br />
Trade creditors:<br />
1<br />
Rs. 50,000×<br />
1<br />
2<br />
= Rs. 75,000
(x) Share premium:<br />
Under alternative (a):<br />
112<br />
Rs. Rs.<br />
Nominal value of debentures converted 2,00,000<br />
Nominal value of shares allotted 1,60,000<br />
Share premium 40,000<br />
Under alternative (b) : 10,000 × Rs. 5 50,000<br />
Under alternative (c) : 16,000 × Rs. 2.5 40,000<br />
Balance Sheets under various alternatives as at 31.3.2006<br />
Liabilities (a) (b) (c) Assets (a) (b) (c)<br />
Rs. Rs. Rs. Rs. Rs. Rs.<br />
Share capital, equity<br />
Fixed assets 2,50,000 2,50,000 2,50,000<br />
share of Rs. 10 each 2,60,000 2,00,000 2,60,000 Current Assets:<br />
Share premium 40,000 50,000 40,000 Stock 1,05,000 1,05,000 1,05,000<br />
Revenue reserve 1,50,000 1,50,000 1,50,000 Debtors 75,000 75,000 75,000<br />
Profit<br />
Account<br />
<strong>and</strong> Loss 14,000 12,000 19,000 Cash 1,09,000 2,57,000 1,14,000<br />
13% Debentures − 2,00,000 −<br />
Trade creditors 75,000 75,000 75,000 _______ _______ _______<br />
5,39,000 6,87,000 5,44,000 5,39,000 6,87,000 5,44,000<br />
Comments:<br />
On the basis of earnings per share (see working note vii), proposal (c) i.e., making rights<br />
issue, is preferable as EPS of Rs. 1.73 is the maximum under this plan.<br />
However, the funds available to the company will be maximum under financing plan (b). The<br />
existence of debt is also profitable to the shareholders under plan (b). If the additional funds<br />
obtained under this plan are employed gainfully to yield corresponding additional return, EPS<br />
would also be maximum under plan (b). Thus taking an overall view, financing alternative<br />
(b) seems to be preferable.<br />
(b) Current purchasing power method: It is a method of accounting for price level changes.<br />
Under this method an established <strong>and</strong> approved general price index is used to convert the<br />
value of various items in the Balance Sheet <strong>and</strong> the Profit <strong>and</strong> Loss Account. Many<br />
professional institutes <strong>and</strong> accountants have recommended that the changes in price level<br />
may be reflected in the financial statements through the Current Purchasing Power Method.<br />
The main argument is that a change in the price level reflects change in the value of the<br />
rupee. This change is denoted by a general price index. For example, a rupee in 2006 could<br />
buy much less than a rupee in 1978. We need an index which shows us to how much less a<br />
rupee in 2006 buys as compared with a rupee in 1978. Thus, in the Current Purchasing<br />
Power Method, the general price index is the basic indictor of a change in the value of the<br />
rupee. It is, therefore, used to convert the statements of various periods into rupees of<br />
uniform value. Generally, a general price index like the wholesale price index is taken to<br />
show the change in the value of rupee in the past years. For example, if we want to add up<br />
the value of certain assets purchased in 1978 with those purchased in 2006 we can do so<br />
only after converting the rupee value of 1978 in terms of rupee value of 2006. It may,<br />
however, be noted that the CPP method accounts for changes in the value of the rupee. It<br />
does not account for change in the value of the individual assets. As such CPP method only<br />
tries to present financial statements in terms of rupees of uniform value.<br />
In 1974, the professional bodies of accountants in the U.K. issued a statement on the<br />
Current Purchasing Power Method which recommended that the companies should prepare<br />
supplementary financial statements showing the various items in terms of the value of the<br />
pound as at the date of such financial statements. However, a large number of accountants,
113<br />
economists, <strong>and</strong> government authorities did not agree that CPP method was adequate for<br />
accounting for price level changes <strong>and</strong>, therefore, CCA (Current Cost <strong>Accounting</strong>) method<br />
was recommended in place of CPP Method.<br />
13. (a) Capital budgeting decisions involve the consideration of a large number of factors making it<br />
a very important exercise. Such decisions greatly affect almost all the departments of a firm.<br />
They may make or mark the firm concerned since there is commitment of large funds <strong>and</strong><br />
the decision is generally irreversible. Some of the very important factors are discussed<br />
below:<br />
(i) Long-term effects: Capital budgeting decisions have a long-term effect on the firm.<br />
Once a wrong decision is taken, it cannot be undone without suffering substantial<br />
losses. For example, a firm decides to construct its own factory building. Once it has<br />
started the construction of the building, it cannot stop it in the middle <strong>and</strong> decide to<br />
lease the building; whatever amount has been spent cannot be recovered <strong>and</strong> that may<br />
become a total loss.<br />
(ii) Relatively high cost of fixed assets: Capital expenditure decisions may involve huge<br />
amounts. They may range from pieces of equipment costing a few thous<strong>and</strong>s of rupees<br />
to complete factories costing crores of rupees. The involvement of these huge<br />
amounts itself make capital budgeting an important exercise.<br />
(iii) Uncertainty <strong>and</strong> risk: Normally, a good deal of uncertainty surrounds a capital<br />
budgeting decision. Funds are invested immediately but returns will be available in<br />
future which is uncertain. Funds are committed against future forecsts in respect of<br />
sales, cost <strong>and</strong> profits. The commitment of funds for a long period introduces an<br />
element of risk. Longer the period, larger may be the risk. Future being uncertain,<br />
estimates may come true <strong>and</strong> may not.<br />
A wrong capital budgeting decision may present a situation of over <strong>and</strong> under capacity<br />
at the same time. The company may have over capacity for the production of an item<br />
which does not have dem<strong>and</strong> <strong>and</strong> short of capacity for another item which has high<br />
dem<strong>and</strong> <strong>and</strong> also good profit margin.<br />
(iv) Image of the company: The capital budgeting decisions vitally affect the profits of the<br />
company which in turn influence the share prices of the company. It is, therefore,<br />
necessary that all the accepted projects should result in increased profits <strong>and</strong> thus<br />
maximize the shareholders’ wealth. If the investing public is not convinced about the<br />
success <strong>and</strong> future prospects of the project, it would not invest in the company. It will<br />
harm the image of the company.<br />
It is, therefore, essential that the capital budgeting decisions should be taken with all<br />
seriousness <strong>and</strong> they should improve the image of the company.<br />
(b) (i) Net present value (NPV) <strong>and</strong> the profitability index (PI) methods help in comparing<br />
projects of unequal size, though at times the two methods may give conflicting results.<br />
An illustration:<br />
Project ‘A’ Project ‘B’<br />
Rs. Rs.<br />
Initial cash outlay 1,00,000 40,000<br />
PV of cash inflows 2,00,000 1,00,000<br />
Net present value 1,00,000 60,000<br />
Profitability index 2,00,000 1,00,000<br />
1,00,000 40,000<br />
= 2.0 = 2.5<br />
It is obvious from the above that according to NPV method, project A is preferable<br />
whereas according to the PI method project B should be accepted.
114<br />
Keeping in view the wealth maximization objective of financial management, a project<br />
which gives greater economic contribution in absolute terms should be accepted. But,<br />
the PI method shows the relative return from a project. Therefore, when NPV <strong>and</strong> PI<br />
methods give conflicting results, it is to be seen what the situation is with regard to the<br />
availability of capital funds. If a situation of capital rationing prevails, a project which<br />
shows higher PI should be accepted; in all other cases, any project giving higher NPV<br />
is to be accepted because it will maximize the total wealth of the shareholders.<br />
The conflict between NPV <strong>and</strong> PI in such cases can further be resolved by resorting to<br />
incremental analysis. A project showing higher NPV but lower PI should be accepted if<br />
the net present value of the project’s incremental outlay is positive. The incremental<br />
analysis in the illustration given above is as shown below:-<br />
Project ‘A’ Project ‘B’ Incremental flow<br />
Rs. Rs. Rs.<br />
Initial cash outlay 1,00,000 40,000 60,000<br />
PV of cash inflow 2,00,000 1,00,000 1,00,000<br />
NPV 1,00,000 60,000 40,000<br />
PI 2.0 2.5 1.7<br />
The incremental PI of Project A is positive; hence project A should be accepted. Where<br />
two mutually exclusive projects requiring unequal investments give the same NPV, the<br />
project having higher PI should be accepted. See the following illustration:<br />
Project ‘C’ Project ‘D’<br />
Rs. Rs.<br />
Initial cash outflow 25,000 50,000<br />
PV of cash inflow 1,25,000 1,50,000<br />
NPV 1,00,000 1,00,000<br />
PI 5 3<br />
In the above case NPV in both the cases is the same, i.e., Rs. 1,00,000. But PI of<br />
project ‘C’ is higher; hence project C should be accepted. The net present value<br />
method indicates that both the projects are equally desirable in terms of their economic<br />
contribution. But PI evaluates these projects in relative terms showing that project C<br />
gives the same return with much lower investment i.e., 50% that of project D.<br />
(ii) The evaluation of two mutually exclusive projects with varying lives requires the<br />
examination of the existence of the reinvestment opportunities at the end of the<br />
different economic lives of the projects. The longer period project will be selected,<br />
despite its lower internal rate of return, if the estimated re-investment rate is sufficiently<br />
low relating to the internal rate of return. Reverse will be the case if the expected reinvestment<br />
rate is above the internal rate of return of the longer life projects. In the<br />
latter case, the shorter life project will generate quicker cash throw off enabling the firm<br />
to reinvest them soon.<br />
Another way to deal with this problem is cut off the analysis at a point where<br />
reasonable estimates cease to exist <strong>and</strong> the estimate of the terminal value of the<br />
project is taken as a cash inflow at that point. After ascertaining the terminal value of<br />
the longer life project, the two projects can be evaluated by any method, although NPV<br />
method to be preferred.<br />
Still another way of h<strong>and</strong>ling the problem of varying economic lives is to compute the<br />
annualised net benefit of the respective cash flow patterns of the mutually exclusive<br />
projects. The process of annualizing the net present value of the cash flow of an<br />
investment proposal involves conversion of the present value into an annuity over the<br />
economic life of the proposal at the desirable discount rate i.e., the rate at which cash
115<br />
flows are discounted to compute the net present value.<br />
The following steps are involved in calculating the annualized net benefit of a project:<br />
(1) Compute the net present value of the irregular cash inflows at the stipulated<br />
discount rate.<br />
(2) Divide the net present value as computed in step 1 by the factor representing the<br />
present value of annuity of Re. 1 at the end of the economic life of the project at<br />
the same discount rate.<br />
Thus, ‘annualized net benefit’ of a project:<br />
present<br />
Net present value of the project<br />
value factor of annuity of Re. 1at<br />
the end of the economic life of the project<br />
On the basis of ‘annualised net benefit’, a project which shows higher ‘annualised net<br />
benefit’ will be selected.<br />
(c) Desirability factor or profitability index as it is popularly known, is a factor which shows the<br />
relationship between the sum of discounted cash inflows <strong>and</strong> the sum of discounted cash<br />
outflows. To calculate the same, one has to first discount the cash inflows <strong>and</strong> outflows at a<br />
rate, which is computed on the basis of the cost of capital or the opportunity cost. Having<br />
discounted the cash flow, the desirability factor can be determined in the following way:<br />
Sum of discounted cash inflows<br />
Sum of discounted cash outflows<br />
In case an undertaking has two or more projects competing for funds at its disposal, the<br />
question of ranking the projects arises. The determination of desirability factor helps in<br />
ranking various projects. Since the desirability factor is obtained from discounting at a rate<br />
equivalent to the cost of capital or the opportunity cost, it is considered a reliable method of<br />
ranking two or more projects.<br />
14. (a) Computation of beak-even point under the two alternatives:<br />
Currently After Expansion<br />
Rs. Rs.<br />
Fixed Costs 4,20,000 5,45,000<br />
Capacity 80,000 units 1,20,000 units<br />
Variable cost per unit Rs. 6.80 Rs. 6.40<br />
Contribution margin per unit Rs. 9.20 Rs. 9.60<br />
Selling price per unit Rs. 16 Rs. 16<br />
Rs. 4,20,000<br />
Break-even point = 45,652 units<br />
9.20<br />
Rs. 5,45,000<br />
= 56,771 units<br />
9.60<br />
Assuming that the whole production can be sold, the profit under the two alternatives will be<br />
as under:<br />
Currently After Expansion<br />
Rs. Rs.<br />
Sales 12,80,000 19,20,000<br />
Variable cost 5,44,000 7,68,000<br />
Contribution 7,36,000 11,52,000<br />
Fixed Cost 4,20,000 5,45,000<br />
Profit 3,16,000 6,07,000
116<br />
It is obvious from the above calculations that profits will be almost double after the<br />
expansion. Hence, the alternative of expansion is preferable.<br />
(b) Retained earnings is very important source of internal financing. It refers to the percentage<br />
of earnings retained by the firm for its long-term requirements. Lately, companies have been<br />
resorting to internal financing to the maximum extent possible to meet their long-term funds<br />
requirements. The following are the important reasons for doing so:<br />
(i) Companies have various sources to tap to meet their long-term funds needs, viz.,<br />
equity capital, preference capital, debentures <strong>and</strong> long-term loans from financial<br />
institutions. Funds raised from different sources involve different characteristics.<br />
Elements of risk, cost <strong>and</strong> control factors differ from source to source. In case a<br />
company is able to plough back its profits, it is subjected to a very low degree of risk<br />
because the amount of risk involved in internal financing is very low.<br />
(ii) From the view point of proper financial management, it is desirable that a certain<br />
amount of profits after taxation <strong>and</strong> dividends is ploughed back in the company. As<br />
individual are supposed to save something out of their current earnings for future<br />
needs, similarly, business enterprises should also not spend their total current earnings<br />
by distributing dividends.<br />
(iii) The higher amount of accumulated retained earnings which may be in the form of<br />
reserves indicates the financial strength of the company. A company resorting to<br />
internal financing, <strong>and</strong> thus creating huge reserves, will be rated high by the outsides.<br />
It builds the equity base <strong>and</strong> creates additional debt capacity.<br />
(iv) For the last many years, inflationary tendencies are persisting in the economy. There<br />
is every likelihood of eating away capital if all the earnings are distributed every year by<br />
way of dividends. It is, therefore, essential to plough back profits to preserve the<br />
original capital intact in an inflation ridden economy as is the case in India.<br />
(v) The extent of internal financing may vary from industry to industry <strong>and</strong> in the same<br />
industry from company to company depending on the situation. However, it is<br />
characteristic of growth industries or companies to have high retention rate, i.e., to pay<br />
a comparatively small portion of current earnings as dividends.<br />
(vi) If a company has high profitability, it is advantageous to the shareholders also that the<br />
company resorts to internal financing in a big way. The higher the profitability, the<br />
more logical it seems to retain funds <strong>and</strong> employ them to earn higher returns than<br />
would be obtained if they are paid out to shareholders <strong>and</strong> invested by them elsewhere.<br />
The concept that greater the profitability, the more likely is management to retain a<br />
substantial percentage of earnings in the interest of rapid expansion has received a lot<br />
of attention.<br />
The existence of profitable opportunities for reinvestment of funds <strong>and</strong> a good growth record<br />
require the companies to have a low dividend pay out ratio <strong>and</strong> thus finance their long-term<br />
funds needs through internal financing.<br />
In brief it may be said that internal financing involves low risk, does not dilute existing<br />
ownership, increases the wealth of shareholders, gives higher rating to the company,<br />
enables it to acquire more financial strength <strong>and</strong> keeps its original capital intact. Therefore,<br />
resort to more <strong>and</strong> more internal financing for long-term funds, is a healthy <strong>and</strong> natural<br />
development.<br />
15. (a) (i) If the current market price is the basis of exchange of equity shares, in the proposed<br />
merger, shareholders of Firm B will get only 40,000 shares in all or 4 shares of Firm A<br />
for every 5 shares held by them, i.e.,<br />
50,000×<br />
60<br />
= 40,000<br />
75
117<br />
The total number of shares in Firm A will then be 2,40,000 <strong>and</strong>, ignoring any synergistic<br />
effect, the profit will be Rs. 13,00,000. The new earning per share (EPS) of Firm A will<br />
Rs.<br />
13,<br />
00,<br />
000<br />
be Rs. 5.42, i.e.,<br />
.<br />
2,<br />
40,<br />
000<br />
(ii) The present earning per share of Firm B is Rs. 6, i.e. Rs. 3,00,000 ÷ 50,000 <strong>and</strong> that of<br />
Firm A Rs. 5 i.e. Rs. 10,00,000 ÷ 2,00,000. If Firm B wants to ensure that, even after<br />
merger, the earning per share of its shareholders should remain unaffected, then the<br />
exchange ratio will be 6 shares for every 5 shares.<br />
The total number of shares that will produce Rs. 3,00,000 profit is 60,000, i.e., 3,00,000<br />
÷ 5, the EPS in Firm A. 60,000 shares of Firm A will be distributed among,<br />
shareholders of Firm B, giving a ratio of 6 shares in A for 5 shares in B.<br />
Proof: The shareholders of Firm B will get in all 60,000 share for 50,000 shares. It<br />
13,00,000<br />
means after merger, their earning per share will be Rs. 5, i.e., . In all they<br />
2,60,000<br />
will get Rs. 3,00,000, i.e., 60,000 × 5, as before.<br />
(b) ROI (Rate of Return on Investment) is one very important measure of judging the overall<br />
financial performance of a firm. However, there are some significant limitations of this<br />
measure which makes it inadequate to judge the financial performance of a business<br />
undertaking. The important limitations are as follows:<br />
(i) ROI is based on earnings <strong>and</strong> investment. The amount of earnings <strong>and</strong> investment is<br />
subject to various ‘manipulations’ or decisions of management on various accounting<br />
policies, such as depreciation, inventory valuation, treatment of provisions, etc. Such<br />
decisions affect the amount of the reported profit. These decisions are generally<br />
arbitrary.<br />
(ii) There are various bases for calculating both profit <strong>and</strong> investment. For example, the<br />
amount of investment may include intangible assets which are irrelevant for current<br />
operations or the amount of earnings may be before interest or after interest or before<br />
tax or after tax. Fixed assets may be taken gross or net. It is necessary thus to know<br />
the exact way in which the ROI has been computed.<br />
(iii) To improve ROI, the emphasis is on the generation of short-term profits. The firm may<br />
cut down such costs as research <strong>and</strong> development <strong>and</strong> sales promotion to achieve this<br />
objective. If these costs are cut down without any justification, the profitability of the<br />
firm will be adversely affected in the long run, though in the short run ROI may indicate<br />
better performance.<br />
(iv) ROI being a ratio, the emphasis is on improvement in the ratio as such irrespective of<br />
the fact whether profits in absolute term increases or not.<br />
(v) Many times the ROI is not the result of the performance of the present managers. It is<br />
generally due to the actions of the past management. As such, the present<br />
management cannot be held responsible for the doings of their predecessors <strong>and</strong><br />
cannot take credit for results flowing from past decisions.<br />
(vi) ROI introduces the element of conservatism <strong>and</strong> gives undue significance to capital<br />
resources whereas profits may be the result of the contribution of various other inputs<br />
chiefly human resources. Their role is not clearly visible in the computation of ROI.<br />
(vii) ROI as a measure of the performance evaluation of the managers, many a time, mars<br />
their initiative. The manager who is satisfied with the present ROI may not take<br />
initiative to exp<strong>and</strong> due to fear of decrease in ROI. This would mean that the firm has<br />
not been able to exploit available opportunities.<br />
(viii) At times, a high or low profits may be by chance. In such cases, ROI as a measure for<br />
judging the financial performance is irrelevant.
118<br />
Due to the above limitations, ROI is not an adequate measure for judging the financial<br />
performance of the business undertaking. Often, it may present more problems than it<br />
solves. It is preferable that this measure is employed along with an effective system of<br />
budgetary control.<br />
On the whole, however, ROI over a period of time will give a good indication of at least the<br />
financial health of the firm in the past, but figures for one or two years can be quite<br />
misleading.<br />
16. (a) Cost Break-even Point: It appears that the term ‘cost break-even point’ is not a st<strong>and</strong>ard<br />
term. However, it may refer to a situation when the costs of operating two alternative plants<br />
is equal. In practical life, many times, a situation prevails when at certain level of activity the<br />
firm may be indifferent in respect of two alternative plants. Both the plants may have the<br />
same total costs though fixed costs <strong>and</strong> variable cost per unit of the alternative plant may be<br />
different. In such a case, the firm would like to determine that point at which the total costs<br />
of both the plants are identical. Such a point may be called ‘cost break-even point’. Such a<br />
point can be determined after ascertaining the fixed costs <strong>and</strong> variable cost per unit of the<br />
alternative plants by means of simultaneous equation technique.<br />
The determination of ‘cost break-even point’ will enable the firm to identify which plant is the<br />
best to operate at or a given level of output assuming the sale price per unit is the same.<br />
Following are the cost break-even points between each pair of plants:<br />
Plant A <strong>and</strong> B –<br />
Rs. 6,00,000 + Rs. 12 x = Rs. 9,00,000 + Rs. 10 x<br />
x = 1,50,000<br />
Plant B <strong>and</strong> C –<br />
2 x = 3,00,000<br />
Rs. 9,00,000 + Rs. 10 x = Rs. 15,00,000 + Rs. 8 x<br />
x = 3,00,000<br />
Plant A <strong>and</strong> C –<br />
2 x = 6,00,000<br />
Rs. 6,00,000 + Rs. 12 x = Rs. 15,00,000 + Rs. 8 x<br />
4 x = 9,00,000<br />
x = 2,25,000<br />
The above computations show that plant A is the best for the output below 1,50,000 units.<br />
Plant B is optimum if the output is between 1,50,000 units <strong>and</strong> 3,00,000 units. Plant C is<br />
superior if output exceeds 3,00,000 units. Between A <strong>and</strong> C, if B is to be ignored, A should<br />
be preferred over C upto the output of 2,25,000 units.<br />
(b) Target total profit on Rs. 10,00,000 @ 15% is Rs. 1,50,000.<br />
In the equation form<br />
Profit = (Quantity × sales price per unit) – (Quantity × variable costs per unit) – Fixed Costs.<br />
(i) Varying Fixed Costs:<br />
Rs. 1,50,000 = (50,000 × Rs. 25) – (50,000 × Rs. 15) – Fixed Costs.<br />
or Rs. 1,50,000 = (12,50,000) – (7,50,000) – Fixed Costs.<br />
or Fixed Costs = Rs. 12,50,000 – 7,50,000 – Rs. 1,50,000.<br />
or Fixed Costs = Rs. 3,50,000.<br />
The management can achieve the target profits of Rs. 1,50,000 by reducing fixed costs<br />
by Rs. 50,000, i.e., Rs. 4,00,000 – Rs. 3,50,000, a reduction of 12.5% in the existing
fixed costs.<br />
(ii) Varying Variable Costs:<br />
119<br />
Rs. 1,50,000 = (50,000 × Rs. 25) – (50,000 × Variable Costs) – Rs. 4,00,000.<br />
or Rs. 1,50,000 = 12,50,000 – 50,000 Variable Costs – Rs. 4,00,000.<br />
or 50,000 Variable Costs = Rs. 12,50,000 – 4,00,000 – Rs. 1,50,000.<br />
or 50,000 Variable Costs = Rs. 7,00,000.<br />
7,00,000<br />
Vc = Rs. = Rs. 14<br />
50,000<br />
The management can achieve the target profits of Rs. 1,50,000 by reducing variable<br />
costs per unit by Re. 1, a reduction of 6.7% on existing variable costs per unit.<br />
(iii) Varying Quantity Sold:<br />
Rs. 1,50,000 = (Quantity × Rs. 25) – (Quantity × Rs. 15) – Rs. 4,00,000.<br />
or Rs. 1,50,000 = 25Q – 15Q – Rs. 4,00,000.<br />
or –25Q + 15Q = –Rs. 4,00,000 – Rs. 1,50,000.<br />
or –10Q = –5,50,000.<br />
or Q = 55,000<br />
The management can achieve the target profits of Rs. 1,50,000 by increasing the<br />
number of units sold by 5,000 units, an increase of 10% in the present sales units.<br />
(iv) Varying Selling Price:<br />
Rs. 1,50,000 = (50,000 × Selling Price) – (50,000 × Rs. 15) – Rs. 4,00,000.<br />
or Rs. 1,50,000 = 50,000 Selling Price – Rs. 7,50,000 – Rs. 4,00,000.<br />
or –50,000 Selling Price = –Rs. 7,50,000 – Rs. 4,00,000 – Rs. 1,50,000.<br />
or –50,000 Selling Price = –Rs. 13,00,000.<br />
13,00,000<br />
− Selling Price = −Rs.<br />
= Rs. 26<br />
50,000<br />
Selling Price = Rs. 26.<br />
The management can achieve the target profits of Rs. 1,50,000 by increasing the<br />
selling price per unit by Re. 1, an increase of 4% on the existing selling price.<br />
17. Statement showing the computation of equivalent annual costs of two machines:<br />
Machines – X<br />
Year Cost P.V. Factor @ 10% Discounted cost<br />
Rs. Rs.<br />
0 10,000 1.0000 10,000<br />
1 2,000 .9091 1,818<br />
2 2,000 .8264 1,653<br />
3 2,000 .7513 1,503<br />
4 2,500 .6830 1,708<br />
5 2,500 .6209 1,552<br />
6 2,500 .5645 1,411<br />
7 3,000 .5132 1,540<br />
8 3,000 .4665 1,400<br />
9 3,000 .4241 1,272<br />
10 3,000 .3855 1,157<br />
25,014
Cost after accounting for salvage value:<br />
120<br />
Rs. 25,014 – (Rs. 1,500 × .3855) = Rs. 25,014 – Rs. 578 = Rs. 24,436.<br />
Equivalent Annual Cost = Total discounted cost × capital recovery factor<br />
Or Equivalent Annual Cost = Rs. 24,436 × .1628 = Rs. 3,978.<br />
Machines – Y<br />
Year Cost P.V. Factor @ 10% Discounted cost<br />
Rs. Rs.<br />
0 8,000 1.0000 8,000<br />
1 2,500 .9091 2,273<br />
2 2,500 .8264 2,066<br />
3 2,500 .7513 1,878<br />
4 3,800 .6830 2,595<br />
5 3,800 .6209 2,359<br />
6 3,800 .5645 2,145<br />
21,316<br />
Total cost after salvage value:<br />
Rs. 21,316 – (Rs. 1,000 × .5645) = Rs. 21,316 – Rs. 565 = Rs. 20,751.<br />
Equivalent Annual Cost = 20,751 × .2296 = Rs. 4,764.<br />
Hence, Machine X is cheaper.<br />
18. (a) Statement showing the EPS under different schemes:<br />
Schemes<br />
I II III<br />
Rs. Rs. Rs.<br />
Debt Content: 2,00,000 6,00,000 10,00,000<br />
Earning before interest <strong>and</strong> tax (EBIT) 2,00,000 2,00,000 2,00,000<br />
Interest 20,000 74,000 1,37,500<br />
Earning before tax (EBT) 1,80,000 1,26,000 62,500<br />
Taxes at 50% 90,000 63,000 31,250<br />
Earning after tax (EAT) 90,000 63,000 31,250<br />
Earning per share (EPS) 3.60 4.20 3.91<br />
EAT<br />
e.g., 90,000 ÷ 25,000 = 3.60<br />
No. of shares<br />
Scheme II is to be preferred since the EPS is the highest under this scheme. Under this<br />
scheme the borrowing is also well within the limit. Scheme III gives an EPS of Rs. 3.91 for a<br />
price of Rs. 25 but the debt equity ratio is too high.<br />
Working Notes:<br />
Amount of Equity Capital<br />
(i) No. of equity shraes =<br />
:<br />
Current Market Price per share<br />
10,00,000<br />
6,00,000<br />
2,00,000<br />
I : = 25,000,<br />
II:<br />
= 15,000, III:<br />
= 8,000<br />
40<br />
40<br />
25<br />
Rs.<br />
(ii) Calculation of Interest:<br />
Scheme I : Borrowing Rs. 2 lakhs @ Rs. 10%: 20,000
121<br />
Scheme II : Borrowing Rs. 6 lakhs : upto Rs. 2½ lakhs @ 10% 25,000<br />
on Rs. 3½ lakhs @ 14% 49,000<br />
74,000<br />
Scheme III : Borrowing Rs. 10 lakhs : upto Rs. 2½ lakhs @ 10% 25,000<br />
on Rs. 3.75 lakhs @ 14% 52,500<br />
on Rs. 3.75 lakhs @ 16% 60,000<br />
1,37,500<br />
(b) Decision-tree approach in capital budgeting: The decision-tree approach is a useful<br />
analytical technique in capital budgeting to evaluate risky investment proposals involving<br />
sequential decisions. This technique enables the decision-maker to study the various<br />
decision points in relation to subsequent chance events <strong>and</strong> choose, from among the<br />
alternatives, in an objective <strong>and</strong> consistent manner. Since the format of the problem of the<br />
investment decision has an appearance of a tree with branches, the method is known as<br />
decision-tree method. The decision tree shows the magnitude, probability <strong>and</strong> interrelationship<br />
of all possible out-comes of an investment proposal. In a nutshell, a decisiontree<br />
is a graphic-display or the relationship between a present decision <strong>and</strong> future events,<br />
future decisions <strong>and</strong> their consequences. It contains squares <strong>and</strong> circles. The squares<br />
represent decision points <strong>and</strong> the circles represent chance event nodes. The following are<br />
the important steps involved in constructing <strong>and</strong> using a decision tree in capital budgeting:<br />
(i) To identify <strong>and</strong> define the investment proposal;<br />
(ii) To identify the decision alternatives. For example, if a company is considering setting<br />
up a plant, it has the option of setting up a large plant, a medium size plant or a small<br />
plant initially <strong>and</strong> exp<strong>and</strong> it later on or no plant.<br />
(iii) To draw various branches of the tree showing the decision points, chance events <strong>and</strong><br />
other data.<br />
(iv) To enter on the decision tree branches the relevant data such as the projected cash<br />
flows, probabilities <strong>and</strong> the expected payoffs.<br />
(v) To analyse the result <strong>and</strong> by backward induction determine optimal decisions at various<br />
decision points <strong>and</strong> eliminate alternative branches on the basis of dominance.<br />
Example: Suppose a firm has an investment proposal requiring an outlay of Rs. 1,00,000. If<br />
the proposal is successfully implemented, the expected cash inflows will amount to Rs.<br />
1,40,000. However, if the proposal fails, the firm will suffer a loss of Rs. 15,000 on account<br />
of a expenses, etc. for initiating the proposal. For simplicity purpose, the life of the proposal<br />
is assumed to be 1 year without any salvage value.<br />
In this case: Estimated profit = Cash inflow Rs. 1,40,000 – Outlay Rs. 1,00,000 – Expenses<br />
Rs. 15,000 = Rs. 25,000.<br />
Probability of success : .5<br />
Probability of failure : .5<br />
The decision tree for the above simple problem is drawn below. The expected payoff has<br />
been computed by the backward induction method <strong>and</strong> shown against chance node 2 as +<br />
Rs. 5,000; being a positive amount the investment is worthwhile.
Uses of Decision-tree approach:<br />
122<br />
(i) The decision tree approach is very useful in h<strong>and</strong>ling the sequential investments.<br />
Working backwards from the future to the present – the decision maker is able to<br />
eliminate unprofitable branches <strong>and</strong> ascertain optimum decision at various decision<br />
points.<br />
(ii) This approach clearly brings out the implicit assumptions <strong>and</strong> calculations for all to see,<br />
question <strong>and</strong> revise.<br />
(iii) The decision tree enables a decision maker to visualize assumptions <strong>and</strong> alternatives<br />
in a graphic form, which is usually much easier to underst<strong>and</strong>.<br />
However, some Demerits are also associated with the decision tree approach. These<br />
diagrams tend to become more <strong>and</strong> more complicated with the inclusion of more<br />
alternative/variables <strong>and</strong> by looking into a very distant future. Complications increase still<br />
further if the analysis is extended to include inter-dependent alternatives <strong>and</strong> variables.<br />
They make the diagram cumbersome <strong>and</strong> calculations very time consuming <strong>and</strong> difficult.<br />
19. Garden products Limited<br />
Alternatives Reduction<br />
in Selling<br />
price<br />
Statement Showing Results of Proposals for 2006<br />
Rate Revised<br />
contributi<br />
on per<br />
unit<br />
Rate<br />
increase in<br />
sale<br />
Quantity Revised Sale<br />
Quantity<br />
(units)<br />
Total<br />
contribution<br />
Rs. Rs. Rs. Rs.<br />
A 5% 2.50 27.50 10% 8,000 88,000 24,20,000<br />
B 7% 3.50 26.50 20% 16,000 96,000 25,44,000<br />
C 10% 5.00 25.00 25% 20,000 1,00,000 25,00,000<br />
It is evident from the above statement that on profitability consideration, to the exclusion of other<br />
factors, alternative B should be adopted for 2006.<br />
Working Note:<br />
Computation of units sold in 2005:<br />
Rs.<br />
Net Profit 14,00,000<br />
Fixed cost 10,00,000<br />
Contribution 24,00,000<br />
Contribution per unit : Rs. (50 – 20) i.e., Rs. 30.<br />
24,00,000<br />
Units sold : Rs. =<br />
80,000<br />
30
123<br />
20. The total requirement of funds of the company of the proposed expansion scheme amounts to Rs.<br />
8,50,000 as calculated below:<br />
Rs.<br />
1. Plant <strong>and</strong> Machinery 4,00,000<br />
2. Buildings 2,00,000<br />
3. Patent Rights 1,00,000<br />
4. Stocks 2,00,000<br />
5. Working Capital 1,00,000<br />
Total 10,00,000<br />
Less: Cash <strong>and</strong> Bank Balance on h<strong>and</strong> 1,50,000<br />
Additional Funds Required 8,50,000<br />
The anticipated yield from additional investment as a result of expansion is Rs. 2.5 lakhs per<br />
annum. It means a return of 25% on capital investment.<br />
The company has various alternatives to finance its additional requirements of funds. It can take<br />
loan from bank, issue debentures, accept public deposits or issue additional share capital to the<br />
extent possible <strong>and</strong> the balance from loan capital. Before deciding a source of finance, let us<br />
evaluate each alternative individually. The objective in examining the various alternatives is to<br />
ascertain which source of finance would assure the equity shareholders the best possible return,<br />
since they are the real owners of the company.<br />
1. Bank finance: The total funds to be borrowed amount to Rs. 8,50,000 at 20% interest per<br />
annum. The loan will be secured against the assets of the company. If the company raises<br />
additional funds by borrowing from the bank then the additional surplus left with the company<br />
after meeting interest cost would amount to Rs. 40,000 as calculated below:<br />
Rs.<br />
Additional Income 2,50,000<br />
Less: Interest on Rs. 8,50,000 at 20% 1,70,000<br />
Income after interest 80,000<br />
Less: Income-tax at 50% 40,000<br />
Surplus 40,000<br />
Since the company has 5,000 equity shares, the bank financing will result in an additional<br />
dividend of Rs. 8 per share.<br />
2. Debentures: In this case also the amount to be collected is Rs. 8,50,000 at an interest-rate<br />
of Rs. 13.5%. If the company issues debentures, the retained surplus after Income-tax<br />
would amount to Rs. 67,625 as shown below:<br />
Rs.<br />
Additional Income 2,50,000<br />
Less: Interest on Rs. 8,50,000 at 13.5% 1,14,750<br />
Income after interest 1,35,250<br />
Less: Income-tax at 50% 67,625<br />
Surplus 67,625<br />
This would result in an additional dividend of about Rs. 13.5 per share i.e. Rs. 67,625 ÷<br />
5,000.<br />
3. Public Deposits: The company can also raise funds by means of public deposits at 15% per<br />
annum. If it could procure requisite funds through public deposit <strong>and</strong> other unsecured loans,<br />
the interest rate being 15% the additional surplus of income to be available with the<br />
company after meeting interest cost would amount to Rs. 61,250 as shown below:
124<br />
Rs.<br />
Additional Income 2,50,000<br />
Less: Interest on Rs. 8,50,000 at 15% 1,27,500<br />
Net income after interest 1,22,500<br />
Less: Income-tax at 50% 61,250<br />
Balance 61,250<br />
In this case, the cash availability for disbursement of dividends would be Rs. 61,250. It<br />
would enable the company to pay an additional dividend of Rs. 12.25 i.e. (Rs. 61,250 ÷<br />
5,000) per share.<br />
4. Raising of Additional Capital: The Company has an uncalled portion on the existing shares.<br />
If the company calls the uncalled amount on the existing shares, it would mean a collection<br />
of Rs. 75,000 <strong>and</strong> Rs. 2,50,000 from preference shareholders <strong>and</strong> equity shareholders<br />
respectively.<br />
Issue of unsubscribed shares would mean collection of additional preference share capital of<br />
Rs. 2,00,000 <strong>and</strong> equity capital of Rs. 2,50,000.<br />
This would still leave an unbridged gap of Rs. 75,000 which can be managed by issue of<br />
debentures, this being the least costly borrowal from the point of view of the company.<br />
The above procedure would lead to the following results:<br />
Rs.<br />
Additional profit 2,50,000<br />
Deduct: Interest on debentures<br />
Rs. 75,000 at 13.5% 10,125<br />
2,39,875<br />
Income-tax at 50% 1,19,938<br />
1,19,937<br />
Preference dividends at 13.5% on 2,75,000 37,125<br />
Surplus available to equity shareholders 82,812<br />
It has been stated that the market price has to be maintained. Rs. 50 share is quoted at Rs.<br />
75 at 1½% times its paid up value. A competitor’s share (Rs. 100 fully paid up) is quoted at<br />
Rs. 160, on the basis of a dividend declaration of Rs. 20 per share. This would mean a<br />
Rs. 20<br />
return of 12½% on the investment, viz., × 100 . If a similar return on investment has<br />
Rs. 160<br />
to be assured to the shareholders of Y Manufacturing Co. Ltd., to ensure that the market<br />
price does not drop then the return on investment on a fully paid share must be 12½% ×<br />
1½% = Rs. 18.75 per share. Additional equity issue under the method amounts to Rs.<br />
5,00,000, i.e., 2,500 shares fully paid <strong>and</strong> 5,000 shares half paid. On this amount a surplus<br />
18.75<br />
of Rs. 93,750 (2,500×<br />
18.75 per share plus 5,000×<br />
per share is required to declare<br />
2<br />
requisite dividend on maintain existing market price of the shares. The above available<br />
profit is less than Rs. 93,750.<br />
Thus the above examination of the various sources of financing shows that the most<br />
profitable alternative is ‘issue of debentures’. It is evident from the balance sheet of the<br />
company that it has very sound financial position. On a capital base of Rs. 4,75,000, it has<br />
accumulated profit of Rs. 5,00,000. As such the company possesses adequate capacity to<br />
raise debt. In fact, the company has not utilized its loan raising capacity fully. From the<br />
view point of efficient financial management, the company must utilize the gearing to the<br />
fullest extent possible <strong>and</strong> raise additional funds through loans. In the present case, if the
125<br />
entire additional investment is financed by additional loans, the company’s ‘debt-equity’ ratio<br />
will still be less than 2 : 1, which is quite satisfactory. Out of the alternatives available, the<br />
issue of debentures seems to be most profitable from the point of view of equity<br />
shareholders. The company will be able to secure the benefits of financial leverage to its<br />
equity shareholders for which there is ample scope without any undue risk. It is, therefore,<br />
advisable that the company should finance the expansion scheme by floating additional<br />
debentures which will ensure maximum benefit to the shareholders.<br />
21. A Limited<br />
Existing Production<br />
Product<br />
S T Y Total<br />
Selling price (Rs.) 30 40 20<br />
Variable cost (Rs.) 15 20 12<br />
Contribution per unit (Rs.) 15 20 8<br />
Contribution<br />
P/V Ratio ×100<br />
Sale<br />
50%<br />
50%<br />
40%<br />
Sales mix<br />
Contribution per rupee of sales<br />
35% 35% 30%<br />
(P/V ratio × Sales mix)<br />
17½% 17½% 12%<br />
Total sales Rs. 6,00,000<br />
Total Contribution<br />
(6,00,000 × .47) Rs. 2,82,000<br />
Fixed costs Rs. 1,80,000<br />
Profit at present<br />
production Rs. 1,02,000<br />
Fixed Cost 1,80,000<br />
Break-even point : = Rs. 3,83,000<br />
P/V ratio 0.47<br />
Proposed Production<br />
Product<br />
S T M Total<br />
Selling price (Rs.) 30 40 30<br />
Variable cost (Rs.) 15 20 15<br />
Contribution per unit (Rs.) 15 20 15<br />
P/V Ratio 50% 50% 50%<br />
Sales mix<br />
Contribution per rupee of sales<br />
50% 25% 25%<br />
(P/V ratio × Sales mix)<br />
25% 12½% 12½%<br />
Total sales Rs. 6,40,000<br />
Total Contribution<br />
(6,40,000 × .50)<br />
Rs. 3,20,000<br />
Less: Fixed costs Rs. 1,80,000<br />
Profit Rs. 1,40,000<br />
Fixed Cost 1,80,000<br />
Break-even point : =<br />
Rs. 3,60,000<br />
P/V ratio 0.50<br />
47%<br />
50%
126<br />
The proposal can be accepted because after replacement of Y with product M: (i) the break evenpoint<br />
of the company is reached at a lower level of the total sales as compared to the present<br />
situation, <strong>and</strong> (ii) also there is an increase of profit by Rs. 38,000.<br />
22. Rs. in lakhs<br />
1. Plant <strong>and</strong> Machinery (including spares)<br />
Ex. Works cost 5,000<br />
Add: Excise duty @ 20% 1,000<br />
6,000<br />
Add: Sales Tax @ 8% (Assumed) 480<br />
6,480<br />
Add: Transport & Insurance @ 5% (Assumed) 324<br />
Ex. Works price 6,804<br />
Add: Instalation charges @ 5% (Assumed) 340<br />
Total cost of plant <strong>and</strong> machinery 7,144<br />
2. Cost of l<strong>and</strong><br />
80 bighas @ Rs. 30,000 per bigha 24,00,000<br />
3. Building <strong>and</strong> civil work 15% of plant <strong>and</strong> equipment<br />
including spares i.e. Rs. 7,144 lakhs × 15% 1,072<br />
4. Calculation of Engineering consultancy fees<br />
Site development charges 20<br />
Building <strong>and</strong> civil works 1,072<br />
Plant <strong>and</strong> machinery 7,144<br />
Miscellaneous fixed assets 45<br />
Environmental cost 300<br />
Start up <strong>and</strong> commissioning charges @ 12% of ex-works<br />
Price of plant <strong>and</strong> equipment including spares 600<br />
Total 9,181<br />
Engineering consultancy fee @ 3% of applicable project<br />
Cost i.e. Rs. 9,181 lakhs 275<br />
5. Pre operative expenses start up <strong>and</strong> commissioning charges 600<br />
Interest during construction period 100<br />
Construction, water, power <strong>and</strong> approach road 15<br />
715<br />
6. Provision for contingencies<br />
6% on l<strong>and</strong> 24<br />
Building <strong>and</strong> civil work 1,072<br />
Site development 20<br />
10% on balance<br />
Rs. in lakhs<br />
Total 1,116 67<br />
Plant <strong>and</strong> machinery 7,144<br />
Miscellaneous fixed assets 45
127<br />
Environment cost 300<br />
Training <strong>and</strong> Technical know how fee (i.e.<br />
Rs. 275 + 36)<br />
311<br />
Pre operative expenses 615<br />
Preliminary expenses 15<br />
8,430 843<br />
Total 910<br />
7. Margin money of working capital i.e. Rs. 2,500 × 25% 625 lakhs<br />
8. Ascertainment of cost of project (Rs. in lakhs)<br />
(i) L<strong>and</strong> 24<br />
(ii) Site development 20<br />
(iii) Building <strong>and</strong> civil works 1,072<br />
(iv) Plant <strong>and</strong> machinery including spares 7,144<br />
(v) Miscellaneous fixed assets 45<br />
(vi) Environment cost 300<br />
(vii) Technical know-how <strong>and</strong> training<br />
(a) Foreign training 36<br />
(b) Engineering consultancy 275 311<br />
(viii) Preoperative expenses 615<br />
(ix) Preliminary expenses 15<br />
(x) Contingencies 910<br />
(xi) Margin money 625<br />
Total cost of project 11,081<br />
23. (a) Projected Income Statement for the first operating year<br />
(From April 1st , 2006 to March 31st , 2007)<br />
(Rs. in lakhs)<br />
Sales<br />
Less:<br />
5,500<br />
Cost of goods sold 3,500<br />
2,000<br />
Less: Depreciation on Building – 5% of (Rs. 750 + 110.80) 43.04<br />
Plant <strong>and</strong> Machinery 10% of (Rs. 3,000 + 443.18) 344.32<br />
Miscellaneous fixed assets – 10% of (Rs. 500 + 73.86) 57.39<br />
444.75 say 445<br />
Interest on term loans (Rs. 3,100 + 900) @ 18% 720<br />
Bank borrowings (Rs. 1,800) @ 16% 288 1,008<br />
Preliminary Expenses written off (1/10th of Rs. 250) 25<br />
Net Profit 522
128<br />
(b) Projected Cash Flow Statement<br />
Particulars<br />
Inflow<br />
Construction period<br />
(Rs. in lakhs)<br />
1st operating year<br />
Equity share capital 2,200 −<br />
Term loan 3,100 900<br />
Bank Borrowings<br />
Profit before interest <strong>and</strong> taxes<br />
− 1,800<br />
(Rs. 1,008 + 522)<br />
−<br />
1,530<br />
Depreciation 445<br />
Preliminary expenses written off _____ 25<br />
Outflow<br />
5,300 4,700<br />
Capital expenditures 4,400 −<br />
Current Assets (other than cash) − 2,700<br />
Preliminary expenses 250<br />
Pre-operative expenses 650<br />
Interest − 1,008<br />
5,300 3,708<br />
Opening cash balance 0 0<br />
Net surplus/deficit 0 992<br />
Closing cash balance 0 992<br />
(c) Projected Balance Sheet<br />
(Rs. in lakhs)<br />
31.3.2006 31.3.2007 31.3.2006 31.3.2007<br />
Liabilities Assets<br />
Equity share capital 2,200 2,200 Fixed Assets 5,050 4,605<br />
Reserves <strong>and</strong> surplus − 522 Current Assets:<br />
Secured loans Cash − 992<br />
Term loans 3,100 4,000 Other current Assets 2,700<br />
Bank borrowings − 1,800 Miscellaneous expenditure<br />
Current liabilities & Provisions − − Preliminary expenses 250 225<br />
5,300 8,522 5,300 8,522<br />
24. Cash outflows under the two options will be:<br />
Alternative : 1<br />
Suppliers credit for 60 days +<br />
bank loan for 30 days<br />
Alternative : 2<br />
Total Suppliers credit<br />
Amount in USD 10,000 10,000<br />
Applicable forward rate 46.20 46.35<br />
Amount in Rs. 4,62,000 4,63,500<br />
Interest in Rs. 3,465* 2,318**<br />
Total 4,65,465 4,65,818<br />
* 4,62,000 × 9<br />
×<br />
100<br />
1<br />
12<br />
= Rs. 3,465
129<br />
* * 10,000<br />
× 6 1<br />
× × 46.35 = i.e. US$ 50 converted @ Rs. 46.35 per dollar = Rs. 2,318.<br />
100 12<br />
Recommendation: Alternative 1 is better.<br />
25. (a) Expected Return under different portfolios:<br />
A B Expected Return of<br />
Portfolio<br />
Portfolio Probability Return Probability Return<br />
1 1 0.12 0 0.2 0.12 + 0 = 12%<br />
2 0.5 0.12 0.5 0.2 0.06 + 0.1 = 16%<br />
3 0.75 0.12 0.25 0.2 0.09 + 0.05 = 14%<br />
4 0.25 0.12 0.75 0.2 0.03 + 0.15 = 18%<br />
5 0 0.12 1 0.2 0 + 0.20 = 20%<br />
Therefore, the expected return under different portfolios are 12%, 16%, 14%, 18% <strong>and</strong> 20%<br />
respectively.<br />
(b) Risk factor associated with different portfolios:<br />
A B<br />
Portfolio Prob. σ A Prob. σ B r 2<br />
AB σ σ<br />
p<br />
p<br />
1 1 0.1 0 0.18 0.15 0.01 0.10 = 10%<br />
2 0.5 0.1 0.5 0.18 0.15 0.0119 0.109 = 10.9%<br />
3 0.75 0.1 0.25 0.18 0.15 0.0087 0.094 = 9.4%<br />
4 0.25 0.1 0.75 0.18 0.15 0.0198 0.140 = 14%<br />
5 0 0.1 1 0.18 0.15 0.0324 0.180 = 18%<br />
Therefore, the risk factor associated with different portfolios is 10%, 10.9%, 9.4%, 14% <strong>and</strong><br />
18% respectively.<br />
(c) Best Portfolio from the point of view of risk:<br />
The best portfolio from the point of view of risk is the one which has the least risk factor i.e.<br />
9.4%. Portfolio 3 [ i.e. 75% of funds invested in A <strong>and</strong> 25% in B] is the best portfolio from<br />
the point of risk.<br />
(d) Best portfolio from the point of return.<br />
Portfolio 5 [ i.e. 100% funds invested in the security, B.] is the best from the point of return.<br />
This portfolio will earn a return of 20% i.e. 20% of Rs. 1,00,000 = Rs. 20,000 p.a.<br />
26. Evaluation of Different Options<br />
(i) Option I: Financing the purchase by availing loan at 18% per annum.<br />
Cost of Machine<br />
3,400 lakh yen in Rs.<br />
Rs. in Lakhs<br />
( @ Rs. 100 = 340 yens) 1000.00<br />
Add: Interest at 4.5% (1 st Quarter) 45.00<br />
Add: Interest at 4.5% (2 nd Quarter) 47.03<br />
(on Rs. 1,045 lakhs)<br />
Total Outflow in Rs. 1092.03
130<br />
Alternatively, interest can also be calculated on compounded basis, i.e.<br />
Rs. 1,000× [1.045] 2 = Rs. 1,092.03 lakhs<br />
(ii) Option II: Accepting the offer from foreign branch.<br />
Rs. in lakhs<br />
Cost of letter of Credit at 1% on 3400 lakhs yen @ Rs. 100 = 340 yen 10.00<br />
Add: Interest for 1 st Quarter 0.45<br />
Interest for 2 nd Quarter 0.47<br />
(A) 10.92<br />
Payment at the end of 180 days:<br />
Yen in lakhs<br />
Cost 3400.00<br />
Interest at 2% p.a.<br />
2 180<br />
33.53<br />
3400 × ×<br />
100 365<br />
Conversion Cost at Rs. 100 = 345 yen<br />
100<br />
3 , 433.<br />
53×<br />
= (B) = Rs. 995.23<br />
345<br />
Total Cost = (A) + (B)<br />
= 10.92 + 995.23<br />
= Rs. 1,006.15 lakhs<br />
3433.53<br />
Advice: The above working shows that the Option II is cheaper. Therefore, it should be<br />
accepted.