blood spatter worksheets
blood spatter worksheets
blood spatter worksheets
Create successful ePaper yourself
Turn your PDF publications into a flip-book with our unique Google optimized e-Paper software.
HP MODEL #2<br />
Worksheet #1 : Blood Spatter Evidence<br />
Name___________________________________________________ Class Period____________<br />
Teacher________________________<br />
Throughout this project we will examine the shapes, locations, and distribution patterns of<br />
<strong>blood</strong>stains. This will help provide us with an interpretation of the physical events that occurred at a<br />
crime scene. Medicolegal Investigators (MI’s) are responsible for being educated, trained, and<br />
proficient in evaluating such situations at crime scenes.<br />
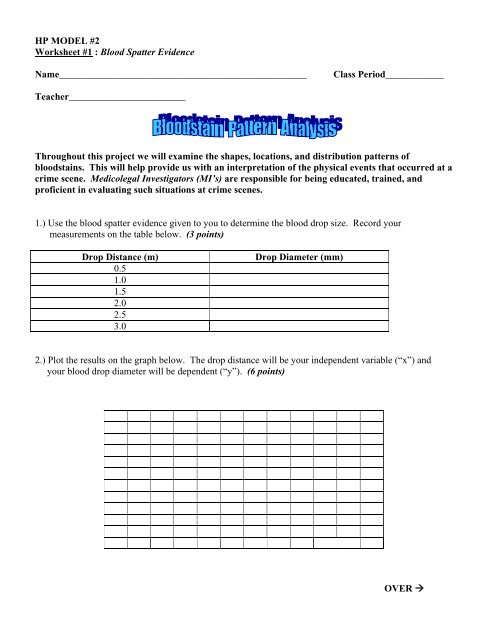
1.) Use the <strong>blood</strong> <strong>spatter</strong> evidence given to you to determine the <strong>blood</strong> drop size. Record your<br />
measurements on the table below. (3 points)<br />
Drop Distance (m) Drop Diameter (mm)<br />
0.5<br />
1.0<br />
1.5<br />
2.0<br />
2.5<br />
3.0<br />
2.) Plot the results on the graph below. The drop distance will be your independent variable (“x”) and<br />
your <strong>blood</strong> drop diameter will be dependent (“y”). (6 points)<br />
OVER
3.) Using the regression capabilities of your graphing calculator : (5 points)<br />
a.) Find a linear regression to model the data. (If needed, round values to the nearest hundredth.)<br />
RECALL: Stat Edit<br />
Stat Calc - #4<br />
b.) Sketch and label this regression on your graph.<br />
4.) . . . use your regression model and the diameter of the<br />
<strong>blood</strong> drop from the power point to determine the height of where his wound originated.<br />
(1 point)<br />
HP MODEL #2
Worksheet #2 : Blood Spatter Article Review<br />
Name___________________________________________________ Class Period____________<br />
Teacher________________________<br />
Article by : J. Slemko Forensic Consulting<br />
Read through the given information sheet and answer the following questions.<br />
1.) On average, <strong>blood</strong> volume accounts for what percent of a person’s total body weight? (1 point)<br />
2.) What percent of <strong>blood</strong> volume loss is required for death to occur? (1 point)<br />
3.) The surface tension of <strong>blood</strong> tends to form a _______________________ shape rather than a<br />
teardrop shape when free falling or projected. (1 point)<br />
4.) Name the 3 categories of <strong>blood</strong>stains. Give examples and characteristics of each. (6 points)<br />
OVER<br />
0<br />
5.) Explain the shape of a droplet of <strong>blood</strong> that strikes a surface at an angle less than90<br />
. (1 point)
6.) State the Trig formula used to determine the angle of impact (AOI). (1 point)<br />
7.) Explain how the point of convergence (origin) is determined with several <strong>blood</strong>stains. (Feel free to<br />
use a diagram to help with your explanation). (3 points)<br />
HP Model #2 - Blood Spatter
HP Model #2 - Blood Spatter<br />
Excerpts from an article by : J. Slemko Forensic Consulting
HP MODEL #2<br />
Worksheet #3 : Blood Spatter Lab Analysis
Name___________________________________________________ Class Period____________<br />
Teacher________________________<br />
1.) Use the <strong>blood</strong> <strong>spatter</strong> evidence collected from the lab to fill in the Angle Data Table below. (9 points)<br />
Impact Angle Sketch Diameter (W) Length (L) (W/L)<br />
10°<br />
20°<br />
30°<br />
40°<br />
OVER
Impact Angle Sketch Diameter Length (W/L)<br />
50°<br />
60°<br />
70°<br />
80°<br />
90°
W<br />
The Trig formula used to determine the angle of impact (AOI) is sinθ<br />
= .<br />
L<br />
Where θ =the angle, W = width of the <strong>blood</strong>stain, L = length of the <strong>blood</strong>stain.<br />
1<br />
This indicates the AOI can be found by sin W − ⎛ ⎞<br />
⎜ ⎟=<br />
θ .<br />
⎝ L ⎠<br />
2.) Choose 4 angles from the data collected and justify the Trig relationship. (4 points)<br />
(Be sure your calculator is in degree mode!)<br />
OVER
3.) Plot the results of the lab on the graph below. The angle measure will be the “x” variable<br />
and your W ⎛ ⎞<br />
⎜ ⎟ ratio will be the “y” variable. (6 points)<br />
⎝ L ⎠<br />
4.) Using the regression capabilities of your graphing calculator : (5 points)<br />
a.) Find a linear regression to model the data. (If needed, round values to the nearest hundredth.)<br />
RECALL: Stat Edit<br />
Stat Calc - #4<br />
b.) Sketch and label this regression on your graph.


