Attitudes Toward Suicide Among Chinese People in Hong Kong
Attitudes Toward Suicide Among Chinese People in Hong Kong
Attitudes Toward Suicide Among Chinese People in Hong Kong

Create successful ePaper yourself
Turn your PDF publications into a flip-book with our unique Google optimized e-Paper software.
Lee et al. 571<br />
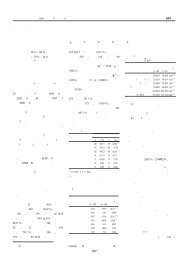
TABLE 3<br />
Variation of Factor Score (1: greatly agree—5: greatly disagree) Across Sociodemographic Characteristics<br />
Factors<br />
Negative Suicidal Fatal- Social Sup- Conta- Sym- Funcappraisal<br />
Stigma spectrum ism change port giousness pathy tion<br />
Gender<br />
Male 2.96 2.62 3.02 2.93 3.25 3.24 2.95 2.81 3.05<br />
Female 2.91 2.58 2.91 2.89 3.24 3.25 2.97 2.77 2.95<br />
t(1) 2.56* 1.93 4.33* 1.77 0.24 0.21 0.74 1.98* 4.67*<br />
Age (years)<br />
15–25 2.90 2.60 2.96 2.82 3.26 3.27 2.96 2.79 3.00<br />
26–50 2.95 2.61 2.94 2.96 3.24 3.26 2.97 2.79 3.02<br />
51–75 3.00 2.62 3.04 3.01 3.23 3.33 2.95 2.82 3.00<br />
F(2) 8.77* 0.37 4.16* 25.67* 0.88 2.55 0.22 0.72 0.41<br />
Marital Status<br />
S<strong>in</strong>gle 2.91 2.60 2.96 2.86 3.26 3.25 2.97 2.79 3.01<br />
Married 2.97 2.61 2.99 2.97 3.22 3.30 2.95 2.80 3.00<br />
t(1) 3.56* 0.64 1.11 5.05* 1.92 2.27* 0.59 0.54 0.80<br />
Education<br />
Primary or below 2.99 2.66 3.01 3.03 3.19 3.31 3.02 2.81 2.98<br />
Middle School 2.97 2.62 2.99 2.96 3.22 3.26 2.93 2.84 3.02<br />
High School 2.95 2.58 2.97 2.95 3.25 3.25 2.93 2.78 3.03<br />
Tertiary or above 2.89 2.59 2.96 2.83 3.27 3.28 2.97 2.78 3.00<br />
F(3) 6.28* 2.02 0.65 17.59* 2.88* 1.20 2.25 1.34 0.77<br />
Religion<br />
Christianity 2.94 2.61 2.97 2.86 3.28 3.30 3.03 2.80 3.00<br />
Buddhism or Taois 2.99 2.61 2.98 3.01 3.23 3.31 2.99 2.84 3.02<br />
Others 2.99 2.62 3.10 2.88 3.17 3.34 2.97 2.68 3.05<br />
None 2.92 2.60 2.97 2.90 3.24 3.26 2.93 2.79 3.00<br />
F(3) 3.56* 0.11 0.32 6.09* 0.82 1.50 3.17* 1.36 0.23<br />
Employment<br />
Work<strong>in</strong>g 2.97 2.61 2.99 2.96 3.24 3.30 2.96 2.80 3.01<br />
Unemployed 2.89 2.71 2.86 2.99 3.19 3.05 3.00 2.81 3.01<br />
Students 2.89 2.59 2.87 2.81 3.26 3.27 2.97 2.79 3.00<br />
F(2) 9.01* 1.86 1.78 22.19* 0.83 9.32* 0.15 0.07 0.34<br />
Occupation<br />
Professional 2.94 2.60 3.04 2.88 3.34 3.34 3.03 2.77 3.08<br />
Adm<strong>in</strong>istrative 2.97 2.58 3.03 2.96 3.29 3.28 2.93 2.79 3.03<br />
Skilled 2.95 2.62 2.86 2.99 3.22 3.30 3.06 2.77 2.98<br />
Nonskilled 2.92 2.93 2.95 2.88 3.20 3.27 2.92 2.79 2.99<br />
F(3) 1.44 0.28 4.92* 4.20* 6.78* 1.29 5.91* 0.13 3.00*<br />
Personal monthly <strong>in</strong>come<br />
Less than US$641 2.91 2.61 2.97 2.85 3.25 3.25 2.96 2.80 3.01<br />
US$641–US$1,282 2.97 2.60 2.97 2.98 3.22 3.31 2.93 2.79 2.98<br />
US$1,283 or above 2.94 2.89 2.99 2.92 3.27 3.28 2.99 2.78 3.04<br />
F(2) 5.10* 0.41 0.21 13.98* 1.67 2.79 1.26 0.25 1.94<br />
*p < 0.05<br />
497