Determination of Chlorite, Bromate, Bromide, and Chlorate ... - Dionex
Determination of Chlorite, Bromate, Bromide, and Chlorate ... - Dionex
Determination of Chlorite, Bromate, Bromide, and Chlorate ... - Dionex

Create successful ePaper yourself
Turn your PDF publications into a flip-book with our unique Google optimized e-Paper software.
6<br />
26.25<br />
µS<br />
25.25<br />
0.004<br />
AU<br />
-0.001<br />
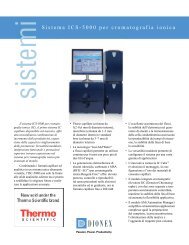
Column: <strong>Dionex</strong> IonPac AG9-HC, AS9-HC<br />
Eluent: 9.0 mM sodium carbonate<br />
Temp: 30 °C<br />
Flow Rate: 1.3 mL/min<br />
Inj. Volume: 225 µL<br />
Detection: A. Suppressed conductivity,<br />
<strong>Dionex</strong> Anion Atlas Electrolytic Suppressor,<br />
external water mode<br />
B. Absorbance, 352 nm<br />
Postcolumn Reagent: Acidified KI<br />
PCR Flow Rate: 0.4 mL/min<br />
Postcolumn Heater: 80 °C<br />
Peaks A: 1. <strong>Chlorite</strong>* 14.3 µg/L (ppb)<br />
2. <strong>Bromate</strong>** 1.37<br />
3. DCA***<br />
4. <strong>Bromide</strong> 32.2<br />
5. <strong>Chlorate</strong> 93.9<br />
Peak B: 6.<br />
* <strong>Chlorite</strong> spike 10 ppb<br />
<strong>Bromate</strong>-UV** 1.43 µg/L (ppb)<br />
** <strong>Bromate</strong> spike 1 ppb<br />
*** DCA = Dichloracetate, quality control surrogate<br />
A<br />
B<br />
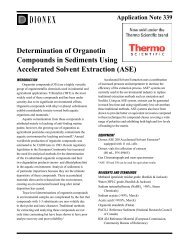
Figure 4. <strong>Determination</strong> <strong>of</strong> DBP anions in spiked Sunnyvale, CA, drinking water;<br />
(A) suppressed conductivity detection <strong>and</strong> (B) UV absorbance detection after<br />
PCR with acidified KI.<br />
chlorine dioxide.<br />
1 2<br />
6<br />
3<br />
5<br />
4<br />
0 5 10 15<br />
20<br />
Minutes<br />
18138-01<br />
Figure 4 shows chromatograms <strong>of</strong> the same drinking<br />
water sample spiked with bromate at 1 µg/L, <strong>and</strong> with<br />
chlorite, bromide, <strong>and</strong> chlorate at 10 µg/L. The top trace<br />
(A) was obtained with the conductivity detector <strong>and</strong> the<br />
bottom trace (B) was obtained with the UV/Vis absorbance<br />
detector after postcolumn reaction with acidified<br />
KI. The benefits <strong>of</strong> PCR with UV detection for bromate<br />
determination can clearly be seen in Figure 4 (B), where<br />
the bromate peak response is significantly enhanced<br />
compared to the conductivity detector. No response is<br />
Table 3. Anion recoveries for spiked water samples.<br />
Anion*<br />
Amount<br />
Added<br />
(µg/L)<br />
Tap Water<br />
Recovery<br />
High-Ionic-Strength<br />
Water<br />
Amount<br />
Added Recovery<br />
(µg/L)<br />
<strong>Chlorite</strong> 10 114% 100 97%<br />
<strong>Bromate</strong>conductivity<br />
1 107% 10 98%<br />
<strong>Bromide</strong> 10 98% 100 105%<br />
<strong>Chlorate</strong> 10 113% 100 99%<br />
<strong>Bromate</strong>-UV 1 124% 10 65%***<br />
<strong>Bromate</strong>-<br />
UV**<br />
1.0 106%<br />
*Data were obtained from multianalyte spikes into Sunnyvale, CA, tap water <strong>and</strong><br />
high-ionic-strength water (HIW) containing 100 mg/L chloride, 100 mg/L carbonate,<br />
100 mg/L sulfate, 10 mg/L nitrate-N, <strong>and</strong> 10 mg/L phosphate-P.<br />
** <strong>Bromate</strong> only (1.0 µg/L) was added to an HIW sample to determine low-level recovery<br />
for this anion using UV detection.<br />
*** <strong>Bromate</strong> recovery was reduced by chlorite interference.<br />
observed for the large chloride peak that elutes immediately<br />
after bromate. Table 3 shows that quantitative<br />
recoveries were obtained for the oxyhalide anions <strong>and</strong> the<br />
bromide spiked into drinking water. In addition, quantitative<br />
recoveries were obtained for the oxyhalide anions <strong>and</strong><br />
bromide spiked into the simulated high-ionic-strength<br />
water (HIW) that contained elevated levels <strong>of</strong> the common<br />
matrix anions: chloride, carbonate, sulfate, nitrate, <strong>and</strong><br />
phosphate. The use <strong>of</strong> PCR with UV/Vis detection allows<br />
the quantification <strong>of</strong> bromate down to 0.5 µg/L in the<br />
presence <strong>of</strong> 100 mg/L chloride (a 200,000-fold excess)<br />
with no sample pretreatment.<br />
Figure 5 shows the chromatograms from a direct injection<br />
<strong>of</strong> bottled water. The top trace (A) was obtained with the<br />
conductivity detector, <strong>and</strong> the bottom trace (B) was<br />
obtained with the UV/Vis absorbance detector. The bottle<br />
label read: “Prepared using filtration, reverse osmosis,<br />
deionization, <strong>and</strong> ozonation”. The DBP precursor<br />
bromide <strong>and</strong> the DBP bromate were both observed in the<br />
bottled water sample.<br />
Figure 6 shows the chromatograms <strong>of</strong> the same bottled<br />
water sample spiked with bromate at 1.0 µg/L, <strong>and</strong> with<br />
chlorite, bromide, <strong>and</strong> chlorate at 10 µg/L. The top trace<br />
(A) was obtained with the conductivity detector, <strong>and</strong> the<br />
bottom trace (B) was obtained with the UV/Vis absorbance<br />
detector after postcolumn reaction with acidified<br />
KI. Quantitative recoveries were obtained for all the<br />
added oxyhalide anions <strong>and</strong> bromide.<br />
Removal <strong>of</strong> <strong>Chlorite</strong> Interference<br />
When chlorine dioxide is used to disinfect drinking water,<br />
the DBP anion chlorite is found in the finished drinking<br />
water. <strong>Chlorite</strong>, like bromate, reacts with acidified KI <strong>and</strong><br />
produces a response at 352 nm. High chlorite levels can<br />
interfere with quantification <strong>of</strong> bromate at low concentra-