Here - Eco-Ideal Consulting Sdn Bhd
Here - Eco-Ideal Consulting Sdn Bhd
Here - Eco-Ideal Consulting Sdn Bhd

Create successful ePaper yourself
Turn your PDF publications into a flip-book with our unique Google optimized e-Paper software.
Sarawak Government/DANCED<br />
Sustainable Urban Development Project, Sarawak<br />
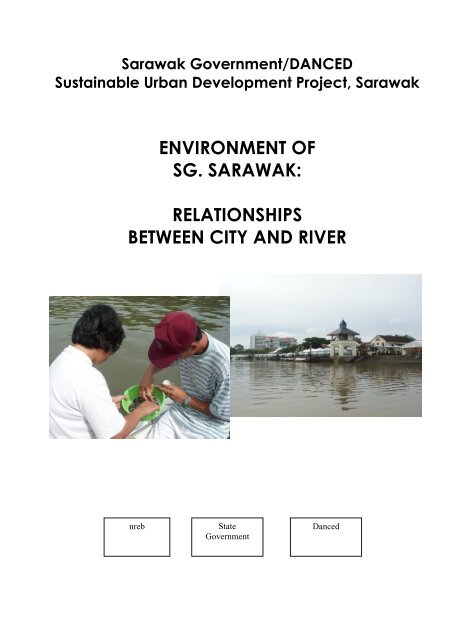
ENVIRONMENT OF<br />
SG. SARAWAK:<br />
RELATIONSHIPS<br />
BETWEEN CITY AND RIVER<br />
nreb State<br />
Government<br />
Danced
ENVIRONMENT OF<br />
SG. SARAWAK:<br />
RELATIONSHIPS<br />
BETWEEN CITY AND RIVER<br />
River Quality Baseline Study, Volume 1:<br />
Main Report.<br />
Existing River Quality,<br />
Pollution Sources & Environmental Management of Sg. Sarawak<br />
COWI Danwaste
Environment of Sg. Sarawak -<br />
Relationships Between City and River<br />
Prepared by Erling Povlsen, COWI A/S<br />
with<br />
Local Consultants<br />
Chemsain Konsultant <strong>Sdn</strong>. <strong>Bhd</strong>.<br />
Daya Rancang<br />
1 st Edition (1 st Print)<br />
September 2001<br />
Copies: 400<br />
The Authors and Danced Copenhagen<br />
Quotations permitted with source credit<br />
Printed by UM Colour Printing Company<br />
Report No. SUD-02-25
ISBN 983-40546-5-3
DANCED SARAWAK GOVERNMENT<br />
Sustainable Urban Development Project<br />
Natural Resources and Environment Board<br />
River Quality Baseline Study<br />
Volume 1<br />
Main Report<br />
Existing River Quality, Pollution<br />
Sources and Environmental<br />
Management of Sg. Sarawak<br />
Final<br />
September 2001<br />
NREB<br />
Natural Resources and<br />
Environment Board<br />
DANCED<br />
Danish Cooperation for<br />
Environment and Development
Report no. SUD-02-25<br />
Issue no. 02<br />
Date of issue 4 September 2001<br />
DANCED SARAWAK GOVERNMENT<br />
Sustainable Urban Development Project<br />
Natural Resources and Environment Board<br />
River Quality Baseline Study Volume<br />
1<br />
Main Report<br />
Existing River Quality, Pollution<br />
Sources and Environmental<br />
Management of Sg. Sarawak<br />
Final<br />
September 2001<br />
Prepared ERP, HBJ, Chemsain, Daya Rancang<br />
Checked ILA<br />
Approved ILA
River Quality Baseline Study. Vol. 1<br />
Table of Contents<br />
1 Summary 4<br />
2 Introduction 13<br />
2.1 Background 13<br />
2.2 River Quality Baseline Study 14<br />
3 Data Compilation 18<br />
3.1 Compilation of Existing Data 18<br />
3.2 Supplementary Field and Desk Studies 19<br />
3.3 Assessment of Collected Data 19<br />
4 Background Conditions 21<br />
4.1 River and Catchment areas 21<br />
4.2 Physical Background Conditions 25<br />
4.3 River <strong>Eco</strong>system 28<br />
4.4 Landuse 32<br />
4.5 River Quality Management in Kuching 39<br />
5 River Quality 43<br />
5.1 Potential Impacts of the Discharge of Wastewater 43<br />
5.2 Surface Water Quality 46<br />
5.3 Sediment Quality 60<br />
5.4 Accumulation of Pollutants in Organisms 76<br />
5.5 <strong>Eco</strong>system Impacts 77<br />
5.6 Floating Debris 81<br />
6 Sources of Pollution and Pollution load 83<br />
6.1 Overview of Pollution Sources 83<br />
6.2 Pollution from Households 84<br />
6.3 Pollution from Food Outlets 91<br />
6.4 Pollution from Industries 95<br />
6.5 Pollution from Agriculture 100<br />
6.6 Other Sources of Pollution 103<br />
6.7 Other Sources of River Quality Deterioration 106<br />
C:\Documents and Settings\user\Desktop\SUD-02-25 - River quality baseline study Vol.1 by Erling\final\River Quality Baseline main report.doc<br />
1
River Quality Baseline Study. Vol. 1<br />
7 Discussion and Conclusion 108<br />
7.1 Degree of Pollution 108<br />
7.2 Sources 108<br />
7.3 Existing Technical Measures to Reduce Pollution Loading 115<br />
7.4 Existing Control and Enforcement Measures 116<br />
7.5 Assessment of Preliminary Indicators 116<br />
8 References 121<br />
Appendix 1. Data on surface Water Quality 1999 and 2000<br />
Appendix 2. An Overview of the State Administration<br />
Appendix 3. A summary of Relevant Activities and Mandates<br />
C:\Documents and Settings\user\Desktop\SUD-02-25 - River quality baseline study Vol.1 by Erling\final\River Quality Baseline main report.doc<br />
2
River Quality Baseline Study. Vol. 1<br />
Abbreviations<br />
Amm-N Ammoniacal Nitrogen<br />
As Arsenic<br />
BOD Biochemical Oxygen Demand<br />
Cd Cadmium<br />
Cl Chlorine<br />
CBD Central Business District<br />
COD Chemical Oxygen Demand<br />
Cr Chromium<br />
Cu Copper<br />
DBKU Dewan Bandaraya Kuching Utara (Kuching North City Hall)<br />
DID Department of Irrigation and Drainage<br />
DO Dissolved Oxygen<br />
DOE Department of Environment<br />
EMS Environmental Management System<br />
EMT Environmental Management Team<br />
EQA Environmental Quality Act<br />
Fe Iron<br />
Hg Mercury<br />
INWQS Interim water quality standard<br />
JKR Jabalan Karja Raya (Department of Public works)<br />
KBM Kuching Barrage Management <strong>Sdn</strong> <strong>Bhd</strong><br />
KWB Kuching Water Board<br />
L & S Land and Survey Department<br />
LSI Large Scale Industries<br />
MBKS Majlis Bandaraya Kuching Selatan (Kuching City South Council)<br />
MID Ministry of Industrial Development<br />
Mn Manganese<br />
MPP Majlis Perbandaran Padawan (Padawan Municipal Council)<br />
NO3-N Nitrate – Nitrogen<br />
NREB Natural Resources and Environment Board<br />
O & G Oil and Grease<br />
PAH Polyaromatic Hydrocarbon<br />
Pb Lead<br />
Sg. Sungai (River)<br />
SHD State Health Department<br />
SMI Small-Medium Industries<br />
SPU State Planning Unit<br />
SRB Sarawak Rivers Board<br />
SUD Sustainable Urban Development<br />
Tot-N Total Nitrogen<br />
Tot-P Total Phosphorous<br />
TPH Total Petroleum Hydrogen<br />
TSS Total Suspended Solids<br />
UNIMAS University of Malaysia Sarawak<br />
Zn Zinc<br />
C:\Documents and Settings\user\Desktop\SUD-02-25 - River quality baseline study Vol.1 by Erling\final\River Quality Baseline main report.doc<br />
3
River Quality Baseline Study. Vol. 1<br />
1 Summary<br />
A baseline study of the river quality of Sg. Sarawak and tributaries has been<br />
carried out in connection with the development of an Environmental Management<br />
System (EMS) for Kuching. The objective of the baseline study is to provide<br />
a description of the river quality and sources of pollution with a view to<br />
make it possible to set realistic goals and indicators for the future river quality<br />
in the EMS.<br />
The report describes:<br />
The background conditions necessary for the interpretation of river quality<br />
data (climate, geology, hydrography, river bed sediments, flora, fauna, river<br />
ecosystems and landuse);<br />
The present river quality in terms of surface water quality, sediment quality<br />
and ecosystem impacts of pollution;<br />
The existing sources of pollution and the load from these; and<br />
The recommendations for revision of preliminary indicators based on results<br />
of the baseline study.<br />
The report will be used as a basis for the specifications of formats for the EMS,<br />
in terms of River Quality. The major findings are summarised below.<br />
THE SG. SARAWAK RIVER SYSTEM<br />
Sg. Sarawak has two principal tributaries namely Sg. Sarawak Kiri and Sg. Sarawak<br />
Kanan, rising in the mountain ranges to the south of Kuching at the border<br />
to Indonesia. The two tributaries meet near Batu Kitang, some 34 km upstream<br />
of Kuching. From Batu Kitang the mainstream Sg. Sarawak meanders<br />
across a wide coastal flood plain and through the city of Kuching. Downstream<br />
of Pending, the industrial area in the eastern part of the city of Kuching, Sg.<br />
Sarawak confluence with Sg. Kuap and further downstream by Loba Batu Belat<br />
at further downstream before discharging to the South China Sea at Muara Tebas.<br />
In Kuching City, several small tributaries discharge to Sg. Sarawak including<br />
Sg. Maong, Sg. Bintangor, Sg. Padungan Sg. Sekama, Sg. Bintawa and Sg.<br />
Biawak.<br />
C:\Documents and Settings\user\Desktop\SUD-02-25 - River quality baseline study Vol.1 by Erling\final\River Quality Baseline main report.doc<br />
4
River Quality Baseline Study. Vol. 1<br />
A total of 21 drainage sub-catchement areas in Kuching are discharging into the<br />
part of Sg. Sarawak, which is flowing through Kuching. The remaining part of<br />
the city, including the Sama Jaya Free Industrial Zone drains to Sg. Kuap.<br />
In 1997, a gated barrage was constructed through the Sejingkat Isthmus and the<br />
river was blocked by causeways at Jalan Keruing and Jalan Bako in order to<br />
regulate the tidal influence on the river.<br />
RIVER QUALITY<br />
The present river quality has been assessed in terms of:<br />
Surface water quality<br />
River Sediment quality<br />
Pollutants in organisms<br />
<strong>Eco</strong>system impacts<br />
General<br />
The baseline study has documented that the tributaries of Sg. Sarawak situated<br />
in Kuching City and the part of Sg. Sarawak, which is flowing through<br />
Kuching, is significantly polluted.<br />
The major issues are serious pollution with faecal derived coliform bacteria,<br />
which is posing a health risk and pollution with organic matters and nutrients,<br />
leading to oxygen deficiency, deleterious impact on bottom fauna and offensive<br />
odours. The main source of the pollution is raw and insufficiently treated sewage<br />
and wastewater, which is discharged to the open drains in the city.<br />
Surface water quality<br />
The water quality of different zones of the entire river system have been classified<br />
according to the Malaysian Interim National Water Quality Standards<br />
(INWQS). A summary of the results of the classification is presented in Table<br />
1.1.<br />
The water quality in the tributaries Sg. Maong, Sg. Bintangor, Sg. Padungan<br />
Sg. Sekama and Sg. Tabuan in the city is very poor and falls between the class<br />
IV and class V of the INWQS. Very high concentrations of BOD and ammoniacal<br />
nitrogen and very poor oxygen conditions are encountered. The concentrations<br />
of oxygen are in fact so low that only very few organisms, if any can<br />
survive in the water (i.e. concentrations consistently below 2 mg/l). The content<br />
of faecal derived bacteria is extremely high and the water poses a health risk.<br />
C:\Documents and Settings\user\Desktop\SUD-02-25 - River quality baseline study Vol.1 by Erling\final\River Quality Baseline main report.doc<br />
5
River Quality Baseline Study. Vol. 1<br />
Table 1.1 Summary of INWQS classification of the different zones of the Sg.<br />
Sarawak system.<br />
Zone INWQS<br />
Physical-chemical<br />
parameters<br />
Zone A (Sg. Sarawak Kanan) IIA/IIB<br />
Zone B (Sg. Sarawak Kiri) IIA/IIB<br />
Zone C (Sg. Sarawak Proper from Batu<br />
Kawa to upstream Satok bridge)<br />
Zone D (Sg. Sarawak Proper from Satok<br />
Bridge to downstream of barrage)<br />
C:\Documents and Settings\user\Desktop\SUD-02-25 - River quality baseline study Vol.1 by Erling\final\River Quality Baseline main report.doc<br />
INWQS<br />
Bacteriological parameters<br />
IIA/IIB III<br />
III V<br />
Zone E (Sg. Maong) IV/V V<br />
Zone F (Sg. Bintangor) IV/V V<br />
Zone G (Sg. Padungan) IV/V V<br />
Zone H (Sg. Sekama) IV/V V<br />
Zone I (Sg. Tabuan) IV/V V<br />
The water quality in the stretch of the Sg. Sarawak Proper, which is running<br />
through Kuching, is better than in the tributaries but relatively low concentrations<br />
of oxygen and somewhat elevated concentrations of NH4-N are encountered.<br />
The water can be classified as Class III in terms of physico-chemical parameters.<br />
However, in terms of bacteriological parameters, the water is only<br />
Class V.<br />
The water quality in Sg. Sarawak upstream of Kuching, including Sg. Sarawak<br />
Kiri and Kanan is quite good and generally complies with class IIA/IIB in<br />
terms of physico-chemical parameters. However, the water does not meet the<br />
class IIB standards for faecal derived bacteria.<br />
There is no or very little odour in the water of Sg. Sarawak Proper. In contrast,<br />
the water in the tributaries such as Sg. Bintangor and Sg. Sekama as well as<br />
some drains is quite smelly.<br />
The levels of heavy metals in water are generally very low and below the detection<br />
limits even in the very polluted tributaries.<br />
The concentrations of iron and manganese are generally high and violating the<br />
INWQS standards. The high iron and manganese concentrations are not primarily<br />
due to human activities. The presence of high concentrations of iron and<br />
manganese in surface water are common in tropical natural waters, especially in<br />
swampy areas. <strong>Here</strong>, the anaerobic conditions in soils induce the mobilisation<br />
of insoluble iron compounds to soluble iron due to chemical reduction processes.<br />
Manganese reacts the same way as iron.<br />
The concentrations of agrochemical and pesticides are generally below detection<br />
limits in surface water samples.<br />
6
River Quality Baseline Study. Vol. 1<br />
Sediment Quality<br />
Organic matter and heavy metals from outlets in Kuching are clearly accumulated<br />
in the sediments of Sg. Sarawak. This results in elevated loss on ignition<br />
and elevated concentrations of Tot N, Tot P, NH4-N, Pb, Cu, Ni, Cd, Cr, As and<br />
Zn along the stretch of the river from downstream of the confluence of Sg.<br />
Maong and Sg. Sarawak to the area off Kuching Port Authority.<br />
The concentrations of pollutant decrease further downstream around Pending;<br />
probably due to the flushing procedure at the barrage. If the flushing were not<br />
carried out it is expected that elevated concentrations of pollutants would also<br />
be encountered in this area.<br />
The concentrations of heavy metals, except Hg, are well below potentially toxic<br />
levels. Hg is found in concentrations, which is potentially toxic to sensitive organisms<br />
according to recently developed Canadian Sediment Quality Criteria.<br />
The major source of Hg is not from the city as potentially toxic levels are already<br />
encountered at the upstream of Kuching. The possible source may be<br />
from previous mining activities between Bau and Buso.<br />
Metals originated from the previous gold mining activities and perhaps quarry<br />
operations in the area between Bau and Buso have resulted in elevated concentrations<br />
of heavy metals significantly in the sediments of Sg. Sarawak Kanan.<br />
Very high and toxic concentrations of As and Hg have been encountered. Quite<br />
high concentrations of Cd, Cr and Pb have also been found.<br />
The concentrations of heavy metals in Sg. Maong are higher than those found<br />
in Sg. Sarawak and potentially toxic levels of Cd, Pb and Zn are encountered.<br />
Heavy metals from the Sama Jaya Free industrial Zone are accumulated in the<br />
sediments of Sg. Kuap. The concentrations of heavy metals (Cu, Pb, Ni, Cr, Cd<br />
and Zn) increase markedly from upstream of the industrial estate to the areas<br />
off and downstream of the estate. Although heavy metals are accumulated in<br />
the sediments, the concentrations are below levels, which are likely toxic to<br />
aquatic organisms.<br />
Pesticides and Polyaromatic Hydrocarbons (PAH) are not found in the sediments<br />
at the studied sites in Sg. Sarawak and Sg. Kuap. Elevated concentrations<br />
of total hydrocarbons were encountered at Satok Bridge and off Sg. Bintawa.<br />
Pollutants in organisms<br />
Freshwater molluscs living in the contaminated sediments between Buso and<br />
Bau have accumulated Cu and Zn to levels, which could pose a risk to consumers.<br />
The levels of As are also considerably high. There are no data from the part<br />
of the river running through Kuching.<br />
<strong>Eco</strong>system impacts<br />
The high load of organic matter from Kuching clearly affects the benthic fauna<br />
in Sg. Sarawak.<br />
C:\Documents and Settings\user\Desktop\SUD-02-25 - River quality baseline study Vol.1 by Erling\final\River Quality Baseline main report.doc<br />
7
River Quality Baseline Study. Vol. 1<br />
At some sites, the organic load is apparently so high and the supply of oxygen<br />
from exchange of oxygen rich water so low that poor oxygen conditions in<br />
sediments results in the decrease in density (abundance) and number of species.<br />
This seems to be the case downstream of the confluence to Sg. Maong and at<br />
the Satok Bridge.<br />
Off Sg. Bintagor and off Kuching Port Authority high organic loads apparently<br />
results in a significantly increased abundance and number of species, the reason<br />
probably because of the organic matter constitute an increased amount of food<br />
without being so high as to cause oxygen depletion.<br />
SOURCES OF POLLUTION AND POLLUTION LOAD<br />
The poor water quality in the tributaries and the part of Sg. Sarawak traversing<br />
through Kuching is clearly due to the discharge of untreated sewage from the<br />
drains in the city.<br />
Estimation of pollution loads to Sg. Sarawak from households, food outlets and<br />
industries has been carried out in order to identify the source of the most severe<br />
pollution of Sg. Sarawak in Kuching City. The estimations include loads from<br />
the sub-catchment areas discharging to Sg. Sarawak from (and including) Sg.<br />
Maong to the causeway east of Pending. The areas discharging to Sg. Tabuan<br />
and Sg. Kuap are not included in the estimates.<br />
In general, untreated sewage from households is identified as the most significant<br />
source of pollution as a whole. The loads of BOD, COD, TSS, Tot-N, Tot-<br />
P and oil and grease from households are orders of magnitude larger than the<br />
loads from food outlets (markets, food centres, restaurants etc.), industries and<br />
other sources (Table 1.2).<br />
However, food outlets (restaurants, markets etc.) are the significant local source<br />
of pollution in the Central Business Centre immediately south of Sg. Sarawak.<br />
In sub-catchment areas Bintangor 2, Bintangor 3, Padungan, Periok and Biawak,<br />
20-40% of the BOD load and as much as 71-83% of the load of oil &<br />
grease are discharged from food outlets. In Sekama and Bintawa, 83 and 71%<br />
of the oil and grease is from food outlets. Presently, the Local Councils actually<br />
spend huge resources in cleaning the oil and grease in the drains downstream<br />
due to the inadequate treatment facilities.<br />
The most significant load of organic pollution is at the Maong sub-catchment<br />
area, followed by Padungan, Bintawa1 and Seman Lama. The highest loads of<br />
heavy metals are encountered in the Pending area (Sekama 1, Periok, Biawak,<br />
Bintawa, Bintawa 1), Padungan and Maong.<br />
The total load of BOD from the Sg. Kuap catchment (not included in the estimates<br />
above) has been roughly estimated at 3,000-4,500 kg/day, which is the<br />
same magnitude as the discharge from the Sg. Maong catchment.<br />
Pig farm located at the upstream of Kuching is also one of the significant<br />
sources of pollution to Sg. Sarawak.<br />
C:\Documents and Settings\user\Desktop\SUD-02-25 - River quality baseline study Vol.1 by Erling\final\River Quality Baseline main report.doc<br />
8
River Quality Baseline Study. Vol. 1<br />
Table 1.2 Estimated loads of pollutants to Sg. Sarawak and tributaries from<br />
different types of sources in Kuching. (Rounded figures).<br />
Households Food outlets<br />
(Markets, Food<br />
centres, Restau-<br />
rants etc)<br />
C:\Documents and Settings\user\Desktop\SUD-02-25 - River quality baseline study Vol.1 by Erling\final\River Quality Baseline main report.doc<br />
Industries Other<br />
BOD kg/day 5900-9700 650 15 50<br />
COD kg/day 19900-26000 800 40 90<br />
TSS kg/day 5400-8000 260 60 40<br />
Tot-N kg/day 2600-3400 30 5 2<br />
Tot-P kg/day 500-600 10 3 2<br />
Oil & grease kg/day 200-350 60 2 2<br />
Pb kg/day - - 0.02 -<br />
Cd kg/day - - 0.002 -<br />
Cu kg/day - - 0.01 -<br />
Zn kg/day - - 0.7 -<br />
Fe kg/day - - 0.9 -<br />
Mn kg/day - - 0.07 -<br />
Al kg/day - - 0.9 -<br />
AOX kg/day - - 0.009 -<br />
STATE OF TECHNICAL MEASURES TO REDUCE POLLUTION<br />
The City of Kuching does not have a functional wastewater treatment system.<br />
Almost all houses in Kuching discharge untreated greywater directly to the<br />
stormwater drains in the city, which later drain into the tributaries (Sg. Maong,<br />
Sg. Bintangor, Sg. Padungan etc.) or directly to Sg. Sarawak. Consequently, the<br />
sewage from the houses does not comply with the standards, which are stipulated<br />
in the Environmental Quality (Sewage and Industrial Effluents) Regulations,<br />
1979.<br />
The houses are equipped with individual septic tanks, which receive the blackwater.<br />
Septic tanks are generally not very efficient. Only about 30 % of the organic<br />
matter and no nutrients are removed prior to discharge, even with the<br />
most efficient type of septic tanks. In addition, the septic tanks in Kuching are<br />
generally not functioning due to improper desludging. As a consequence,<br />
blackwater is discharged almost untreated to the drainage system. Untreated<br />
blackwater is undoubtedly the main source contributing to the extremely high<br />
levels of faecal coliforms in the tributaries and Sg. Sarawak Proper.<br />
The food outlets also generally discharge untreated wastewater directly to the<br />
drains although thereare some inefficient treatment facilities exist. At present,<br />
information on the number of food outlets with treatment facilities is not available.<br />
In general, the sewage from food outlets does not comply with the regulations<br />
of 1979.<br />
9
River Quality Baseline Study. Vol. 1<br />
Many industries have their own wastewater treatment system. However, there<br />
are a few industries with or without inadequate systems. Presently, data on the<br />
number of industries with or without a proper wastewater treatment system are<br />
not available.<br />
In the SUD field study, it was observed that the industries equipped with proper<br />
treatment facilities complied with the regulations, whereas those without facilities<br />
or with inadequate facilities did not.<br />
The findings of this study clearly indicate that the water quality of the Sg. Sarawak<br />
and its tributaries could be improved by establishing efficient sewage<br />
treatment of sewage for households.<br />
The study has also shown that introduction of regular desludging of septic tank<br />
will not improve the water quality significantly. Estimates has indicated that<br />
even if all septic tanks in Kuching were desludged regularly and functioning<br />
properly, the effect in terms of reducing the load to the tributaries and The<br />
River still be insignificant. The discharge of BOD from blackwater will still be<br />
high and the discharge of nitrogen and phosphorous are not reduced at all.<br />
Introduction of proper treatment facilities at food outlets in the Central Business<br />
Centre at the south of Sg. Sarawak will also significantly improve the water<br />
quality locally.<br />
STATE OF CONTROL AND ENFORCEMENT MEASURES<br />
The enforcement measures are generally passive, i.e. only in case of complaints,<br />
authorities carry out inspections and may impose a fine to the offender.<br />
There is currently no specific active enforcement measure carried out by the<br />
authorities to control the sewage discharge from households and/or food outlets.<br />
Other than cleanliness campaigns and awareness programmes, no direct<br />
inspection or regular checks on the discharge has been made.<br />
The Department of Environment (DOE) is monitoring the wastewater from a<br />
small fraction of the industries in Kuching for compliance to the Environmental<br />
Quality Act, 1974 (EQA). The monitored industries include: industries discharging<br />
more than 60 m 3 wastewater per day or where the total load of BOD<br />
in effluents exceed 6 kg per day, industries involved in the processing of oil<br />
palm fruit and raw rubber.<br />
NREB is regulating the outlets from pig farms and other livestock.<br />
EFFECT OF THE BARRAGE<br />
Kuching Barrage Management is currently operating a flushing scheme to mitigate<br />
environmental impacts of the barrage. Potential impacts, which are mitigated<br />
by the flushing scheme, include:<br />
Reduction of saltwater intrusion and river flow velocity;<br />
C:\Documents and Settings\user\Desktop\SUD-02-25 - River quality baseline study Vol.1 by Erling\final\River Quality Baseline main report.doc<br />
10
River Quality Baseline Study. Vol. 1<br />
Increase of sedimentation of suspended matter due to reduction of flow velocities;<br />
Increased risk of oxygen depletion and accumulation of organic material,<br />
nutrients and bacteria upstream of the barrage;<br />
Risk of impacts on mangroves and nipah forests due to the decreased salinity;<br />
Risk of reduction of the stock of the giant freshwater prawn which is an<br />
important commercial species, due to blocking of migration routes to and<br />
from spawning and nursery grounds downstream of the barrage; and<br />
Reduction of the population and catch of marine and brackish-water species<br />
fish in the river due to reduced salinity.<br />
Should the flushing scheme for some reason be inadequate in the future, there<br />
is a risk that measures to improve the water quality may be affected by the<br />
presence of the barrage. The interpretations of state indicators in the EMS<br />
should therefore always be related to the operation of the barrage.<br />
RECOMMENTATIONS IN TERMS OF EMS<br />
The baseline study has indicated that:<br />
Some of the selected preliminary indicators are not suitable as indicators;<br />
Some of the preliminary indicators should be modified; and<br />
Some new indicators should be added.<br />
An overview of the proposed modifications of the preliminary state indicators<br />
is presented in Table 1.3. Arguments for the proposals are discussed in section<br />
7.5.<br />
It is proposed that all preliminary load indicators be used in the EMS. In addition<br />
it is proposed, that estimates of loads from households, food outlets and<br />
industries be used, applying the methods used in the baseline study.<br />
C:\Documents and Settings\user\Desktop\SUD-02-25 - River quality baseline study Vol.1 by Erling\final\River Quality Baseline main report.doc<br />
11
River Quality Baseline Study. Vol. 1<br />
Table 1.3 Overview of modifications of preliminary state indicators for the<br />
EMS for river quality.<br />
Surface water<br />
quality<br />
Sediment<br />
quality<br />
Pollutants in<br />
aquatic organ-<br />
isms<br />
<strong>Eco</strong>logical<br />
(biological)<br />
parameters<br />
Preiminary indicators<br />
proposed to be included<br />
in EMS<br />
DO, pH, BOD, COD,<br />
TSS, Ammoniacal ni-<br />
trogen (NH 4-N), Nitrate<br />
(NO 3), Phosphate (P),<br />
Faecal coliforms, Total<br />
coliforms.<br />
Nutrients (NH 4-N, NO 3),<br />
Heavy metals (Hg, Pb,<br />
As, Zn, Cd, Cr, Cu, Ni, )<br />
PAH, Total petroleum<br />
hydrocarbons<br />
Heavy metals (Hg, Pb,<br />
As, Zn, Cd, Cr, Cu, Ni)<br />
Polyaromatic Hydrocar-<br />
bons, PAH, Total petro-<br />
leum hydrocarbons<br />
(TPH) in transplanted<br />
mollucs<br />
Diversity of benthic<br />
macroinvertebrates<br />
(Shannon Wiener).<br />
Cpu (catch per unit effort<br />
of giant prawn (Macro-<br />
brachium rosenbergii)<br />
and the fish species Mys-<br />
tus spp. and Oxyeleotris<br />
marmorata<br />
Aesthetics Volume of floatables<br />
collected from Sarawak<br />
River.<br />
Threshold odour number<br />
New indicators proposed<br />
to be added<br />
Loss on ignition<br />
Total N<br />
Total P<br />
Number of species,<br />
abundance (no individu-<br />
als/m²) and species com-<br />
position of benthic inver-<br />
tebrates<br />
Catch per unit effort of<br />
all fish and prawn spe-<br />
cies in a catch<br />
Number of complaints of<br />
smell in river, drains and<br />
tributaries<br />
C:\Documents and Settings\user\Desktop\SUD-02-25 - River quality baseline study Vol.1 by Erling\final\River Quality Baseline main report.doc<br />
Preliminary indicators<br />
proposed to be excluded<br />
from the EMS<br />
Heavy metals (Hg, Pb,<br />
As, Zn, Cd, Cr, Cu, Ni,<br />
Fe, Mn)<br />
PAH, Total petroleum<br />
hydrocarbons<br />
Fe, Ni<br />
Invertebrates of zz<br />
family<br />
12
River Quality Baseline Study. Vol. 1<br />
2 Introduction<br />
2.1 Background<br />
In June 1999, the State Government of Sarawak initiated the Sustainable Urban<br />
Development Project in collaboration with the Danish Cooperation on Environment<br />
and Development (DANCED).<br />
The purpose of the project is to develop and implement an Environmental<br />
Management System (EMS) for the City of Kuching within two areas of concerns;<br />
namely river water quality and waste management.<br />
The project has elaborated a generic model for a coherent EMS, which will<br />
form the basis for developing a concrete EMS, adapted to the local Kuching<br />
context.<br />
An important part of the SUD Project is the elaboration of a baseline study on<br />
river quality and river quality management of Sg. Sarawak and its tributaries.<br />
The baseline study is carried out as a first step in the implementation of the<br />
concrete Environmental Management System for the River Quality for the<br />
Kuching City. The objective of the baseline study is to be able to set realistic<br />
goals and indicators for the future river quality.<br />
The Environmental Management Team (EMT) of the SUD Project has carried<br />
out a process of selecting preliminary goals, targets and indicators for the selected<br />
areas of concern. The EMT consists of representatives for the core agencies<br />
dealing with aspects of Environmental Management for Kuching. The selected<br />
goals, targets and indicators have been reported in the SUD report “Preliminary<br />
Goals, Targets and Indicators for sustainable Urban Development in<br />
Kuching, Sarawak”(SUD-02-03/SUD-021-07).<br />
The preliminary indicators have constituted the starting point for elaborating<br />
the baseline study.<br />
A survey of existing and lacking data related to the selected indicators has been<br />
carried out to facilitate the elaboration of the baseline study. The results of the<br />
survey have been reported in the SUD report “Survey of Existing and Lacking<br />
Data on the SUD Project Indicators” (SUD-02-05).<br />
C:\Documents and Settings\user\Desktop\SUD-02-25 - River quality baseline study Vol.1 by Erling\final\River Quality Baseline main report.doc<br />
13
River Quality Baseline Study. Vol. 1<br />
Based on this report, a data collection report was elaborated, specifying the<br />
compilation of extisting data and supplementary field studies in and elaboration<br />
of existing data (SUD report. River Quality Baseline Study. Data Collection<br />
(SUD-02-10)).<br />
A pilot study has been carried out for one of the Sg. Sarawak tributary Sg. Bintangor<br />
catchment area. The study aimed at gaining experience in getting and<br />
accessing relevant data from field studies and public files (SUD-02-09).<br />
2.2 River Quality Baseline Study<br />
The baseline study focuses on the selected preliminary indicators and the necessary<br />
background data (physical-, ecological- and social data etc.) to identify<br />
relations between sources and levels of deterioration of the environment. The<br />
indicators include:<br />
State indicators (water quality, quality of sediments, concentration of pollutants<br />
in aquatic organisms and ecosystem parameters);<br />
Load indicators (discharge from point and non-point sources); and<br />
Effort indicators (measures taken by the authorities to affect the constrains<br />
to the environment (e.g. inspection, enforcement) and the outcomes of the<br />
measures (performance)).<br />
The preliminary indicators are presented in Table 2.1.<br />
Table 2.1 Preliminary indicators for river quality (from “Preliminary goals,<br />
targets and indicators for sustainable urban development in Kuching, Sarawak<br />
(SUD report No SUD-02-03, SUD-02-07).<br />
Parameters<br />
State indicators Water quality pH, Dissolved oxygen, Biological oxygen<br />
demand (BOD), Chemical oxygen<br />
demand (COD), Total Suspended Solids<br />
(TSS), Ammoniacal nitrogen (NH4-<br />
N), Nitrates, Phosphorous, Oil and<br />
grease, Hg, Pb, As, Zn, Cd, Cr, Cu, Fe,<br />
Ni, Cyanide, Mn, Polyaromatic Hydrocarbons<br />
(PAH), Total Petroleum Hydrocarbon<br />
(TPH),Faecal and total coliforms<br />
Sediment pH, Ammoniacal nitrogen (NH4-N),<br />
Nitrates, Phosphorous, Oil and grease,<br />
Hg, Pb, As, Zn, Cd, Cr, Cu, Fe, Ni,<br />
Cyanide, Mn, Polyaromatic Hydrocarbons<br />
(PAH), Total Petroleum Hydrocarbon<br />
(TPH), Pesticides.<br />
C:\Documents and Settings\user\Desktop\SUD-02-25 - River quality baseline study Vol.1 by Erling\final\River Quality Baseline main report.doc<br />
14
River Quality Baseline Study. Vol. 1<br />
Table 2.1 (continued)<br />
State indicators Pollutants in aquatic<br />
Parameters<br />
Concentration of contaminant XX and<br />
organisms<br />
YY in aquatic organisms (mussels)<br />
<strong>Eco</strong>logical parameters 1) Diversity index<br />
2) Species of fish of yy family<br />
3) Species of invertebrates of zz family.<br />
Aesthetics 1) Level of smell by using standard<br />
method.<br />
2) Estimated weight of floatables collected<br />
from Sarawak River<br />
Load/effort indicators<br />
Households 1) Number of households<br />
with/without septic tanks or other<br />
treatment facilities treating sewage<br />
to standard X (Equivalent or better<br />
than standard B)<br />
2) Type of septic tanks or treatment<br />
facility (efficiency)<br />
3) The concentration of pH, TSS,<br />
Ammoniacal nitrogen, phosphorous,<br />
BOD,COD and E. Coli in<br />
treated effluent from households<br />
not exceeding xx based on laboratory<br />
analyses<br />
Agriculture 1) Total number of pig farms<br />
2) No of large pig farms with efficient<br />
waste treatment system<br />
3) Volume of discharge and SPP at<br />
large piggeries. The discharge of<br />
pH, TSS, Ammoniacal Nitrogen,<br />
Phosphorous, BOD and COD in<br />
discharge<br />
4) Yearly survey of agricultural plantations<br />
on the use of agrochemical<br />
xx<br />
5) Concentration of agrochemical xx<br />
in mainstreams draining plantations<br />
(upstream and downstream)<br />
6) Yearly inspection of extent of<br />
buffer zones around plantations<br />
C:\Documents and Settings\user\Desktop\SUD-02-25 - River quality baseline study Vol.1 by Erling\final\River Quality Baseline main report.doc<br />
15
River Quality Baseline Study. Vol. 1<br />
Table 2.1 (continued)<br />
Load/effort indicators<br />
Parameters<br />
Food outlets 1) Total number of food outlets<br />
2) Number of food outlets having<br />
efficient waste treatment facilities<br />
treating wastewater to level X<br />
(yearly inspection)<br />
3) Concentration of oil and grease and<br />
total suspended solids in wastewater<br />
based on laboratory analysis.<br />
Large Scale industries<br />
(LSI) and Small Medium<br />
Industries (SMI)<br />
C:\Documents and Settings\user\Desktop\SUD-02-25 - River quality baseline study Vol.1 by Erling\final\River Quality Baseline main report.doc<br />
1) Number of LSI and SMIs having<br />
efficient wastewater treatment system<br />
based on yearly inspection<br />
2) Concentration of xx and yy in<br />
treated effluent based on laboratory<br />
analysis<br />
River Vessels 1) Load of paint residue discharged to<br />
Sg. Sarawak by inspection of ship<br />
repair<br />
2) Concentration of organo-tin in<br />
mussels<br />
3) Number of oil spill incidents recorded<br />
The River Quality Baseline study is reported in three volumes:<br />
Volume 1: River Quality Baseline Study. Main Report. Existing River<br />
Quality, Pollution Sources and Environmental Management of Sg. Sarawak;<br />
Volume 2: River Quality Baseline Study. Mapping of Pollution Sources and<br />
Estimation of Pollution Load to Sg. Sarawak; and<br />
Volume 3: River Quality Baseline Study. Field Studies of Sediment Contamination<br />
and Benthic Invertebrate Fauna in Sg. Sarawak.<br />
Volume 1 of the river quality baseline study report is structured as follows:<br />
Section 3 briefly outlines the data collection;<br />
Section 4 provides general background information, which is relevant for<br />
the interpretation of the selected indicators for river quality. The section describes<br />
the physical background conditions (i.e. river catchment characteristics,<br />
climate, geology, hydrography and riverbed sediments). The river ecosystem<br />
in terms of vegetation, benthic invertebrate fauna and fish fauna is<br />
also described. Landuse in the catchment area for Sg. Sarawak and tributaries<br />
is described as well. The relevant institutions and the legal measures to<br />
administer the river quality are also briefly outlined;<br />
16
River Quality Baseline Study. Vol. 1<br />
Section 5 describes the present river quality in terms of surface water quality,<br />
sediment quality, aesthetics and concentrations of pollutants in organisms<br />
as well as ecosystem impacts. The description is focused on the selected<br />
preliminary indicators for river quality;<br />
Section 6 outlines the sources of pollution and provides estimates of pollution<br />
loads from different sources in the sub-catchment areas for Sg. Sarawak,<br />
which are situated in Kuching City. Control and enforcement measures<br />
taken by the authorities to mitigate impacts on the environment are described<br />
as well. Other sources deteriorate river quality, including the effect<br />
of the downstream barrage of Kuching are also outlined.<br />
Section 7 is the discussion and conclusion section. The section provides:<br />
1. Characterisations of the degree of pollution of Sg. Sarawak;<br />
2. Identification of major sources of river pollution and the relative contribution<br />
to pollution of different sources;<br />
3. Assessment of the existing technical measures to reduce pollution load;<br />
4. Evaluation of the existing control and enforcement measures to manage<br />
river quality; and<br />
5. Assessment of the relevance of preliminary indicators and recommendations<br />
for indicators to be included in the EMS.<br />
C:\Documents and Settings\user\Desktop\SUD-02-25 - River quality baseline study Vol.1 by Erling\final\River Quality Baseline main report.doc<br />
17
River Quality Baseline Study. Vol. 1<br />
3 Data Compilation<br />
The baseline study is based on the existing data provided by agencies and local<br />
authorities, and supplementary field and desk studies.<br />
3.1 Compilation of Existing Data<br />
Existing data were compiled and provided by the following aencies and Local<br />
Councils:<br />
National Resources and Environmental Board (NREB);<br />
Department of Irrigation and Drainage (DID);<br />
Department of environment (DOE);<br />
Kuching North City Hall (DBKU);<br />
Kuching City South Council (MBKS);<br />
Padawan Municipal Council (MPP);<br />
Land and Survey Department (L&S);<br />
State Health Department (SHD);<br />
Sarawak River Board (SRB);<br />
Department of Public Works (JKR);<br />
Kuching Barrage Management <strong>Sdn</strong> <strong>Bhd</strong> (KMB);<br />
Kuching Water Board (KWB);<br />
State Planning Unit (SPU);<br />
Ministry of Industrial Development (MID); and<br />
University of Malaysia Sarawak (UNIMAS).<br />
C:\Documents and Settings\user\Desktop\SUD-02-25 - River quality baseline study Vol.1 by Erling\final\River Quality Baseline main report.doc<br />
18
River Quality Baseline Study. Vol. 1<br />
Details of the compilation are elaborated in the SUD report of “River Quality<br />
Baseline Study - Data Collection.” (SUD-02-10) A list of the compiled data is<br />
presented in section 8.<br />
3.2 Supplementary Field and Desk Studies<br />
During the initial preparation of the baseline study, the following types of data<br />
were identified as lacking and imperative for the baseline study:<br />
Point Source/Pollution load inventory;<br />
Biological/<strong>Eco</strong>system indicators; and<br />
Sediment data.<br />
The following field and desk studies were therefore conducted:<br />
Mapping and enumeration of different pollution sources, measurements of<br />
discharge of pollutants from households, food outlets (markets, restaurants<br />
etc.) and industries for the estimation of pollution loads from different<br />
sources;<br />
Field investigations of sediment contamination; and<br />
Field study of benthic fauna.<br />
Details on the methods applied for the estimation of pollution loads is presented<br />
in the Volume 2 of the River Quality Study. The methods applied for the sediment<br />
and benthos studies are outlined in the Volume 3.<br />
3.3 Assessment of Collected Data<br />
The compiled data and the supplementary field studies generally provide an<br />
adequate basis for the elaboration of the baseline study. However, additional<br />
data on enforcement measures and other effort indicators needs to be compiled<br />
to allow proper assessment. In addition, there are some data, which were identified<br />
as relevant but not collected due to various constraints such as:<br />
Technical constraints, which include:<br />
- Lack of standardising of data<br />
- Lack of standardised data registration forms<br />
- Technical procedures<br />
- Lack of computerising of files<br />
Institutional constraints, which include:<br />
C:\Documents and Settings\user\Desktop\SUD-02-25 - River quality baseline study Vol.1 by Erling\final\River Quality Baseline main report.doc<br />
19
River Quality Baseline Study. Vol. 1<br />
- Classified data<br />
- Possessiveness to data<br />
- Competencies and capacities<br />
In the next phase of the SUD Project measures for overcoming some of these<br />
constraints will be prepared and specified, mainly standardising, registration<br />
forms, administrative procedures and computerising of files.<br />
C:\Documents and Settings\user\Desktop\SUD-02-25 - River quality baseline study Vol.1 by Erling\final\River Quality Baseline main report.doc<br />
20
River Quality Baseline Study. Vol. 1<br />
4 Background Conditions<br />
4.1 River and Catchment areas<br />
Sg. Sarawak has two principal tributaries: Sg. Sarawak Kiri and Sg. Sarawak<br />
Kanan, rising in the mountain ranges to the south of Kuching at the border of<br />
Indonesia. The two tributaries meet near Batu Kitang, some 34 km upstream of<br />
Kuching. From Batu Kitang, the mainstream Sg. Sarawak meanders across a<br />
wide coastal flood plain and traverse Kuching. Downstream of Pending, the<br />
industrial area in the eastern part of Kuching, Sg. Sarawak confluence with Sg.<br />
Kuap and further downstream by Loba Batu Belat before discharging to the<br />
South China Sea at Muara Tebas (Fig. 4.1).<br />
In Kuching City, several small tributaries‟ discharges to Sg. Sarawak include<br />
Sg. Maong, Sg. Bintangor, Sg. Padungan Sg. Sekama, Sg. Bintawa and Sg.<br />
Biawak. Fig 4.2 shows the location of the tributaries in Kuching.<br />
A total of 21 drainage sub-catchment areas in Kuching are discharging to Sg.<br />
Sarawak on the stretch of the river from Sg. Maong to the Biawak causeway,<br />
east of Pending. The locations of these sub-catchment areas are indicated on<br />
Fig 4.3.<br />
The remaining part of the city, including the Sama Jaya Free Industrial Zone<br />
drains into Sg. Kuap, mainly via Sg. Tabuan.<br />
In 1997 a gated barrage was constructed through the Sejingkat Isthmus (Fig.<br />
4.2) and the river was blocked by causeways at Jalan Keruing and Jalan Bako<br />
in order to regulate the tidal influence on the river.<br />
C:\Documents and Settings\user\Desktop\SUD-02-25 - River quality baseline study Vol.1 by Erling\final\River Quality Baseline main report.doc<br />
21
River Quality Baseline Study. Vol. 1<br />
Figure 4.1. Sg. Sarawak and its main tributaries.<br />
C:\Documents and Settings\user\Desktop\SUD-02-25 - River quality baseline study Vol.1 by Erling\final\River Quality Baseline main report.doc<br />
22
River Quality Baseline Study. Vol. 1<br />
Figure 4.2. Tributaries of Sg. Sarawak in the Kuching City.<br />
C:\Documents and Settings\user\Desktop\SUD-02-25 - River quality baseline study Vol.1 by Erling\final\River Quality Baseline main report.doc<br />
23
River Quality Baseline Study. Vol. 1<br />
Figure 4.3. Sub-catchment areas for tributaries and drains in Kuching discharging to Sg. Sarawak along the stretch from (and including) Sg.<br />
Maong to the causeway east of Pending.<br />
C:\Documents and Settings\user\Desktop\SUD-02-25 - River quality baseline study Vol.1 by Erling\final\River Quality Baseline main report.doc<br />
24
River Quality Baseline Study. Vol. 1<br />
4.2 Physical Background Conditions<br />
4.2.1 Climate<br />
The climate in the catchment area of Sg. Sarawak is governed by the movement<br />
of the Inter-Tropical Convergence Zone and the associated movement of the<br />
warm air with the monsoons.<br />
The catchment area has high rainfall. The annual rainfall for Kuching varies<br />
between 3,000 and 5,000 mm. The wettest season is during the Northeast monsoon<br />
from November to March, with a peak rainfall in December to January<br />
typically higher than 400 mm per month.<br />
The minimum rainfall occurs in June and July. From April to July the mean<br />
monthly rainfall is in the range of 200 to 300 mm. The mean relative humidity<br />
is 85% with a maximum peak observed in December – March and a minimum<br />
peak occurring during the period of lowest rainfall in June – July.<br />
The temperature in the area ranges from about 22 0 C to 34 0 C. The warmest period<br />
is April to June and the lowest temperatures are encountered during the<br />
months from December to February (Meteorological Services Department<br />
Kuching, 2000).<br />
4.2.2 Geology<br />
The Sg. Sarawak river basin is geologically made up of rocks of Palaeozoic and<br />
Early Mesozoic ages (Annual Report Geological Survey of Malaysia, 1980).<br />
The oldest rocks are considered to be the pre-Upper Carboniferous schist and<br />
phyllite. Intrusive granite rocks are also common. The Sg. Sarawak delta deposition<br />
north of Kuching in a marine trough occurred throughout Jurassic giving<br />
rise to a sequence of predominantly argillaceous rocks with subordinate arenaceous<br />
rocks, chert, conglomerate and boulder slate and few lenses of conglomerate<br />
and limestone.<br />
Sedimentary rocks of Sg. Sarawak Kiri are mainly acid igneous and metamorphic.<br />
Limestone, shale and mudstone with thin beds of siltstone and fin-grained<br />
sandstone are common rock types of Sg. Sarawak Kanan (DID, 1988).<br />
The soils of Sg. Sarawak Kiri and Sg. Sarawak Kanan are mainly composed of<br />
recent alluvial and red yellow podzolic soils. Along the river valley, there are<br />
recent alluvial soils with generally shallow to deep, yellow to red loamy sands<br />
to clays on sedimentary, acid igneous and metamorphic rocks. To the north of<br />
the Sg. Sarawak Kanan catchment, patches of hard limestone can be found,<br />
while grey white podzolic soils are prominent in the south.<br />
C:\Documents and Settings\user\Desktop\SUD-02-25 - River quality baseline study Vol.1 by Erling\final\River Quality Baseline main report.doc<br />
25
River Quality Baseline Study. Vol. 1<br />
4.2.3 Hydrography<br />
The upper reaches of Sg. Sarawak Kiri and Sg. Sarawak Kanan are narrow and<br />
shallow. They are situated in steep terrain with gradients in excess of 1 % and<br />
are therefore fast flowing.<br />
Downstream of the confluence of Sg. Sarawak Kiri and Sg. Sarawak Kanan<br />
below Batu Kitang and down to the sea, the river flows through a flat plain and<br />
is becoming gradually wider and the current speed decreases.<br />
Before the establishment of the barrage, the river was strongly influenced by<br />
the tide and intruding saltwater. The tidal influences propagated as far as Buso<br />
at Sg. Sarawak Kanan and Sebua at Sarawak Kiri, some 60 km from the estuary<br />
mouth.<br />
After the establishment of the barrage, the tidal influences and saltwater intrusions<br />
have been significantly reduced and a relatively stable water level has<br />
been established. The barrage has also reduced the river flow velocities. The<br />
reduced flushing effect of the tide and the reduced flow velocities have increased<br />
sedimentation of suspended matter.<br />
Today inflow of saltwater takes place when the barrage is opened for flushing<br />
every second weekday in contrast to the pre-barrage period when intrusion of<br />
saltwater took place twice a day.<br />
The barrage is opened for flushing in order to prevent oxygen depletion in impoundments<br />
in front of the barrage and to flush out organic matter accumulated<br />
in the sediment.<br />
4.2.4 Riverbed Sediments<br />
The sediments in the narrow, fast flowing upper reaches of Sg. Sarawak Kiri<br />
and Sg. Sarawak Kanan mainly consists of gravel (Table 4.1).<br />
Downstream of the confluence, where the current speed decreases, the riverbed<br />
sediments are mainly composed of fine-grained silt and clay (Table 4.1).<br />
The sand contents increase markedly in the Pending area, however, the sediments<br />
become silty again downstream of the barrage. The predominance of<br />
sand off Pending is probably an effect of the flushing procedure at the barrage.<br />
During flushing, the fine-grained particles of the sediment are suspended and<br />
transported downstream of the barrage where they resettle. This is supported by<br />
the fact that samples collected at Pending before the construction of the barrage<br />
had a silt content of 70%. After the construction of the barrage, the silt content<br />
in the Pending area decreased to 24% and the sand content increased to 76%<br />
(Table 4.1, Fig 4.4).<br />
C:\Documents and Settings\user\Desktop\SUD-02-25 - River quality baseline study Vol.1 by Erling\final\River Quality Baseline main report.doc<br />
26
River Quality Baseline Study. Vol. 1<br />
Table 4.1 Grain Size Distribution of River Bed Sediments.<br />
Location Gravel<br />
C:\Documents and Settings\user\Desktop\SUD-02-25 - River quality baseline study Vol.1 by Erling\final\River Quality Baseline main report.doc<br />
(%)<br />
Sand<br />
(%)<br />
Silt (%) Clay (%) Refer-<br />
Upper reaches of Sg. Sarawak Kiri 96 4 0 0 1<br />
Upper reaches of Sg. Sarawak Kanan 97 3 0 0 1<br />
Sg. Sarawak main<br />
At Batu Kawa Bridge 2 20 63 15 1<br />
Upstream confluence Sg. Maong 0 24 68 8 2<br />
Downstream confluence Sg. Maong 0 30 64 23 2<br />
At Satok Bridge (pre-barrage) 5 95 0 0 1<br />
At Satok Bridge (post-barrage) 0 20 53 27 2<br />
Confluence Sg. Bintangor 0 4 59 37 2<br />
At Holiday Inn (pre-barrage) 2 98 0 0 1<br />
At Holiday Inn (post-barrage) 0 22 56 22 2<br />
Off Kuching Port Authority 0 25 49 26 2<br />
Downstream confluence Sg. Bintawa 0 52 37 11 2<br />
At Pending (pre-barrage) 0 19 70 11 1<br />
At Pending (post barrage) 0 76 24 0 2<br />
Downstream of Barrage 0 22 72 0 2<br />
Tributaries<br />
Sg. Maong (tributary of Sg. Sarawak) 0 20 56 24 1<br />
Ref 1: “Water Quality and Sediment Monitoring for Sg. Sarawak Flood Mitigation Options<br />
Study” as prepared by Chemsain Konsultant <strong>Sdn</strong> <strong>Bhd</strong> for Jurutera Jasa <strong>Sdn</strong> <strong>Bhd</strong>.<br />
Ref 2: SUD sediment study November 2000. Reported in Vol 3 of the River Baseline Study<br />
%<br />
80<br />
70<br />
60<br />
50<br />
40<br />
30<br />
20<br />
10<br />
0<br />
before barrage after barrage<br />
% sand % silt % clay<br />
Figure 4.4. Composition of sediments in Sg. Sarawak at Pending before and<br />
after the establishment of the barrage. Percentage of sand, silt and clay fractions.<br />
Hydrographic Section in Marine Department has carried out a survey on sedimentation<br />
for SRB. This study showed a slight increase of sedimentation rates<br />
after two years of operation of the barrage, due to the reduced river flow velocities.<br />
Samples collected at the Satok Bridge and at Holiday Inn before the estab-<br />
ence<br />
27
River Quality Baseline Study. Vol. 1<br />
lishment of the Barrage, were much sandier compared to samples collected after<br />
(Table 4.1, Fig 4.5). This may reflect the increased sedimentation rate due to<br />
the barrage, but may of course also simply be due to the difference in sampling<br />
locations.<br />
%<br />
120<br />
100<br />
80<br />
60<br />
40<br />
20<br />
0<br />
Satok before Holiday inn before Satok after Holiday inn after<br />
Figure 4.5. Composition of sediments in Sg. Sarawak at Satok Bridge and<br />
Holiday inn before and after the establishment of the barrage. Percentage of<br />
sand silt and clay fractions.<br />
4.3 River <strong>Eco</strong>system<br />
%gravel % sand % silt % clay<br />
4.3.1 Riverbank Vegetation<br />
Sg. Sarawak Kiri and Sg. Sarawak Kanan flow through heavily vegetated primary<br />
and secondary rainforest in varying stages of succession that grows close<br />
to the waters edge.<br />
The vegetation changes below Batu Kitang, where the two tributaries meet.<br />
Wide beaches with reeds are encountered downstream of Batu Kitang. This is a<br />
result of the slowing down of the river flow rate.<br />
The vegetation along the river between Batu Kawa and the barrage is mainly<br />
mangrove- and nipah forest. Mangroves and nipah forests are encountered in<br />
tidal areas with fluctuating salinity. There is a concern that the decrease in salinity<br />
due to the barrage may impact the mangrove trees and nipah palms.<br />
4.3.2 Aquatic Vegetation<br />
Water hyacinth (Eichhornia crassipes) is abundant particularly at the confluence<br />
of feeder streams, channels and riverbank settlements where the concentration<br />
of nutrients is high. Explosive growth of water hyacinth is associated<br />
with increased discharge of nutrients in slow flowing waters. The establishment<br />
of the barrage resulting in slower water flow and reduced water exchange may<br />
cause rapid proliferation of water hyacinth especially in areas with high nutrient<br />
C:\Documents and Settings\user\Desktop\SUD-02-25 - River quality baseline study Vol.1 by Erling\final\River Quality Baseline main report.doc<br />
28
River Quality Baseline Study. Vol. 1<br />
load. Reduction of the present sewage/nutrient discharge to the river will reduce<br />
the risk of water hyacinth growth.<br />
4.3.3 Benthic Invertebrates<br />
The SUD Project carried out a study of benthic invertebrates in Sg. Sarawak<br />
from upstream of Sg. Maong to downstream of the Barrage in November 2000.<br />
The study showed that oligochaete worms dominate the fauna in Sg. Sarawak<br />
upstream of the barrage. Tubificidae are the most common, with Tubifex occurring<br />
as the most common genus. Downstream of the barrage, oligochates were<br />
absent and marine molluscs dominate the fauna. The study is further discussed<br />
in section 5.5 in this volume and in the Volume 3 of the Baseline Study Report.<br />
A study carried out in 1995-1996 (KTA, 1997) indicated the presence of a large<br />
stock of the giant freshwater prawn (Macrobrachium rosenbergii) in the river<br />
from the Kuching area to the lower reaches of Sg. Sarawak Kiri and Sg. Sarawak<br />
Kanan. The giant freshwater prawn migrates downstream to spawn in<br />
brackish water. The installation of the barrage may have reduced the stock of<br />
the prawn in the river because the barrage acts as a barrier for the movement of<br />
sexually mature indivuduals to the brackish water downstream for spawning<br />
activities and the movement of juvenile stages upstream. However, the barrage<br />
does not completely block the migration of prawns as it is opened every second<br />
weekday. A interview with a fisherman in connection with the sediment and<br />
benthos studies carried out by the SUD Project in November 2000 indicated<br />
that Macrobrachium rosenbergii were often caught at the confluence of Sg.<br />
Bintangor and Sg. Sarawak.<br />
4.3.4 Fish<br />
A study of the composition of the fish fauna was undertaken prior to the establishment<br />
of the barrage. The study was carried out in the main river of Sg. Sarawak,<br />
Sg. Sarawak Kiri and Sg. Sarawak Kanan during the period from May<br />
1995 to February 1996 (KTA, 1997).<br />
Table 4.2 and 4.3 show the fish families and species encountered in the three<br />
sections of the river system. It is evident that the composition of the fish fauna<br />
in the main river Sg. Sarawak is very different from the fauna in the upstream<br />
tributaries, Sg. Sarawak Kiri and Sg. Sarawak Kanan. Fish fauna composition<br />
changes gradually along the river due to changes in environmental conditions.<br />
The most important being: depth and width of stream/river, current velocity,<br />
riverbed substrate, turbidity, availability of preferred food and influence of<br />
tide/salinity.<br />
The upper reaches of Sg. Sarawak Kiri and Sg. Sarawak Kanan are narrow,<br />
shallow, fast flowing and clear streams, which flow over gravel and rocky bottoms.<br />
<strong>Here</strong> species from the Balitoridae and Sisoridae families are dominant.<br />
Fish from the Bagridae family are also common. Further downstream, species<br />
from the Cyprinidae family gradually become dominant and at the confluence<br />
of Sg. Sarawak Kiri and Sg. Sarawak Kanan, the fish Mystus sp. replaces the<br />
Cyprinids.<br />
C:\Documents and Settings\user\Desktop\SUD-02-25 - River quality baseline study Vol.1 by Erling\final\River Quality Baseline main report.doc<br />
29
River Quality Baseline Study. Vol. 1<br />
Downstream of the confluence, the river flows through a flat plain and is becoming<br />
gradually wider. The current speed decreases, the waters are turbid and<br />
the riverbed is silty. All these environmental changes affect the composition of<br />
the fish fauna. In 1995-1996, this part of the river was tidally influenced with<br />
intrusion of saltwater/brackish water twice a day. The fish fauna comprised<br />
both freshwater and marine species. About 66% of the total numbers of species<br />
caught were marine or brackish and the remaining 34% were freshwater species.<br />
After the establishment of the barrage in 1997, the inflow of saltwater has<br />
been reduced. Today, the inflow of saltwater takes place when the barrage is<br />
opened for flushing every second weekday compared to the pre-barrage period<br />
when intrusion of saltwater took place twice a day. The stocks of marine and<br />
brackish water species in the lower reaches of Sg. Sarawak will therefore,<br />
probably decrease due to the presence of the barrage.<br />
Table 4.2 Number of species of different fish families caught in Sg. Sarawak,<br />
Sg. Sarawak Kiri & Sg. Sarawak Kanan during the period May 1995-<br />
February 1996.<br />
Family Number of species<br />
Sg. Sarawak Kiri<br />
Number of species<br />
Sg. Sarawak Kanan<br />
C:\Documents and Settings\user\Desktop\SUD-02-25 - River quality baseline study Vol.1 by Erling\final\River Quality Baseline main report.doc<br />
Number of species Sg.<br />
Sarawak Proper<br />
Antennariidae 1<br />
Anguillidae* 1<br />
Ariidae* 3<br />
Bagridae 3 3 2<br />
Balitoridae 3 1<br />
Carangidae* 1<br />
Channidae 2 1<br />
Clariidae 1<br />
Cyprinidae 11 4 1<br />
Dasyathidae 1<br />
Eleotrididae* 3<br />
Gobiidae* 2<br />
Hemiraphidae 1 1<br />
Lutjanidae* 1<br />
Mastacembelidae 1 1 1<br />
Mugilidae* 1<br />
Ophicephalidae 1<br />
Plotosidae 1<br />
Polynemidae 1<br />
Scianenida 3<br />
Siluridae 1<br />
Siganidae 1<br />
Sisoridae 3 1<br />
Tetradontidae 1 1 1<br />
Toxotidae 1 1 1<br />
*Anguillidae, Ariidae, Carangidae, Eleotridae, Gobiidae, Dermogenys sp. Mugilidae and Lutjanidae<br />
are primarily marine or brackish water fish families that may swim upstream into fresh water (Ref. 2).<br />
30
River Quality Baseline Study. Vol. 1<br />
Table 4.3 List of species of fish caught in Sg. Sarawak, Sg. Sarawak Kiri and<br />
Sg. Sarawak Kanan during the period May 1995-February 1996.<br />
Family Species Sg. Sarawak<br />
Kiri<br />
C:\Documents and Settings\user\Desktop\SUD-02-25 - River quality baseline study Vol.1 by Erling\final\River Quality Baseline main report.doc<br />
Sg. Sarawak<br />
Kanan<br />
Sg. Sarawak<br />
Main<br />
Antennariidae Antennarius sp X<br />
Anguillidae* Anguilla sp. X<br />
Ariidae* Arius bilineatus X<br />
Arius maculatus X<br />
Arius venosus X<br />
Bagridae Leiocassius micropogon X X<br />
Mystus sp. 1 X X X<br />
Mystus sp. 2 X X X<br />
Balitoridae Gastromyzon danumensis X X<br />
Homaloptera nebulosa X<br />
Nemachilus kapuaensis X<br />
Carangidae* Caranx sp X<br />
Channidae Chana lucius X X<br />
Cyclocheiltichtys apogon X<br />
Clariidae Clarias sp X<br />
Cyprinidae Paracrossochiluys vittatus X X<br />
Puntius binonatus X<br />
Puntius brevis X<br />
Punthius lateristriga X X<br />
Punthius sealei X<br />
Rasbora borneensis X X<br />
Rasbora caudimaculata X<br />
Rasbora sarawakensis X<br />
Rasbora spilotaenia X<br />
Rasbora sp. X X<br />
Tor sp X X<br />
Dasyathidae Himantura signifer X<br />
Eleotrididae* Bunaka gyrinoides X<br />
Oxyeleotris marmorata X<br />
Eleotris sp. X<br />
Gobiidae* Glossogobius sp X<br />
Periohthalmus sp X<br />
Hemiraphidae Dermogenys sp* X<br />
Hemiraphodon sp X<br />
Lutjanidae* Lutjanus johnii X<br />
Mastacembelidae Mastacembelus sp. X X X<br />
Mugilidae* Liza sp X<br />
Ophicephalidae Ophicephalus sp X<br />
Plotosidae Plotosus sp X<br />
Polynemidae Eleutheronema tetradactylum X<br />
Scianenida Boesemania microlepis X<br />
Pana microdon X<br />
Johnius coitor X<br />
31
River Quality Baseline Study. Vol. 1<br />
Table 4.2 (continued)<br />
Family Species Sg. Sarawak<br />
Kiri<br />
C:\Documents and Settings\user\Desktop\SUD-02-25 - River quality baseline study Vol.1 by Erling\final\River Quality Baseline main report.doc<br />
Sg. Sarawak<br />
Kanan<br />
Sg. Sarawak<br />
Main<br />
Siluridae Kryptoterus lais X<br />
Siganidae Siganus vermiculatus X<br />
Sisoridae Glyptothorax plathypogon X X<br />
Glyptothorax platypogonoides<br />
X<br />
Glyptothorax major X<br />
Tetradontidae Xenopterus sp X X X<br />
Toxotidae Toxotes sp X X X<br />
*Anguillidae, Ariidae, Carangidae, Eleotridae, Gobiidae, Dermogenys sp. Mugilidae and Lutjanidae<br />
are primarily marine or brackish water fish families that may swim upstream into fresh water (Ref. 2).<br />
4.4 Landuse<br />
Kuching is the principal urban center at the Sg. Sarawak River system. There<br />
are numerous smaller towns and villages in the river valleys upstream of<br />
Kuching including Batu Kawa, Batu Kitang, Siniawan and Bau. River valleys<br />
have been developed for agriculture and the river is used for transportation,<br />
fishing and water extraction.<br />
4.4.1 Urban Landuse<br />
Kuching<br />
Kuching is a quite large city with a population of about 450,000 according to<br />
the recent population census.<br />
Historically, the built-up area of the city was concentrated on the south bank of<br />
the river. Apart from the village settlements along the river, the north bank was<br />
largely undeveloped until the early 1970s when the major bridge crossing at<br />
Satok and the new State legislative and administrative hub were constructed.<br />
The development of the major government establishments therefore created the<br />
growth impetus for the development „across river‟ called Petra Jaya, which had<br />
continued to gain momentum with the road connection to the resort areas at<br />
Santubong and Damai.<br />
The landuse pattern of Kuching has been analysed in connection to the SUD<br />
Project and comprised the landuse of the catchment areas discharging to Sg.<br />
Sarawak.<br />
The City‟s industrial zone is concentrated to the eastern sector at Pending (fig.<br />
4.6). In addition, there is an industrial area south- east of the study area near Sg.<br />
Kuap, the Sama Jaya Free Industrial Zone. There is also a smaller industry zone<br />
at Demak Laut.<br />
32
River Quality Baseline Study. Vol. 1<br />
The Central Business Centre is located in the middle of the City where there are<br />
also residential and institutions areas. Predominantly residential areas are located<br />
to the south and west (Fig 4.6).<br />
Industrial development has haphazardly proliferated into the Batu Kawa and<br />
Batu Kitang areas in recent years, due to the lack of such sites in the existing<br />
industrial zones and of their proximity to population areas. The establishments<br />
include garage workshops, cement batching plants, warehouses, etc.<br />
A number of major commercial centres are spread over the south bank. They<br />
include the Sekama and the Kenyalang Park shopping centres in the eastern<br />
sector and the Satok/Rubber Road, the Green Road and the Central<br />
Park/Timberland commercial centres in the western sector. A major commercial<br />
centre is also currently being constructed at Batu Kawa.<br />
At the north bank, government establishment forms the core of the development,<br />
and a new town centre named Medan Raya is currently being built in that<br />
vicinity. There are also a number of institutional buildings located in the area,<br />
including a private hospital, the State mosque and library. Residential development<br />
is also rapidly being undertaken in Petra Jaya.<br />
The landuse in Kuching is described in detail in terms of pollution sources in<br />
Volume 2 of the River Baseline Study and in section 6 of this report.<br />
Batu Kawa<br />
Batu Kawa is a small bazaar, with only two rows of shophouses situated on the<br />
left bank of Sg. Sarawak.<br />
Batu Kitang<br />
Batu Kitang is a small service centre, situated at the Jalan Batu Kitang/Sg. Sarawak<br />
Kiri Bridge crossing near the Kuching Water Board water treatment<br />
plant.<br />
Siniawan<br />
Siniawan is a small bazaar situated on the south bank of Sg. Sarawak Kanan<br />
approximately mid-way between Kuching and Bau.<br />
Bau<br />
Bau is an urban centre situated some 30 km from Kuching along Sg. Sarawak<br />
Kanan. It is the administrative centre of Bau district. The town was founded on<br />
gold and antimony mining, an activity which has gradually declined.<br />
C:\Documents and Settings\user\Desktop\SUD-02-25 - River quality baseline study Vol.1 by Erling\final\River Quality Baseline main report.doc<br />
33
River Quality Baseline Study. Vol. 1<br />
Figure 4.6. Landuse of catchment areas in Kuching discharging to Sg. Sarawak<br />
C:\Documents and Settings\user\Desktop\SUD-02-25 - River quality baseline study Vol.1 by Erling\final\River Quality Baseline main report.doc<br />
34
River Quality Baseline Study. Vol. 1<br />
4.4.2 Agriculture<br />
Around 70% of the catchment areas of the Sg. Sarawak system are used for agriculture.<br />
The most significant farming activities are shifting cultivation, horticulture<br />
mixed farming and pig rearing. The importance of oil palm farming is<br />
increasing.<br />
Shifting cultivation<br />
Shifting cultivation covers by far the largest area within the catchment area (i.e.<br />
47%). Shifting cultivation in Sarawak is a hill-padi based cropping system,<br />
which is practised by the indigenous people. Shifting cultivation is a slash-andburn<br />
cultivation system in which the use of the fields is rotated. There has been<br />
a general decline in the cultivated area over the last decade due to the gradual<br />
switch to cash crops.<br />
Horticulture and mixed farming<br />
Around 10% of the catchment area are utilised for horticulture and mixed farming.<br />
This settled form of agriculture involves a wide range of crops such as<br />
vegetables, fruits, cocoa, rubber and pepper (Table 4.4). These crops are cultivated<br />
on a small holder basis on scattered individual farms. Most of the fruits<br />
and vegetables are sold on the markets in Kuching City.<br />
Table 4.4 Main vegetables and fruits grown in the catchment area.<br />
Vegetables Leafy vegetables: Chai Sim, Kai Lan, Kang Kong, Bayam, Pak<br />
Choi, Changkor Manis etc<br />
Tubers: yam, sweet potato, Lobak, groundnuts<br />
Fruity vegetables: Cucumber, long bean, french bean, ladies<br />
fingers, chilli, angle luffa, bitter gourd, pumkin, white gourd,<br />
winged bean<br />
Fruit Durian, rambutan, mango, mangosteen, langsat, guava coconuts.<br />
papaya, banana, guava, citrus and starfruit<br />
Pig rearing<br />
There are several large commercial pig farms in the catchment area. They are<br />
located in the Batu Kawa, Batu Kitang, Semaba/Kung Phin, Siniawan/Tg.<br />
Durian and Buso areas (Fig. 4.7). The farm size ranges from farms with 100<br />
heads to sizeable commercial farms of 3500 heads (Table 4.5).<br />
Table 4.5 Number and size of large commercial pig farms in the catchment<br />
area.<br />
Number of pigs Number of farms<br />
100-500 8<br />
500-1000 8<br />
1000-2000 8<br />
2000-3500 3<br />
C:\Documents and Settings\user\Desktop\SUD-02-25 - River quality baseline study Vol.1 by Erling\final\River Quality Baseline main report.doc<br />
35
River Quality Baseline Study. Vol. 1<br />
Oil palm<br />
Oil palm plantation has recently been introduced into the study area. The oil<br />
palms are grown on estates of 100 –1,000 ha. Significant development of oil<br />
palm estates is expected to take place in the future.<br />
C:\Documents and Settings\user\Desktop\SUD-02-25 - River quality baseline study Vol.1 by Erling\final\River Quality Baseline main report.doc<br />
36
River Quality Baseline Study. Vol. 1<br />
Figure 4.7. Location of pig farms in the catchment areas of the Sg. Sarawak<br />
system.<br />
C:\Documents and Settings\user\Desktop\SUD-02-25 - River quality baseline study Vol.1 by Erling\final\River Quality Baseline main report.doc<br />
37
River Quality Baseline Study. Vol. 1<br />
4.4.3 Fishery and Aquaculture<br />
A study of the fishery in the river was carried out in 1995-1996 prior to the establishment<br />
of the barrage.<br />
The lower sections of the river from the confluence of Sg. Sarawak Kiri and Sg.<br />
Sarawak Kanan to the Pending area in Kuching was an important fishing<br />
ground supporting a commercial fishery of some significance. In 1995-96, there<br />
were some 15 full time fishermen and 30 part time fishermen. In addition, a<br />
considerable leisure fishery was taking place especially in the weekends by up<br />
to 100 people.<br />
Although fishing takes place in Sg. Sarawak Kiri and Sg. Sarawak Kanan they<br />
are not important fishing grounds and they do not support any commercial fishing<br />
activities.<br />
The fishery in the mainstream Sg. Sarawak was carried out by the use of gill<br />
nets, hook and lines, long trap nets (belat), cast nets and scoop net.<br />
Gill nets were mainly used from downstream of Holiday Inn to Pending Port.<br />
Long trap nets (belat) were used upstream of Satok Bridge and cast nets and<br />
hook lines were used throughout the whole stretch of the river.<br />
The total annual revenue generated from Sg. Sarawak fishery between Pending<br />
Port and the confluence Sg. Sarawak Kiri and Sg. Sarawak Kanan was estimated<br />
at RM 275,000. The most common species caught were freshwater giant<br />
prawns (Macrobrachium rosenbergii) and the fish species Mystus spp. and<br />
Oxyeleotris marmorata.<br />
Brackish fish species made up about 75 % of the number of fish species caught<br />
in 1995-96. With the construction of the barrage, the number of brackish species<br />
above the barrage is expected to decline significantly. So is the stock of<br />
giant freshwater prawn, which spawns in brackish water (Cf. sections 4.3.2 and<br />
4.3.3). It is not known to what extent the barrage has affected the fishery today,<br />
but it will probably not be possible to sustain the 1995-96 level of fishing. A<br />
fisherman interviewed in November 2000 indicated that freshwater giant<br />
prawns are still often caught at the confluence of Sg. Bintangor and Sg. Sarawak,<br />
but only a thorough fishery investigation can elucidate the effects of the<br />
barrage on the fishery.<br />
There are no aquaculture activities in the Sg. Sarawak Proper. However, pond<br />
culture is very common among farmers in the catchment area. In 1996, it was<br />
estimated about 1,900 fishponds were operated by 1,200 farmers (Ref. 1). The<br />
ponds were mainly located along the Bau Kawa/Bau-Lundu road, the Musi area<br />
and in Bau. Most of the ponds are rainfed with no connection to the river.<br />
C:\Documents and Settings\user\Desktop\SUD-02-25 - River quality baseline study Vol.1 by Erling\final\River Quality Baseline main report.doc<br />
38
River Quality Baseline Study. Vol. 1<br />
4.4.4 Mining<br />
There are gold, silver, mercury, antimony and kaolinitic clay deposits in the Sg.<br />
Sarawak catchment area. Occurrences of copper, lead, zinc and iron have also<br />
been noted but are not of great significance.<br />
Most of the known mineral deposits are located in the Bau district. Since the<br />
beginning of the last century gold and silver has been mined here. Previously<br />
mercury and antimony was exploited as well. No mining activities take place<br />
today.<br />
4.4.5 Water Extraction<br />
Approximately 95% of the water supplies for Kuching City are obtained from<br />
Sg. Sarawak Kiri via Kuching Water Boards pumping station at Batu Kitang.<br />
The river basin of Sg. Sarawak Kiri above this point has been gazetted as a water<br />
catchment area to protect this important water resource.<br />
4.5 River Quality Management in Kuching<br />
Several agencies undertake and/or have a mandate to undertake separate functions<br />
relevant to river water quality management. Below follow a brief description<br />
of the functions and related agencies. In Appendix 2, there is an overview<br />
of the State administration, which is organised in a Chief Minister‟s Department,<br />
10 ministries and local authorities. In Appendix 3, there is a brief summary<br />
of relevant activities and mandates.<br />
4.5.1 Goals Setting<br />
With the recent amendment to the Natural Resources and Environment Ordinance<br />
(NREO) in May 2001, the overall State‟s environmental management has<br />
explicitly been delegated to the Natural Resources and Environment Board<br />
(NREB). According to section 5m, the Board may set environmental quality<br />
goals and determine and take the necessary measures for achieving such goals.<br />
According to section 5c, this power includes issuing of directions or orders to<br />
other environmental authorities.<br />
The present baseline study is conducted as a precondition for determining the<br />
future goals for river water quality. According to section 5n the NREB can direct<br />
any environmental authority to undertake monitoring and reporting of environmental<br />
quality. This power is required for procuring the comprehensive<br />
baseline studies as well as for the continuous updating of the data for the periodical<br />
environmental statements.<br />
On a federal level the Environment Quality Act (EQA) delegates a broad mandate<br />
to the Department of Environment (DOE) to recommend on environmental<br />
policies to the Minister and to conduct environmental planning (section 3c&o).<br />
According to section 51(ee), the Minister can issue regulations on ambient water<br />
quality standards. Until now, no regulation has been issued but a set of “In-<br />
C:\Documents and Settings\user\Desktop\SUD-02-25 - River quality baseline study Vol.1 by Erling\final\River Quality Baseline main report.doc<br />
39
River Quality Baseline Study. Vol. 1<br />
terim National Water Quality Standards” (INWQS) has been prepared. State<br />
goals will as, a minimum, have to conform to federal standards.<br />
Other State‟s ordinances also include the aspect of river quality management.<br />
According to the Water Ordinance (WO), issues on conservation, protection,<br />
development and management of the water resources of the State are among the<br />
duties and functions of the Water Resources Council.<br />
Landuse related to riverbanks is regulated by Land and Survey Department<br />
(L&S). Development of land is regulated by State Planning Authority (SPA).<br />
Sarawak Rivers Board (SRB) has specific powers to regulate activities along<br />
the banks of gazetted river (SRC 16 & 22).<br />
4.5.2 Water Quality Monitoring and Reporting<br />
It is the duty of DOE to produce a yearly report on the state of the environment<br />
in Malaysia (EQA, section 3). This yearly report includes the status of the water<br />
quality in the major Malaysian rivers. The information presented is based on<br />
an overall index, calculated from 7 main water quality parameters.<br />
NREB undertakes river monitoring of certain water quality parameters in the<br />
main rivers.<br />
Other State agencies carry out monitoring for specific purposes. There are no<br />
explicit legal provisions regarding this monitoring. Monitorings are carried out<br />
by SRB for river water quality, Public Works Department (JKR) and Kuching<br />
Water Board (KWB) for drinking water quality. Drainage and Irrigation Department<br />
(DID), JKR and Kuching Barrage Management carry out hydraulic<br />
measurements to monitor flooding, drainage etc.<br />
4.5.3 Regulatory Measures<br />
A substantial number of agencies are involved in regulation of the discharge of<br />
wastewater, sewage and solid waste to the river.<br />
Standards for discharge to inland waters are generally issued by DOE according<br />
to EQA section 21 and 51(ee). The present standards are issued as the 1979<br />
Environmental Quality Sewage regulations. NREB can similarly regulate discharge<br />
according to NREO 18(u&v).<br />
Hazardous (scheduled) waste is separately regulated by the EQA.<br />
Prior approval of activities, which may cause discharge to inland waters, is<br />
conducted by several agencies.<br />
Approval of EIAs for specific activities is conducted by DOE and NREB respectively.<br />
The division of tasks is specified in the regulations. DOE generally<br />
deals with industrial and infrastructural projects while NREB deals with landuse<br />
projects.<br />
C:\Documents and Settings\user\Desktop\SUD-02-25 - River quality baseline study Vol.1 by Erling\final\River Quality Baseline main report.doc<br />
40
River Quality Baseline Study. Vol. 1<br />
Licensing of specific activities is conducted by:<br />
DOE (Crude palm oil, raw natural rubber and activities discharging higher<br />
concentrations of polluting substances than determined in the Environmental<br />
Quality Sewage regulations);<br />
Public Health Authorities and Local Authorities (markets, food outlets,<br />
preparation and processing of food, hotels, petroleum storage);<br />
Veterinary Health Authorities (abattoirs, meat processing, rearing of livestock);<br />
Ministry of Agriculture (aquaculture); and<br />
Land and Survey Department (mining, certain activities within prescribed<br />
urban areas).<br />
Permission from Sarawak Rivers Board (SRB) is required for discharge of effluents<br />
or sewage into navigable (gazetted) rivers or into drains that discharge<br />
into gazetted rivers (Sarawak Rivers Cleanliness bylaw (SRC) section 13).<br />
Discharge of pollutants into inland waters is prohibited according to EQ Sewage<br />
Regulation (Section 6), NREO (section 30a), the Local Authorities Ordinance<br />
(section 117), Local Authorities (Cleanliness) By-law (section 18) and<br />
Sarawak Rivers Ordinance (gazetted rivers) (Section 33). Specific prohibitions<br />
are issued according to the Water Ordinance (WO) for designated water catchment<br />
areas.<br />
Orders or directives relating to discharge into inland waters may be issued by<br />
DOE (EQA section 31), NREB (NREO 10(j)), Local Authorities (LAO section<br />
112 (nuisances)) and SRB (SRC section 22 (gazetted rivers)).<br />
4.5.4 Wastewater and Sewage Systems<br />
In general, the local authorities have an obligation to keep the area under their<br />
jurisdiction clean and hygienic in accordance with the Local Authority Ordinance<br />
(section 91). Section 104 and 105 give mandates to establish, maintain<br />
and carry out sanitary services including removal or otherwise dealing with<br />
night-soil and all kinds of effluent, and to issue relevant rules and by-laws.<br />
Today, the public stormwater drains serve as the main sewage system. Construction<br />
and maintenance of public drains and sewage systems are included in<br />
the powers delegated to the Local Authorities (LAO 132 & 138). The works are<br />
typically carried out by JKR on behalf of the Local Councils. DID have been<br />
increasingly involved in planning and implementing the major drainage systems<br />
(trunk systems) because of the accelerated urbanisation of the State. The<br />
involvement is not based on specific legal provisions. Drainage integrated in<br />
development projects for new areas are conducted by the developer and handed<br />
over to the Local Councils at project completion. However, the Local Councils<br />
have no obligation to accept such hand over.<br />
Construction and operation of sewage treatment (sewage farms and sewage<br />
disposals works) are similarly delegated to the local authorities (LAO 134).<br />
C:\Documents and Settings\user\Desktop\SUD-02-25 - River quality baseline study Vol.1 by Erling\final\River Quality Baseline main report.doc<br />
41
River Quality Baseline Study. Vol. 1<br />
However, State major development projects typically derive from the State<br />
Planning Unit (SPU) as special projects. Future centralised sewage treatment<br />
for Kuching is in accordance with this expected to be initiated by SPU.<br />
Every Government agencies and Local Authorities shall submit projects for the<br />
protection and the environment to the NREB for its recommendation before<br />
submitting to the State Parliament for approval (NREO 9).<br />
Establishment of sewers or drains carrying sewage or effluents to be discharged<br />
into a gazetted river requires a permission from SRB (SRC 9). In addition, SRB<br />
has specific powers to order dismantling, demolishing or alteration of the position<br />
of drains and sewers to avoid discharge of effluents and sewage into gazetted<br />
rivers (SRC 8 & 10). Similarly SRB has specific powers to require the<br />
treatment of the effluents (SRC 10).<br />
C:\Documents and Settings\user\Desktop\SUD-02-25 - River quality baseline study Vol.1 by Erling\final\River Quality Baseline main report.doc<br />
42
River Quality Baseline Study. Vol. 1<br />
5 River Quality<br />
Sg. Sarawak and its tributaries in Kuching are receiving sewage and wastewater<br />
from a wide variety of sources in Kuching including households, food outlets<br />
(markets, restaurants etc.) and industries. In addition, Sg. Sarawak receives pollutants<br />
from agriculture, mining and landclearing activities as well as sewage<br />
from cities and villages upstream of Kuching. The sources of pollution and pollution<br />
loads from different sources are described in section 6.<br />
5.1 Potential Impacts of the Discharge of Wastewater<br />
Sewage and wastewater deteriorate the water quality of the tributaries and the<br />
main river, the extent of deterioration depending on the amount of sewage and<br />
the water exchange.<br />
The potential impacts from sewage discharge can be grouped into:<br />
Impacts of organic matter and nutrients;<br />
Impacts due to pathogenic microorganisms; and<br />
Impacts of toxic substances.<br />
Organic matter<br />
The impacts of the discharge of organic matter in sewage are basically caused<br />
by the microbial degradation of organic compounds. In a river, some significant<br />
effects are:<br />
After discharge, microorganisms (bacteria, fungi and ciliates) on the riverbed<br />
and other surfaces degrade the organic matter in the sewage, consuming<br />
oxygen during the process;<br />
The Biological Oxygen Demand (BOD), which is a measure of the biodegradable<br />
organic matter in the water, increases dramatically at the outlet,<br />
but succeedingly the BOD decreases due to sedimentation of particulate<br />
matter and to degradation of dissolved organic matter (Fig 5.1 A);<br />
The oxygen consumption of the sediment increases immediately downstream<br />
of the outlet due to the microbiological activity and the concentra-<br />
C:\Documents and Settings\user\Desktop\SUD-02-25 - River quality baseline study Vol.1 by Erling\final\River Quality Baseline main report.doc<br />
43
River Quality Baseline Study. Vol. 1<br />
tion of oxygen in the sediment and water decrease. However, the oxygen<br />
consumption of the sediment decrease further downstream concurrently<br />
with the decrease of organic matter and the concentration of oxygen increases<br />
again (Fig 5.1A);<br />
The degradation of organic matter result in the release of ammonium<br />
(NH4 + ) and phosphate (PO4 3- ). The ammonium is nitrified by microorganisms<br />
to NO3 - consuming oxygen in the process (Fig 5.1 B);<br />
These processes affect the invertebrate fauna in the river due to changes in<br />
the supply of food, structure of sediment and concentration of oxygen. Low<br />
oxygen levels and high organic content of the sediment favours organisms<br />
which can tolerate low oxygen concentrations and which are deposit feeders<br />
subsiding on organic detritus and its associated microflora. When dissolved<br />
oxygen reaches very low level, the organisms die.<br />
The degradation of organic matter may also cause offensive odours. In<br />
oxygen depleted environments, extremely malodorous compounds like<br />
methane and hydrogensulphide is thus released.<br />
Pathogenic organisms<br />
Sewage may contain pathogens (disease-causing organisms) such as hepatitis<br />
B, cholera, and typhoid. Faecal coliforms, which are bacteria found in the intestinal<br />
tracts of mammals, including humans, are measured as an indicator of the<br />
extent of contamination by pathogens. Most faecal coliforms are not hazardous<br />
to humans; however, they provide an indication of the amount of faecal matter<br />
present, which may be contaminated with other pathogens.<br />
Toxic substances<br />
Hundreds of potentially toxic substances are found in sewage effluent. These<br />
include metals (such as mercury, arsenic, lead, chromium, copper, cadmium,<br />
and silver), hydrocarbons, synthetic organic chemicals, and chlorine.<br />
The contaminants are continuously accumulated in the sediments of the river.<br />
They are generally adhered to fine-grained particles in the sewage and settled<br />
with sediments on the riverbed. Some of these contaminants can remain in the<br />
environment for a long time and many of them cannot be degraded (such as<br />
heavy metals).<br />
Some metals and organic compounds may accumulate in organisms and are<br />
passed up the food chain to predator species. This process, known as biomagnification<br />
or bioaccumulation, is one of the ways that contaminants in sewage<br />
effluent may affect people.<br />
C:\Documents and Settings\user\Desktop\SUD-02-25 - River quality baseline study Vol.1 by Erling\final\River Quality Baseline main report.doc<br />
44
River Quality Baseline Study. Vol. 1<br />
Figure 5.1. The effects on the discharge of sewage in a river in terms of concentrations<br />
of oxygen, BOD, NH4 + and NO3 - in the water column with increasing<br />
distance from the outlet.<br />
C:\Documents and Settings\user\Desktop\SUD-02-25 - River quality baseline study Vol.1 by Erling\final\River Quality Baseline main report.doc<br />
45
River Quality Baseline Study. Vol. 1<br />
5.2 Surface Water Quality<br />
The assessment of the surface water quality of Sg. Sarawak focuses on parameters,<br />
which have been chosen as preliminary indicators for water quality in the<br />
EMS for Kuching i.e.:<br />
pH, DO, BOD, COD, Total Suspended Solids, Oil & Grease;<br />
Nutrients (Ammoniacal Nitrogen, Nitrate, Total Nitrogen, Phosphorus);<br />
Heavy Metals (Hg, Pb, As, Zn, Cd, Cr, Cu, Fe, Ni, CN, Mn); and<br />
Coliform Counts.<br />
Evaluation of the present water quality is based on water quality data collected<br />
by NREB, KWB and UNIMAS in year 1999 and 2000. Descriptions of changes<br />
in water quality since 1984 are based on data from DOE.<br />
For the assessment of the present water quality the selected monitoring locations<br />
are grouped in various zones as follows (Cf. Table 5.1):<br />
Zone A, comprising sampling sites on Sg. Sarawak Kanan;<br />
Zone B, comprising sampling sites on Sg. Sarawak Kiri;<br />
Zone C, comprising sampling sites on Sg. Sarawak Proper from Batu Kawa<br />
to upstream of Satok Bridge;<br />
Zone D, comprising sampling sites on Sg. Sarawak Proper from Sg. Satok<br />
Bridge to downstream of Barrage;<br />
Zone E, comprising sampling sites on comprising sampling sites on Sg.<br />
Maong (Tributary discharging to Sg. Sarawak);<br />
Zone F, comprising sampling sites on Sg. Bintangor (Tributary discharging<br />
to Sg. Sarawak);<br />
Zone G, comprising sampling sites on Sg. Padungan (Tributary discharging<br />
to Sg. Sarawak);<br />
Zone H, comprising sampling sites on Sg. Sekama (Tributary discharging to<br />
Sg. Sarawak); and<br />
Zone I, comprising sampling sites on Sg. Tabuan (Tributary discharging to<br />
Sg. Kuap).<br />
C:\Documents and Settings\user\Desktop\SUD-02-25 - River quality baseline study Vol.1 by Erling\final\River Quality Baseline main report.doc<br />
46
River Quality Baseline Study. Vol. 1<br />
Table 5.1 provides an overview of assessment zones and data sources and Figure<br />
5.2 indicates the location of monitoring sites in the City of Kuching.<br />
C:\Documents and Settings\user\Desktop\SUD-02-25 - River quality baseline study Vol.1 by Erling\final\River Quality Baseline main report.doc<br />
47
River Quality Baseline Study. Vol. 1<br />
Table 5.1 Overview of data and monitoring sites used in the assessment of the<br />
present water quality. Numbers in parentheses refer to station numbers. The<br />
locations of these stations are presented in Fig. 5.2.<br />
Selected Monitoring Location Sources<br />
SMK Bau<br />
Wind Cave<br />
Zone A<br />
Bau Water Intake Point<br />
Zone B<br />
Kpg. Bukit Panchor<br />
Batu Kitang Intake Point<br />
Zone C<br />
Kampung Batu Kawa<br />
Batu Kawa Bridge<br />
Zone D<br />
Under Satok Bridge (W2)<br />
Near Holiday Inn Discharge<br />
Point (W3)<br />
Bako Causeway (W9)<br />
Upstream Barrage (W7)<br />
Downstream of Barrage (W8)<br />
<br />
Zone E<br />
Sg. Maong (N1)<br />
Sg. Maong (N2)<br />
Sg. Maong (N3)<br />
Sg. Maong (N4)<br />
Zone F<br />
Sg. Bintangor (W2)<br />
Zone G<br />
Sg. Padungan (W4)<br />
Zone H<br />
Sg. Sekama (W5)<br />
Zone I<br />
Sg. Tabuan (St 1-St 6)<br />
C:\Documents and Settings\user\Desktop\SUD-02-25 - River quality baseline study Vol.1 by Erling\final\River Quality Baseline main report.doc<br />
(a) NREB‟s River Watch Monitoring Programme: Water<br />
Quality Data for Southern Region<br />
May – December 1999<br />
January – August 2000<br />
(b) Kuching Water Board: Raw Water Quality Report for<br />
the year 1999 and 2000 (up to Oct.)<br />
(c) NREB‟s River Watch Monitoring Programme: Water<br />
Quality Data for Southern Region<br />
January – December 1999<br />
January – December 2000<br />
(d) Kuching Water Board: Raw Water Quality Report for<br />
the year 1998, 1999 and 2000 (up to Oct.)<br />
(e) Kuching Water Board Raw Water Quality Reports for<br />
the years 1998, 1999 and 2000.<br />
(f) NREB‟s River Watch Monitoring Programme: Water<br />
Quality Data for Southern Region<br />
January – November 1999<br />
January – August 2000<br />
(g) NREB‟s River Watch Monitoring Programme: Water<br />
Quality Data for Southern Region<br />
January – November 1999<br />
January – December 2000<br />
h) NREB‟s River Watch Monitoring Programme: Water<br />
Quality Data for Southern Region. January – September<br />
2000<br />
i) NREB‟s River Watch Monitoring Programme: Water<br />
Quality Data for Southern Region. January – September<br />
2000<br />
j) NREB‟s River Watch Monitoring Programme: Water<br />
Quality Data for Southern Region<br />
January – September 2000<br />
k) UNIMAS study. Sampling in September and December<br />
1999<br />
48
River Quality Baseline Study. Vol. 1<br />
Figure 5.2. Water Quality Monitoring Sites in the City of Kuching.<br />
C:\Documents and Settings\user\Desktop\SUD-02-25 - River quality baseline study Vol.1 by Erling\final\River Quality Baseline main report.doc<br />
49
River Quality Baseline Study. Vol. 1<br />
5.2.1 General Overview<br />
The water quality data from NREBs‟ River watch programme for year 2000 is<br />
used to compare the degree of pollution of different stretches of Sg. Sarawak<br />
and tributaries. For this year, there are simultaneous monthly measurements<br />
from Sg. Sarawak Kiri, Sg. Sarawak Kanan, Sg. Sarawak Proper, Sg. Maong,<br />
Sg. Bintangor, Sg. Padungan and Sg. Sekama, which are not available from<br />
previous years.<br />
Organic matter, nutrients and oxygen<br />
The concentrations of BOD and ammoniacal nitrogen are low in Sg. Sarawak<br />
Kiri and Kanan. Correspondingly, the oxygen conditions are good with mean<br />
concentrations of oxygen of more than 5 mg/l (Figure 5.3).<br />
The concentrations of BOD and ammoniacal nitrogen are also low in the part of<br />
Sg. Sarawak, which is facing Kuching. However, the concentration of oxygen<br />
is significantly decreased compared to the zones upstream of Kuching. The<br />
mean concentration is around 4 mg/l. Oxygen concentrations, which are below<br />
4 mg/l may cause harmful effects on sensitive organisms in the river. The low<br />
BOD values along this stretch of the river may not be literally taken as an indication<br />
of low organic loading in the river water. In a warm tropical climate<br />
where biodegradation of organic material is rapid, low dissolved oxygen concentrations<br />
as those observed in the lower reaches of Sg. Sarawak are most<br />
likely due to decomposition of the high loading of organic matter.<br />
The tributaries situated in Kuching are extremely polluted with very high concentrations<br />
of BOD and ammoniacal nitrogen with very poor oxygen conditions.<br />
In fact, concentrations below 2mg/l are consistently encountered. Very<br />
few organisms can survive in such low concentrations of oxygen.<br />
The poor water quality in the tributaries and Sg. Sarawak in Kuching is mainly<br />
due to the discharge of untreated sewage from the drains in the city.<br />
C:\Documents and Settings\user\Desktop\SUD-02-25 - River quality baseline study Vol.1 by Erling\final\River Quality Baseline main report.doc<br />
50
River Quality Baseline Study. Vol. 1<br />
DO;BOD mg/l<br />
10<br />
9<br />
8<br />
7<br />
6<br />
5<br />
4<br />
3<br />
2<br />
1<br />
0<br />
Kiri Kana Sg Sarawak Sg Maong Sg Bintangor Sg Padungan Sg Sekama<br />
DO BOD NH4<br />
Figure 5.3. Mean concentration of Dissolved oxygen, BOD and ammoniacal<br />
nitrogen (NH4-N) in 2000 in different zones of the Sg. Sarawak as defined<br />
above. (Sg. Sarawak corresponds to Zone D: i.e.to the main stretch of Sg. Sarawak<br />
Proper from Sg. Satok Bridge to downstream of Barrage.<br />
Odours<br />
The SUD Project has introduced an internationally recognised standard method<br />
for the assessment of the intensity of smell in river and drain water in Kuching.<br />
The method determines Threshold Odour Number (TON) by a panel of smellers.<br />
The TON is defined as the number of dilutions of a water sample which is<br />
necessary in order to obtain a mixture in which odour is just perceived with certainty<br />
by the panellists, i.e. the higher the threshold odour number the higher<br />
intensity of smell. The method is described in SUD document SUD-02-29 “Determination<br />
of odour characterisation in water”.<br />
Table 5.2 presents the results obtained during the introduction of the method. It<br />
is evident that there is no or very little odour in Sg. Sarawak Proper. In contrast,<br />
the waters in the tributaries Sg. Bintangor and Sg. Sekama are very smelly and<br />
the drain water from the market at Petanak smell extremely strong.<br />
C:\Documents and Settings\user\Desktop\SUD-02-25 - River quality baseline study Vol.1 by Erling\final\River Quality Baseline main report.doc<br />
4<br />
3,5<br />
3<br />
2,5<br />
2<br />
1,5<br />
1<br />
0,5<br />
0<br />
NH4 mg/l<br />
51
River Quality Baseline Study. Vol. 1<br />
Table 5.2 Results of testing of odours in river water. April and May<br />
2001.Threshold odour number determined by a panel of smellers. For the<br />
results indicated as 16000 > 16000<br />
Zone F (Sg. Bintangor) > 16000 > 16000<br />
Zone G (Sg. Padungan) > 16000 > 16000<br />
Zone H (Sg. Sekama) > 16000 > 16000<br />
Heavy metals and other hazardous pollutants<br />
The levels of heavy metals in water are generally very low and below the detection<br />
limits, except for iron and manganese (Cf. Appendix 1). The levels of iron<br />
and manganese is generally violated the Malaysian water quality standards (Cf.<br />
below) at all monitoring stations in the Sg. Sarawak system.<br />
The high iron and manganese concentrations are due to natural processes and<br />
not primarily a result of human activities, although the discharge of wastewater<br />
may contribute to increased levels. Results from 1999 indicate that the concentrations<br />
of iron in Sg. Sarawak Kiri are at the same level as those encountered<br />
52
River Quality Baseline Study. Vol. 1<br />
in the heavily polluted Sg. Maong and higher than the levels in Sg. Sarawak<br />
main fronting Kuching (Zone D) (Table 5.4).<br />
High background concentrations in surface water are common in tropical natural<br />
waters as iron is constantly leached from the iron-rich soil and rocky substrates<br />
(Menon & Murtedza, 1999). Leaching of iron is particularly significant<br />
in swampy areas such as peat and freshwater swamps, nipah forests and mangroves,<br />
which are abundant in the Sg. Sarawak catchment area. The soils in<br />
such areas are waterlogged and anaerobic. In the anaerobic, waterlogged soil,<br />
the solubility of iron increases. Insoluble Fe +++ is reduced to soluble Fe ++ ,<br />
which is then transported via groundwater to the river. The solubility of manganese<br />
increases in anaerobic swampy area in the same way as iron (Chapman,<br />
1997).<br />
The available data indicate that agrochemicals and pesticides are generally below<br />
detection limits (Menon & Murtedza, 1999).<br />
Table 5.4 Mean concentrations of iron in different zones of the river in the<br />
year 1999. Wet season: Nov-Feb. Dry season: Mar-Oct. Data not available<br />
for year 2000 and for Zone A and Zones F-H<br />
Zone Mean concentration<br />
wet season (mg/l)<br />
C:\Documents and Settings\user\Desktop\SUD-02-25 - River quality baseline study Vol.1 by Erling\final\River Quality Baseline main report.doc<br />
Mean concentration<br />
dry season (mg/l)<br />
Zone B Sg. Sarawak Kiri 2.3 1.0<br />
Zone C (Batu Kawa to Satok bridge) 0.7 0.8<br />
Zone D (Satok to Barrage) 0.9 0.8<br />
Zone E (Sg. Maong) 2.0 1.3<br />
5.2.2 Water Quality Classification of Different Zones<br />
The data have been compared to the Malaysian Interim National Water Quality<br />
Standards (INWQS) in order to make a classification of the water quality of the<br />
different zones of the river. The INWQS operates six classes of water quality:<br />
Class I, representing water bodies of excellent quality, most suitable for<br />
water extraction for human consumption. This type of water is typically encountered<br />
in uninhabited areas without antropogenic discharge. Very sensitive<br />
aquatic species thrive in Class I waters;<br />
Class IIA, representing water bodies of good quality. Most existing raw water<br />
supply sources in Sarawak come under this category. Conventional low<br />
cost treatment required;<br />
Class IIB water, which is suitable for recreational use with body contact. If<br />
used for water supply for human consumption, excessive treatment is required<br />
which incurs relatively high costs;<br />
53
River Quality Baseline Study. Vol. 1<br />
Class III, representing polluted water. The class is used primarily to protect<br />
common and moderately tolerant aquatic species of economic value. Water<br />
under this classification may be used for water supply with extensive/advanced<br />
treatment;<br />
Class IV, representing heavily polluted water which must only be used for<br />
irrigation purposes; and<br />
Class V, representing heavily polluted water, which must not even be used<br />
for irrigation purposes.<br />
The concentration limits for pollutants in the different classes of water quality<br />
are stipulated in DOE, 1993. Selected values are presented in Table 5.5.<br />
A classification according to the INWQS of the different zones of the Sg. Sarawak<br />
system based on the 1999 and 2000 data is presented below.<br />
Table 5.5 Selected water quality parameters used in the classification under<br />
the DOE Interim National Water Quality Standards for Malaysia.<br />
Parameters Class<br />
I<br />
Class<br />
IIA<br />
Class<br />
IIB<br />
C:\Documents and Settings\user\Desktop\SUD-02-25 - River quality baseline study Vol.1 by Erling\final\River Quality Baseline main report.doc<br />
Class<br />
III<br />
Class<br />
IV<br />
Class<br />
V<br />
NH4-N (mg/l) 0.1 0.3 0.3 0.9 2.7 >2.7<br />
BOD (mg/l) 1 3 3 6 12 >12<br />
COD (mg/l) 10 25 25 50 100 >100<br />
DO (mg/l) 7 5-7 5-7 3-5 < 3 < 1<br />
TSS (mg/l) 25 50 50 150 300 >300<br />
Faecal Coliforms * 10 100 400 5000 5000<br />
(counts/100ml)<br />
(20,000) (20,000)<br />
Total Coliforms<br />
(counts/100 ml)<br />
100 5000 5000 50,000 50,000 >50,000<br />
* Geometrical mean. Values in parentheses must not be exceeded<br />
Zone A (Sg. Sarawak Kanan)<br />
The data from Sg. Sarawak Kanan are summarised in Tables 1-2 in Appendix<br />
1. Mean concentrations of selected parameters are presented in Table 5.6.<br />
The water quality of Sg. Sarawak Kanan is quite good in terms of physicochemical<br />
parameters (DO, BOD, COD, TSS, Turbidity and Ammoniacal-<br />
Nitrogen etc). In general, these parameters comply with Class IIA/IIB limits.<br />
However, the water does not meet the class IIA/IIB standards for coliform bacteria,<br />
which is probably due to discharge of untreated domestic wastewater<br />
from the riverine communities, including Bau and Siniawan areas.<br />
54
River Quality Baseline Study. Vol. 1<br />
Table 5.6 Mean concentrations of selected water quality parameters in Zone<br />
A (Sg. Sarawak Kanan). Wet season: Nov-Feb. Dry season: Mar-Oct.<br />
Parameter Wet Season<br />
1999<br />
Dry Season<br />
1999<br />
Wet Season<br />
2000<br />
C:\Documents and Settings\user\Desktop\SUD-02-25 - River quality baseline study Vol.1 by Erling\final\River Quality Baseline main report.doc<br />
Dry Season<br />
2000<br />
INWQS<br />
class IIB<br />
No samples 6 18 6 18<br />
NH4-N (mg/l) 0.1 0.1 0.08 0.1 0.3<br />
BOD (mg/l)
River Quality Baseline Study. Vol. 1<br />
Zone C (Sg. Sarawak Proper from Batu Kawa Bridge to upstream Satok<br />
Bridge)<br />
In general the water quality values in zone C complies with class IIA/IIB. The<br />
average Total Coliform levels are however marginally higher than the Class IIB<br />
limits (Table 5.8, Tables 5-6 in Appendix 1).<br />
Table 5.8 Mean concentrations of selected water quality parameters in Zone<br />
C (main Sg. Sarawak from Batu Kawa Bridge to upstream of Satok Bridge).<br />
Wet season: Nov-Feb. Dry season: Mar-Oct.<br />
Parameter Wet Season<br />
1999<br />
Dry Season<br />
1999<br />
Wet Season<br />
2000<br />
C:\Documents and Settings\user\Desktop\SUD-02-25 - River quality baseline study Vol.1 by Erling\final\River Quality Baseline main report.doc<br />
Dry Season<br />
2000<br />
56<br />
INWQS<br />
class IIB<br />
No samples 8 18 4 16<br />
NH4-N (mg/l) 16,000 5,000
River Quality Baseline Study. Vol. 1<br />
Tributaries in Kuching<br />
The water qualities in the tributaries Sg. Maong (Zone E), Sg. Bintangor (Zone<br />
F) Sg. Padungan (Zone G), Sg. Sekama Zone (H) and Sg. Tabuan (Zone I) are<br />
very poor and fall between class IV/V (Tables 5.10-5.14 and Tables 9-10 in<br />
Appendix 1).<br />
Table 5.10 Mean concentrations of selected water quality parameters in Zone<br />
E (Sg. Maong). Wet season: Nov-Feb. Dry season: Mar-Oct.<br />
Parameter Wet Season<br />
1999<br />
Dry Season<br />
1999<br />
Wet Season<br />
2000<br />
C:\Documents and Settings\user\Desktop\SUD-02-25 - River quality baseline study Vol.1 by Erling\final\River Quality Baseline main report.doc<br />
Dry Season<br />
2000<br />
57<br />
INWQS<br />
class IIB<br />
No samples 12 32 4 24<br />
NH4-N (mg/l) 2.2 4.6 2.0 4.7 0.3<br />
BOD (mg/l) 9.6 11.9 3.6 6.0 3<br />
COD (mg/l) 35.2 37.5 27.0 32.3 25<br />
DO (mg/l) 1.3 1.4 2.6 0.8 5-7<br />
TSS (mg/l) 15.6 17.5 12.0 27.8 50<br />
Faecal coliforms<br />
(counts/100ml)<br />
>16,000 >16,000 >16,000 >16,000 400<br />
Total coliforms<br />
(counts/100ml)<br />
>16,000 >16,000 >16,000 >16,000 5,000<br />
Table 5.11 Mean concentrations of selected water quality parameters in Zone<br />
F (Sg. Bintangor). Wet season: Nov-Feb. Dry season: Mar-Oct.<br />
Parameter Wet Season<br />
1999<br />
Dry Season<br />
1999<br />
Wet Season<br />
2000<br />
Dry Season<br />
2000<br />
INWQS<br />
class IIB<br />
No samples - - 2 10<br />
NH4-N (mg/l) - - 1.7 3.1 0.3<br />
BOD (mg/l) - - 3.6 5.6 3<br />
COD (mg/l) - - 11.4 25.4 25<br />
DO (mg/l) - - 2.2 2.4 5-7<br />
TSS (mg/l) - - 19.5 39.7 50<br />
Faecal coliforms<br />
(counts/100ml)<br />
- - >16,000 >16,000 400<br />
Total coliforms<br />
(counts/100ml)<br />
- - >16,000 >16,000 5,000
River Quality Baseline Study. Vol. 1<br />
Table 5.12 Mean concentrations of selected water quality parameters in Zone<br />
G (Sg. Padungan). Wet season: Nov-Feb. Dry season: Mar-Oct<br />
Parameter Wet Season<br />
1999<br />
Dry Season<br />
1999<br />
Wet Season<br />
2000<br />
C:\Documents and Settings\user\Desktop\SUD-02-25 - River quality baseline study Vol.1 by Erling\final\River Quality Baseline main report.doc<br />
Dry Season<br />
2000<br />
58<br />
INWQS<br />
class IIB<br />
No samples - - 2 10<br />
NH4-N (mg/l) - - 4.2 3.2 0.3<br />
BOD (mg/l) - - 3.9 5.8 3<br />
COD (mg/l) - - 23.6 31.8 25<br />
DO (mg/l) - - 1.9 2.2 5-7<br />
TSS (mg/l) - - 24 46.6 50<br />
Faecal coliforms<br />
(MPN/100ml)<br />
- - >16,000 >16,000 400<br />
Total coliforms<br />
(counts/100ml)<br />
- - >16,000 >16,000 5,000<br />
Table 5.13 Mean concentrations of selected water quality parameters in Zone<br />
H (Sg.Sekama). Wet season: Nov-Feb. Dry season: Mar-Oct<br />
Parameter Wet Season<br />
1999<br />
Dry Season<br />
1999<br />
Wet Season<br />
2000<br />
Dry Season<br />
2000<br />
INWQS<br />
class IIB<br />
No samples - - 2 10<br />
NH4-N (mg/l) - - 1.2 2.2 0.3<br />
BOD (mg/l) - - 3.1 4.5 3<br />
COD (mg/l) - - 14.7 22.5 25<br />
DO (mg/l) - - 3.3 2.9 5-7<br />
TSS (mg/l) - - 44.5 39.6 50<br />
Faecal coliforms<br />
(counts/100ml)<br />
- - >16,000 >16,000 400<br />
Total coliforms<br />
(counts/100ml)<br />
- - >16,000 >16,000 5,000
River Quality Baseline Study. Vol. 1<br />
Table 5.14 Mean concentrations of selected water quality parameters in Zone<br />
I (Sg. Tabuan. Wet season: Nov-Feb. Dry season: Mar-Oct<br />
Parameter Wet Season<br />
1999<br />
Dry Season<br />
1999<br />
Wet Season<br />
2000<br />
C:\Documents and Settings\user\Desktop\SUD-02-25 - River quality baseline study Vol.1 by Erling\final\River Quality Baseline main report.doc<br />
Dry Season<br />
2000<br />
59<br />
INWQS<br />
class IIB<br />
No samples 54 54 - -<br />
NH4-N (mg/l) 2.6 2.9 - - 0.3<br />
BOD (mg/l) 19.9 14.5 - - 3<br />
COD (mg/l) 73.7 94.2 - - 25<br />
DO (mg/l) 0.9 1.4 - - 5-7<br />
TSS (mg/l) 19.0 37.0 - - 50<br />
Faecal coliforms<br />
(counts/100ml)<br />
- - - - 400<br />
Total coliforms<br />
(counts/100ml)<br />
- - - - 5,000<br />
Overview<br />
The water qualities of different zones classified according to the Malayisan Interim<br />
National Water Quality Standards (INWQS) is summarised in Table 5.15<br />
Table 5.15 Summary of INWQS classification of the different zones of the Sg.<br />
Sarawak system.<br />
Zone DOE INWQS Class<br />
Physical-chemical<br />
parameters<br />
Zone A (Sg. Sarawak Kanan) IIA/IIB<br />
Zone B (Sg. Sarawak Kiri) IIA/IIB<br />
Zone C (Sg. Sarawak main from Batu<br />
Kawa to upstream Satok bridge)<br />
Zone D (Sg. Sarawak main from Satok<br />
Bridge to downstream of barrage)<br />
DOE INWQS Class<br />
Bacteriological parameters<br />
IIA/IIB III<br />
III V<br />
Zone E (Sg. Maong) IV/V V<br />
Zone F (Sg. Bintangor) IV/V V<br />
Zone G (Sg. Padungan) IV/V V<br />
Zone H (Sg. Sekama) IV/V V<br />
Zone I (Sg. Tabuan) IV/V V<br />
5.2.3 Change in Water Quality<br />
Historical data from DOE indicates that the water quality of Sg. Sarawak declined<br />
during the period of 1987-1997 prior to the establishment of the barrage,<br />
mainly due to increased concentration of suspended solids and ammoniacal nitrogen<br />
(Memon and Murtedza, 1999).
River Quality Baseline Study. Vol. 1<br />
5.3 Sediment Quality<br />
The assessment of the sediment quality of Sg. Sarawak focuses on parameters,<br />
which have been chosen as preliminary indicators for sediments in the EMS for<br />
Kuching i.e.:<br />
Nutrients (Ammoniacal Nitrogen, Nitrate, Total Nitrogen, Phosphorus);<br />
Heavy Metals (Hg, Pb, As, Zn, Cd, Cr, Cu, Fe, Ni, CN, Mn);<br />
Polyaromatic hydrocarbons (PAH) and Total Petroleum Hydrocarbon<br />
(TPH); and<br />
Oil & Grease.<br />
Evaluation of the present sediment quality is based on studies performed by the<br />
SUD Project in November 2000 (Sg. Sarawak) and July 2001 (Sg. Kuap) and<br />
by a research group from UNIMAS and the Geological Survey Malaysia (Lau<br />
Seng et al, 1995 and Lau Seng et al, 1998).<br />
5.3.1 SUD Field Study of Sg. Sarawak<br />
The findings of the SUD field study on sediment pollution in Sg. Sarawak conducted<br />
in November 2000 are reported in detail in the Volume 3 of the River<br />
Quality Baseline Study Report. The locations of sampling sites are presented in<br />
Figure 5.4<br />
The SUD field study clearly indicates that pollutants from outlets in Kuching<br />
were accumulated in the sediments of Sg. Sarawak. The major findings in terms<br />
of composition of sediments (which is important for the interpretation of the<br />
data on pollutants) and the accumulation of different types of pollutants are<br />
presented below.<br />
C:\Documents and Settings\user\Desktop\SUD-02-25 - River quality baseline study Vol.1 by Erling\final\River Quality Baseline main report.doc<br />
60
River Quality Baseline Study. Vol. 1<br />
Fig 5.4. Sampling locations for sediments in Sg. Sarawak in November 2000<br />
C:\Documents and Settings\user\Desktop\SUD-02-25 - River quality baseline study Vol.1 by Erling\final\River Quality Baseline main report.doc<br />
61
River Quality Baseline Study. Vol. 1<br />
Composition of sediment<br />
The sediment mainly consists of clay and silt along the stretch of Sg. Sarawak<br />
from S1, upstream of Sg. Maong to S6, downstream of Petanak (Fig. 5.5). Further<br />
downstream, the sand content increase markedly to S8 at Pending, where<br />
as much as 76% of the sediment consist of sand particles. Downstream of the<br />
barrage at S9, fine grained sediment predominates again. The sandy sediment at<br />
S7 and S8 is probably a result of the flushing procedure at the barrage. During<br />
flushing, the fine-grained particles of the sediment are suspended and transported<br />
downstream of the barrage where they resettled.<br />
%<br />
120<br />
100<br />
80<br />
60<br />
40<br />
20<br />
0<br />
Composition of sediment<br />
S1 S2 S3 S4 S5 S6 S7 S8 S9<br />
Figure 5.5. Composition of sediments at the sampling stations. (The locations<br />
of sampling sites are presented in Fig 5.4)<br />
Organic matter and nutrients<br />
Organic matter from the outlets in Kuching clearly accumulates in the sediments<br />
of Sg. Sarawak. This is indicated by the concentration patterns of loss on<br />
ignition (which is a measure of the content of organic matter), Total N, Total P<br />
and NH4-N observed at the monitoring stations (Fig. 5.6, Fig. 5.7 and Fig. 5.8).<br />
The loss on ignition, which is a measure of the content of organic matter and<br />
the concentrations of Total N and total P, increases from upstream of Kucing<br />
(S1) to Sg. Bintangor (S4). From S4, a gradual decrease is observed and at Kg<br />
Bintawa (S7), the levels have dropped to levels comparable to those encountered<br />
upstream of Kuching (Fig 5.6 and 5.7). The decrease from S4 and further<br />
downstream is probably primarily the result of the flushing procedure at the<br />
barrage.<br />
NH4-N increases dramatically from station S1 upstream of Sg. Maong to S2,<br />
downstream of Sg. Maong from where a gradual decrease is observed to almost<br />
undetectable levels a S7 at Kp Bintawa. (Fig.5.8). NH4-N in the sediment arises<br />
C:\Documents and Settings\user\Desktop\SUD-02-25 - River quality baseline study Vol.1 by Erling\final\River Quality Baseline main report.doc<br />
Station<br />
Sand, % Silt+clay %<br />
62
River Quality Baseline Study. Vol. 1<br />
from the degradation of nitrogenous organic matter. In aerobic environments,<br />
NH4-N is oxidised to nitrite and further to nitrate. The fact that the highest levels<br />
of NH4-N are encountered at S2 and S3 indicates poorer oxygen conditions<br />
in the sediments at these stations compared to further downstream. Improved<br />
oxygen conditions further downstream may be an effect of the flushing at the<br />
barrage, bringing oxygen rich water into the river.<br />
Figure 5.6. Loss on ignition of sediments in Sg. Sarawak in November 2000.<br />
(The locations of sampling sites are presented in Fig 5.4)<br />
mg/kg<br />
%<br />
14<br />
12<br />
10<br />
8<br />
6<br />
4<br />
2<br />
0<br />
3000<br />
2500<br />
2000<br />
1500<br />
1000<br />
500<br />
0<br />
Loss on ignition<br />
S1 S2 S3 S4 S5 S6 S7 S8 S9<br />
Figure 5.7. Concentrations of total N and P in sediments in Sg. Sarawak in November<br />
2000. (The locations of sampling sites are presented in Fig 5.4).<br />
C:\Documents and Settings\user\Desktop\SUD-02-25 - River quality baseline study Vol.1 by Erling\final\River Quality Baseline main report.doc<br />
Station<br />
Total N and P in sediments<br />
S1 S2 S3 S4 S5 S6 S7 S8 S9<br />
Station<br />
Tot-N Tot-P m<br />
63
River Quality Baseline Study. Vol. 1<br />
200<br />
180<br />
160<br />
140<br />
120<br />
mg<br />
/kg<br />
100<br />
80<br />
60<br />
40<br />
20<br />
0<br />
NH4-N in sediment<br />
S1 S2 S3 S4 S5 S6 S7 S8 S9<br />
Figure 5.8. Concentrations of total NH4-N in sediments in Sg. Sarawak in November<br />
2000 (The locations of sampling sites are presented in Fig 5.4).<br />
Heavy metals<br />
The results of the SUD study in November 2000 also clearly show that heavy<br />
metals from outlets in Kuching are accumulated in the river sediments.<br />
The heavy metal concentrations gradually increase from S1 upstream of the<br />
confluence of Sg. Maong to maximum levels at S4, off Sg. Bintangor and S5 at<br />
Holiday Inn. From S5, a gradual decrease of heavy metals is observed to the<br />
downstream location S9, off the Barrage (Figures 5.9-5.12).<br />
This pattern is observed for Pb, Cu, Ni, Cd, Zn, Cr. and Fe. The concentrations<br />
of Mn and Hg do not increase to any appreciable extent downstream of S1, indicating<br />
that the City of Kuching is not a major source of Mn and Hg pollution.<br />
The decreasing concentration of heavy metals from Petanak (S6) to Pending<br />
(S8) is probably an effect of the flushing procedure at the barrage. It is evident<br />
from the results of the grain size analysis that the sediment becomes more<br />
sandy around Pending compared to further upstream, indicating that the finer<br />
grained fractions to which heavy metals are mainly adhered/absorbed, are<br />
flushed out to sea.<br />
C:\Documents and Settings\user\Desktop\SUD-02-25 - River quality baseline study Vol.1 by Erling\final\River Quality Baseline main report.doc<br />
Station<br />
64
River Quality Baseline Study. Vol. 1<br />
mg<br />
/kg<br />
Figure 5.9. Concentrations of copper (Cu), lead (Pb), nickel (Ni), chromium<br />
(Cr) and arsenic (As) in sediments in Sg. Sarawak in November 2000 (The locations<br />
of sampling sites are presented in Fig 5.4).<br />
mg/kg<br />
25<br />
20<br />
15<br />
10<br />
5<br />
0<br />
1<br />
0,9<br />
0,8<br />
0,7<br />
0,6<br />
0,5<br />
0,4<br />
0,3<br />
0,2<br />
0,1<br />
0<br />
Heavy metals in sediment<br />
S1 S2 S3 S4 S5 S6 S7 S8 S9<br />
Figure 5.10. Concentrations of Cadmium (Cd) and mercury (Hg) in sediments<br />
in Sg. Sarawak in November 2000 (The locations of sampling sites are presented<br />
in Fig 5.4).<br />
C:\Documents and Settings\user\Desktop\SUD-02-25 - River quality baseline study Vol.1 by Erling\final\River Quality Baseline main report.doc<br />
station<br />
Cu Pb Ni Cr As<br />
Cadmium and mercury in sediment<br />
S1 S2 S3 S4 S5 S6 S7 S8 S9<br />
Station<br />
Cd Hg<br />
65
River Quality Baseline Study. Vol. 1<br />
mg/kg<br />
Figure 5.11. Concentrations of zinc (Zn) and manganese (Mn) in sediments in<br />
Sg. Sarawak in November 2000 (The locations of sampling sites are presented<br />
in Fig 5.4).<br />
mg/kg<br />
350<br />
300<br />
250<br />
200<br />
150<br />
100<br />
50<br />
0<br />
30.000,00<br />
25.000,00<br />
20.000,00<br />
15.000,00<br />
10.000,00<br />
5.000,00<br />
0,00<br />
Zinc and manganese in sediment<br />
S1 S2 S3 S4 S5 S6 S7 S8 S9<br />
Figure 5.12. Concentrations of iron (Fe) in sediments in Sg. Sarawak in November<br />
2000 (The locations of sampling sites are presented in Fig 5.4).<br />
In order to assess the potential adverse biological effects due to heavy metals in<br />
the sediment, the results have been compared to recently developed Canadian<br />
Sediment Quality Standards which relates sediment chemistry data to the potential<br />
for adverse biological effects (CCME, 1999).<br />
Based on a considerable number of studies on the correlation between concentration<br />
and toxicity, a Probable Effect Level (PEL) was established for a wide<br />
number of pollutants in sediments. Concentrations equivalent to and above PEL<br />
represents concentrations, which are likely to cause adverse biological impacts.<br />
C:\Documents and Settings\user\Desktop\SUD-02-25 - River quality baseline study Vol.1 by Erling\final\River Quality Baseline main report.doc<br />
Station<br />
Zn Mn<br />
Iron in sediments<br />
S1 S2 S3 S4 S5 S6 S7 S8 S9<br />
Station<br />
66
River Quality Baseline Study. Vol. 1<br />
Hg is found above the PEL level on all sampled sites in Sg. Sarawak. Consequently,<br />
there may be a risk of adverse biological impacts due to Hg (Cf. Table<br />
5.16). The main source of Hg is however, not the City. Toxic levels are already<br />
encountered upstream of Kuching. The source may be mining activities upstream<br />
(Cf. section 5.3.2).<br />
The concentrations of the other heavy metals are below PEL and are therefore,<br />
not expected to cause any adverse impacts on organisms.<br />
Table 5.16 Concentration of heavy metals in sediment collected in November<br />
2000 in Sg. Sarawak (mg/kg dry weight). The Canadian Probable Effects<br />
Level (PEL) for the different metals are also shown. Figures in bold exceed<br />
the PEL.<br />
C:\Documents and Settings\user\Desktop\SUD-02-25 - River quality baseline study Vol.1 by Erling\final\River Quality Baseline main report.doc<br />
Cu<br />
ppm<br />
Pb<br />
ppm<br />
S1 Upstream Maong 10 10.2 48.6 0.44 3.8 0.73 6.9<br />
S2 Downstream Maong 14.7 17.4 106.0 0.54 4.9 0.92 4.5<br />
S3 Satok bridge 17.6 21.9 131.0 0.63 6.3 0.84 11.6<br />
S4 Bintangor 17.2 22.5 140.0 0.61 6.8 0.81 10.6<br />
S5 Holiday inn 17.5 23.3 134.0 0.63 7.1 0.93 6.5<br />
S6 Petanak 15.0 20.9 100.0 0.52 9.4 0.62 10.7<br />
S7 Kp Bintawa 12.3 14.9 82.9 0.41 4.2 0.77 4.9<br />
S8 Pending 4.1 6.9 26.9 0.34 3.7 0.64 9.2<br />
S9 Downstream barrage 4.8 9.0 32.4 0.37 4.8 0.63 6.3<br />
PEL 197.0 91.3 315.0 3.5 90.0 0.49 17.0<br />
Pesticides<br />
Pesticides were not found in any of the sediment samples. All pesticides analysed<br />
were below the detection limits (0.001 mg/kg for organochlorinated pesticides<br />
(0.005 mg/kg for chlordane) and 0.01 mg/kg for organophosphorated<br />
pesticides.<br />
Petroleum hydrocarbons<br />
Polyaromatic Hydrocarbons PAHs were also not found. All individual PAHs<br />
analysed for were below the detection limit of 0.1 mg/kg.<br />
Elevated concentrations of Total Petroleum Hydrocarbons (TPH) compared to<br />
upstream of Kuching were encountered at Satok Bridge (S3) and Sg. Bintawa<br />
(S7) (Fig. 5.13).<br />
Zn<br />
ppm<br />
Cd<br />
ppm<br />
Cr<br />
ppm<br />
Hg<br />
ppm<br />
As<br />
Ppm<br />
67
River Quality Baseline Study. Vol. 1<br />
mg/kg (C15-C36)<br />
350<br />
300<br />
250<br />
200<br />
150<br />
100<br />
50<br />
0<br />
TPH in sediments<br />
S1 S2 S3 S4 S5 S6 S7 S8 S9<br />
Figure 5.13. Concentrations of Total Petroleum Hydrocarbons (TPH) in sediments<br />
in Sg. Sarawak, November 2000. The locations of sampling sites are presented<br />
in Fig 5.4)<br />
5.3.2 SUD Field Study Sg. Kuap<br />
The findings of the SUD field study on sediment pollution in Sg. Kuap conducted<br />
in July 2001 are reported in detail in the Volume 3 of the River Quality<br />
Baseline Study Report. The sampling locations are indicated in Fig. 5.14.<br />
The study clearly indicates that heavy metals from the Sama Jaya Free Industrial<br />
Zone are accumulated in the sediments of Sg. Kuap.<br />
The concentrations of heavy metals increase markedly from upstream of the<br />
industrial estate to the area off the estate. Further downstream, a slight decrease<br />
is observed for most metals (Figs 5.15-5.17). This pattern indicates that the industrial<br />
estate is a source contributing heavy metals to the sediments.<br />
Although heavy metals are accumulated in the sediments, the concentrations<br />
are below levels, which are likely to be toxic to aquatic organisms. The concentrations<br />
are below the Canadian Probable Effect Levels (Cf. Table 5.17).<br />
Similar to Sg. Sarawak, pesticides were not found in any of the sediment samples<br />
from Sg. Kuap. All pesticides analysed were below the detection limits.<br />
C:\Documents and Settings\user\Desktop\SUD-02-25 - River quality baseline study Vol.1 by Erling\final\River Quality Baseline main report.doc<br />
Station<br />
68
River Quality Baseline Study. Vol. 1<br />
N<br />
Fig 5.14. Sampling locations for sediments in Sg. Kuap and Sg. Sarawak in<br />
July 2001. The Red box indicate the Samajaya Free Industrial Zone.<br />
C:\Documents and Settings\user\Desktop\SUD-02-25 - River quality baseline study Vol.1 by Erling\final\River Quality Baseline main report.doc<br />
SD1<br />
SD2<br />
SD4<br />
SD3<br />
69
River Quality Baseline Study. Vol. 1<br />
mg/kg<br />
Figure 5.15. Concentrations of copper (Cu), lead (Pb) nickel (Ni), chromium<br />
(Cr) and arsenic (As) in sediments in Sg. Kuap July 2000.<br />
mg/kg<br />
30<br />
25<br />
20<br />
15<br />
10<br />
5<br />
0<br />
0,9<br />
0,8<br />
0,7<br />
0,6<br />
0,5<br />
0,4<br />
0,3<br />
0,2<br />
0,1<br />
0<br />
SD4 SD3 SD2<br />
Cu Pb Ni Cr As<br />
SD4 SD3 SD2<br />
Figure 5.16. Concentrations of cadmium (Cd) in sediments in Sg. Kuap July<br />
2000.<br />
C:\Documents and Settings\user\Desktop\SUD-02-25 - River quality baseline study Vol.1 by Erling\final\River Quality Baseline main report.doc<br />
70
River Quality Baseline Study. Vol. 1<br />
mg/kg<br />
140<br />
120<br />
100<br />
80<br />
60<br />
40<br />
20<br />
0<br />
Figure 5.17. Concentrations of zinc (Zn) in sediments in Sg. Kuap July 2000.<br />
Table 5.17 Concentration of heavy metals in sediment collected in July 2000<br />
in Sg. Kuap (mg/kg dry weight). The Canadian Probable Effects Level (PEL)<br />
for the different metals are also shown.<br />
C:\Documents and Settings\user\Desktop\SUD-02-25 - River quality baseline study Vol.1 by Erling\final\River Quality Baseline main report.doc<br />
Cu<br />
ppm<br />
Pb<br />
ppm<br />
Zn<br />
SD4 SD3 SD2<br />
SD4 Upstream 0.8 3.0 6.6 0.24 2.00 5.3<br />
SD3 28.0 27.8 121.0 0.78 7.4 0.03<br />
SD2 10.3 23.5 72.9 0.83 20.9 2.1<br />
PEL 197.0 91.3 315.0 3.5 90.0 17.0<br />
5.3.3 Previous Research Studies<br />
All results from the previous research studies carried out by the research group<br />
from UNIMAS and the Geological Survey Malaysia is summarised in Table<br />
5.18. Sampling sites are indicated on Figure 5.18 and 5.19.<br />
Zn<br />
ppm<br />
Cd<br />
ppm<br />
Cr<br />
ppm<br />
As<br />
ppm<br />
71
River Quality Baseline Study. Vol. 1<br />
Figure 5.18. Sediment sampling sites. S1= upstream of confluence of Sg. Sarawak<br />
and Sg. Maong. S2= Downstream of the confluence of Sg. Sarawak and<br />
Sg. Maong. S3= At the Satok Bridge. S4= Off Sg. Bintangor. S5= Off Holiday<br />
Inn. S6= Off Kuching Port Authority. S7=Off tributary west of Kp Bintawa.<br />
S8= Off Pending. S9=Downstream of the Barrage.<br />
C:\Documents and Settings\user\Desktop\SUD-02-25 - River quality baseline study Vol.1 by Erling\final\River Quality Baseline main report.doc<br />
72
River Quality Baseline Study. Vol. 1<br />
Figure 5.19. Sediment sampling sites.<br />
C:\Documents and Settings\user\Desktop\SUD-02-25 - River quality baseline study Vol.1 by Erling\final\River Quality Baseline main report.doc<br />
73
River Quality Baseline Study. Vol. 1<br />
Sg. Sarawak Kiri<br />
The concentrations of heavy metals in the sediments of Sg. Sarawak Kiri was<br />
generally very low, in many cases below the detection limit and all cases below<br />
levels which may be toxic to sensitive organisms. However, high concentrations<br />
of iron were encountered.<br />
As described in section 5.2.1, this is not related to human activities, as high<br />
background concentrations of iron are to be expected in the river system.<br />
Sg. Sarawak Kanan<br />
The contents of heavy metals in the sediments of Sg. Sarawak Kanan were significantly<br />
higher than in Sg. Sarawak Kiri. Very high and toxic concentrations<br />
of As and Hg were encountered. The concentrations of Cd, Cr and Pb were also<br />
quite high. The study indicates that the source of these metals is located between<br />
Bau and Buso where previous gold mining activities and quarry operations<br />
has taken place (Fig 5.20). The polluted sediments will gradually be<br />
transported downstream and may affect the sediments in the part of the river<br />
running through Kuching.<br />
C:\Documents and Settings\user\Desktop\SUD-02-25 - River quality baseline study Vol.1 by Erling\final\River Quality Baseline main report.doc<br />
74
River Quality Baseline Study. Vol. 1<br />
Sg. Sarawak Kiri<br />
As<br />
ppm<br />
Table 5.18 Heavy metals in sediments in the Sg. Sarawak system found by<br />
UNIMAS and the Geological Survey Malaysia. (- = not measured; nd = not<br />
detected). The Canadian Probable Effects Level (PEL) for the different metals<br />
are also shown. Figures in bold exceed the PEL.<br />
Cd<br />
ppm<br />
Cr<br />
ppm<br />
C:\Documents and Settings\user\Desktop\SUD-02-25 - River quality baseline study Vol.1 by Erling\final\River Quality Baseline main report.doc<br />
Cu<br />
ppm<br />
Padawan
River Quality Baseline Study. Vol. 1<br />
mg/kg<br />
180<br />
160<br />
140<br />
120<br />
100<br />
80<br />
60<br />
40<br />
20<br />
0<br />
Bau Buso Kp Keranji Batu Kawa Muara Tebas<br />
As Hg<br />
Figure 5.20. Concentration of As and Hg in sediments of Sg. Sarawak Kanan<br />
(Bau, Buso and Kp Keranji) and Sg. Sarawak Main (Batu Kawa and Muara<br />
Tebas) found by Lau Seng et al 1995.<br />
Sg. Sarawak Proper<br />
The studies show that concentrations of heavy metals increase between Batu<br />
Kawa and Muara Tebas, which are in accordance with the SUD study.<br />
Sg. Maong<br />
The concentration of heavy metals in Sg. Maong was significantly higher than<br />
those found in Sg. Sarawak (compare Table 5.16 and 5.18). Potentially toxic<br />
levels of Cd, Pb and Zn were encountered in Sg. Maong.<br />
5.4 Accumulation of Pollutants in Organisms<br />
Following the discovery that sediments were polluted by heavy metals from<br />
gold mining and quarry operations in the Bau areas, the research group from<br />
UNIMAS and Geological Survey Malaysia carried out a study on accumulation<br />
of heavy metals in freshwater molluscs (Lau Seng et al. 1998). Sediment samples<br />
and freshwater molluscs (Clithon sp., Brotia costula and Melanoides tuberculata)<br />
were collected at the same sites and analysed for heavy metals<br />
The molluscs obviously accumulated As, Cu and Zn from the sediments and the<br />
results clearly indicated that the heavy metal source was Sg. Bau. Figure 5.21<br />
shows an example (Concentration of Arsenic in sediments and the molluscs<br />
Clithon sp. and Brotia costula).<br />
All the molluscs collected from the study area were found contaminated with<br />
As and the levels of Cu and Zn were at the maximum concentration allowable<br />
for seafood as stipulated by the Food Act (1983). Levels of Cd, Hg and Pb were<br />
however low in the molluscs tissues collected for the study.<br />
C:\Documents and Settings\user\Desktop\SUD-02-25 - River quality baseline study Vol.1 by Erling\final\River Quality Baseline main report.doc<br />
76
River Quality Baseline Study. Vol. 1<br />
There are no data from the river system in the Kuching area.<br />
mg As/kg dry wt.<br />
60<br />
50<br />
40<br />
30<br />
20<br />
10<br />
0<br />
Figure 5.21. Concentration of Arsenic in sediment and two freshwater molluscs<br />
(Brotia costula and Melanoides tuberculata) upstream and downstream of<br />
heavy metal sources at Sg. Bau.<br />
5.5 <strong>Eco</strong>system Impacts<br />
ST 1 upstream ST 3 downstream<br />
Sediment Brotia Cliton<br />
In order to be able to assess the impacts of the pollution of the river on aquatic<br />
organisms, a pilot study on benthic macroinvertebrates was carried out by the<br />
SUD Project in November 2000 in connection with the sediment study.<br />
Benthic macroinvertebrates (benthos) in the lower reaches of rivers and in the<br />
sea are from a wide variety of species of mainly oligochaete and polychaete<br />
worms, mussels, snails, starfish, sea urchins and crustaceans living in burrows<br />
in the sediment or on the sediment surface.<br />
Benthos samples were collected at the same time and at the same sites as the<br />
sediment samples (Cf. Fig 5.4) in order to be able to relate sediment contamination<br />
impacts on benthic fauna.<br />
The findings of the SUD field study on sediment pollution in Sg. Sarawak conducted<br />
in November 2000 are reported in detail in the Volume 3 of the River<br />
Quality Baseline Study Report. The major findings are presented below.<br />
Composition of fauna<br />
Oligochaete worms dominates the fauna in Sg. Sarawak upstream of the barrage.<br />
Tubificidae worms are the most common, with Tubifex occurring as the<br />
most common genus. Downstream of the barrage oligochates were absent and<br />
marine molluscs dominate the fauna.<br />
C:\Documents and Settings\user\Desktop\SUD-02-25 - River quality baseline study Vol.1 by Erling\final\River Quality Baseline main report.doc<br />
77
River Quality Baseline Study. Vol. 1<br />
Diversity index<br />
The diversity and species richness of macrobenthos generally show an increase<br />
downstream from S1 to S10 (Fig 5.22).<br />
Diversity Index (H')<br />
Species Richness (R1)<br />
4<br />
3,5<br />
3<br />
2,5<br />
2<br />
1,5<br />
1<br />
0,5<br />
0<br />
S1 S2 S3 S4 S5 S6 S7 S8 S9<br />
Station<br />
Shannon Weaver Diversity Index Margalef Richness Index<br />
Figure 5.22. Diversity index (H`=Shannon Wiener index) and species richness<br />
(R1= Margaleffs index) at each sampling site. For calculations of these reference<br />
is made to Volume 3 of the river quality baseline study. The locations of<br />
sampling sites are presented in Fig 5.4.No organisms were encountered at S5<br />
due to hard substrate on which the sampler did not function.<br />
Environmental factors affecting the fauna<br />
There are strong indications that the organic matter discharged from Kuching<br />
affects the benthos, upstream of the barrage.<br />
Based on a substantial amount of data, Pearson & Rosenberg (1978) found a<br />
general succession pattern of benthic infauna in response to increased input of<br />
organic material to the sediment:<br />
Initially increasing input of organic matter will result in an increase in the<br />
number of species, the biomass and the density (abundance) of organisms<br />
because the amount of food for organisms increases (many benthic species<br />
feed on organic matter on the seabed);<br />
When the input reaches a certain level, the number of species and, the biomass<br />
and the density decline. The reason behind this is that the oxidised<br />
layer of the sediment becomes thinner because the organic matter consumes<br />
oxygen;<br />
C:\Documents and Settings\user\Desktop\SUD-02-25 - River quality baseline study Vol.1 by Erling\final\River Quality Baseline main report.doc<br />
78
River Quality Baseline Study. Vol. 1<br />
At very heavy loads, oxygen depletion in the sediment may periodically<br />
take place. Only very few species can tolerate in such conditions. As a result,<br />
the numbers of species decrease further. Longer periods of oxygen depletion<br />
lead to the extinction of the fauna. In case of oxygen conditions<br />
have improved, the area will be re-colonised rapidly by a very few known<br />
as opportunistic species, which may be found in high densities.<br />
The benthos data from Sg. Sarawak can be interpreted in the context of the<br />
Pearson & Rosenberg succession of benthos in relation to increasing organic<br />
load.<br />
Abundance (number of individuals) and number of species of benthos are compared<br />
to the content of organic matter in the sediment (measured as loss on ignition)<br />
in Figure 5.23.<br />
It is evident that the abundance of species and the number of species increase<br />
concurrently with an increase in the content of organic matter when moving<br />
from Pending (S8) and upstream to Petanak (S6) and off Sg. Bintangor (S4).<br />
This is probably as a result of increasing amount of food in the form of organic<br />
matter.<br />
At the Satok Bridge (S3) and downstream of Maong (S2), the abundance and<br />
number of species drop dramatically despite the fact that the organic contents<br />
are similar to S6 and S4. The drop is probably an effect of poor oxygen conditions<br />
in the sediment. High levels of NH4-N are thus encountered here indicating<br />
poor oxygen conditions (Fig 5.24). The relatively better oxygen conditions<br />
further downstream at S4 and S6 may be an effect of the flushing at the barrage,<br />
bringing oxygen rich water into the river.<br />
This interpretation is strongly supported by the fact that the fauna is completely<br />
dominated by species of Oligochaete worms and that the changes in abundance<br />
and number of species described above is largely changes in abundance and<br />
number of species of Oligochaetes. Oligochaetes have been recognised as bioindicators<br />
for organic pollution (Canfield et al 1994, 1996). They are deposit<br />
feeders, subsisting on organic detritus and its associated microflora feeding on<br />
detritus in the sediment. Generally, they can tolerate quite low oxygen concentrations<br />
and may be found in large numbers in organical polluted habitats.<br />
C:\Documents and Settings\user\Desktop\SUD-02-25 - River quality baseline study Vol.1 by Erling\final\River Quality Baseline main report.doc<br />
79
River Quality Baseline Study. Vol. 1<br />
individuals/m3<br />
number<br />
1800<br />
1600<br />
1400<br />
1200<br />
1000<br />
7<br />
6<br />
5<br />
4<br />
3<br />
2<br />
1<br />
0<br />
800<br />
600<br />
400<br />
200<br />
0<br />
S8 S7 S6 S4 S3 S2 S1<br />
Station<br />
Abundance LOI, %<br />
S8 S7 S6 S4 S3 S2 S1<br />
Station<br />
No species LOI, %<br />
Figure 5.23. Abundance (number of individuals) and number of species of benthos<br />
compared to the content of organic matter in the sediment (measured as<br />
loss on ignition). The locations of sampling sites are presented in Fig 5.4.<br />
C:\Documents and Settings\user\Desktop\SUD-02-25 - River quality baseline study Vol.1 by Erling\final\River Quality Baseline main report.doc<br />
14<br />
12<br />
10<br />
8<br />
6<br />
4<br />
2<br />
0<br />
14<br />
12<br />
10<br />
8<br />
6<br />
4<br />
2<br />
0<br />
% Loss on ignition<br />
% Loss on ignition<br />
80
River Quality Baseline Study. Vol. 1<br />
individuals/m3<br />
Number of species<br />
1800<br />
1600<br />
1400<br />
1200<br />
1000<br />
7<br />
6<br />
5<br />
4<br />
3<br />
2<br />
1<br />
0<br />
800<br />
600<br />
400<br />
200<br />
0<br />
Figure 5.24. Abundance (number of individuals) and number of species of benthos<br />
compared to the content of NH4-N in the sediment. The locations of sampling<br />
sites are presented in Fig 5.4.<br />
The higher diversity and species richness at S9 downstream of the barrage is<br />
probably due to the fact that the salinity in this area is higher. The fauna is being<br />
dominated by the presence of marine molluscs and bivalves. Higher species<br />
diversity is generally encountered in more saline waters compared to more<br />
brackish waters.<br />
5.6 Floating Debris<br />
S8 S7 S6 S4 S3 S2 S1<br />
Station<br />
Abundance NH4-N<br />
S8 S7 S6 S4 S3 S2 S1<br />
Station<br />
No species NH4-N<br />
The presence of floating debris is aesthetically unpleasant and presents a hazard<br />
to river travel. In a study carried out by DHV Consultants in Nov/Dec 1990 and<br />
Jan/Feb, a generation of floating waste was estimated at 18,800 – 22,000<br />
C:\Documents and Settings\user\Desktop\SUD-02-25 - River quality baseline study Vol.1 by Erling\final\River Quality Baseline main report.doc<br />
200<br />
180<br />
160<br />
140<br />
120<br />
100<br />
80<br />
60<br />
40<br />
20<br />
0<br />
200<br />
180<br />
160<br />
140<br />
120<br />
100<br />
80<br />
60<br />
40<br />
20<br />
0<br />
mg/kg NH4-N<br />
mg/kg NH4.-N<br />
81
River Quality Baseline Study. Vol. 1<br />
m 3 /year. DBKU has the yearly measurements of the volume of floatables. The<br />
amount of floatables has decreased from some 125,000 m 3 /year in 1994 to<br />
45,000 m 3 /year in 1999 (Figure 5.25). The DHV study estimated the composition<br />
of floating debris as follows:<br />
About 80% of the debris were river and river bank vegetation (bamboo, nipah<br />
palm cut-offs, water hyacinth, branches and logs);<br />
About 15 % were wood waste (tree branches, logs, sawdust, sawn timber<br />
planks and off cuts); and<br />
About 5 % were municipal solid waste (plastic bottles and containers, plastic<br />
bags, steel and aluminium cans, paper/cardboard packaging, polystyrene<br />
foam, aerosol cans, etc.).<br />
Another study carried out by KTA (Sarawak) <strong>Sdn</strong> <strong>Bhd</strong> in 1997 confirmed that<br />
majority of the floatables found in Sg. Sarawak were still bamboo and vegetation.<br />
However, inspection by boat used during the study revealed that the proportion<br />
of wood waste appeared to be greater than the previously determined of<br />
m3 floatables<br />
15%.<br />
140000<br />
120000<br />
100000<br />
80000<br />
60000<br />
40000<br />
20000<br />
0<br />
year 1994 year 1995 year 1996 year 1997 year 1998 year 1999<br />
Figure 5.25. Amount of floatables (m 3 ) collected by DBKU on Sg. Sarawak.<br />
1994-1999.<br />
C:\Documents and Settings\user\Desktop\SUD-02-25 - River quality baseline study Vol.1 by Erling\final\River Quality Baseline main report.doc<br />
82
River Quality Baseline Study. Vol. 1<br />
6 Sources of Pollution and Pollution load<br />
6.1 Overview of Pollution Sources<br />
Sg. Sarawak and its main tributaries are receiving large amounts of sewage and<br />
wastewater from a wide variety of sources both from Kuching and upstream of<br />
Kuching.<br />
At the SUD workshop on Preliminary Goal setting in November 1999, the possible<br />
sources of pollutants to the river were identified (reported in SUD report<br />
“Preliminary goals, targets and indicators for sustainable urban development in<br />
Couching Sawara (SUD-02-03, SUD-02-07). The major sources were identified<br />
as:<br />
Households;<br />
Food outlets including markets, restaurants and coffee shops;<br />
Small and Medium Industries (SMI) and Large Scale Industries (LSI);<br />
Agriculture; and<br />
River vessels.<br />
The pollutants generated from these activities were identified during the workshop<br />
(Table 6.1). The amounts of wastewater and contaminants were not quantified<br />
during the workshop. Previously, there has been no attempt to estimate<br />
the pollution load from different sources in Kuching. During the baseline study,<br />
the first attempt to quantify load from different sources were made. Details on<br />
the estimation of pollution load from different sources are presented in Volume<br />
2 of the River Quality Baseline Study Report and the major findings are presented<br />
in the following sections.<br />
C:\Documents and Settings\user\Desktop\SUD-02-25 - River quality baseline study Vol.1 by Erling\final\River Quality Baseline main report.doc<br />
83
River Quality Baseline Study. Vol. 1<br />
Table 6.1 Factors affecting the Sarawak River quality.<br />
Upstream based<br />
sources<br />
Kuching based<br />
sources:<br />
Source Pollutants<br />
Agriculture, including live-<br />
stock<br />
C:\Documents and Settings\user\Desktop\SUD-02-25 - River quality baseline study Vol.1 by Erling\final\River Quality Baseline main report.doc<br />
Faecal and total coliforms<br />
Nutrients (especially N and P)<br />
BOD<br />
COD<br />
Pesticides<br />
Mining Cyanide<br />
Food outlets and house-<br />
holds<br />
Industries<br />
(A detailed outline of pol-<br />
lutants from different types<br />
of SMIs and LSIs is pre-<br />
sented in Table 6.8)<br />
Mined minerals and metals (Hg, As etc.)<br />
Faecal and total coliforms<br />
Nutrients(especially N and P)<br />
BOD<br />
COD<br />
Suspended solids<br />
Grease and oil<br />
Heavy metals<br />
Oil and grease<br />
Other inorganic substances and compounds<br />
Organic compounds, such as organic solvents,<br />
residue from industrial processes and products<br />
Micro organisms<br />
COD, BOD, AOX<br />
Vessels Heavy metals<br />
Organic solvents<br />
Oil spills<br />
Types of pollutants, discharge, treatments facilities, number of sources as well<br />
as estimated loads from households, food outlets and industries are described in<br />
sections 6.2, 6.3 and 6.4 below. Pollution from agriculture and other sources are<br />
described in sections 6.5 and 6.6.<br />
6.2 Pollution from Households<br />
6.2.1 Types of Pollutants from Households<br />
Domestic sewage can be separated into blackwater, which is body wastes (faeces<br />
and urine) and greywater, and all other liquid wastes of the household, including<br />
laundry, bathroom/washroom and kitchen wastewater. Body wastes are<br />
the most hazardous due to the possibility of contact with intestinal disease organisms.<br />
Greywater has fewer disease organisms unless the laundry has contained<br />
garments soiled by faecal discharges.<br />
The most significant pollutants in grey- and black- water which have been chosen<br />
as indicators for pollution from households are ammoniacal nitrogen, phosphorous,<br />
BOD, COD, faecal coliforms, total coliforms and TSS.<br />
84
River Quality Baseline Study. Vol. 1<br />
6.2.2 Estimated Population and Number of Households<br />
The SUD Project has estimated the population size and the number of different<br />
types of houses in the twelve catchment areas, which are discharging to Sg. Sarawak<br />
upstream of the barrage (Cf. Fig. 4.3 in section 4.1). Details are presented<br />
in Volume 2 of the River Quality Baseline Study Report. In year 2000, a<br />
total population of 215,000 people living in about 26,000 houses was identified<br />
in these catchment areas. The most important residential areas being (Table<br />
6.2):<br />
1. The Maong sub-catchment area with 94,192 inhabitants;<br />
2. Padungan (15,619 inhabitants);<br />
3. Bintawa 1 (11,901 inhabitants);<br />
4. Seman Lama (11,485 inhabitants); and<br />
5. Sinjan (10,641 inhabitants).<br />
Not included in these estimates is a residential area in the catchment of Sg.<br />
Kuap (mainly around Sg. Tabuan). The population in this area has been estimated<br />
at about 100,000 (SPU, 1998).<br />
C:\Documents and Settings\user\Desktop\SUD-02-25 - River quality baseline study Vol.1 by Erling\final\River Quality Baseline main report.doc<br />
85
River Quality Baseline Study. Vol. 1<br />
Table 6.2 Population and numbers of different types of Households in different<br />
Sub-catchment areas. Locations of the sub-catchment areas are shown on<br />
Fig 4.3 Section 4.1.<br />
Catchment Popu-<br />
South of Sg.<br />
Sarawak<br />
lation<br />
C:\Documents and Settings\user\Desktop\SUD-02-25 - River quality baseline study Vol.1 by Erling\final\River Quality Baseline main report.doc<br />
De-<br />
tached<br />
houses<br />
Semi-<br />
detached<br />
houses<br />
Terrace<br />
houses<br />
Flats Kam-<br />
pung<br />
houses<br />
Total<br />
house-<br />
Bintangor 1 4,402 136 28 - - 131 295<br />
holds<br />
Bintangor 2 6,645 176 140 176 250 336 1078<br />
Bintangor 3 5,749 14 - 14 102 52 182<br />
Padungan 15,619 512 250 1,596 670 - 3028<br />
Sekama 3,513 65 86 194 - - 345<br />
Sekama 1 2,253 64 32 82 - - 178<br />
Periok 741 55 20 10 - - 85<br />
Biawak 2,810 - - 100 144 - 244<br />
Bintawa 1,601 - - - - - -<br />
Bintawa 1 11,901 32 152 605 - - 789<br />
Kudei 8,151 64 223 1,102 - 96 1485<br />
Maong 94,192 3,150 3,208 4,944 1,186 - 12,488<br />
North of Sg.<br />
Sarawak<br />
Gita 8,937 69 188 346 - - 603<br />
Laruh 5,975 139 290 409 - - 838<br />
Turong 1,356 30 12 28 - 141 211<br />
Sinjan 10,641 196 78 578 - 390 1242<br />
Bedil 9,167 - - - - 801 801<br />
Gersik 2,504 - - - - 258 258<br />
Seman Lama 11,487 - - - - 1719 1719<br />
Siol Kandis 1 7,489 2 450 - - 23 475<br />
Siol Kandis 2 558 85 - - - - 85<br />
Total 215,664 4,789 5,157 10,184 2,352 3947 26,429<br />
6.2.3 Treatment Facilities and Draining Systems<br />
Greywater<br />
Almost all houses in Kuching discharge untreated greywater directly into the<br />
stormwater drains in the city. The stormwater drain is an extensive open channels<br />
system which discharges into smaller tributaries (Sg. Maong, Sg. Bintangor,<br />
Sg. Padungan, Sg. Sekama etc) or directly to Sg. Sarawak.<br />
The only measure to reduce contaminants from entering the drains is the usage<br />
of coarse filtering equipment installed at washing sinks.<br />
86
River Quality Baseline Study. Vol. 1<br />
Blackwater<br />
Houses are generally equipped with individual septic tanks for the treatment of<br />
blackwater. Then, the effluent from the septic tanks discharge to the drains and<br />
then to the river.<br />
Septic tank serve as a combined settling and skimming tank and an anaerobic<br />
digester, which decompose organic matter.<br />
Heavier solids from the incoming wastewater settle and form a sludge layer at<br />
the bottom of the tank. Grease and other light materials float on the surface<br />
where a scum layer is formed as floating materials accumulated.<br />
The organic material retained in the bottom of the tank undergoes anaerobic<br />
decomposition and is degraded to more stable compounds and gases such as<br />
carbon dioxide (CO2), methane (CH4) and hydrogen sulphide (H2S).<br />
Even though the volume of the solid material being deposited is reduced continuously<br />
by anaerobic decomposition, there is always a net accumulation of<br />
sludge in the tank. Materials from the bottom of the tank, which is buoyed up<br />
by the decomposition gases, will often stick to the bottom of the scum layer and<br />
increase its thickness. The long-term accumulation of scum and sludge can reduce<br />
the effective volumetric capacity of the tanks. Therefore, in order to function<br />
the tanks must be desludged regularly (according to Danish experience at<br />
least once a year).<br />
There are basically three types of septic tank i.e. tanks with one-, two- or three<br />
chambers. The function of the compartments is basically to limit the discharge<br />
of solids in the effluent from the septic tank. According to the Sg. Bintangor<br />
study, the most common type used in the Sg. Bintangor catchment area is a<br />
conventional two-compartment tank of a standard size of 2.3-2.6 m 3 .<br />
Septic tanks are not very efficient. According to Danish experience (Danish<br />
EPA pers comm., 2000), only about 30 % of the organic matter are removed<br />
prior to discharge, even in the most efficient three-chambered type with a capacity<br />
of at least 2 m 3 . Tanks with less number of chambers and in smaller capacity<br />
are apparently less efficient. In addition, nutrients are basically not all<br />
removed in septic tanks. As much as 72% and 76 % of the total discharge of<br />
Phosphorous and Nitrogen, from households are from blackwater (SUD-02-13).<br />
Consequently, even an optimal functional septic tank in Kuching is a one of th<br />
esignificant sources of organic matter and nutrients.<br />
The Rule of “Compulsory desludging of septic tanks, 1988” gazetted 15 th October<br />
1998 specifies that every septic tank in the city must be desludged every<br />
second year. The Sg. Bintangor study showed that this rule is not complied<br />
with. It was estimated that only 840 septic tanks of around 3,000 in the Sg. Bintangor<br />
catchment area was desludged in a two year period i.e. only about 30%<br />
of those which should have been desludged according to the rule. Presently,<br />
tanks are only pumped out at the request of the owner when there is a problem<br />
or blockage of the system.<br />
C:\Documents and Settings\user\Desktop\SUD-02-25 - River quality baseline study Vol.1 by Erling\final\River Quality Baseline main report.doc<br />
87
River Quality Baseline Study. Vol. 1<br />
On 1 st January 2000, DBKU launched a programme in which the two-year<br />
desludging period for septic tanks must be applied. The two subcontractors<br />
ENV and TRAMAS carry out the desludging for DBKU and the sludge is<br />
treated at the Matang Septic Sludge Treatment Plant. It may, however, be very<br />
difficult to achieve the intention of programme. According to the Sg. Bintangor<br />
study (SUD-02-09), more than 95 % of the septic tanks were in fact not accessible<br />
and many people did not even know whether they had septic tanks or not.<br />
As a consequence of the improper function of septic tanks, blackwater is discharged<br />
more or less untreated to the drainage system in Kuching. Untreated<br />
blackwater from households is undoubtedly the main source of the extremely<br />
high levels of faecal coliforms in the tributaries and Sg. Sarawak Proper as well<br />
as a major source contributing the organic matter and nutrients.<br />
It must be stressed that even if all septic tanks in Kuching were desludged regularly<br />
and functioning properly, the effect of reducing the load to the tribuatries<br />
and Sg. Sarawak Proper will be insignificant. Rough estimates of the discharge<br />
of BOD, Nitrogen and Phosphorous to Sg. Sarwak in the case of all septic tanks<br />
are not functioning and in case of all septic tanks are functioning optimally are<br />
presented in Fig. 61. The discharge of BOD will still be very high and the discharge<br />
of nitrogen and phosphorous are not reduced at all.<br />
kg/day<br />
5000<br />
4500<br />
4000<br />
3500<br />
3000<br />
2500<br />
2000<br />
1500<br />
1000<br />
500<br />
0<br />
BOD Nitrogen Phosphorous<br />
None functioning All functioning<br />
Figure 6.1. Estimated discharge to Sg. Sarawak of BOD, Nitrogen and Phosphorous<br />
in blackwater in case none of the septic tanks are functioning and in<br />
case all are functioning optimally. The estimates are based on the population<br />
size of 215,000 in the sub-catchment areas discharging to Sg. Sarawak and a<br />
generation of 20g BOD/person/day, 11g Nitrogen/person/day and 1,6 g Phosphorous/person/day<br />
and an efficiency of 30% removal of BOD in a functioning<br />
septic tank)<br />
There are some central treatment-facilities (mostly septic tanks and Imhoff<br />
tanks) servicing larger housing schemes. The locations of these are presented in<br />
Fig. 6.2.<br />
C:\Documents and Settings\user\Desktop\SUD-02-25 - River quality baseline study Vol.1 by Erling\final\River Quality Baseline main report.doc<br />
88
River Quality Baseline Study. Vol. 1<br />
6.2.4 Control and Enforcement Measures<br />
Presently, there are no active control and enforcement measures implemented<br />
for household discharge in Kuching. As mentioned above, septic tanks are<br />
pumped out at the request of the owners. However, there is no control on<br />
whether the tanks comply with the stipulated water quality standards or whether<br />
the two-year desludging period is complied with especially when the public<br />
awareness regarding septic tanks is quite low.<br />
6.2.5 Estimated Ttotal Load of Pollutants from Households<br />
The total load of different pollutants from households in the twelve subcatchment<br />
areas have been estimated based on the results of measurements on<br />
greywater from the households and the numbers of different households. Alternative<br />
estimates based on population size and estimated loads per person from<br />
the measurements in Kuching and European values were also elaborated. Estimated<br />
load from blackwater was based on European values. It was assumed<br />
that the blackwater is discharged untreatedly. Details are presented in Volume 2<br />
of the River Quality Baseline Study Report. The main findings are presented<br />
below.<br />
None of the households visited in the SUD study complied with the standards<br />
as stipulated in the Environmental Quality (Sewage and Industrial Effluents)<br />
Regulations, 1979. The levels in the outlets generally exceeded the standard A<br />
2-17 times for BOD, 1.1-11 times for COD and 1.5 times for TSS (Cf. Table<br />
6.3). Non-compliance with the standards is most likely the case for the bulk of<br />
the houses in Kuching as the sewage is not treated before discharge.<br />
C:\Documents and Settings\user\Desktop\SUD-02-25 - River quality baseline study Vol.1 by Erling\final\River Quality Baseline main report.doc<br />
89
River Quality Baseline Study. Vol. 1<br />
Table 6.3 Households. Results analysis of pollutants in greywater. The values<br />
are compared to the standards as stipulated in the Environmental Quality<br />
(sewage and industrial effluents) regulations, 1979. Figures in italic bold indicate<br />
values exceeding the Standard A and figure in bold also exceed the<br />
Standard B values.<br />
C:\Documents and Settings\user\Desktop\SUD-02-25 - River quality baseline study Vol.1 by Erling\final\River Quality Baseline main report.doc<br />
De-<br />
tached <br />
Semi-<br />
de-<br />
tached<br />
Terrace Kam-<br />
pung <br />
Squat-<br />
ter <br />
Stan-<br />
dard A<br />
Stan-<br />
dard B<br />
PH 6.6 9.6 6.7 7.9 6.4 6-9 5.5-9<br />
BOD, mg/l 43.0 159.0 333.0 114.0 47.0 20 50<br />
COD, mg/l 76.2 400.0 533.0 133.0 57.1 50 100<br />
TSS, mg/l 30.0 74.0 225.0 101.0 174.0 50 100<br />
NH 4-N mg/l 0.2 2.7 43.4 80.3 0.3<br />
Tot-N, mg/l 4.8 17.4 58.5 93.9 2.2<br />
Tot-P, mg/l 5.6 19.2 56.7 6.4 5.9<br />
Oil & Grease, mg/l 2.8
River Quality Baseline Study. Vol. 1<br />
Table 6.4 Households. Estimated loads of different pollutants from different<br />
catchment areas (kg/day) from both grey and blackwater.<br />
Catchment BOD<br />
South of Sg.<br />
Sarawak<br />
Kg/day<br />
COD<br />
Kg/day<br />
C:\Documents and Settings\user\Desktop\SUD-02-25 - River quality baseline study Vol.1 by Erling\final\River Quality Baseline main report.doc<br />
TSS<br />
Kg/day<br />
Tot N<br />
Kg/day<br />
Tot P<br />
Kg/day<br />
Bintangor-1 106-198 349-528 100-167 53-70 9-12<br />
Bintangor-2 199-299 595-797 178-253 80-105 17-18<br />
Bintangor-3 126-259 434-690 123-218 68-91 10-16<br />
Padungan 494-703 1452-1874 439-594 189-249 42<br />
Sekama 91-158 290-422 85-133 43-56 8-9<br />
Sekama 1 56-101 181-270 53-86 27-36 5-6<br />
Periok 20-33 63-89 18-28 9-12 2<br />
Biawak 71-126 229-337 66-107 34-44 6-8<br />
Bintawa 32-72 115-192 32-61 18-25 3-4<br />
Bintawa 1 286-536 942-1428 271-452 144-188 23-32<br />
Kudei 254-367 747-978 225-310 99-129 21-22<br />
Maong 2646-4239 8131-11303 2407-3579 1140-1488 219-254<br />
North of Sg.<br />
Sarawak<br />
Gita 216-402 709-.072 204-340 108-141 18-23<br />
Laruh 171-269 521-717 155-227 72-94 14-16<br />
Turong 40-61 120-163 36-52 16-21 3-4<br />
Sinjan 288-478 898-1.274 264-403 128-168 24-29<br />
Bedil 232-413 747-1.100 217-348 111-145 19-25<br />
Gersik 66-113 208-300 61-95 30-40 5-7<br />
Seman Lama 335-517 1.013-1.378 302-437 139-181 28-31<br />
Siol Kandis 1 179-337 591-899 170-285 91-118 15-20<br />
Siol Kandis 2 16-25 49-67 15-21 7-9 1-2<br />
Total 5925-9705 19927-25880 5421-8195 2610-3407 490-582<br />
6.3 Pollution from Food Outlets<br />
6.3.1 Types of Food Outlets and Types of Pollutants<br />
Food outlets comprise:<br />
Food centres with several different stalls serving food;<br />
Individual restaurants, coffee shops and fast food restaurants; and<br />
Markets.<br />
The most significant pollutants in wastewater, which have been chosen as indicators<br />
from food outlets are ammoniacal nitrogen, phosphorous, BOD, COD,<br />
TSS and Oil & Grease.<br />
91
River Quality Baseline Study. Vol. 1<br />
6.3.2 Estimated Number of Different Food outlets<br />
The SUD Project has estimated the number of different types of food outlets in<br />
the twelve catchment areas, which are discharging to Sg. Sarawak upstream of<br />
the barrage. The result is summarised in Table 6.5. The food centres and individual<br />
restaurants are mainly located at the south of Sg. Sarawak, mainly at the<br />
Sg. Maong and Sg. Padungan sub-catchment areas (Table 6.5). Large markets<br />
with more than 100 stalls are located in Bintangor 2, Bintangor 3, Padugan and<br />
Maong.<br />
Table 6.5 Number of different types of Food-outlets in different Subcatchment<br />
areas. Locations of the sub-catchment areas are indicated on Fig<br />
4.3 in section 4.1<br />
Catchment Food Center Individual<br />
South of Sg.<br />
Sarawak<br />
Restaurants,<br />
Coffee Shops<br />
and Fast Food<br />
Restaurants<br />
Big Markets<br />
(more than<br />
100 stalls)<br />
C:\Documents and Settings\user\Desktop\SUD-02-25 - River quality baseline study Vol.1 by Erling\final\River Quality Baseline main report.doc<br />
Medium<br />
Markets (Be-<br />
tween 50 and<br />
100 stalls)<br />
Small Mar-<br />
kets<br />
(Less than 50<br />
Bintangor 1 - - - - -<br />
Bintangor 2 1 48 2 1 -<br />
Bintangor 3 2 88 1 2 -<br />
Padugan 2 108 2 - -<br />
Sekama - 73 - - -<br />
Sekama 1 - 6 - - -<br />
Periok - 16 - - -<br />
Biawak 1 22 - 1 -<br />
Bintawa - 8 - - -<br />
Bintawa 1 - - - - 1<br />
Kudei 1 8 - - 1<br />
Maong 1 131 1 - -<br />
North of Sg.<br />
Sarawak<br />
Gita 1 - - - -<br />
Laruh 1 - - - -<br />
Turong - - - - -<br />
Sinjan - 4 - - 1<br />
Bedil - - - - -<br />
Gersik - - - - -<br />
Seman Lama - - - - -<br />
Siol Kandis 1 - - - - -<br />
Siol Kandis 2 - - - - -<br />
Total 10 512 6 4 3<br />
stalls)<br />
92
River Quality Baseline Study. Vol. 1<br />
6.3.3 Treatment Facilities and Draining Systems<br />
The food outlets discharge wastewater to the open drains in the city. Most food<br />
outlets discharge untreated water while have equipped with some form of<br />
treatment facilities. The treated water from such facilities is also discharged to<br />
the drain. Treatment facilities include:<br />
Crude devices in the form of steel basins, which serves to trap oil and<br />
grease and collect solid food residues washed down from the kitchen sinks<br />
in restaurants;<br />
Filtration systems consisting of “sponge-like” filter material installed at the<br />
bottom of the washing sink of restaurants to trap large solid food residues<br />
washed into the sink‟s piping system; and<br />
Grease traps installed at the outlet to the peripheral drains.<br />
The Sg. Bintangor study (SUD-02-09) indicated that the grease traps are generally<br />
not functioning because they were not emptied and in the case they are actually<br />
emptied, it seemed that this generally took place in the drain downstream<br />
of the trap.<br />
At present, information on numbers of food outlets with treatment facilities is<br />
not available.<br />
6.3.4 Control and Enforcement Measures<br />
Presently, the Local Councils spend huge resources in cleaning the oil and<br />
grease in the drains downstream of food outlets.<br />
6.3.5 Estimated Total Load of Pollutants from Food Outlets<br />
The total load of different pollutants from different types of food outlets in the<br />
twelve sub-catchment areas have been estimated based on the results of measurements<br />
on wastewater from different types of outlets and the estimated number<br />
of different types of food outlet. Details are presented in Volume 2 of the<br />
River Quality Baseline Study Report. The main findings are presented below.<br />
The greywater from the food outlets investigated in this study does not comply<br />
with the standards as stipulated in the Environmental Quality (Sewage and Industrial<br />
Effluents) Regulation, 1979 (Table 6.6). The levels in the outlets generally<br />
exceed the Standard A:<br />
13-42 times for BOD;<br />
2-21 times for COD; and<br />
2-7 times for TSS.<br />
C:\Documents and Settings\user\Desktop\SUD-02-25 - River quality baseline study Vol.1 by Erling\final\River Quality Baseline main report.doc<br />
93
River Quality Baseline Study. Vol. 1<br />
Compliance for the food centre, coffee shop and market could not be expected,<br />
as the water is not treated in any way before discharge. The restaurant has a collection<br />
basin after outlet from kitchen sink and the fast food restaurant has a<br />
filtration system after the outlet from kitchen sink. These systems are not sufficient<br />
for a proper wastewater treatment.<br />
Table 6.6 Food outlets. Results of pollutants in wastewater. The values are<br />
compared to the standards as stipulated in the Environmental Quality (sewage<br />
and industrial effluents) regulations, 1979. Figures in italic bold indicate<br />
values exceeding the Standard A and figure in bold also exceed the Standard<br />
B values.<br />
Food<br />
Centre<br />
Restau-<br />
C:\Documents and Settings\user\Desktop\SUD-02-25 - River quality baseline study Vol.1 by Erling\final\River Quality Baseline main report.doc<br />
rant<br />
Coffee<br />
Shop<br />
Fast-<br />
food<br />
Market Stan-<br />
dard A<br />
Stan-<br />
dard B<br />
PH 6.8 6.2 8.0 7.9 6.0 6-9 5.5-9<br />
BOD, mg/l 660 833 278 390 260 20 50<br />
COD, mg/l 676 1,040 405 624 295 50 100<br />
TSS, mg/l 372.0 268.0 90.7 220.0 110.0 50 100<br />
NH 4-N, mg/l 0.26 67.10 0.15 0.13 12.6<br />
Tot-N, mg/l 8.34 0.43 1.84 16 26.5<br />
Tot-P, mg/l 8.72 2.68 3.62 1.73 9.22<br />
O&G, mg/l 124.0 2.14 12.0 155.0 17.8 n.d 10<br />
The estimates of the discharge of pollutants are presented in Table 6.7. The<br />
highest pollution load is discharged from the Padungan sub-catchment area followed<br />
by Maong, Bintangor 3 and Bintangors.<br />
94
River Quality Baseline Study. Vol. 1<br />
Table 6.7 Food-outlets. Estimated loads of different pollutants from food outlets<br />
in the different catchment areas (kg/day).<br />
Catchment BOD COD<br />
South of Sg.<br />
Sarawak<br />
C:\Documents and Settings\user\Desktop\SUD-02-25 - River quality baseline study Vol.1 by Erling\final\River Quality Baseline main report.doc<br />
TSS<br />
Tot N<br />
Bintangor-1 0 0 0 0 0<br />
Bintangor-2 122.4 146 50 9 3<br />
Bintangor-3 124 156 50 7 3<br />
Padungan 153 192 62 8 3<br />
Sekama 51 71 20 1 0<br />
Sekama 1 4 6 2 0 0<br />
Periok 11 16 4 0 0<br />
Biawak 28.4 35 11 1 1<br />
Bintawa 6 8 2 0 0<br />
Bintawa 1 4 4 2 0 0<br />
Kudei 10 13 4 0 0<br />
Maong 131 171 52 5 2<br />
North of Sg.<br />
Sarawak<br />
Gita 0.4 0 0 0 0<br />
Laruh 0.4 0 0 0 0<br />
Turong 0 0 0 0 0<br />
Sinjan 7 8 3 0 0<br />
Bedil 0 0 0 0 0<br />
Gersik 0 0 0 0 0<br />
Seman Lama 0 0 0 0 0<br />
Siol Kandis 1 0 0 0 0 0<br />
Siol Kandis 2 0 0 0 0 0<br />
Total 651.4 827 263 33 12<br />
6.4 Pollution from Industries<br />
6.4.1 Types of Industries and Types of Pollutants<br />
There are three main industrial estates in Kuching:<br />
Tot P<br />
Pending Industrial Estate. This estate comprises industries of food processing,<br />
wood ,wood/cork processing, furniture manufacturing, chemical<br />
products and plastic product processing;<br />
Demak Laut Industrial Park at the north of the Barrage. This estate comprises<br />
industries of wood and wood/cork processing, furniture manufacturing<br />
and food processing;<br />
Sama Jaya Free Industrial Zone. This estate is dominated by electronics<br />
industries.<br />
95
River Quality Baseline Study. Vol. 1<br />
In addition to the large industrial estates, small workshops (such as automobile<br />
and garage shops) are distributed all over the city especially to the south of Sg.<br />
Sarawak (Cf. Section 6.4.5, Table 6.10).<br />
The industries generate a wide variety of pollutants. Table 6.8 provides an<br />
overview of typical pollutants from different types of industries.<br />
Table 6.8 Overview of types of wastewater pollutants produced by different<br />
types of industries in Kuching.<br />
Point Sources Type Pollutants Indicators<br />
Workshops<br />
Printing<br />
Food Processing<br />
Rubber Processing<br />
Metal Industry<br />
Electronics /<br />
Semi-Conductors<br />
Industry<br />
Ceramic process-<br />
ing<br />
Glue Manufactur-<br />
ing<br />
Batteries Manu-<br />
facturing<br />
Paint Industry<br />
Repair Shops, Ga-<br />
rages<br />
Paper mill, News-<br />
Oil and Grease, Spent<br />
Solvents, etc<br />
C:\Documents and Settings\user\Desktop\SUD-02-25 - River quality baseline study Vol.1 by Erling\final\River Quality Baseline main report.doc<br />
print<br />
Noodles, Biscuit,<br />
Seafood, Poultry,<br />
Soy Sauce, Canning,<br />
Beverages, etc<br />
Smoked Rubber<br />
Sheet<br />
Spent solvents, wasted<br />
ink<br />
Wash water, Effluent<br />
wastewater<br />
pH, Oil and Grease, TSS,<br />
Colour<br />
Colour, COD, TSS, Chlo-<br />
rine, Chromium, Barium,<br />
Silver<br />
pH, Oil & Grease, COD,<br />
BOD, TSS, Nitrogen,<br />
Phosphorus, Colour.<br />
Effluent Wastewater pH, TSS, BOD, COD,<br />
Steel Manufacturing Spent acid, spent sludge,<br />
Aluminium Extru-<br />
sion<br />
Galvanising (Zinc &<br />
Nickel)<br />
Microchips, Printed<br />
Circuit Board, etc<br />
Floor Tile, Wall<br />
Tile, Sanitary Fix-<br />
tures<br />
Adhesives for ply-<br />
wood<br />
Assembly of batter-<br />
ies<br />
Water-base Paint,<br />
Solvent Paint<br />
rinse water<br />
Spent Solvent, spent<br />
acid, wash water<br />
Wash water, effluent<br />
wastewater<br />
Nitrogen<br />
pH, COD, TSS, Oil and<br />
Grease, Lead, Arsenic,<br />
Zinc, Iron, Chromium,<br />
Aluminium, Manganese<br />
pH, COD, TSS, Nickel,<br />
Chromium III and V, Tin,<br />
Lead, Aluminium, Sul-<br />
phate<br />
pH, COD, TSS, Nickel,<br />
96<br />
Chromium III and V, Iron,<br />
Lead, Zinc<br />
pH, COD, TSS, Lead,<br />
Tin, Nickel, Copper, Zinc,<br />
Cadmium, Selenium,<br />
Arsenic, AOX.<br />
TSS, Colour, COD, Iron,<br />
Lead, Zinc, Cadmium<br />
Wash water, spillage pH, phenol, formalde-<br />
Spent acid, spent<br />
sludge/slurry<br />
Spent Solvent, Spent<br />
Sludge, Rinse Water<br />
hyde, urea, methanol<br />
pH, TSS, COD, Lead,<br />
Sulphate<br />
pH, COD, TSS, Oil and<br />
Grease, Lead, Nickel,<br />
Copper, Zinc, Cadmium.
River Quality Baseline Study. Vol. 1<br />
6.4.2 Estimated Number of Different Types of Industries<br />
The SUD Project has estimated the number of different types of industries in<br />
the twelve catchment areas, which are discharging to Sg. Sarawak upstream of<br />
the barrage. This area includes only the industrial estate at Pending. The industrial<br />
estates: Demak Laut Industrial Park and Semajaya Free Industrial Zone are<br />
not included.<br />
The results of the estimate are summarised in Table 6.9. The industries are<br />
clearly concentrated in the Pending area (i.e. sub-catchment areas: Sekama 1,<br />
Periok, Biawak, Bintawa, Bintawa 1). Most of the industries in the Pending<br />
area are SMIs, which are engaged in food processing (baking, canning, beverage<br />
production, preserving of fish and crustacean); wood processing, printing<br />
and metal works (aluminium extrusion, steel manufacturing and galvanising).<br />
Table 6.9 Number of different types of Industries in different Sub-catchment<br />
areas<br />
Catchment Printing Food proc-<br />
South of Sg.<br />
Sarawak<br />
essing<br />
Rubber<br />
processing<br />
C:\Documents and Settings\user\Desktop\SUD-02-25 - River quality baseline study Vol.1 by Erling\final\River Quality Baseline main report.doc<br />
Alumi-<br />
nium<br />
Steel Galvanis-<br />
Bintangor 1 - - - - -<br />
Bintangor 2 - - - - -<br />
Bintangor 3 - - - - -<br />
Padugan 2 - - - -<br />
Sekama - - - - -<br />
Sekama 1 1 2 1 - -<br />
Periok 1 5 1 - -<br />
Biawak 4 17 13 2 6 1<br />
Bintawa 5 2 - 2 2 -<br />
Bintawa 1 3 61 3 2 5 3<br />
Kudei - - - - - -<br />
Maong - 6 - - 5 2<br />
North of Sg.<br />
Sarawak<br />
Gita - - - - - -<br />
Laruh - - - - - -<br />
Turong - - - - - -<br />
Sinjan - - - - - -<br />
Bedil - - - - - -<br />
Gersik - - - - - -<br />
Seman Lama - - - - - -<br />
Siol Kandis 1 - - - - - -<br />
Siol Kandis 2 - - - - - -<br />
Total 16 93 18 6 18 6<br />
ing<br />
97
River Quality Baseline Study. Vol. 1<br />
Table 6.10 Number of different types of Industries in different Subcatchment<br />
areas.<br />
Catchment Wood<br />
process-<br />
C:\Documents and Settings\user\Desktop\SUD-02-25 - River quality baseline study Vol.1 by Erling\final\River Quality Baseline main report.doc<br />
ing<br />
Ceramic<br />
process-<br />
ing<br />
Batteries<br />
manu-<br />
facturing<br />
Paper<br />
Mills<br />
Work-<br />
shops<br />
Petrol<br />
stations<br />
Bintangor 1 - - - - 2 1 3<br />
Bintangor 2 - - - - 28 - 34<br />
Bintangor 3 - - - - 23 - 24<br />
Padugan 12 - - - 131 9 31<br />
Sekama 1 - - - 113 1 1<br />
Sekama 1 3 - - - 2 - 2<br />
Periok 12 - - - 47 1 2<br />
Biawak 8 2 2 1 22 - 2<br />
Bintawa 10 - - - - - 3<br />
Bintawa 1 49 - 2 - 11 - 7<br />
Kudei 2 - - - 2 - 2<br />
Maong 38 4 - - 135 14 53<br />
Gita - - - - 3 1 4<br />
Laruh - - - - 17 3 3<br />
Turong - - - - 3 - -<br />
Sinjan - - - - 2 1 8<br />
Bedil - - - - - - 5<br />
Gersik - - - - - - 3<br />
Seman Lama - - - - - - 2<br />
Siol Kandis 1 - - - - - - 1<br />
Siol Kandis 2 - - - - - - -<br />
Others<br />
Total 135 6 4 1 551 31 521<br />
6.4.3 Treatment Facilities and Draining Systems<br />
Many Industries would have a wastewater treatment system in place. However,<br />
there are quite a few industries without any or insignificant wastewater treatment.<br />
Presently, data on number of industries with a proper wastewater treatment<br />
system and number of industries without is not available. An overview of<br />
treatment facilities at the industries visited during the SUD field study is presented<br />
in the Volume 2 of the River Quality Baseline Study Report.<br />
6.4.4 Control and Enforcement Measures<br />
Currently, the enforcement with regards to compliance to the Environmental<br />
Quality Act 1974 (EQA) Standards is carried out by the Department of Environment<br />
(DOE) who conducts regular sample collection and analysis of the following<br />
industries:<br />
Industries discharging more than 60 m 3 wastewater per day or where the<br />
total load of BOD in effluents exceed 6 kg per day;<br />
98
River Quality Baseline Study. Vol. 1<br />
Industries involved in processing of oil palm fruit; and<br />
Industries involved in the processing of rubber.<br />
The industries regulated by DOE only constitute a minor fraction of the total<br />
number of industries situated in Kuching.<br />
6.4.5 Estimated Total Load of Pollutants from Industries<br />
The total load of different pollutants from different types of industries in the<br />
twelve sub-catchment areas have been estimated based on results of the measurements<br />
on wastewater from different types of outlets and the estimated number<br />
of different types of industries. Details are presented in Volume 2 of the<br />
River Quality Baseline Study Report. The main findings are presented below.<br />
It was found that the wastewater from the industries with treatment facilities<br />
generally complies with the standards as stipulated in the Environmental Quality<br />
Regulation. This clearly showed at the visited cases for steel-, aluminium-,<br />
galvanising-, rubber-, beverage- and seafood- industries as well as the slaughterhouse.<br />
On the other hand, the wastewaters from the industries without treatment<br />
systems significantly violate the standards especially for the parameters of<br />
BOD, COD TSS, Oil & Grease. This is conformed to the case for the ceramic-,<br />
the paint- and the printing industries.<br />
The highest load is of pollutants from industries is unsurprisingly from the<br />
catchment areas in Pending (Sekama1, Periok, Biawak, Bintawa, Bintawa 1)<br />
followed by Padungan and Maong (Table 6.11).<br />
C:\Documents and Settings\user\Desktop\SUD-02-25 - River quality baseline study Vol.1 by Erling\final\River Quality Baseline main report.doc<br />
99
River Quality Baseline Study. Vol. 1<br />
Table 6.11 Industries. Estimated loads of different pollutants from industries<br />
in the different catchment areas (kg/day).<br />
Catchment BOD COD<br />
South of Sg. Sara-<br />
wak<br />
C:\Documents and Settings\user\Desktop\SUD-02-25 - River quality baseline study Vol.1 by Erling\final\River Quality Baseline main report.doc<br />
TSS<br />
Tot N<br />
Bintangor-1 0 0 0 0 0<br />
Bintangor-2 0 0 0 0 0<br />
Bintangor-3 0 0 0 0<br />
Tot P<br />
Padungan 0.14 0.23 0.061 0.021 0.0084<br />
Sekama 0 0 0 0 0<br />
Sekama 1 0.26 0.74 0.53 0.12 0.0676<br />
Periok 0.43 1.26 0.79 0.25 0.1606<br />
Biawak 3.76 10.39 18.60 1.18 0.628<br />
Bintawa 1.61 6.63 8.33 0.21 0.099<br />
Bintawa 1 4.12 13.67 7.44 3.11 2.018<br />
Kudei 0 0 0 0 0,00000<br />
Maong 3.30 6.92 24.99 0.45 0.303<br />
South of Sg. Sara-<br />
wak<br />
Gita 0 0 0 0 0<br />
Laruh 0 0 0 0 0<br />
Turong 0 0 0 0 0<br />
Sinjan 0 0 0 0 0<br />
Bedil 0 0 0 0 0<br />
Gersik 0 0 0 0 0<br />
Seman Lama 0 0 0 0 0<br />
Siol Kandis 1 0 0 0 0 0<br />
Siol Kandis 2 0 0 0 0 0<br />
Total 13.62 39.85 60.75 5.33 3.285<br />
6.5 Pollution from Agriculture<br />
6.5.1 Types of Agricultural Activity and Types of Pollutants<br />
One of the main sources of pollution from agriculture is from livestock farming,<br />
particularly from pig farms.<br />
Based on the list from the NREB Livestock Unit, there are currently fifty-nine<br />
pig farms within the Kuching, Serian, Bau and Samarahan regions. The standing<br />
pig population is about 61,000.<br />
Pollutants, which have been chosen for indicators for pig farms, include BOD,<br />
COD, TSS, Tot-N, Amm-N, Phosphorus, Faecal Coliforms and Total Coliforms.<br />
100
River Quality Baseline Study. Vol. 1<br />
Other sources of pollution from agriculture include oil palm plantations and<br />
horticulture farms upstream of Kuching. Pollutants from these include nutrients<br />
(fertilisers) and pesticides. At present, there is no available information on the<br />
amount of agrochemicals used or discharged.<br />
6.5.2 Treatment Facilities and Draining Systems<br />
The wastewater from most pig farms in the Kuching area is treated in a two-<br />
pond system, in which organic matter is digested by anaerobic bacteria in one<br />
pond and by aerobic bacteria in the other. These ponds are normally constructed<br />
from earth and are generally rectangular in shape, with dimensions of<br />
typically about 10m x 12m each for a farm with a standing pig population<br />
(SPP) of about 1,000-2,000.<br />
Farmers who do not have sufficient space for the two-pond system use other<br />
treatment methods. Among the ones more commonly used are the solid-liquid<br />
slurry separator machines which separates the solids from the liquids of the<br />
wastewater from the pig farms. This technology is not very efficient in degrading<br />
organic matter.<br />
None of the systems are very efficient. One major problem being that is the<br />
sludge ultimately ends up in the river.<br />
6.5.3 Control and Enforcement Measures<br />
Currently the enforcement with regards to compliance to the Natural Resources<br />
and Environment (Control of Livestock Pollution) Rules, 1996 is carried out by<br />
the Natural Resources and Environment Board (NREB). NREB receives two<br />
reports from licensed pig farms each year. The concentrations of BOD, COD<br />
and TSS in the discharge must be reported and certain limits in three successive<br />
phases must be complied with (Cf. Table 6.12). In addition, NREB carries out<br />
their own sampling and analysis of water from the ponds at licensed and unlicensed<br />
pig farms.<br />
Table 6.12 Water quality standards for wastewater from pig farms<br />
Permitted concentration in discharge from<br />
existing farms<br />
Phase 1 Phase 2 Phase 3<br />
BOD, mg/l 1.300 250 50<br />
COD, mg/l 2.500 1.000 500<br />
TSS, mg/l 1.500 300 100<br />
Permitted concentration in discharge from<br />
new farms:<br />
Phase 1 Phase 2 Phase 3<br />
BOD, mg/l 500 250 50<br />
COD, mg/l 2.500 1.000 500<br />
TSS, mg/l 1.500 300 100<br />
C:\Documents and Settings\user\Desktop\SUD-02-25 - River quality baseline study Vol.1 by Erling\final\River Quality Baseline main report.doc<br />
101
River Quality Baseline Study. Vol. 1<br />
6.5.4 Pollutant Concentration in Wastewater from Pig Farms<br />
Table 6.13 shows the results of NREB analysis of pond water from different pig<br />
farms in the Kuching area. In most cases, the pig farms recorded marginally<br />
comply with the Phase 3 discharge limit posed by the legislation (Cf. Table<br />
6.12 and Table 6.13). Most of the farms however, comply with the Phase 2 discharge<br />
limits.<br />
Table 6.13 Results of NREB measurements of concentrations of BOD, COD<br />
and TSS in water collected from wastewater ponds at pig farms upstream of<br />
Kuching.<br />
Standing Pig<br />
Population<br />
BOD (mg/l) COD (mg/l) TSS (mg/l)<br />
1 89 69 69 123<br />
2 80 0 0 0<br />
3 2000 515 3400 500<br />
4 200 45 164 55<br />
5 1600 40 132 38<br />
6 200 17 82 60<br />
7 300 219 952 760<br />
8 500 23 126 100<br />
9 305 47 246 75<br />
10 1220 59 278 135<br />
11 150 10 10 10<br />
12 800 169 636 300<br />
13 150 23 74 230<br />
14 1800 25 58 170<br />
15 300 0 0 0<br />
16 5000 120 354 158<br />
17 1200 0 0 0<br />
18 2000 31 60 180<br />
19 200 117 224 130<br />
20 1200 97 462 160<br />
21 3200 137 434 105<br />
22 2000 90 528 170<br />
23 1500 30 108 65<br />
24 3000 0 0 0<br />
25 300 137 348 293<br />
26 1100 11 58 320<br />
27 500 51 60 45<br />
28 1500 143 510 215<br />
29 1500 51 278 105<br />
30 na na na na<br />
31 500 117 224 130<br />
32 800 49 208 100<br />
333 700 51 186 55<br />
34 1200 33 74 590<br />
35 300 25 70 40<br />
36 280 39 222 120<br />
C:\Documents and Settings\user\Desktop\SUD-02-25 - River quality baseline study Vol.1 by Erling\final\River Quality Baseline main report.doc<br />
102
River Quality Baseline Study. Vol. 1<br />
Table 6.13 continued<br />
Standing Pig<br />
Population<br />
BOD (mg/l) COD (mg/l) TSS (mg/l)<br />
37 180 99 300 140<br />
38 2500 105 264 118<br />
39 150 35 202 80<br />
40 350 507 1198 530<br />
41 500 67 252 1350<br />
42 3500 50 152 235<br />
43 1000 16 72 21<br />
44 1500 67 316 77<br />
45 2500 75 126 75<br />
46 1500 100 338 235<br />
47 60 na na na<br />
48 1500 16 84 98<br />
49 300 59 124 86<br />
50 800 219 952 760<br />
51 800 168 374 165<br />
52 800 89 302 210<br />
53 500 62 274 85<br />
54 300 18 174 12<br />
55 1800 20 74 70<br />
56 2500 26 214 95<br />
There is no information on flow of wastewater from the pig farms. Therefore, it<br />
is not possible to estimate the total load from the farms as for households, food<br />
outlets and industries.<br />
According to the NREB records, the standing pig population in the Kuching<br />
area is about 61,000. According to Danish experience, one pig produces as<br />
much as 200g BOD/day. This is 3-4 times more than the amount produced by<br />
humans. The total amount of BOD produced by pigs in the Kuching area can<br />
thus be estimated at some 12,000 kg BOD/day, which is of the same magnitude<br />
as the amount of BOD estimated to be discharged from households in Kuching<br />
(exclusive of the households in the Sg. Kuap catchment). Some reduction of<br />
BOD levels takes place in the treatment ponds, consequently, the amount of<br />
organic pollutants discharged to the river would be smaller than the 12,000 kg<br />
BOD/day. However, it would seem that pig farms are the significant source of<br />
pollution of organic and faecal bacteria to the river system.<br />
6.6 Other Sources of Pollution<br />
Other sources of pollution to the river include: Hospitals and clinics, shopping<br />
centres, large commercial buildings, river vessels, port, dockyards and ship repair<br />
areas along Sg. Sarawak. These sources are less importance compared to<br />
those described above.<br />
C:\Documents and Settings\user\Desktop\SUD-02-25 - River quality baseline study Vol.1 by Erling\final\River Quality Baseline main report.doc<br />
103
River Quality Baseline Study. Vol. 1<br />
Hospitals and clinics<br />
Hospitals and clinics generally have their own sewage treatment systems.<br />
Clinical waste (infectious refuse, bodily parts and organs, blood supplies, transfusion<br />
bags, disposable syringes, expired medicines, used chemicals, bandaging<br />
materials, etc) is incinerated and is not discharged to the river.<br />
Shopping centres, large commercial buildings and hotels<br />
Large establishments such as shopping centres, which mainly comprise various<br />
types of commercial businesses ranging from textile vendors, hairdresing saloons,<br />
electronics shops produced varied liquid waste. Other than sewage from<br />
the septic tanks, other types of waste which are water-based include chemicals<br />
used in cleaning floors and windows, used aerosol cans, fluorescent tubes and<br />
other mercury-containing waste, used batteries, solvents, ink residues, dyes, etc.<br />
Most hotels have their own treatment systems. Many commercial buildings that<br />
have their own treatment facilities (mostly septic tanks) are often inducing considerable<br />
pollution problems locally, and often give rise to complaints from<br />
neighbours due to the odour. The septic tanks are not regularly maintained and<br />
as mentioned above, septic tanks are not very efficient even when they function<br />
properly.<br />
River vessels, port, dockyards and ship repair areas<br />
Liquid waste from river vessels mainly oil and grease-based and is mostly produced<br />
onboard during machinery or engine servicing/maintenance works and<br />
fuel refilling at the docks. Unused fuels are kept in metal drums and stored on<br />
board the ships (for those with the capacity to do so) or at the docks. It is assumed<br />
that used fuel is discarded off the vessels into drums and stored at the<br />
docks or storage areas. Paint substances would be related to repair works conducted<br />
at the dry docks.<br />
Mining areas<br />
Within the Kuching region, the main mining activities are associated with limestone<br />
and sand mining (for the cement and construction industry) and loam/clay<br />
mining for brick-production industry. These areas are located mostly south and<br />
south-west of the city towards Bau-Serian areas. In Bau, there are abandoned<br />
gold mines and presently no active ones. There is presently no record of any<br />
mining waste within Kuching City. From the limestone and loam/clay mining<br />
activity, the types of waste generated would mainly be solid waste in the form<br />
of fine dust and debris, soil erosion effects and sedimentation into waterways<br />
and nearby streams/rivers. There are indications that sediments polluted by<br />
heavy metals in the gold mining areas in the past that may be transported downstream<br />
of the river (Cf. Section 5.3)<br />
C:\Documents and Settings\user\Desktop\SUD-02-25 - River quality baseline study Vol.1 by Erling\final\River Quality Baseline main report.doc<br />
104
River Quality Baseline Study. Vol. 1<br />
INSERT NEW MAP FROM DAYA RANCANG<br />
Fig 6.2. Location of housing schemes connected to centralised treatment systems and commercial buildings, government buildings, hospitals, hotels<br />
etc, with own treatment systems.<br />
C:\Documents and Settings\user\Desktop\SUD-02-25 - River quality baseline study Vol.1 by Erling\final\River Quality Baseline main report.doc<br />
105
River Quality Baseline Study. Vol. 1<br />
6.7 Other Sources of River Quality Deterioration<br />
In addition to the discharge of pollutants, the spillage and discharge of soil due<br />
to logging, dredging and transportation of sand by barges and construction of<br />
roads and highways and landclearing for plantation and urban projects are potentially<br />
affect the river quality. In addition, the presence of the barrage may<br />
have a deleterious impact on the river quality.<br />
Logging activity<br />
Most logging activities operated upstream are located far from the Sg. Sarawak<br />
catchment, therefore, impacts from such activity is minimal, if any. There may<br />
be logging activities at the areas bordering Kalimantan, however at this stage,<br />
there is no record available. For the State of Sarawak, the most affected river<br />
systems are those located towards the north and north-east, i.e. Batang Rajang<br />
in Sibu and Sg. Baram in Miri. Logging activities would generally impact river<br />
water quality in terms of the accumulation of runoff from soil erosion forming<br />
sediments, which flow into the streams, rivers and existing waterways.<br />
Transportation of extracted sand by barges downstream<br />
Extraction of sand from the riverbed and transportation of the sand is one of the<br />
potential contributers to increase in sedimentation levels in the river. This is<br />
mainly due to small spillage, which occurs during extraction from the river bottom<br />
and during travelling from the extraction point to the final destination, located<br />
further downstream and/or outside of the barrage area. Wind-blown sand<br />
for instance from the uncovered top of the sand-carrying barrage would settle<br />
onto the river banks and river bed at any location along the river during the occurrence<br />
of strong winds and in time, the cumulative effect would be such that<br />
sediment levels will rise at these locations.<br />
Construction of roads, clearing for plantations and urban development<br />
Construction of roads, clearing for plantations and urban development located<br />
along tributaries of Sg. Sarawak or along Sg. Sarawak itself has the potential<br />
contributing sedimentation of soil runoff due to surface erosion from rainfall<br />
effects. The construction of the Borneo Heights Road Project, for example,<br />
which approximately 25 km and located close to the upstream tributaries of Sg.<br />
Sarawak Kiri (Sg. Abang, Sg. Semadang and Sg. Temurang), would have also<br />
contributed to the potential increase in sedimentation in the streams and eventually<br />
in the river. Runoff from the construction areas reaches the tributary<br />
streams via a network of roadside and cascading drain system installed for the<br />
road project. Another recent project is work-in-progress of the road built almost<br />
parallel to the Sg. Sarawak northern bank, i.e. Petra Jaya region. The construction<br />
of this road would presumably has some impacts on the sedimentation levels<br />
of the river, particularly in relation to surface runoffs during rainfall.<br />
Effect of the Barrage<br />
Kuching Barrage Management is currently operating a flushing scheme to mitigate<br />
environmental impacts of the barrage. Potential impacts, which are miti-<br />
C:\Documents and Settings\user\Desktop\SUD-02-25 - River quality baseline study Vol.1 by Erling\final\River Quality Baseline main report.doc<br />
106
River Quality Baseline Study. Vol. 1<br />
gated by the flushing scheme, are discussed in various previous sections. They<br />
are:<br />
Reduction of saltwater intrusion and river flow velocity;<br />
Increase of sedimentation of suspended matter due to reduction of flow velocities<br />
Increased risk of oxygen depletion and accumulation of organic material,<br />
nutrients and bacteria upstream of the barrage;<br />
Risk of impacts on mangroves and nipah forests due to the decreased salinity;<br />
Risk of reduction of the stock of the giant freshwater prawn which is an<br />
important commercial species, due to blocking of migration routes to and<br />
from spawning and nursery grounds downstream of the barrage; and<br />
Reduction of the population and catch of marine and brackish water species<br />
fish in the river due to reduced salinity.<br />
Should the flushing scheme for some reason be inadequate in the future, there<br />
is a risk that measures to improve the water quality may be affected by the<br />
presence of the barrage. The interpretations of state indicators in the EMS<br />
should therefore always be related to the operation of the barrage.<br />
C:\Documents and Settings\user\Desktop\SUD-02-25 - River quality baseline study Vol.1 by Erling\final\River Quality Baseline main report.doc<br />
107
River Quality Baseline Study. Vol. 1<br />
7 Discussion and Conclusion<br />
7.1 Degree of Pollution<br />
The baseline study has documented that the tributaries of Sg. Sarawak situated<br />
in Kuching City and Sg. Sarawak fronting Kuching are significantly polluted.<br />
The major problems are serious pollution with faecal-derived coliform bacteria<br />
and pollution with organic matter, leading to oxygen deficiency, deleterious<br />
impact on bottom fauna and offensive odour. The source of the pollution is untreated<br />
and insufficiently treated sewage and wastewater, which is discharged<br />
directly to the open drains in the city.<br />
The water qualities of different zones of the entire river system have been classified<br />
according to the Malaysian Interim National Quality Standards<br />
(INQWS). A summary of the results of classification is presented below.<br />
The water qualities in the tributaries Sg. Maong, Sg. Bintangor, Sg. Padungan<br />
Sg.Sekama and Sg. Tabuan in the city are very poor and fall between<br />
class IV and class V of the INWQS standards.<br />
The water quality in the stretch of the main Sg. Sarawak Proper. The water<br />
can be classified as class III in terms of physico-chemical parameters.<br />
However, in terms of bacteriological parameters, the water is only class V.<br />
The water quality in Sg. Sarawak upstream of Kuching, including Sg. Sarawak<br />
Kiri and Kanan is quite good and generally complies with class<br />
IIA/IIB in terms of physico-chemical parameters. However, the water does<br />
not meet the class IIB standards for faecal-derived bacteria.<br />
7.2 Sources<br />
From the results of the pollutant load estimation exercise carried out for household,<br />
food outlets and industry in the previous section, a comparison of their<br />
combined yearly loading were made to assess their respective contribution to<br />
the pollutant load of Sg. Sarawak and tributaries.<br />
Table 7.1 presents an overview of the estimated total loads of pollutants to Sg.<br />
Sarawak and tributaries from households, food outlets, industries and others.<br />
C:\Documents and Settings\user\Desktop\SUD-02-25 - River quality baseline study Vol.1 by Erling\final\River Quality Baseline main report.doc<br />
108
River Quality Baseline Study. Vol. 1<br />
Untreated sewage from households is identified as the most significant source<br />
of pollution as a whole. The loads of BOD, COD, TSS, Tot-N, Tot-P and oil<br />
and grease from households are orders of magnitude larger than the loads from<br />
food outlets (markets, food centres, restaurants etc.), industries and other<br />
sources.<br />
Food outlets (restaurants, markets etc.) are, however, the significant local<br />
source of pollution in the central business centre immediately south of Sg. Sarawak.<br />
In sub-catchment areas Bintangor 2, Bintangor 3, Padungan, Periok and<br />
Biawak, 20-40% of the BOD load and as much as 71-83% of the load of oil and<br />
grease are discharged from food outlets. In Sekama and Bintawa, 83 and 71%<br />
of the oil and grease are from food outlets (Table 7.3, 7.4 and Fig. 7.1).<br />
Presently, the Local Councils spend huge resources in these areas cleaning the<br />
oil and grease in the drains downstream of food outlets due to inadequate<br />
treatment facilities at the food outlets.<br />
Table 7.1 Estimated loads of pollutants to Sg. Sarawak and tributaries from<br />
different types of sources in Kuching. (Rounded figures)<br />
Households Food outlets<br />
(Markets, Food cen-<br />
tres, Restaurants etc)<br />
C:\Documents and Settings\user\Desktop\SUD-02-25 - River quality baseline study Vol.1 by Erling\final\River Quality Baseline main report.doc<br />
Industries<br />
BOD kg/day 5900-9700 650 15<br />
COD kg/day 19900-26000 800 40<br />
TSS kg/day 5400-8000 260 60<br />
Tot-N kg/day 2600-3400 30 5<br />
Tot-P kg/day 500-600 10 3<br />
Oil & grease kg/day 200-350 60 2<br />
Pb kg/day - - 0.02<br />
Cd kg/day - - 0.002<br />
Cu kg/day - - 0.01<br />
Zn kg/day - - 0.7<br />
Fe kg/day - - 0.9<br />
Mn kg/day - - 0.07<br />
Al kg/day - - 0.9<br />
AOX kg/day - - 0.009<br />
109
River Quality Baseline Study. Vol. 1<br />
Table 7 2 Percentage of total load of BOD from households, food outlets and<br />
industries in each of the 21 sub-catchment areas discharging to Sg. Sarawak.The<br />
shadings indicate areas where food outlets are contributing significantly<br />
to the total load.<br />
Catchment Households<br />
South of Sg. Sara-<br />
wak<br />
C:\Documents and Settings\user\Desktop\SUD-02-25 - River quality baseline study Vol.1 by Erling\final\River Quality Baseline main report.doc<br />
% of<br />
total load from the<br />
three types of sources<br />
in the sub-catchment<br />
area<br />
Food outlets<br />
% of<br />
total load from the<br />
three types of sources<br />
in the sub-catchment<br />
area<br />
Industries<br />
% of<br />
total load from the<br />
110<br />
three types of sources<br />
in the sub-catchment<br />
Bintangor-1 100 0 0<br />
Bintangor-2 67 33 0<br />
Bintangor-3 61 39 0<br />
Padungan 79 20 1<br />
Sekama 100 0 0<br />
Sekama 1 98 0 1<br />
Periok 69 28 3<br />
Biawak 75 21 4<br />
Bintawa 89 9 2<br />
Bintawa 1 97 1 2<br />
Kudei 97 3 0<br />
Maong 96 3 1<br />
North of Sg. Sara-<br />
wak<br />
Gita 100 0 0<br />
Laruh 100 0 0<br />
Turong 100 0 0<br />
Sinjan 98 2 0<br />
Bedil 100 0 0<br />
Gersik 100 0 0<br />
Seman Lama 100 0 0<br />
Siol Kandis 1 100 0 0<br />
Siol Kandis 2 100 0 0<br />
area
River Quality Baseline Study. Vol. 1<br />
Table 7.3 Percentage of total load .Oil and grease from households, food outlets<br />
and industries in each of the 21 sub-catchment areas discharging to Sg.<br />
Sarawak.The shadings indicate areas where food outlets are contributing<br />
significantly to the total load.<br />
Catchment Households<br />
South of Sg. Sara-<br />
wak<br />
C:\Documents and Settings\user\Desktop\SUD-02-25 - River quality baseline study Vol.1 by Erling\final\River Quality Baseline main report.doc<br />
% of<br />
total load from the<br />
three types of sources<br />
in the sub-catchment<br />
area<br />
Food outlets<br />
% of<br />
total load from the<br />
three types of sources<br />
in the sub-catchment<br />
area<br />
Industries<br />
% of<br />
total load from the<br />
111<br />
three types of sources<br />
in the sub-catchment<br />
Bintangor-1 100 0 0<br />
Bintangor-2 17 83 0<br />
Bintangor-3 9 91 0<br />
Padungan 29 71 0<br />
Sekama 17 83 0<br />
Sekama 1 56 44 0<br />
Periok 20 80 0<br />
Biawak 21 79 0<br />
Bintawa 30 70 0<br />
Bintawa 1 87 13 0<br />
Kudei 76 24 0<br />
Maong 70 30 0<br />
North of Sg. Sara-<br />
wak<br />
Gita 100 0 0<br />
Laruh 100 0 0<br />
Turong 100 0 0<br />
Sinjan 82 18 0<br />
Bedil 100 0 0<br />
Gersik 100 0 0<br />
Seman Lama 100 0 0<br />
Siol Kandis 1 100 0 0<br />
Siol Kandis 2 100 0 0<br />
area
River Quality Baseline Study. Vol. 1<br />
Figure 7.1. Areas in Kuching City where more than 70% of the total load of oil<br />
and grease is discharged from food outlets (in green).<br />
C:\Documents and Settings\user\Desktop\SUD-02-25 - River quality baseline study Vol.1 by Erling\final\River Quality Baseline main report.doc<br />
112
River Quality Baseline Study. Vol. 1<br />
Catchment BOD<br />
Table 7.4 and 7.5 indicate the total loads of pollutants from the different subcatchment<br />
areas (sum of load from all sources in each area).<br />
The load of organic pollution (BOD, COD, TSS, Tot-N, Tot-P and O&G) is the<br />
highest from the Maong sub-catchment area followed by Padungan, Bintawa1<br />
and Seman Lama (Table 7.4).<br />
The highest loads of heavy metals are encountered in the Pending area (Sekama<br />
1, Periok, Biawak, Bintawa, Bintawa 1), Padungan and Maong. However, it is<br />
noted that the load estimate only includes loads from industries. There are no<br />
information of concentrations of heavy metals in outlets from households, foodoutlets,<br />
workshops and other sources. The load from these sources might actually<br />
exceed the load from the industries, due to the sheer number of sources.<br />
Table 7.4 Estimated loads of pollutants to Sg. Sarawak and tributaries from<br />
different sub-catchment areas in Kuching.(Rounded Figures). The shading<br />
indicates the four highest loads for each parameter.<br />
kg/day<br />
COD<br />
kg/day<br />
C:\Documents and Settings\user\Desktop\SUD-02-25 - River quality baseline study Vol.1 by Erling\final\River Quality Baseline main report.doc<br />
TSS<br />
kg/day<br />
Tot-N<br />
kg/day<br />
Tot-P<br />
kg/day<br />
Bintangor-1 100-200 350-530 100-170 50-70 9-11 3-7<br />
O&G<br />
kg/day<br />
Bintangor-2 320-420 750-950 230-300 90-120 22-23 19-20<br />
Bintangor-3 290-420 650-900 170-270 100-120 33-37 13-20<br />
Padungan 670-880 1700-2100 500-655 200-270 54-55 37-40<br />
Sekama 150-220 370-500 100-150 45-60 10-12 9-11<br />
Sekama 1 60-100 190-280 55-90 30-40 5-6 2-4<br />
Periok 30-40 80-100 20-30 9-12 2 2<br />
Biawak 100-160 280-390 100-140 40-50 9-11 5-7<br />
Bintawa 40-80 130-200 40-70 20-30 3-4 1-4<br />
Bintawa 1 300-540 960-1,400 280-460 150-190 26-33 7-19<br />
Kudei 270-380 760-1,000 230-315 100-130 23 13-14<br />
Maong 2,800-4,400 8,300-11,400 2,500-3,600 1,100-1,500 220-250 120-155<br />
Gita 200-400 700-1,000 200-340 100-140 18-23 5-13<br />
Laruh 170-270 520-720 155-230 70-95 14-16 7-9<br />
Turong 40-60 120-160 40-50 15-20 3-4 2<br />
Sinjan 300-480 900-1,280 270-400 130-170 24-28 11-17<br />
Bedil 230-400 750-1,100 220-350 110-145 19-24 7-14<br />
Gersik 70-100 200-300 60-95 30-40 5-7 2-4<br />
Seman Lama 340-500 1,000-1,380 300-440 140-180 28-30 15-17<br />
Siol Kandis 1 180-340 590-900 170-290 90-120 15-19 4-11<br />
Siol Kandis 2 15-25 50-70 15-20 5-10 1 1<br />
113
River Quality Baseline Study. Vol. 1<br />
Catchment Pb<br />
Table 7.5 Estimated loads of pollutants to Sg. Sarawak and tributaries from<br />
different sub-catchment areas in Kuching.<br />
g/day<br />
Cd<br />
g/day<br />
C:\Documents and Settings\user\Desktop\SUD-02-25 - River quality baseline study Vol.1 by Erling\final\River Quality Baseline main report.doc<br />
Cu<br />
g/day<br />
Bintangor-1 0 0 0 0 0 0 0 0<br />
Bintangor-2 0 0 0 0 0 0 0 0<br />
Bintangor-3 0 0 0 0 0 0 0 0<br />
Padungan 0 0 0 0.3 2 0.1 2 0<br />
Sekama 0 0 0 0 0 0 0 0<br />
Zn<br />
g/day<br />
Sekama 1 0.3 0.02 0 1 20 2 10 0.2<br />
Periok 0.7 0.04 0 2 30 3 1.6 0.2<br />
Biawak 4.0 0.5 0.2 200 300 20 300 3<br />
Bintawa 0.4 0.07 0 0 40 3 100 1<br />
Bintawa 1 10 0.9 0 100 300 30 100 2<br />
Kudei 0 0 0 0 0 0 0 0<br />
Maong 2 0.2 0.4 0.4 100 7 400 1<br />
Gita 0 0 0 0 0 0 0 0<br />
Laruh 0 0 0 0 0 0 0 0<br />
Turong 0 0 0 0 0 0 0 0<br />
Sinjan 0 0 0 0 0 0 0 0<br />
Bedil 0 0 0 0 0 0 0 0<br />
Gersik 0 0 0 0 0 0 0 0<br />
Seman Lama 0 0 0 0 0 0 0 0<br />
Siol Kandis 1 0 0 0 0 0 0 0 0<br />
Siol Kandis 2 0 0 0 0 0 0 0 0<br />
Fe<br />
g/day<br />
Mn<br />
g/day<br />
Al<br />
g/day<br />
AOX<br />
g/day<br />
114
River Quality Baseline Study. Vol. 1<br />
7.3 Existing Technical Measures to Reduce Pollution<br />
Loading<br />
In general, there is no technical means currently imposed to reduce pollutant<br />
load, for households. Most households discharge greywater directly to the<br />
stormwater drains and probably the only measure to reduce contaminants from<br />
entering the drains is the usage of coarse filtering equipment or apparatus installed<br />
at their washing sinks or wash basins.<br />
Houses are generally equipped with septic tanks for treatment of blackwater,<br />
but they are not well functioning due to inadequate desludging. A programme,<br />
however, was launched to enforce the Rule of “Compulsory desludging of septic<br />
tanks, 1988” gazetted 15 th October 1998, which specifies that every septic<br />
tank in the city must be desludged every second year.<br />
However, it must be stressed that even if all septic tanks in Kuching were<br />
desludged regularly and functioning properly, the effect in terms of reducing<br />
the pollution load to the tributaries and main river will still be insignificant.<br />
Consequently, the sewage from the houses does not comply with the standards<br />
as stipulated in the Environmental Quality (Sewage and Industrial Effluents)<br />
Regulation, 1979.<br />
Most of the food outlets also discharge wastewater directly to the drains. Some<br />
of them do have treatment measures for physical filtration and removal of<br />
heavy oil and grease residue (grease traps) in place. However, the grease traps<br />
are generally not functioning, because they are not emptied and even in the case<br />
they are actually emptied, it seems that this generally takes place in the drain<br />
downstream of the trap.<br />
At present, information on the numbers of food outlets with treatment facilities<br />
is not available.<br />
In general, the sewage from food outlets does not comply with the standards as<br />
stipulated in the Environmental Quality (Sewage and Industrial Eeffluents)<br />
Regulation, 1979.<br />
Many industries have their wastewater treatment system in place. However,<br />
there are a few industries without any wastewater treatment. Presently, data on<br />
the number of industries with and without proper wastewater treatment ssystem<br />
is not available.<br />
In the SUD field study, it was generally observed that the industries equipped<br />
with proper treatment facilities complied with the regulations, whereas those<br />
without or with inadequate facilities did not.<br />
C:\Documents and Settings\user\Desktop\SUD-02-25 - River quality baseline study Vol.1 by Erling\final\River Quality Baseline main report.doc<br />
115
River Quality Baseline Study. Vol. 1<br />
7.4 Existing Control and Enforcement Measures<br />
The enforcement measures are generally passive, i.e. only in case of complaints,<br />
authorities carry out inspections and may impose a fine to the offender.<br />
There is currently no specific active enforcement measure carried out by the<br />
authorities to control the discharge of sewage from households and/or food outlets.<br />
Other than cleanliness campaigns and awareness programmes, no direct<br />
inspection or regular checks on the discharge has been made.<br />
The Department of Environment (DOE) is monitoring the wastewater from a<br />
small fraction of the industries in Kuching for compliance to the Environmental<br />
Quality Act 1974 (EQA). The monitored industries include: industries discharging<br />
more than 60 m 3 wastewater per day or where the total load of BOD<br />
in effluents exceed 6 kg per day, industries involved in processing of oil palm<br />
fruit and industries involved in the processing of rubber.<br />
NREB is regulating the outlets from pig farms and other livestock activities.<br />
7.5 Assessment of Preliminary Indicators<br />
One of the important objectives of the river quality baseline study has been to<br />
assess the suitability of the selected preliminary indicators for river quality in<br />
the EMS for Kuching.<br />
The baseline study has indicated that:<br />
Some of the selected preliminary indicators are not suitable as indicators;<br />
Some of the preliminary indicators should be modified; amd<br />
Some new indicators should be added.<br />
The proposed modifications of the preliminary indicators and the rationale for<br />
the modifications are presented in the following.<br />
7.5.1 State Indicators<br />
Surface water quality<br />
Preliminary indicators proposed not to be included in the EMS<br />
The baseline study has clearly showed that concentrations of heavy metals in<br />
surface water are not suitable as indicators for water quality of the river.<br />
The levels of the heavy metals Hg, Pd, As, Zn, Cd, Cr, Cu and Ni in water<br />
measured in NREBs‟ water quality monitoring of the Sg. Sarawak system are<br />
generally very low and below the detection limits even in the very polluted<br />
tributaries. It is a worldwide experience, that dissolved heavy metals are generally<br />
encountered in very low levels in surface water and that analytical detection<br />
limits are sometimes higher than natural levels. The reason for the low lev-<br />
C:\Documents and Settings\user\Desktop\SUD-02-25 - River quality baseline study Vol.1 by Erling\final\River Quality Baseline main report.doc<br />
116
River Quality Baseline Study. Vol. 1<br />
els of dissolved heavy metals in even very polluted areas is that most trace elements<br />
are readily adsorbed onto particulate matter, which is subject to sedimentation.<br />
Data on heavy metals in sediments are therefore, more suitable as indicators<br />
because discharged metals are accumulated in the sediments (Cf. below).<br />
The general low levels of dissolved trace elements also make it very difficult to<br />
measure concentrations correctly, as there is a high risk of contamination during<br />
sampling, pre-treatment and storage. Therefore, there is a high risk that an<br />
observed increase in concentration between two sampling rounds may be due to<br />
a slight contamination of the sample and not a real increase.<br />
The same problems may be encountered for PAHs and Total Petroleum Hydrocarbons.<br />
The levels of Fe and Mn in water measured in NREBs‟ water quality monitoring<br />
of the Sg. Sarawak system are generally very high also in areas not affected<br />
by human activities.<br />
The high iron and manganese concentrations are due to natural processes and<br />
not primarily a result of human activities, although discharge of wastewater<br />
may contribute to increased levels. Results from 1999 indicates that the concentrations<br />
of iron in Sg. Sarawak Kiri are at the same level as those encountered<br />
in the heavily polluted Sg. Maong and higher than the levels in Sg. Sarawak<br />
main fronting Kuching.<br />
High background concentrations in surface water are common in natural waters.<br />
Leaching of iron is particularly significant in swampy areas such as freshwater<br />
swamps, nipah forests and mangroves, which are abundant in the Sg. Sarawak<br />
catchment area. The soils in such areas are waterlogged and anaerobic.<br />
In the anaerobic, waterlogged soil, the solubility of iron increases. Insoluble<br />
Fe +++ is reduced to soluble Fe ++ , which is then transported via groundwater to<br />
the river. The solubility of manganese increases in anaerobic swampy area in<br />
the same way as iron does.<br />
Occurrences of Fe and Mn in ground and surface waters are very much dependent<br />
on environmental conditions, especially oxidation and reduction have resulted<br />
in that Fe and Mn are not included in many priority lists or water quality<br />
standards, internationally.<br />
Based on the above considerations, it is therefore proposed that the following<br />
preliminary indicators for surface water quality are not to be included in the<br />
EMS for Kuching: Hg, Pd, As, Zn, Cd, Cr, Cu, Ni, Fe, Mn, Polyaromatic hydrocarbons<br />
(PAH) and total petroleum hydrocarbons (TPH).<br />
C:\Documents and Settings\user\Desktop\SUD-02-25 - River quality baseline study Vol.1 by Erling\final\River Quality Baseline main report.doc<br />
117
River Quality Baseline Study. Vol. 1<br />
Indicators proposed to be included in the EMS<br />
The baseline study has confirmed that the following preliminary indicators for<br />
water quality are suitable and are therefore proposed to be included in the EMS<br />
for river quality:<br />
pH, DO;<br />
BOD, COD, TSS;<br />
Nutrients (Ammoniacal Nitrogen (NH4-N), Nitrates, Phosphorous); and<br />
Bacteria (Faecal coliforms and total coliforms).<br />
Sediment quality<br />
Preliminary indicators proposed not to be included in the EMS<br />
As outlined above, Fe and Mn are not suitable as indicators for the river quality<br />
because natural processes may result in the discharge of very large quantities of<br />
Fe and Mn not associated with human activities. These two metals finally end<br />
up in the sediment. It is therefore, proposed that Fe and Mn are not included in<br />
the indicators for sediment quality.<br />
Indicators proposed to be included in the EMS<br />
The baseline study has confirmed that the following preliminary indicators for<br />
sediment quality are suitable and are therefore, proposed to be included in the<br />
EMS for river quality:<br />
Nutrients (Ammoniacal Nitrogen (NH4-N), Nitrates);<br />
Heavy metals (Hg, Pb, AS, Zn, Cd, Cr, Cu, Ni);<br />
CN; and<br />
Oil and grease, Polyaromatic Hydrocarbons, PAH, Total Petroleum Hydrocarbons<br />
(TPH).<br />
In the preliminary indictors, phosphorous is included. However, the type of<br />
phosphorous is not specified. It is proposed that Tot P is measured (Cf. below).<br />
It is further proposed to add the following parameters, which were not proposed<br />
during the selection of preliminary indicators:<br />
Loss on ignition; and<br />
Total N.<br />
C:\Documents and Settings\user\Desktop\SUD-02-25 - River quality baseline study Vol.1 by Erling\final\River Quality Baseline main report.doc<br />
118
River Quality Baseline Study. Vol. 1<br />
The reason for proposing these parameters is than the baseline study has indicated<br />
that one of the major pollution problems of Sg. Sarawak is the discharge<br />
of organic matter. Loss on ignition is a measure of the organic matter content of<br />
the sediment. Total N and Total P are measures of all forms of N and P found<br />
in the sediment, including that incorporated in dead organic matter, irrespective<br />
of the chemical form (ammonium, nitrate, etc) which is highly dependent on<br />
redox processes in the sediment as well as biological activity.<br />
Pollutants in aquatic organisms<br />
The most suitable organisms for monitoring purposes are molluscs. The baseline<br />
study has indicated that it may be difficult or impossible to collect sufficient<br />
amounts of molluscs for monitoring in Sg. Sarawak and the tributaries in<br />
Kuching. However, molluscs transplanted in cages can be used.<br />
Indicators proposed to be included in the EMS<br />
It is proposed that transplanted mollucs be measured in their tissues for the<br />
concentration of the following polutants:<br />
Heavy metals (Hg, Pb, As, Zn, Cd, Cr, Cu, Ni and organotin); and<br />
Polyaromatic Hydrocarbons, PAH, Total petroleum hydrocarbons (TPH).<br />
The feasibility of this approach must be assessed from a pilot study.<br />
<strong>Eco</strong>logical parameters<br />
Diversity index, species of fish of yy family and species of invertebrates of zz<br />
family have been chosen as preliminary indicators.<br />
Preliminary indicators proposed not to be included in the EMS<br />
It is proposed not to use “Invertebrates of zz family” as indicators because even<br />
in the unpolluted state the part of Sg. Sarawak running through Kuching will<br />
not house the families of invertebrates which are clear indicators of the unpolluted<br />
state. These families are typically encountered further upstream of the<br />
river system where the river is narrower and flowing faster.<br />
Indicators proposed to be included in the EMS<br />
It is proposed to apply the Pearson and Rosenberg 1978 method of assessment<br />
of pollution impacts on benthos in which number of species and abundance (no<br />
individuals/m²) and species composition to be used as indicators. This method<br />
has been used in the baseline study (described in detail in Volume 3).<br />
It is proposed that the diversity of benthic macroinvertebrates be used as indicator<br />
(Shannon Wiener diversity index).<br />
It is proposed that catch per unit effort (cpu) of all fish and prawn species in a<br />
catch to be used as indicators. Catch per unit effort is a standard measure of effort<br />
(including fishing time, length of net etc, dependent on fishing method).<br />
C:\Documents and Settings\user\Desktop\SUD-02-25 - River quality baseline study Vol.1 by Erling\final\River Quality Baseline main report.doc<br />
119
River Quality Baseline Study. Vol. 1<br />
Cpu of giant prawn (Macrobrachium rosenbergii) and the fish species Mystus<br />
spp. and Oxyeleotris marmorata are also proposed as indicators. These species<br />
are the commercially most significant species in Sg. Sarawak.<br />
Aeasthetics<br />
The preliminary indicators chosen are proposed to be included in the EMS. i.e.<br />
Estimated volume of floatables collected from Sg. Sarawak; and<br />
Level of smell by using standard method.<br />
The baseline study has shown that the internationally recognised standard<br />
method using the Threshold Odour Number is a good method.<br />
In addition, the number of complaints of smell in river, drains and tributaries<br />
should be used as indicators as well.<br />
7.5.2 Load Indicators<br />
It is proposed that all preliminary load indicators be used in the EMS. In addition,<br />
it is proposed that estimates of loads from households, food outlets and<br />
industries to be used applying the methods used in the baseline study.<br />
C:\Documents and Settings\user\Desktop\SUD-02-25 - River quality baseline study Vol.1 by Erling\final\River Quality Baseline main report.doc<br />
120
River Quality Baseline Study. Vol. 1<br />
8 References<br />
Abott, R.T. (1991). Seashells of Southeast Asia.m Graham Brash, Singapore.<br />
145pp<br />
Anon. (2000). Information on Food Premises (Fast Food, Restoran, Coffee<br />
Shops, Seafood, Bakery & Cold Storage). Compiled and faxed by Dewan Bandaraya<br />
Kuching Utara (DBKU). Sarawak<br />
Anon. (2000). List of Pig Farming located at Sungai Sarawak Catchment Area.<br />
Compiled by the Livestock Unit, Natural Resources and Environment Board.<br />
Sarawak<br />
Anon. (2000). Number of the Different Types of Premises and the Type of<br />
Sewage System Used in MBKS Areas. Compiled by Kuching City South<br />
Council (MBKS) 2000. Sarawak<br />
Anon. (2000). Number of the Different Types of Premises. Compiled by<br />
Kuching City South Council (MBKS) 2000. Sarawak<br />
Anon. (2000). Penyataan Senarai Kes Kompaun Bagi Kebersihan Sungai<br />
(Cleanliness) Di Wilayah 1, Kuching. Compiled and faxed on 11 December<br />
2000 by Sarawak Rivers Board (SRB). Sarawak<br />
Anon. (2000). Raw Water Quality Report for Various Locations along Sg. Sarawak<br />
Kiri for the year of 1998, 1999 & 2000 (up to Oct). Compiled by<br />
Kuching Water Board (KWB). Sarawak<br />
Anon. (2000). Result of Chemical Analysis of Bacteriological Samples for<br />
Siniawan Water Supply Authority in Kuching Division from 1992 – 2000.<br />
Compiled by Public Works Department HQ. Faxed on 27 November 2000<br />
Anon. (2000). Result of Chemical Analysis of Chemical Samples for Siniawan<br />
Water Supply Authority in Kuching Division from 1990 – 2000. Compiled by<br />
Kuching Water Board (KWB)<br />
Anon. (2000). Water Consumption Statistic for the year 1998, 1999 & 2000 (up<br />
to Oct.)<br />
C:\Documents and Settings\user\Desktop\SUD-02-25 - River quality baseline study Vol.1 by Erling\final\River Quality Baseline main report.doc<br />
121
River Quality Baseline Study. Vol. 1<br />
Anton, A. (2000). Bioindicators in river quality management. Proceedings for<br />
the Environmental Indicators Seminar for River Water Quality and Waste<br />
Management. Sarawak Government/Danced Sustainable Urban Development<br />
Project. Pg 39-47<br />
Canfield T. J, N.E. Kemble, W.G. Brumbaugh, F.J. Dwyer, C.G. Ingersoll and<br />
J.F. Fairchild (1994). Use of benthic invertebrate community structure and the<br />
sediment quality triad to evaluate metal contaminated sediment in the upper<br />
Clark Fork River, Montana. Environmental Toxicology and Chemistry 13:<br />
1999-2012<br />
Canfield, T.J. F.J. Dwyer, J.F. Fairchild, P.S. Haverland, C.G. Ingersoll, N.E<br />
Kemble, D.R. Mount, T.W. La Point, G.A. Burton and M.C. Swift (1996). Assessing<br />
contamination in great lakes sediments using benthic invertebrate<br />
communities and the sediment quality triad approach. Journal of Great Lakes<br />
Rea. 22: 565-583<br />
CCME. Canadian Council of Ministers of the Environment (1999). Canadian<br />
sediment quality guidelines for the protection of aquatic life. Summary Tables.<br />
In: Canadian environmental quality guidelines, 1999, Canadian Council of<br />
Ministers of the Environment, Winnipeg<br />
Chemsain and Perunding Utama. (1996). Preliminary Environmental Impact<br />
Assessment Report for Proposed Steelmill at Kampung Goebilt, Jalan Bako,<br />
Kuching, Sarawak. Steel Industry Sarawak <strong>Sdn</strong>. <strong>Bhd</strong>. Sarawak<br />
Chemsain. (1997). EIA for Proposed Borneo Heights Road Project. Borneo<br />
Heights <strong>Sdn</strong>. <strong>Bhd</strong>. Sarawak<br />
Chemsain. (1997). Preliminary EIA on the Proposed Kuching Riverfront Development<br />
Project, Kuching, Sarawak. Kuching Riverfront <strong>Sdn</strong>. <strong>Bhd</strong>. Sarawak<br />
Chemsain. (1998). Treated – Effluent Monitoring Report. Kuching City South<br />
Council (MBKS). Sarawak<br />
Chemsain. (1998). EMP for the Proposed Medium-Low Cost Housing Project,<br />
Matang Road, Kuching. Ko-Perkasa Berhad. Sarawak<br />
Chemsain. (1998). EMP: Proposed Sand Extraction at Sungai Sarawak. Sublanco<br />
Enterprise <strong>Sdn</strong>. <strong>Bhd</strong>. Sarawak<br />
Chemsain. (1998). Preliminary EIA for the Proposed Low Cost Housing at<br />
Kota Samarahan, Samarahan Division. Custodev Tiga <strong>Sdn</strong>. <strong>Bhd</strong>. Sarawak<br />
Chemsain. (1998). Preliminary EIA for the Proposed Quarry Operation at Bukit<br />
Udur, Siburan, Sarawak. Sara Kuari <strong>Sdn</strong>. <strong>Bhd</strong>. Sarawak<br />
Chemsain. (1998). Preliminary EIA on the Proposed Beverly Garden Development,<br />
Mile 13, Kuching - Serian Road, Kuching Division. Pui Nam Cheong<br />
<strong>Sdn</strong>. <strong>Bhd</strong>. Sarawak<br />
C:\Documents and Settings\user\Desktop\SUD-02-25 - River quality baseline study Vol.1 by Erling\final\River Quality Baseline main report.doc<br />
122
River Quality Baseline Study. Vol. 1<br />
Chemsain. (1998). Preliminary EIA on the Proposed Low-Medium Cost Housing<br />
at Taman Malihah, Kuching. Sarawak Housing & Development Commission<br />
& CDM Resources <strong>Sdn</strong>. <strong>Bhd</strong>. Sarawak<br />
Chemsain. (1999). EIA for the Integrated Fishing Development Aquaculture<br />
Project. ASSAR Fishery <strong>Sdn</strong>. <strong>Bhd</strong>. Sarawak<br />
Chemsain. (1999). Preliminary EIA on Proposed Low Cost Housing Project<br />
(Taman Mutiara) at Jalan Jambusan, Bau, Kuching Division. San Chin Realty<br />
<strong>Sdn</strong>. <strong>Bhd</strong>. Sarawak<br />
Chemsain. (1999). Preliminary EIA on the Residential Development Sama Jaya<br />
Selatan, Kuching, Sarawak. Ibraco Realty Development <strong>Sdn</strong>. <strong>Bhd</strong>. Sarawak<br />
Chemsain. (1999). Water Quality Monitoring at Sungai Bintangor & Sungai<br />
Padungan. Drainage and Irrigation Department. Sarawak<br />
Chemsain. (2000). EIA on Proposed Low Medium Cost Housing at Mile 13,<br />
Kuching-Serian Road, Kuching Division. Rastar Development <strong>Sdn</strong>. <strong>Bhd</strong>. Sarawak<br />
Chapman D (1997).Water quality assessments. Published on behalf of<br />
UNESCO, WHO, UNEP. E&F Spon. London and New York<br />
Concept P Associates and Chemsain. (1999). EMP for the Proposed Mixed Development<br />
at Muara Tabuan, Lot 9291, Block 11, Muara Tebas Land District,<br />
Kuching Division, Sarawak. Astro Harta <strong>Sdn</strong>. <strong>Bhd</strong>. Sarawak<br />
ECOSOL. (1998). Preliminary EIA for the Proposed Institut Latihan Perindustrian<br />
(ILP) Sarawak In Samarahan Division. Jabatan Tenaga Rakyat. Sarawak<br />
Jurutera CMP. (1998). Preliminary EIA Report for the Development of the Yen<br />
Yen Park Project. IJM Properties <strong>Sdn</strong>. <strong>Bhd</strong>. Sarawak<br />
Jurutera CMP. (1998). Preliminary EIA Report for the Proposed Taman Sri<br />
Matang. Hwa Kwang Development <strong>Sdn</strong>. <strong>Bhd</strong>. Sarawak<br />
Jurutera CMP. (1999). Preliminary EIA Report for Proposed Taman Desa<br />
Moyang on Lots 40, 483 and 597 along Tondong-Batu Kawa, Road, Kuching.<br />
Jong Kui Ling Construction <strong>Sdn</strong>. <strong>Bhd</strong>. Sarawak<br />
Jurutera CMP.(1998). Preliminary EIA for The Proposed Development of Sarmax<br />
Park. Sarmax <strong>Sdn</strong>. <strong>Bhd</strong>. Sarawak<br />
Jurutera Jasa. (1994). Hydrological Study of the Sungai Sarawak Kiri Catchment<br />
and Feasibility Study of a proposed “Submersible Weir” across Sungai<br />
Sarawak Kiri. Kuching Water Board. Sarawak<br />
C:\Documents and Settings\user\Desktop\SUD-02-25 - River quality baseline study Vol.1 by Erling\final\River Quality Baseline main report.doc<br />
123
River Quality Baseline Study. Vol. 1<br />
KBM. (2000). Water Quality Monitoring Year 1998, 1999 and Oct 2000 for<br />
Operation of Sungai Sarawak Barrage. Kuching Barrage Management, Sarawak<br />
Pearson T.H & R. Rosenberg (1978). Macrobenthic succession in relation to<br />
organic enrichment and pollution of the marine environment. Oceanogr. Mar.<br />
Biol. Ann. Rev. 16, 229-311<br />
Sarona <strong>Sdn</strong>. <strong>Bhd</strong>. (1998). Preliminary EIA Study for Second Kuchng Bridge<br />
Project. Zalpoint Corporation <strong>Sdn</strong>. <strong>Bhd</strong>. Sarawak<br />
KTA. (1997). Sungai Sarawak Environmental Control & River Management<br />
Study: Final Report. Volume 2: River Management Plan. Natural Resources<br />
and Environment Board and Drainage and Irrigation Department. Sarawak<br />
KTA. (1997). Sungai Sarawak Regulation Scheme: Environmental Monitoring<br />
Progress Report No. 4. Public Works Department (JKR). Sarawak<br />
L. K., Wong. (1998). Physical and Chemical Characteristics of the Sediment<br />
from Sungai Maong. Faculty of Resource Science and Technology, UNIMAS.<br />
Sarawak<br />
Lau, S., Murtedza, M. and Sabtuyah, S. (1995). Profile of Heavy Metal in Water<br />
and Bottom Sediment of Sg. Sarawak. Paper presented at Malaysian Chemical<br />
Congress ‟95, (13-16 Nov., 1995). Kuching, Sarawak<br />
Lau, S., Murtedza, M. and Sabtuyah, S. (1996). Logam Berat di dalam Sedimen<br />
sebagai Penyurih kepada Punca Pencemaran di Sungai Sarawak. Malaysian J.<br />
Analytical Sciences, 2: No. 2. pp. 365-371<br />
Lau, S., Murtedza., Tan., C.Y.T and Sabtuyah, S. (1998). Accumulation of<br />
Heavy Metals in Freshwater Molluscs. The Science of the Total Environment<br />
214 (1998) 113-121. Elsevier. Pp. 115-121<br />
Lau, S., Pereira, T.J., Wong, L.K. and Chai, A. (1998). The Study of Sediment<br />
and Water Qualities of Sg. Maong, Sarawak. Proceeding Malaysian Chemical<br />
Congress „98<br />
Lau, S., Seti, S. and Tosilzan, A.G. (2000). Impacts of Urbanisation on Water<br />
Quality: A Case Study on Sg. Tabuan, Kuching, Sarawak. Paper presented at<br />
the Malaysian Chemical Congress 2000, 16-18 October 2000, Ipoh, Perak, Malaysia<br />
Maieform (Sarawak). (1998). Integrated Waste Management for Kuching.<br />
Presentation of the Inception Reports 26th of May 1998. State Planning Unit,<br />
Sarawak<br />
Meteorological Services Department, Kuching (2000). Meteorological Records<br />
from monitoring station at Kuching International Airport operated and main-<br />
C:\Documents and Settings\user\Desktop\SUD-02-25 - River quality baseline study Vol.1 by Erling\final\River Quality Baseline main report.doc<br />
124
River Quality Baseline Study. Vol. 1<br />
tained by the Perkhidmatan Kajicuaca (Meteorological Services Department)<br />
Malaysia, Cawangan Sarawak<br />
Memon A & M. Murtedza(1999). Water Resource Management in Sarawak,<br />
Malaysia. CTTC University Malaysia Sarawak.<br />
MEX Environmental. (1997). Preliminary EIA Report for the Proposed<br />
Kuching Central Prison Project. WMM Holdings <strong>Sdn</strong>. <strong>Bhd</strong>. Sarawak<br />
Mex Environmental. (1998). Preliminary EIA for the Proposed BDC - Matang<br />
Township. Borneo Development Corporation (S) <strong>Sdn</strong>. <strong>Bhd</strong>. Sarawak<br />
Mex Environmental. (1998). Preliminary EIA Report for the Proposed Mixed-<br />
Development Project on Lot 8, Block 26, Muara Tuang Land District, Kota<br />
Samarahan. Bodco Engineering & Construction <strong>Sdn</strong>. <strong>Bhd</strong>. Sarawak<br />
Mex Environmental. (1999). EIA Study for the Proposed Memorial Park Development<br />
on Lot 431 (BOT 3776) and Lot 395 (BOT 1856), Senggi-Poak<br />
Land District, Bau-Kuching Road, Bau. Nir-Warna (Kuching) <strong>Sdn</strong>. <strong>Bhd</strong>. Sarawak<br />
Mohamad Ariffin. (1998). Heavy Metal Contents in Aquatic Organisms from<br />
the Estuary of Sungai Sarawak. Faculty of Resource Science and Technology,<br />
UNIMAS. Sarawak<br />
NREB. (2000). River Watch Programme: Water Quality Data for Southern Region<br />
: Sg. Sarawak for Year 1999. Compiled by Water Quality and Laboratory<br />
Unit, Natural Resources and Environment Board, Sarawak<br />
NREB (2000). River Watch Programme: Water Quality Data for Southern Region<br />
: Sg. Sarawak for Year 2000. Compiled by Water Quality and Laboratory<br />
Unit, Natural Resources and Environment Board, Sarawak<br />
Palanisamy s/o T. Kuppusamy (1999). Heavy Metal Distribution in the Coastal<br />
Sediments of Kuching Bay. Faculty of Resource Science and Technology,<br />
UNIMAS. Sarawak<br />
PCM Consultant. (1999). Preliminary EIA on the Proposed Deepening of<br />
Navigation Channel for Senari Deep Water Port. Kuching Port Authority. Sarawak<br />
Pearson T.H & R. Rosenberg (1978). Macrobenthic succession in relation to<br />
organic enrichment and pollution of the marine environment. Oceanogr. Mar.<br />
Biol. Ann. Rev. 16, 229-311<br />
Perunding EC Sepakat. (1999). EIA for the Proposed Taman BDC Stakan on<br />
Lots 257-264, 294-296, 302-306, 313, 314, 321-321-325, 335, 336 and 2174,<br />
Block 24, Muara Tuang Land District, Samarahan Division, Sarawak. Borneo<br />
Development Corporation (S) <strong>Sdn</strong>. <strong>Bhd</strong>. Sarawak<br />
C:\Documents and Settings\user\Desktop\SUD-02-25 - River quality baseline study Vol.1 by Erling\final\River Quality Baseline main report.doc<br />
125
River Quality Baseline Study. Vol. 1<br />
Sarona. (1997). EIA for the Proposed Integrated Police Training School,<br />
Kuching, Sarawak. Ministry of Home Affairs. Malaysia<br />
SPU (1998). State of Sarawak State Planning Unit. Integrated Waste „Management<br />
System for Kuching. Inception report Wastewater May 98. Maierform<br />
(Sarawak) <strong>Sdn</strong>. <strong>Bhd</strong>.<br />
University of Malaya et al. (1992). Development of Water Quality Criteria &<br />
Standards – Phase IV (River Classification): Draft Final Report. Volume X:<br />
River Classification – Sg. Sarawak. Department of Environment. Ministry of<br />
Science, Technology and Environment. Government of Malaysia<br />
UP Services. (1997). EIA Report for the Sama Jaya Free Industrial Zone<br />
Kuching, Sarawak. Ministry of Industrial Development. Sarawak<br />
Wong, J. J., Zani Assim and et al. (2000). Development of Analytical Methods<br />
for Bultytins (TBT & DBT) Determination in Water and Sediment Samples<br />
from Sarawak River. Paper presented at the Malaysian Chemical Congress<br />
2000, 16-18 October 2000, Ipoh, Perak, Malaysia<br />
C:\Documents and Settings\user\Desktop\SUD-02-25 - River quality baseline study Vol.1 by Erling\final\River Quality Baseline main report.doc<br />
126
River Quality Baseline Study. Vol. 1<br />
APPENDIX 1<br />
WATER QUALITY DATA<br />
C:\Documents and Settings\user\Desktop\SUD-02-25 - River quality baseline study Vol.1 by Erling\final\River Quality Baseline main report.doc<br />
127
River Quality Baseline Study. Vol. 1<br />
Table 1. Water quality parameters Zone A (Sg. Sarawak Kanan) 1999. Mean of three sampling sites. Wet season: Nov-Feb. Dry season:<br />
Mar-Oct.<br />
Jan Feb Mar Apr May Jun Jul Aug Sept Oct Nov Dec Mean Mean<br />
Parameter Wet Wet Dry Dry Dry Dry Dry Dry Dry Dry Wet Wet Wet Dry<br />
No. of Samples Analysed 3 3 3 3 3 3 3 3 3 3 3 3 3 3<br />
pH Value - 6,9 6,9 7,0 7,1 6,9 7,2 6,9 6,8 6,9 7,0<br />
Dissolved Oxygen mg/kg - 5,4 4,3 3,0 3,8 4,9 7,2 5,9 6,2 6,0 4,8<br />
Biochemical Oxygen Demand mg/kg -
River Quality Baseline Study. Vol. 1<br />
Table 2. Water quality parameters Zone A (Sg. Sarawak Kanan) 2000. Mean of three sampling sites. Wet season: Nov-Feb. Dry<br />
season: Mar-Oct.<br />
Jan Feb Mar Apr May Jun Jul Aug Sept Oct Nov Dec Average Average<br />
Parameter Wet Wet Dry Dry Dry Dry Dry Dry Dry Dry Wet Wet Wet Dry<br />
No. of Samples Analysed 3 3 3 3 3 3 3 3 3 3 3 3 3 3<br />
pH Value 6,7 6,3 7,2 7,2 6,8 6,9 6,8 6,9 6,5 7,0<br />
Dissolved Oxygen mg/kg 7,3 3,8 6,8 7,3 7,5 7,4 3,9 3,9 6,0 6,1<br />
Biochemical Oxygen Demand mg/kg 0,4 0,3 0,2 1,3 0,3 0,4 0,6 0,6 0,52 0,6<br />
Chemical Oxygen Demand mg/kg 7,3 5,5 4,6 10,9 3,5 4,7 9,5 8,4 6,78 6,9<br />
Total Suspended Solids mg/kg 43,0 69,7 3,7 26,0 18,3 20,1 1,5 9,3 24,0 13,2<br />
Ammoniacal Nitrogen mg/kg 0,05 0,05 0,20 0,10 0,05 0,05 0,10 0,1 0,08 0,1<br />
Faecal Coliform Count (MPN/100mL) 1367 6333 800 6867 16000 7300 1067 7133 3850 6528<br />
Total Colifom Count (MPN/100mL) 6333 13667 1367 11667 16000 16000 3000 8000 9504 9339<br />
C:\Documents and Settings\user\Desktop\SUD-02-25 - River quality baseline study Vol.1 by Erling\final\River Quality Baseline main report.doc<br />
129
River Quality Baseline Study. Vol. 1<br />
Table 3. Water quality parameters Zone B (Sg. Sarawak Kiri) 1999. Mean of two sampling sites. Wet season: Nov-Feb. Dry season:<br />
Mar-Oct.<br />
Jan Feb Mar Apr May Jun Jul Aug Sept Oct Nov Dec Average Average<br />
Parameter Wet Wet Dry Dry Dry Dry Dry Dry Dry Dry Wet Wet Wet Dry<br />
No. of Samples Analysed 2 2 2 2 2 2 2 2 2 2 2 2 2 2<br />
pH Value 7,0 7,1 6,7 6,9 7,1 7,1 6,9 7,1 7,3 7,1 6,9 6,7 6,9 7,0<br />
Dissolved Oxygen mg/kg 3,5 3,7 2,8 2,6 4,5 2,9 1,9 9,6 - 7,4 7,1 6,9 5,3 4,5<br />
Biochemical Oxygen Demand mg/kg
River Quality Baseline Study. Vol. 1<br />
Table 4. Water quality parameters Zone B (Sg. Sarawak Kiri) 2000. Mean of two sampling sites. Wet season: Nov-Feb. Dry season:<br />
Mar-Oct.<br />
Jan Feb Mar Apr May Jun Jul Aug Sept Oct Nov Dec Average Average<br />
Parameter Wet Wet Dry Dry Dry Dry Dry Dry Dry Dry Wet Wet Wet Dry<br />
No. of Samples Analysed 2 2 2 2 2 2 2 2 2 2 2 2 2 2<br />
pH Value 6,9 6,7 7,2 7,1 7,0 6,9 7,0 7,0 6,8 7,0<br />
Dissolved Oxygen mg/kg 7,6 3,8 6,9 7,0 7,1 6,8 2,6 2,2 5,7 5,4<br />
Biochemical Oxygen Demand mg/kg 0,3 0,5 0,4 1,2 0,5 0,7 0,8 1,2 0,4 0,8<br />
Chemical Oxygen Demand mg/kg 7,2 22,8 5,0 12,2 8,2 15,4 3,9 18,8 15,0 10,6<br />
Total Suspended Solids mg/kg 27,0 256,5 65,0 27,0 130,5 35,7 7,7 88,5 141,8 59,1<br />
Ammoniacal Nitrogen mg/kg 0,05 0,05 0,05 0,10 0,05 0,12 0,10 0,12 0,1 0,1<br />
Nitrate mg/kg
River Quality Baseline Study. Vol. 1<br />
Table 5. Water quality parameters Zone C (main Sg. Sarawak from Batu Kawa bridge to upstream of Satok bridge) 1999. Mean of<br />
two sampling sites. Wet season: Nov-Feb. Dry season: Mar-Oct.<br />
Jan Feb Mar Apr May Jun Jul Aug Sept Oct Nov Dec Average Average<br />
Parameter Wet Wet Dry Dry Dry Dry Dry Dry Dry Dry Wet Wet Wet Dry<br />
No. of Samples Analysed 2 2 2 2 2 2 2 2 2 2 2<br />
pH Value 7,1 7,1 6,7 7 7,1 7,2 7,2 6,9 7,4 6,8 6,9 6,8 7,0 7,0<br />
Biochemical Oxygen Demand mg/kg
River Quality Baseline Study. Vol. 1<br />
Table 6. Water quality parameters Zone C (main Sg. Sarawak from Batu Kawa bridge to upstream of Satok bridge) 2000. Mean of<br />
two sampling sites. Wet season: Nov-Feb. Dry season: Mar-Oct.<br />
Jan Feb Mar Apr May Jun Jul Aug Sept Oct Nov Dec Average Average<br />
Parameter Wet Wet Dry Dry Dry Dry Dry Dry Dry Dry Wet Wet Wet Dry<br />
No. of Samples Analysed 2 2 2 2 2 2 2 2 2 2 2<br />
pH Value 6,7 6,9 6,9 6,9 6,7 6,9 6,9 6,9 7,1 6,9 6,8 6,9<br />
Biochemical Oxygen Demand mg/kg
River Quality Baseline Study. Vol. 1<br />
Table 7. Water quality parameters Zone D (main Sg. Sarawak from Satok bridge to downstream of barrage) 1999. Mean of five/six<br />
sampling sites. Wet season: Nov-Feb. Dry season: Mar-Oct.<br />
Jan Feb Mar Apr May Jun Jul Aug Sept Oct Nov Dec Average Average<br />
Parameter Wet Wet Dry Dry Dry Dry Dry Dry Dry Dry Wet Wet Wet Dry<br />
No. of Samples Analysed 5 5 5 5 5 6 6 6 6 6 6 6<br />
pH Value 6,8 6,6 6,7 7,0 7,2 7,0 7,3 7,0 7,0 7,1 6,8 6,7 7,0<br />
Dissolved Oxygen mg/kg 3,1 5,2 5,0 3,0 2,5 3,8 2,6 6,4 4,3 5,6 4,6 4,3 4,1<br />
Biochemical Oxygen Demand mg/kg 1,0 2,0 3,1 1,1 1,3 0,7 1,3 1,5 0,7 0,4 0,2 1,1 1,2<br />
Chemical Oxygen Demand mg/kg 14,5 12,4 12,4 10,6 27,7 22,3 24,9 5,4 8,3 7,0 5,3 10,7 14,8<br />
Total Suspended Solids mg/kg 16,0 12,1 29,6 16,0 10,9 18,7 21,2 33,7 61,7 30,8 47,7 25,3 27,8<br />
Ammoniacal Nitrogen mg/kg 2,56 0,11 0,16 11,2 0,10 0,08 0,13 0,17 0,17 0,16 0,10 0,9 1,5<br />
Nitrate mg/kg
River Quality Baseline Study. Vol. 1<br />
Table 8. Water quality parameters Zone D (main Sg. Sarawak from Satok bridge to downstream of barrage) 2000. Mean of five/six<br />
sampling sites. Wet season: Nov-Feb. Dry season: Mar-Oct.<br />
Jan Feb Mar Apr May Jun Jul Aug Sept Oct Nov Dec Average Average<br />
Parameter Wet Wet Dry Dry Dry Dry Dry Dry Dry Dry Wet Wet Wet Dry<br />
No. of Samples Analysed 6 6 6 6 6 6 6 6 6 6 6 6 6 6<br />
pH Value 6,5 6,4 7,0 7,0 6,9 7,0 7,0 6,7 6,5 6,9<br />
Dissolved Oxygen mg/kg 7,8 6,0 5,2 4,6 5,0 2,2 2,8 3,0 6,9 3,8<br />
Biochemical Oxygen Demand mg/kg 0,5 0,3 1,0 0,5 0,5 0,4 0,7 3,9 0,4 1,2<br />
Chemical Oxygen Demand mg/kg 9,4 4,0 6,2 13,7 7,8 14,4 22,5 25,0 6,7 14,9<br />
Total Suspended Solids mg/kg 49,8 37,7 18,0 51,0 24,3 248,0 50,2 49,5 43,7 73,5<br />
Ammoniacal Nitrogen mg/kg 0,10 0,10 0,21 0,15 0,05 0,05 0,14 1,21 0,1 0,3<br />
Nitrate mg/kg 0,20 0,06 0,16 0,18 0,21 0,21 0,39 0,33 0,1 0,2<br />
Phosphorus mg/kg 0,23 0,12 0,12 0,13 0,16 0,20 0,34 0,10 0,2 0,2<br />
Mercury mg/kg
River Quality Baseline Study. Vol. 1<br />
Table 9. Water quality parameters Zone E (Sg. Maong) 1999. Mean of four sampling sites. Wet season: Nov-Feb. Dry season: Mar-<br />
Oct.<br />
Jan Feb Mar Apr May Jun Jul Aug Sept Oct Nov Dec Average Average<br />
Parameter Wet Wet Dry Dry Dry Dry Dry Dry Dry Dry Wet Wet Wet Dry<br />
No. of Samples Analysed 4 4 4 4 4 4 4 4 4 4 4 4 4 4<br />
pH Value 6,9 7,2 6,9 6,7 7,0 7,1 7,1 7,1 7,0 7,0 6,5 6,9 7,0<br />
Dissolved Oxygen mg/kg 0,6 0,6 0,4 0,7 0,5 0,1 0,8 1,5 2,3 4,8 2,5 1,3 1,4<br />
Biochemical Oxygen Demand mg/kg 13,1 13,6 11,1 7,9 11,0 36,5 11,3 8,5 6,6 2,5 2,0 9,6 11,9<br />
Chemical Oxygen Demand mg/kg 32,5 40,6 28,4 24,1 37,9 49,3 43,5 62,5 28,0 26,1 32,4 35,2 37,5<br />
Total Suspended Solids mg/kg 21,3 17,6 17,6 17,5 12,3 19,8 7,6 17,3 14,0 34,3 7,8 15,6 17,5<br />
Ammoniacal Nitrogen mg/kg 0,98 4,67 2,06 1,14 3,19 7,74 5,85 9,83 6,20 0,45 0,92 2,2 4,6<br />
Nitrate mg/kg
River Quality Baseline Study. Vol. 1<br />
Table 10. Water quality parameters Zone E (Sg. Maong) 2000. Mean of four sampling sites. Wet season: Nov-Feb. Dry season:<br />
Mar-Oct.<br />
Jan Feb Mar Apr May Jun Jul Aug Sept Oct Nov Dec Average Average<br />
Parameter Wet Wet Dry Dry Dry Dry Dry Dry Dry Dry Wet Wet Wet Dry<br />
No. of Samples Analysed 4 4 4 4 4 4 4 4 4 4 4 4 4<br />
pH Value - 6,6 7,0 6,9 7,1 7,0 6,9 6,7 6,6 6,9<br />
Dissolved Oxygen - 2,6 0,3 2,7 0,5 0,3 0,7 0,4 2,6 0,8<br />
Biochemical Oxygen Demand - 3,6 6,8 1,6 9,4 4,0 5,9 8,5 3,6 6,0<br />
Chemical Oxygen Demand - 27,0 28,4 21,6 40,6 37,2 37,1 28,9 27,0 32,3<br />
Total Suspended Solids - 12,0 23,0 28,3 25,0 31,5 33,0 26,0 12,0 27,8<br />
Ammoniacal Nitrogen - 1,99 8,05 0,05 6,37 3,57 3,75 6,38 2,0 4,7<br />
Nitrate -
River Quality Baseline Study. Vol. 1 138<br />
APPENDIX 2<br />
AN OVERVIEW OF THE STATE ADMINISTRATION<br />
TYT YANG DI-PERTUA NEGERI<br />
LEGISLATIVE EXECUTIVE JUDICIARY<br />
SPEAKER CHIEF MINISTER BORNEO HIGH COURT<br />
DEWAN UNDANGAN CABINET (MMKN) SESSION COURT<br />
CHIEF MINISTER'S DEPARTMENT MAGISTRATE COURT<br />
MINISTRIES<br />
1 Ministry of Planning & Resource Management<br />
2 Ministry of Finance and Public Utilities<br />
3 Ministry of Rural and Land Development<br />
4 Ministry of Environment and Public Health<br />
5 Ministry of Tourism<br />
6 Ministry of Housing<br />
7 Ministry of Industrial Development<br />
8 Ministry of Agriculture and Food Industry<br />
9 Ministry of Social Development & Urbanisation<br />
10 Ministry of Infrastructure Development<br />
& Communications<br />
1. Chief Minister’s Department<br />
State Planning Unit (SPU)<br />
Kuching City North Hall (DBKU)<br />
2. Ministry of Planning and Resources Management<br />
Land and Survey Department<br />
Forest Department<br />
3. Ministry of Finance and Public Utilities<br />
Water Authority<br />
Water Boards (Water Supply)<br />
4. Ministry of Rural and Land Development<br />
Drainage and Irrigation Department (DID)<br />
5. Ministry of Environment and Public Health (MOEPH)<br />
Kuching City South Council (MBKS)<br />
Padawan Municipal Council (MPP)<br />
District Councils (Bau, Samarahan, Serian)<br />
State Health Department<br />
Natural Resources and Environment Board<br />
6. Ministry of Industrial Development<br />
C:\Documents and Settings\user\Desktop\SUD-02-25 - River quality baseline study Vol.1 by Erling\final\River Quality Baseline main report.doc<br />
ADAT COURT
River Quality Baseline Study. Vol. 1 139<br />
7. Ministry of Agriculture and Food Industry<br />
Department of Agriculture<br />
8. Ministry of Infrastructure Development and Communication<br />
Public Works Department (JKR) – the Water Resources Division<br />
Kuching Port Authority<br />
Sarawak Rivers Board (SBR)<br />
9. Minsitry of Tourism<br />
10. Minsityr of Housing<br />
11. Ministry of Social Development & Urbanisation<br />
12. Other Relevant Committees and Councils<br />
State Planning Authority<br />
Water Resources Council<br />
C:\Documents and Settings\user\Desktop\SUD-02-25 - River quality baseline study Vol.1 by Erling\final\River Quality Baseline main report.doc
River Quality Baseline Study. Vol. 1 140<br />
APPENDIX 3<br />
A SUMMARY OF RELEVANT ACTIVITIES AND MANDATES<br />
Name of Agency Relevant activities Relevant regulation<br />
State Planning Unit Overall economic planning.<br />
Infrastructure projects<br />
including waste and<br />
wastewater projects<br />
State Planning Author- Approval of develop-<br />
ity<br />
Water Resources<br />
Council<br />
ment projects<br />
Policy and programmes<br />
for conservation, management<br />
and use of water<br />
resources<br />
Water Authority Water supply.<br />
Identification of water<br />
catchments, control of<br />
contamination and pollution<br />
of water or sources<br />
of water supply, licenses<br />
Land and Survey Department<br />
Drainage and Irrigation<br />
Department<br />
State Health Department<br />
Local Authorities<br />
Natural Resources and<br />
Environment Board<br />
for water abstraction<br />
Agency for landuse (e.g.<br />
sand extraction from rivers<br />
and utilization of river<br />
banks), land classification<br />
and development –<br />
Secretariat to the SPA<br />
Irrigation and drainage<br />
works, river engineering,<br />
flood mitigation, hydrol-<br />
ogy, data collection,<br />
License of businesses,<br />
discharge from hospitals<br />
and certain food outlets<br />
Approval of building<br />
plans<br />
Construction and maintenance<br />
of public drains<br />
Sewage treatment<br />
Collection and disposal<br />
of waste<br />
License of businesses<br />
Operation of markets<br />
Nuisances<br />
Broad powers within policy<br />
making, coordination<br />
and monitoring. Pollution<br />
control powers e.g. EIA,<br />
C:\Documents and Settings\user\Desktop\SUD-02-25 - River quality baseline study Vol.1 by Erling\final\River Quality Baseline main report.doc<br />
WO 4<br />
WO 8 and 17<br />
No regulation<br />
PHO<br />
21, 25, 33, and 38<br />
LAO<br />
104, 105, 112, 132,<br />
134, 136, 138<br />
Entire LAC in particular<br />
9-17, 18- 20, 41, 44-<br />
50<br />
NREO<br />
5, 10, 11, 18 and 30<br />
and subsidiary rules<br />
under these provi-
River Quality Baseline Study. Vol. 1 141<br />
Ministry of Industrial<br />
Development<br />
Department of Agriculture<br />
State Veterinary<br />
Health Department<br />
Public Works Department<br />
The Water Resources<br />
Division<br />
environmental management<br />
systems and issu-<br />
ance of rules and orders.<br />
License for industrial activities<br />
(in Industrial Es-<br />
tates)<br />
Soil conservation<br />
Drainage and irrigation<br />
Crop water requirement<br />
Pollution from non-point<br />
sources<br />
License of aquaculture<br />
License of businesses<br />
(lifestock rearing, meat<br />
processing)<br />
Responsible for infrastructure<br />
development for<br />
water supply and sewerage<br />
- Secretariat to The<br />
Water Authority and the<br />
Water Resources Council<br />
advising the Minister on<br />
water resources issues<br />
and identification of water<br />
catchment areas<br />
Sarawak Rivers Board Regulate river traffic –<br />
power to prohibit discharge<br />
to gazetted rivers<br />
from public and private<br />
sources and regulate activities<br />
in the rivers and<br />
on the banks of gazetted<br />
Kuching Port Authority<br />
Department of Environment<br />
(Federal Agency)<br />
rivers<br />
Provide port facility<br />
Broad powers within national<br />
policy making,<br />
monitoring and coordination.<br />
Pollution control<br />
powers e.g. EIA, licensing<br />
of industry, standard<br />
setting<br />
C:\Documents and Settings\user\Desktop\SUD-02-25 - River quality baseline study Vol.1 by Erling\final\River Quality Baseline main report.doc<br />
sions<br />
Only licenses for<br />
operation<br />
SIFR 6<br />
VPHO<br />
7, 22, 29, 42, 44, 69,<br />
102<br />
SRO<br />
4, 9, 12, 13, 16,17,<br />
20, 33, 38<br />
SRCR<br />
3, 6, 8, 10, 12, 15,<br />
17, 12, 22<br />
EQA<br />
3, 11, 12, 18, 21 and<br />
32<br />
EQA Sewage Regulation<br />
4, 6, 8, 11