Species diversity in the Florida Everglades, USA - Environmental ...
Species diversity in the Florida Everglades, USA - Environmental ...
Species diversity in the Florida Everglades, USA - Environmental ...

You also want an ePaper? Increase the reach of your titles
YUMPU automatically turns print PDFs into web optimized ePapers that Google loves.
Aquat. Sci. Vol. 68, 2006 Overview Article 269<br />
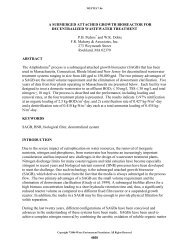
Figure 4. Energy, emergy and transformity <strong>in</strong> a typical food cha<strong>in</strong>. The maximum empower pr<strong>in</strong>ciple predicts that feedback controls from<br />
a component (<strong>in</strong>ferred from transformity) are commensurate with <strong>the</strong> emergy <strong>in</strong>vested <strong>in</strong> support<strong>in</strong>g that component. If emergy fl ows on<br />
each pathway are equal, quality-adjusted <strong>diversity</strong> is maximized.<br />
1994; and restated as <strong>the</strong> maximum empower pr<strong>in</strong>ciple <strong>in</strong><br />
Odum, 1996) postulates that network systems will develop<br />
component <strong>in</strong>terconnections that make maximum<br />
use of available energy gradients, adjusted to refl ect <strong>the</strong>ir<br />
energy quality. In adaptive systems, this means that<br />
higher energy quality translates <strong>in</strong>to <strong>in</strong>creased feedback<br />
control potential because systems maximiz<strong>in</strong>g emergy<br />
throughput will select those components whose service<br />
to whole-system function are commensurate with what<br />
was required to make <strong>the</strong>m, while selective pressure will<br />
tend to remove those components that fail to provide<br />
such service. The expected result is that adaptive systems<br />
will exhibit approximately equal emergy fl ows on all<br />
pathways. The standard Shannon <strong>diversity</strong> benchmark<br />
(H max) becomes more mean<strong>in</strong>gful as a basis for evaluat<strong>in</strong>g<br />
system condition (with degradation <strong>in</strong>dicated by deviation<br />
from <strong>the</strong> maximum) when applied across trophic<br />
levels <strong>in</strong> light of this expected emergy fl ow equality.<br />
On a component-wise basis, this also allows comparison<br />
between observed emergy fl ows and those expected<br />
at <strong>the</strong> <strong>the</strong>oretical optima. Those compartments that are<br />
more or less important than expected given <strong>the</strong> benchmark<br />
of emergy fl ow evenness can be identifi ed, and<br />
systematic trends <strong>in</strong> importance can be exam<strong>in</strong>ed. We<br />
view deviation from emergy fl ow expectation to be a<br />
measure of conservation value; that is, species process<strong>in</strong>g<br />
less emergy than expected are those which may warrant<br />
conservation attention, and, fur<strong>the</strong>r, that <strong>the</strong> magnitude of<br />
<strong>the</strong> deviation prioritizes that attention. While it is clear<br />
that, even <strong>in</strong> healthy ecosystems, some organisms will be<br />
more and o<strong>the</strong>r less abundant than expected, we hypo<strong>the</strong>size<br />
that healthy ecosystems will show no systematic<br />
trend of deviation from expectation with trophic level.<br />
Our specifi c objectives <strong>in</strong> this paper are to compute<br />
transformity values from complex network data <strong>in</strong> order<br />
to assign component importance adjusted for energy<br />
quality, develop an <strong>in</strong>dex of bio<strong>diversity</strong> at <strong>the</strong> systemscale<br />
that accounts for energy quality, and develop an<br />
<strong>in</strong>dex that allows <strong>in</strong>ference of each components deviation<br />
from expected ecosystem importance.<br />
Materials and methods<br />
Network data<br />
Network data, consist<strong>in</strong>g of carbon fl ows (g C/yr) were<br />
compiled from published data for both wet and dry season<br />
conditions for <strong>the</strong> <strong>Everglades</strong> gram<strong>in</strong>oid marsh system<br />
(details for account<strong>in</strong>g, aggregation and assumptions<br />
<strong>in</strong> Ulanowicz et al., 1997; Ulanowicz et. al, 2000). There<br />
were 66 ecosystem compartments <strong>in</strong> <strong>the</strong> gram<strong>in</strong>oid<br />
marsh. Not all of <strong>the</strong>se compartments are liv<strong>in</strong>g; ecosystem<br />
pools <strong>in</strong>clude labile and refractory detritus. Fur<strong>the</strong>r,<br />
<strong>the</strong> primary production pools were partitioned <strong>in</strong>to root,<br />
and leaf compartments. Many of <strong>the</strong> lower trophic level<br />
compartments represent aggregations of species (due to<br />
lack of data); for example, meso<strong>in</strong>vertebrates, macro<strong>in</strong>vertebrates,<br />
centrarchid fi sh, snakes and passer<strong>in</strong>e birds<br />
are lumped categories for <strong>the</strong> marsh system.<br />
The orig<strong>in</strong>al data were presented <strong>in</strong> a “To… From”<br />
matrix of carbon exchanges from one component (i.e.,<br />
species or group of species where aggregations were necessary)<br />
of <strong>the</strong> network to ano<strong>the</strong>r, where each cell <strong>in</strong> <strong>the</strong><br />
matrix represents a material transfer. An energy systems<br />
depiction (Fig. 5a) of a generic energy/material network<br />
conta<strong>in</strong><strong>in</strong>g biotic and abiotic components <strong>in</strong>cludes organisms<br />
feed<strong>in</strong>g at multiple trophic levels and on both photosyn<strong>the</strong>tic<br />
and detrital food cha<strong>in</strong>s. Cybernetic feedbacks<br />
are not <strong>in</strong>cluded <strong>in</strong> <strong>the</strong> matrix data, and are omitted<br />
from this fi gure. For each component <strong>in</strong> Fig. 5a, fi ve<br />
fl ows describe bilateral <strong>in</strong>teractions (e.g., consumption,<br />
gross production, net production/transfer, respiration and