State Rail Plan - North Dakota Department of Transportation - State ...
State Rail Plan - North Dakota Department of Transportation - State ... State Rail Plan - North Dakota Department of Transportation - State ...
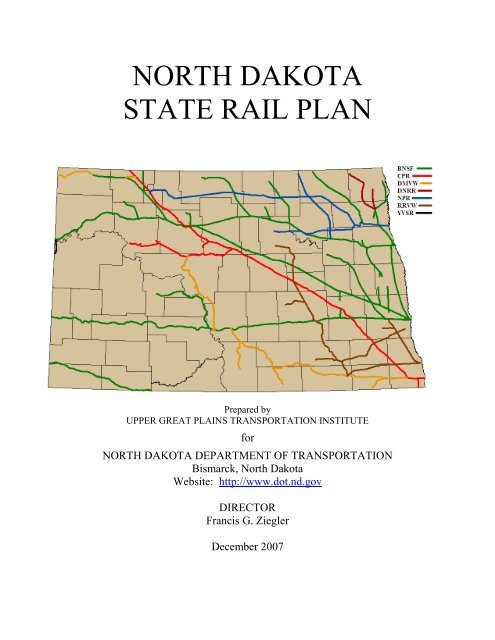
NORTH DAKOTA STATE RAIL PLAN Prepared by UPPER GREAT PLAINS TRANSPORTATION INSTITUTE for NORTH DAKOTA DEPARTMENT OF TRANSPORTATION Bismarck, North Dakota Website: http://www.dot.nd.gov DIRECTOR Francis G. Ziegler December 2007
- Page 3: iii
- Page 6 and 7: Brief History .....................
- Page 8 and 9: Perspectives of Metropolitan Planni
- Page 11 and 12: CHANGE/ERRATA SHEET Provisions in P
- Page 13 and 14: TransAction II articulates 12 Strat
- Page 15 and 16: Operation Lifesaver In 1991, Congre
- Page 17 and 18: action items. These goals, strategi
- Page 19 and 20: Trends Trends can force us to take
- Page 22 and 23: CHAPTER 2 - THE NORTH DAKOTA RAIL S
- Page 24 and 25: Table 1 lists the miles of main lin
- Page 26 and 27: Canadian Pacific Railway (CPR) 9 Th
- Page 28 and 29: Northern Plains Railroad (NPR) 11 N
- Page 30 and 31: Carrier Profiles - Local Railroads
- Page 32 and 33: Railroad Network Characteristics Tr
- Page 34 and 35: As Figure 8 shows, considerable dif
- Page 36 and 37: Fewer than 15% (31) of the elevator
- Page 38 and 39: Theoretical annual throughput capac
- Page 40 and 41: Depending on the number and locatio
- Page 42 and 43: Figure 10. Shuttle Elevator Locatio
- Page 44 and 45: Figure 12. Biodiesel Plants on a Ca
- Page 46 and 47: Rail Passenger Service and Traffic
- Page 48 and 49: ___________________________________
- Page 50 and 51: • Construct or improve rail sidin
NORTH DAKOTA<br />
STATE RAIL PLAN<br />
Prepared by<br />
UPPER GREAT PLAINS TRANSPORTATION INSTITUTE<br />
for<br />
NORTH DAKOTA DEPARTMENT OF TRANSPORTATION<br />
Bismarck, <strong>North</strong> <strong>Dakota</strong><br />
Website: http://www.dot.nd.gov<br />
DIRECTOR<br />
Francis G. Ziegler<br />
December 2007
iii
TABLE OF CONTENTS<br />
CHAPTER 1 - ND RAIL PLANNING GUIDANCE ___________________________ 5<br />
Purpose, Scope, and Use _____________________________________________________ 5<br />
Goals and Strategies ________________________________________________________ 5<br />
Trends ____________________________________________________________________ 8<br />
Policy <strong>State</strong>ments ___________________________________________________________ 9<br />
Brief History ______________________________________________________________ 11<br />
<strong>North</strong> <strong>Dakota</strong> <strong>Rail</strong>road System Today _________________________________________ 12<br />
Carrier Pr<strong>of</strong>iles – Class I <strong>Rail</strong>roads ___________________________________________ 14<br />
BNSF <strong>Rail</strong>way (BNSF) .......................................................................................................................14<br />
Canadian Pacific <strong>Rail</strong>way (CPR) ......................................................................................................15<br />
Carrier Pr<strong>of</strong>iles – Regional <strong>Rail</strong>roads _________________________________________ 16<br />
<strong>Dakota</strong>, Missouri Valley & Western (DVMW)................................................................................16<br />
<strong>North</strong>ern Plains <strong>Rail</strong>road (NPR) ......................................................................................................17<br />
Red River Valley & Western <strong>Rail</strong>road (RRVW) ............................................................................18<br />
Carrier Pr<strong>of</strong>iles – Local <strong>Rail</strong>roads ____________________________________________ 19<br />
<strong>Dakota</strong> <strong>North</strong>ern <strong>Rail</strong>road (DNRR) .................................................................................................19<br />
Yellowstone Valley <strong>Rail</strong>road (YSVR) ...............................................................................................19<br />
<strong>Rail</strong>road Network Characteristics ____________________________________________ 21<br />
Track Condition and Quality Indicators .........................................................................................21<br />
<strong>Rail</strong> Grade Crossing Characteristics ................................................................................................23<br />
Characteristics <strong>of</strong> Shipper Facilities .................................................................................................24<br />
Storage Capacity ................................................................................................................................24<br />
Side Track Capacity ...........................................................................................................................24<br />
Shuttle Train Elevators .....................................................................................................................25<br />
BNSF <strong>Rail</strong>way Requirements ............................................................................................................25<br />
CPR Requirements ............................................................................................................................25<br />
NDDOT SHUTTLE AND BIOFUEL PLANT IMPACT ANALYSIS ..........................................26<br />
<strong>Rail</strong> Passenger Service and Traffic Levels ______________________________________ 34<br />
CHAPTER 3 - RAILROAD FREIGHT ASSISTANCE PROGRAMS AND<br />
GUIDELINES ________________________________________________________ 37<br />
Brief History .......................................................................................................................................37<br />
<strong>North</strong> <strong>Dakota</strong> Local <strong>Rail</strong> Freight Assistance Program ____________________________ 37<br />
<strong>North</strong> <strong>Dakota</strong> Freight <strong>Rail</strong> Improvement Program ______________________________ 38<br />
Benefits <strong>of</strong> <strong>Rail</strong> Freight Assistance Programs .................................................................................38<br />
Highway-<strong>Rail</strong> Grade Crossing Safety Programs ________________________________ 39<br />
v
Brief History .......................................................................................................................................39<br />
U.S. <strong>Department</strong> <strong>of</strong> <strong>Transportation</strong> (USDOT) Action <strong>Plan</strong> ............................................................40<br />
Onboard <strong>Rail</strong>road Warning and Sounding Devices .......................................................................41<br />
Conspicuous Locomotives .................................................................................................................42<br />
Reflectorized Rolling Stock ...............................................................................................................42<br />
Highway System Engineering and Enforcement Innovations ........................................................43<br />
Enhancements <strong>of</strong> Highway <strong>Rail</strong>road Interface................................................................................43<br />
Obstruction <strong>of</strong> Visibility ....................................................................................................................43<br />
<strong>State</strong> Grade Crossing Safety Programs ________________________________________ 43<br />
Operation Lifesaver ________________________________________________________ 44<br />
APPENDIX A _________________________________________________________ 47<br />
TRAFFIC AND COMMODITY STATISTICS ______________________________ 47<br />
<strong>Rail</strong>road Statistics _________________________________________________________ 49<br />
Farm Products Traffic .......................................................................................................................54<br />
Coal, Chemical, and Food Products Traffic ....................................................................................57<br />
Value <strong>of</strong> <strong>North</strong> <strong>Dakota</strong> Shipments ____________________________________________ 59<br />
APPENDIX B _________________________________________________________ 61<br />
RAIL LINE ABANDONMENTS _________________________________________ 61<br />
Abandonment Procedures and Regulations ____________________________________ 63<br />
Full Abandonment .............................................................................................................................63<br />
Exempt Abandonment .......................................................................................................................64<br />
Feeder <strong>Rail</strong>road Development Program ..........................................................................................65<br />
APPENDIX C ________________________________________________________ 69<br />
DESCRIPTION OF NORTH DAKOTA RAIL LINES ________________________ 69<br />
Devils Lake Subdivision (BNSF) ______________________________________________ 71<br />
Drayton Subdivision (BNSF)_________________________________________________ 72<br />
Glasston Subdivision (BNSF) ________________________________________________ 73<br />
Hannah Subdivision (BNSF) _________________________________________________ 74<br />
Hillsboro Subdivision (BNSF) ________________________________________________ 75<br />
Hunter, Clifford, & Prosper Subdivisions (BNSF) _______________________________ 76<br />
Warwick Subdivision (BNSF) ________________________________________________ 78<br />
Jamestown Subdivision (BNSF) ______________________________________________ 79<br />
KO Subdivision (BNSF) ____________________________________________________ 80<br />
Mayville Subdivision (BNSF) ________________________________________________ 81<br />
Rolla Subdivision (BNSF) ___________________________________________________ 82<br />
vi
Westhope Subdivision (BNSF) _______________________________________________ 83<br />
Zap Subdivision (BNSF) ____________________________________________________ 84<br />
Crosby Subdivision (BNSF) _________________________________________________ 85<br />
Dickinson Subdivision (BNSF) _______________________________________________ 86<br />
Glasgow Subdivision (BNSF) ________________________________________________ 87<br />
Grenora Subdivision (BNSF) ________________________________________________ 88<br />
Hettinger Subdivision (BNSF) _______________________________________________ 89<br />
Portal Subdivision (CPR) ___________________________________________________ 90<br />
New Town Subdivision (CPR) _______________________________________________ 91<br />
Carrington Subdivision (CPR ________________________________________________ 92<br />
Elbow Lake Subdivision & Veblen Subdivision (CPR) ___________________________ 93<br />
Wallhalla and Glasston Lines (DNRR) ________________________________________ 94<br />
<strong>Dakota</strong> Subdivision (DMVW) ________________________________________________ 95<br />
Aberdeen Subdivision (DMVW) ______________________________________________ 96<br />
Napoleon and Hazelton Subdivisions (DMVW) _________________________________ 97<br />
Missouri Valley Subdivision (DMVW) ________________________________________ 98<br />
Western Subdivision (DMVW) _______________________________________________ 99<br />
Bisbee Subdivision (NPR) __________________________________________________ 100<br />
Sarles – Lakota line: (NPR)_________________________________________________ 101<br />
Devils Lake Subdivision (NPR) ______________________________________________ 102<br />
Second Subdivision (RRVW) _______________________________________________ 103<br />
Third Subdivision (RRVW) ________________________________________________ 104<br />
Fourth Subdivision (RRVW) _______________________________________________ 105<br />
Sixth Subdivision (RRVW) _________________________________________________ 106<br />
Seventh Subdivision (RRVW) _______________________________________________ 107<br />
Eighth Subdivision (RRVW) ________________________________________________ 108<br />
Sidney Line (YVSR) _______________________________________________________ 109<br />
APPENDIX D _______________________________________________________ 111<br />
GOALS FOR NORTH DAKOTA RAIL PLANNING ________________________ 111<br />
<strong>Rail</strong> <strong>Plan</strong> Advisory and Visioning ____________________________________________ 113<br />
<strong>North</strong> <strong>Dakota</strong> <strong>Rail</strong> <strong>Plan</strong>ning Vision <strong>State</strong>ments ________________________________ 114<br />
Strategies to Achieve <strong>North</strong> <strong>Dakota</strong> <strong>Rail</strong> <strong>Plan</strong> Visions ___________________________ 117<br />
Joint MN-ND <strong>Rail</strong> <strong>Plan</strong>ning Conference: Regional <strong>Rail</strong> <strong>Plan</strong>ning Issues ___________ 121<br />
Joint Minnesota-<strong>North</strong> <strong>Dakota</strong> <strong>Rail</strong> <strong>Plan</strong>ning Conference Notes ................................................122<br />
Overview <strong>of</strong> <strong>State</strong> <strong>Rail</strong> Programs ________________________________________________ 122<br />
vii
Perspectives <strong>of</strong> Metropolitan <strong>Plan</strong>ning Organizations ________________________________ 123<br />
Perspectives <strong>of</strong> District Engineers ________________________________________________ 124<br />
Perspectives <strong>of</strong> Regional <strong>Rail</strong>roads _______________________________________________ 125<br />
APPENDIX E ________________________________________________________ 129<br />
BENEFIT COST ANALYSIS ___________________________________________ 129<br />
Benefit Cost Analysis Criteria ______________________________________________ 131<br />
Introduction _____________________________________________________________ 131<br />
Base vs. Incremental Traffic ________________________________________________ 131<br />
Base Case <strong>of</strong> Continued Operation ___________________________________________ 132<br />
Abandonment Base Case ___________________________________________________ 132<br />
Shipper Cost Savings .......................................................................................................................132<br />
<strong>Rail</strong>road Income Gains ....................................................................................................................132<br />
Shipper Pr<strong>of</strong>it on New Production .................................................................................................133<br />
Impacts on Through Traffic ............................................................................................................133<br />
Highway Impacts..............................................................................................................................133<br />
APPENDIX F ________________________________________________________ 137<br />
NDDOT LOCAL RAIL FREIGHT ASSISTANCE (LRFA) ___________________ 137<br />
SECTION 1.0 – INTRODUCTION ................................................................................................139<br />
SECTION 2.0 – ELIGIBLE APPLICANTS ..................................................................................139<br />
SECTION 3.0 – ELIGIBLE PROJECTS ......................................................................................139<br />
SECTION 4.0 – APPLICATION PROCESS.................................................................................139<br />
SECTION 5.0 – ASSISTANCE AWARD PROCESS ...................................................................143<br />
SECTION 6.0 – ASSISTANCE FORM AND AMOUNT .............................................................143<br />
SECTION 7.0 – KEY ASSISTANCE AGREEMENT TERMS ...................................................143<br />
SECTION 8.0 – PROJECT SELECTION .....................................................................................144<br />
8.1 PROJECT SELECTION POLICIES __________________________________________ 144<br />
APPENDIX G _______________________________________________________ 151<br />
NDDOT FREIGHT RAIL IMPROVEMENT PROGRAM (FRIP) _____________ 151<br />
SECTION 1.0 – INTRODUCTION ................................................................................................153<br />
SECTION 2.0 – ELIGIBLE APPLICANTS ..................................................................................153<br />
SECTION 3.0 – ELIGIBLE PROJECTS ......................................................................................153<br />
SECTION 4.0 – APPLICATION PROCESS.................................................................................153<br />
SECTION 5.0 – ASSISTANCE AWARD PROCESS ...................................................................157<br />
SECTION 6.0 – ASSISTANCE FORM AND AMOUNT .............................................................157<br />
SECTION 7.0 – KEY ASSISTANCE AGREEMENT TERMS ...................................................157<br />
SECTION 8.0 – PROJECT SELECTION .....................................................................................158<br />
8.1 PROJECT SELECTION POLICIES __________________________________________ 158<br />
viii
APPENDIX H _______________________________________________________ 165<br />
RAIL REHABILITATION PROJECTS ___________________________________ 165<br />
NORTH DAKOTA LRSA/LRFA ____________________________________________ 167<br />
REVOLVING LOAN ACCOUNT ACTIVITY .............................................................................167<br />
NORTH DAKOTA FRIP __________________________________________________ 169<br />
REVOLVING LOAN ACCOUNT ACTIVITY .............................................................................169<br />
NORTH DAKOTA LRSA/LRFA ____________________________________________ 170<br />
GRANT ACTIVITY ........................................................................................................................170<br />
APPENDIX I ________________________________________________________ 171<br />
RAIL PLAN UPDATE PUBLIC HEARING COMMENTS ___________________ 171<br />
I. Introduction _________________________________________________________ 173<br />
II. Purpose <strong>of</strong> Hearing ___________________________________________________ 173<br />
APPENDIX J ________________________________________________________ 191<br />
DIRECTORY ________________________________________________________ 191<br />
RAILROAD BUSINESS CONTACTS _______________________________________ 193<br />
RAILROAD OPERATIONS/SAFETY CONTACTS ___________________________ 195<br />
MPO CONTACTS ________________________________________________________ 196<br />
NDDOT CONTACTS _____________________________________________________ 197<br />
WEB: http://www.dot.nd.gov _______________________________________________ 197<br />
OTHER NORTH DAKOTA STATE GOVERNMENT CONTACTS ______________ 199<br />
FEDERAL GOVERNMENT CONTACTS ____________________________________ 200<br />
OPERATION LIFESAVER CONTACT ______________________________________ 200<br />
GLOSSARY _________________________________________________________ 201<br />
ix
CHANGE/ERRATA SHEET<br />
Provisions in Public Law 110-432 (The <strong>Rail</strong> Safety Act <strong>of</strong> 2008) changed the status<br />
<strong>of</strong> Local <strong>Rail</strong> Freight Assistance (LRFA) funds from federal funds to state funds.<br />
Because <strong>of</strong> this change, Federal <strong>Rail</strong>road Administration (FRA) approval is no<br />
longer required for use <strong>of</strong> these funds and certain FRA administrative guidelines<br />
and regulations that formerly applied to state LRFA programs are no longer in<br />
effect. Any reference to FRA requirements regarding the use <strong>of</strong> these funds, other<br />
than LRFA original intent, should be disregarded.<br />
xi
EXECUTIVE SUMMARY<br />
This document is a rewrite <strong>of</strong> the <strong>North</strong> <strong>Dakota</strong> <strong>State</strong> <strong>Rail</strong> <strong>Plan</strong> that was published in<br />
1998. It provides information and guidance for state and local <strong>of</strong>ficials, rail users and<br />
others affected by railroad transportation, and serves as a guide for state investments in<br />
eligible rail lines and related projects.<br />
In this document, the basic plan has been reorganized and shortened, with supporting<br />
information moved to appendices. In addition, the section that dealt with regulatory<br />
issues has been removed, because regulatory issues are not within the purview <strong>of</strong><br />
NDDOT and are not within the scope <strong>of</strong> the rail plan. This change does not suggest that<br />
regulatory issues are unimportant. On the contrary, regulatory issues are very significant,<br />
since they can directly impact the largest segment <strong>of</strong> the <strong>North</strong> <strong>Dakota</strong> economy. <strong>Rail</strong><br />
rates and service affect the cost and timing <strong>of</strong> commodity movements, which can affect<br />
access to markets. These variables directly impact agricultural producers. NDDOT<br />
recognizes and acknowledges the significance and importance <strong>of</strong> regulatory issues, but<br />
believes they would be better addressed in a venue other than the rail plan.<br />
The rail plan is organized into the following chapters, with appendices:<br />
Chapter 1 – ND <strong>Rail</strong> <strong>Plan</strong>ning Guidance<br />
Chapter 2 – The <strong>North</strong> <strong>Dakota</strong> <strong>Rail</strong> System<br />
Chapter 3 – ND <strong>Rail</strong> Assistance and Safety Programs and Guidelines<br />
The state rail plan supports TransAction II, <strong>North</strong> <strong>Dakota</strong>’s strategic transportation plan.<br />
TransAction II’s mission, vision and goals are stated below.<br />
Mission<br />
”<strong>North</strong> <strong>Dakota</strong> will provide a safe and secure transportation system that considers<br />
personal choices, enhances business opportunities, and supports economic<br />
competitiveness; and promotes the wise use <strong>of</strong> all resources.”<br />
Vision<br />
“<strong>North</strong> <strong>Dakota</strong>’s transportation system is an important part <strong>of</strong> regional, national and<br />
global systems, developed strategically to help grow and diversify our economy and<br />
enhance the state’s quality <strong>of</strong> life.”<br />
Goals<br />
1. Safe and secure transportation for residents, visitors, and freight.<br />
2. A transportation system that allows optimum personal mobility.<br />
3. A transportation system that allows the efficient and effective movement <strong>of</strong> freight.<br />
4. A transportation system that enhances economic diversity, growth, and<br />
competitiveness with consideration <strong>of</strong> environmental and social impacts.<br />
5. Funding sufficient to protect and enhance <strong>North</strong> <strong>Dakota</strong>’s transportation<br />
infrastructure and address future transportation needs<br />
6. A transportation environment where communication, cooperation, and<br />
collaboration exists.<br />
1
TransAction II articulates 12 Strategic Initiatives for improving the <strong>North</strong> <strong>Dakota</strong><br />
<strong>Transportation</strong> system. All 12 Initiatives have direct application to the rail plan.<br />
In accordance with TransAction II, the rail plan considers priorities and levels <strong>of</strong> service<br />
appropriate for <strong>North</strong> <strong>Dakota</strong>’s rail transportation needs. For example:<br />
• The emergence <strong>of</strong> identity preserved agriculture and the increasing globalization<br />
<strong>of</strong> markets has caused increasing demand for intermodal service.<br />
• The emerging bi<strong>of</strong>uel industry is impacting movement <strong>of</strong> bulk agricultural<br />
commodities.<br />
• Increased demand for coal will impact rail transportation in <strong>North</strong> <strong>Dakota</strong>.<br />
This rail plan is intended to be a working document, a useful and practical resource, as<br />
we work through these and other challenges to transportation in <strong>North</strong> <strong>Dakota</strong>.<br />
Administrative Note:<br />
Terms included in the Glossary are bolded and italicized with first use in the document.<br />
2
RAIL PLAN OVERVIEW<br />
Chapter 1 – Introduction, Purpose, Scope and Use, and Goals and Strategies<br />
Chapter 1 provides guidance for rail planning in ND. It contains the rail plan’s purpose,<br />
scope, use, and planning goals and strategies. It also identifies trends that have potential<br />
to affect the ND rail transportation system.<br />
A <strong>Rail</strong> Advisory Group (RAG), representing a cross-section <strong>of</strong> railroad, shipper, and<br />
public organizations, was tasked with developing a vision, with goals and implementation<br />
strategies, for rail transportation in <strong>North</strong> <strong>Dakota</strong>. The group met four times, with one<br />
meeting being a joint <strong>North</strong> <strong>Dakota</strong> – Minnesota planning and coordination session.<br />
Detailed information from these meetings is in Appendix D.<br />
Chapter 2 – The <strong>North</strong> <strong>Dakota</strong> <strong>Rail</strong> System<br />
Chapter 2 provides an overview <strong>of</strong> the state railroad system and related information.<br />
There is a brief history <strong>of</strong> <strong>North</strong> <strong>Dakota</strong> railroads followed by summary pr<strong>of</strong>iles <strong>of</strong> the<br />
seven freight railroads operating in the state. <strong>Rail</strong> crossing characteristics are presented,<br />
as are characteristics <strong>of</strong> shipper facilities. There is an overview <strong>of</strong> shuttle loader<br />
facilities, and a map <strong>of</strong> their locations. Also included is an overview <strong>of</strong> passenger rail<br />
service and traffic levels. Commodity and freight flows are addressed. Chapter 2 also<br />
provides an overview <strong>of</strong> the abandonment process.<br />
Chapter 3 – <strong>North</strong> <strong>Dakota</strong> <strong>Rail</strong> Freight Assistance Programs and Guidelines and<br />
Crossing Safety Programs<br />
Chapter 3 provides a description <strong>of</strong> the <strong>North</strong> <strong>Dakota</strong> rail freight assistance revolving<br />
loan funds and the state’s railroad–highway grade crossing safety efforts.<br />
<strong>Rail</strong> Assistance<br />
<strong>North</strong> <strong>Dakota</strong> has two revolving loan funds for freight rail assistance; Local <strong>Rail</strong> Freight<br />
Assistance (LRFA) and Freight <strong>Rail</strong> Improvement Program (FRIP). The LRFA fund<br />
was established with money from a federal grant program. The FRIP loan fund was<br />
created with state dollars. LRFA and FRIP are presently the only state railroad<br />
assistance programs available in ND for rail line construction and rehabilitation projects.<br />
Crossing Safety<br />
The federal railroad-highway grade crossing safety program began in 1973, when<br />
Congress authorized expenditure <strong>of</strong> funds from the Highway Trust Fund for crossing<br />
improvements on the Federal Aid Highway System (FAS). In 1976, Congress extended<br />
funding to crossing improvements on all public highways, not just roads on the FAS, and<br />
has renewed the program in all subsequent surface transportation acts.<br />
<strong>North</strong> <strong>Dakota</strong>’s rail-highway crossing program began in 1978 and complements the<br />
federal program. The funds are used for signal installation and upgrade, other safety<br />
upgrades, and crossing closures.<br />
3
Operation Lifesaver<br />
In 1991, Congress directed the Secretary <strong>of</strong> <strong>Transportation</strong> to set aside $300,000 each<br />
fiscal year to support a public information and education program to help reduce motor<br />
vehicle accidents, injuries, and fatalities and improve driver behavior at railroad–highway<br />
crossings. The money has been used to support Operation Lifesaver. NDDOT continues<br />
to work with Operation Lifesaver and other safety groups to promote an awareness <strong>of</strong><br />
grade crossing hazards and driver responsibility.<br />
Quiet Zones<br />
The state is aware that train horns create noise impacts in communities and encourages<br />
continued research into ways to mitigate noise impacts without compromising safety.<br />
FRA has established certain criteria for quiet zones, where train horns are not sounded.<br />
Fargo, in cooperation with Moorhead, MN, established the first quiet zone in ND, along<br />
the BNSF mainline that runs through both communities. There are presently several ND<br />
communities that have implemented quiet zones or are in the process <strong>of</strong> doing so.<br />
NDDOT affirms that quiet zones are a local issue and decisions regarding them should be<br />
made at that level<br />
<strong>Rail</strong> Advisory Group Members<br />
Bill Binek D.B. Messmer<br />
ND Public Service Commission Federal <strong>Rail</strong>road Administration<br />
Jim Boyd Dennis Ming<br />
ND <strong>Department</strong> <strong>of</strong> Commerce <strong>Dakota</strong> Missouri Valley & Western <strong>Rail</strong>road<br />
Bob Bright Ray Morrell<br />
Fargo-Moorhead MetroCog (MPO) ND <strong>Department</strong> <strong>of</strong> Emergency Services<br />
Steve Busek Steve Saunders<br />
Federal Highway Administration Bismarck-Mandan MPO<br />
Edward D. Dahlby Mark Sovig<br />
Canadian Pacific <strong>Rail</strong>way Regional Councils<br />
Chuck Fleming Brian Sweeney<br />
ND <strong>Department</strong> <strong>of</strong> Agriculture BNSF <strong>Rail</strong>way<br />
Earl Haugen Tanya Wisnewski<br />
Grand Forks, East Grand Forks MPO Operation Lifesaver<br />
Larry Jamieson Dan Zink<br />
<strong>North</strong>ern Plains <strong>Rail</strong>road Red River Valley & Western <strong>Rail</strong>road<br />
4
CHAPTER 1 - ND RAIL PLANNING GUIDANCE<br />
This chapter contains the <strong>Rail</strong> <strong>Plan</strong>’s purpose, scope, and use; planning goals with<br />
implementation strategies and action items; and trends that have potential to impact rail<br />
transportation.<br />
Purpose, Scope, and Use<br />
Purpose<br />
• Develop a shared vision for <strong>North</strong> <strong>Dakota</strong>’s rail system.<br />
• Provide broad strategic direction for collaborative rail system enhancement<br />
efforts.<br />
• Develop and maintain an inclusive and ongoing strategic rail planning process.<br />
• Communicate information regarding the existence and availability <strong>of</strong> rail<br />
assistance programs.<br />
Scope<br />
The rail plan scope is broad. It engages public and private sector providers and users, all<br />
levels <strong>of</strong> government, and multiple modes <strong>of</strong> transportation. It identifies strategic rail<br />
transportation issues.<br />
The rail plan examines strategic rail transportation roles and responsibilities across all<br />
levels <strong>of</strong> government and the private sector. It recognizes and respects the functions <strong>of</strong><br />
the private sector and the prerogative <strong>of</strong> local governmental units and tribal governments<br />
to develop their own rail transportation plans and projects.<br />
The rail plan also explores and identifies opportunities for public-private partnerships and<br />
collaborative efforts by identifying strategic goals and strategies.<br />
Use<br />
• Promote cooperation and collaboration between jurisdictions and between the<br />
public and private sectors.<br />
• Improve communication between the public and private sectors and between<br />
railroads and rail system users.<br />
• Promote understanding <strong>of</strong> the strategic importance <strong>of</strong> rail transportation in <strong>North</strong><br />
<strong>Dakota</strong>.<br />
• Enable <strong>North</strong> <strong>Dakota</strong> to achieve its shared rail transportation vision.<br />
Goals and Strategies<br />
The <strong>Rail</strong> Advisory Group (RAG) developed 11 primary vision statements for <strong>North</strong><br />
<strong>Dakota</strong>’s rail system. Specific categories within each vision were identified. Action<br />
items, or strategies, were then developed. The strategies were further refined to ensure<br />
that the proposed actions were within the scope <strong>of</strong> the rail plan. The vision statements<br />
and strategies were then distilled into four planning goals with supporting strategies and<br />
5
action items. These goals, strategies and action items are the fundamental planning<br />
guidance for ND rail transportation. They are listed below. Implementation strategies to<br />
accomplish an annual work plan will be developed.<br />
Detailed information from the RAG sessions, including the vision statements and<br />
strategies discussed at the meetings, is in Appendix D.<br />
Goal 1. A safe and secure railroad system.<br />
Strategy 1. Support efforts to improve rail safety and security.<br />
• Broaden Operation Lifesaver target audience.<br />
• Review best rail safety and security practices and determine applicability in <strong>North</strong><br />
<strong>Dakota</strong>.<br />
• Maintain a current rail crossing inventory.<br />
• Continue to provide incentives to close low volume and non-essential public rail<br />
crossings.<br />
• Support enforcement <strong>of</strong> rail crossing laws.<br />
• Review the NDDOT rail crossing signal program for appropriate modification.<br />
• Support federal, state and local incentives to regional and local railroads for<br />
implementing federal mandates.<br />
Strategy 2. Initiate discussion to identify and prioritize rail safety and security issues.<br />
• Encourage local governments to include rail crossing issues in the planning<br />
process.<br />
• Seek private industry input on rail crossing issues.<br />
• Review ND law regarding railroad safety and security to identify potential<br />
revisions, deletions or additions.<br />
• Broaden the perspective <strong>of</strong> safety and security to include freight, vehicles,<br />
infrastructure and personal security issues.<br />
Goal 2. A rail system (integrated with other transportation modes) that is capable<br />
<strong>of</strong> meeting current and future service needs.<br />
Strategy 1. Initiate dialog with railroads, private industry and local governments to<br />
determine current and future rail service needs in the state.<br />
• Initiate discussion with railroads to improve strategic planning for use <strong>of</strong><br />
resources such as rail loan funds.<br />
• Survey industry to determine service and capacity needs for the future.<br />
• Evaluate ND rail system accessibility.<br />
• Identify areas that would benefit from increased truck access to rail.<br />
• Identify criteria to develop a means <strong>of</strong> measuring levels <strong>of</strong> freight and passenger<br />
service.<br />
• Promote annual meetings between railroads and rail use stakeholders to discuss<br />
issues, needs and solutions.<br />
6
Strategy 2. Identify what is needed to achieve an integrated rail network.<br />
• Identify problems with freight transition between Class I <strong>Rail</strong>roads and Regional<br />
<strong>Rail</strong>roads and Local railroads.<br />
• Identify bottlenecks, pinch-points and other deficiencies on the rail system.<br />
• Develop a formal mechanism for information exchange to determine adequate<br />
service levels between Class I and Regional/Local railroads.<br />
• Consider the effect that rail infrastructure projects will have on the overall<br />
transportation network <strong>of</strong> the state.<br />
Strategy 3. Provide assistance to improve infrastructure and enhance system capacity<br />
and efficiency.<br />
• Solicit public comment on rail infrastructure projects.<br />
• Develop/refine procedures and selection criteria for rail loan fund projects.<br />
• Emphasize system improvement as a criterion for allocation <strong>of</strong> state rail<br />
assistance funds.<br />
• Support an economically viable railroad system that is pr<strong>of</strong>itable and allows for<br />
reinvestment in rail equipment and infrastructure.<br />
• Support a favorable business and regulatory climate for rail investment and<br />
business development.<br />
• Support public–private partnerships that promote business development and<br />
economic growth.<br />
• Identify and monitor legislation that may have impact on rail policies,<br />
infrastructure or operations.<br />
Goal 3. <strong>Rail</strong>road operations that enhance mobility and quality <strong>of</strong> life.<br />
Strategy 1. Initiate an ongoing dialog between railroads, governmental entities and rail<br />
stakeholders to identify and mitigate negative impacts <strong>of</strong> railroad operations and<br />
activities.<br />
Strategy 2. Encourage local governments to solicit participation by railroads in planning<br />
and zoning activities.<br />
Strategy 3. Assess opportunities for use <strong>of</strong> abandoned rail line right-<strong>of</strong>-way.<br />
Goal 4. A coordinated inter/multimodal facilities network that provides access to<br />
national and international markets.<br />
Strategy 1. Facilitate discussions between governmental entities, business owners,<br />
shippers and transportation providers to identify and ensure adequate<br />
transportation access to inter/multimodal facilities.<br />
• Implement ND rail freight strategy for intermodal and transload facilities.<br />
• Serve as an information source regarding rail access for proposed<br />
inter/multimodal facilities.<br />
• Support public–private partnerships that enhance development <strong>of</strong> an<br />
inter/multimodal network.<br />
7
Trends<br />
Trends can force us to take new directions. Some trends present opportunity; others<br />
present challenges. To make effective transportation decisions, we need to identify the<br />
possible implications <strong>of</strong> trends. It is also important to remember that some trends can be<br />
influenced and changed.<br />
The following trends appear to have important implications for rail transportation.<br />
Continuing Long–Term Trends<br />
• ND farmers have always grown and shipped large volumes <strong>of</strong> bulk agricultural<br />
commodities.<br />
• <strong>Rail</strong>roads have always been the main mode <strong>of</strong> transportation for grain and<br />
oilseeds leaving the state.<br />
• Production agriculture is a primary component <strong>of</strong> the ND economy.<br />
• Federal regulations and environmental issues have significantly impacted<br />
transportation, in some situations positively and in others negatively.<br />
• Over the long term, energy costs have risen, accompanied at times by intermittent<br />
supply disruptions and price instability.<br />
▪ Funding authorization for Amtrak is year to year and there is no guarantee that<br />
funds will be authorized. The future <strong>of</strong> the Empire Builder, the only passenger<br />
rail service in ND, is sometimes in doubt because <strong>of</strong> this.<br />
Emerging Trends<br />
• Global terrorism threatens national security, international relations and petroleum<br />
production, distribution and market stability world-wide.<br />
• <strong>Transportation</strong> safety and security are becoming more integrated into the war on<br />
terror.<br />
▪ Class 1 railroads are becoming capacity constrained, while the demand for rail<br />
transportation is increasing. This is causing upward pressure on rates and<br />
influencing service decisions.<br />
• Demand for identity preserved, non-genetically modified organisms, organic, and<br />
pulse crops will require enhanced intermodal rail service.<br />
• Growth will continue in the areas <strong>of</strong> e-commerce, just-in-time delivery, product<br />
and food safety, security concerns, and intermodal container movements.<br />
• Bi<strong>of</strong>uel plants will influence the movement <strong>of</strong> agricultural commodities,<br />
especially corn and oil seeds, in and out <strong>of</strong> <strong>North</strong> <strong>Dakota</strong>.<br />
• Bi<strong>of</strong>uel plants will place an additional burden on the state’s transportation system,<br />
both rail and highway.<br />
• Coal shipments into the state will increase.<br />
• There may be significant intrastate coal movement to bi<strong>of</strong>uel plants.<br />
▪ More cities are expressing interest in Quiet Zones<br />
• Additional transload facilities, either rail to highway or highway to rail, may be<br />
needed.<br />
8
Policy <strong>State</strong>ments<br />
NDDOT has a limited number <strong>of</strong> policy statements related to rail transportation. They<br />
are stated here.<br />
NDDOT:<br />
▪ Will not own or operate rail lines<br />
▪ Will not subsidize railroad operations<br />
▪ Regards Quiet Zones as a local issue.<br />
▪ Supports continued evaluation <strong>of</strong> Intelligent <strong>Transportation</strong> System solutions to<br />
grade crossing safety and urban congestion problems.<br />
▪ Supports removal or mitigation <strong>of</strong> obstructions to visibility at grade crossings as<br />
cost-effective hazard mitigation.<br />
▪ Supports evaluation <strong>of</strong> at grade crossings where highway curvature or alignment<br />
near the crossing might make it difficult for a driver to see an oncoming train.<br />
9
CHAPTER 2 - THE NORTH DAKOTA RAIL SYSTEM<br />
Brief History 1<br />
Development <strong>of</strong> the <strong>North</strong> <strong>Dakota</strong> rail system was influenced primarily by the <strong>North</strong>ern<br />
Pacific <strong>Rail</strong>way (NP); the St. Paul, Minneapolis and Manitoba <strong>Rail</strong>way – the Manitoba –<br />
and its successor, Great <strong>North</strong>ern <strong>Rail</strong>way; and the Minneapolis, St. Paul and Sault St.<br />
Marie <strong>Rail</strong>way (the Soo Line). They are briefly described below.<br />
The <strong>North</strong>ern Pacific <strong>Rail</strong>way was chartered by Congress in 1864 and given a 50 million<br />
acre land grant to construct a railroad from Duluth to the Puget Sound. The NP founded<br />
the city <strong>of</strong> Fargo in 1871 and brought rail service to <strong>North</strong> <strong>Dakota</strong> June 6, 1872, when<br />
construction <strong>of</strong> a bridge across the Red River linking Fargo and Moorhead, MN, was<br />
completed. The NP continued building its rail line west across the state, crossing the<br />
Montana border just west <strong>of</strong> the City <strong>of</strong> Beach.<br />
The Manitoba, which was formed in 1879 with James J. Hill (the Empire Builder) as its<br />
general manager, reached Fargo in 1880. A line from Fargo to Grand Forks was<br />
completed in 1881, and construction continued toward the Canadian border. The<br />
Manitoba also built a line west from Grand Forks, reaching Devils Lake in 1883 and<br />
Minot in 1886. Construction continued west and the line crossed the Montana border<br />
near Williston in 1887. Several branch lines, known as the “Finger Lines” were built<br />
along the Grand Forks – Montana route, primarily to move grain. The Manitoba became<br />
the Great <strong>North</strong>ern <strong>Rail</strong>way Company in September <strong>of</strong> 1889. The <strong>North</strong>ern Pacific and<br />
Great <strong>North</strong>ern operated in <strong>North</strong> <strong>Dakota</strong> until 1970, when they became part <strong>of</strong> what is<br />
now BNSF <strong>Rail</strong>way. See the BNSF carrier pr<strong>of</strong>ile for more detail.<br />
The Soo Line 2<br />
was formed in 1888 with the consolidation <strong>of</strong> the Minneapolis, Sault Ste.<br />
Marie & Atlantic <strong>Rail</strong>way, the Minneapolis & Pacific <strong>Rail</strong>way, the Minneapolis & St.<br />
Croix <strong>Rail</strong>way and the Aberdeen, Bismarck & <strong>North</strong> Western <strong>Rail</strong>way. In 1893, the Soo<br />
Line completed a diagonal route across <strong>North</strong> <strong>Dakota</strong>, from Fairmount to Portal, where it<br />
interchanged with the Canadian Pacific <strong>Rail</strong>way (CPR). CPR was by then a<br />
transcontinental railroad, having completed construction <strong>of</strong> a line across Canada in<br />
November <strong>of</strong> 1885. The Soo Line next built a branch line network south and east <strong>of</strong><br />
Bismarck, connecting to Fairmount via Oakes. Finally, between 1905 and 1912, the<br />
1 The main sources for this section are: (1) Thoms, William E. and R. J. Tosterud. West <strong>of</strong> the RedCThe<br />
Role <strong>of</strong> <strong>Transportation</strong> in the Development <strong>of</strong> <strong>North</strong> <strong>Dakota</strong>, UGPTI, Reprinted, 1996; (2) Robinson,<br />
Elwyn B. History <strong>of</strong> <strong>North</strong> <strong>Dakota</strong>, University <strong>of</strong> Nebraska Press, 1963; and (3) various newspaper articles<br />
and railroad press releases.<br />
2 The Soo Line <strong>Rail</strong>road later became part <strong>of</strong> Canadian Pacific <strong>Rail</strong>way. In describing historical events in<br />
the rail plan, the name <strong>of</strong> the railroad company at the time <strong>of</strong> the event is used unless the current or<br />
successor railroad company also was involved in the event or transaction.<br />
11
“Wheat Lines”, which run across much <strong>of</strong> northern <strong>North</strong> <strong>Dakota</strong>, were constructed. The<br />
Soo Line became a subsidiary <strong>of</strong> the Canadian Pacific <strong>Rail</strong>way when CPR participated in<br />
its financial restructuring in the late 1940s. After the restructuring, CPR held 56% <strong>of</strong> Soo<br />
Line common stock. CPR purchased 100 percent <strong>of</strong> Soo Line stock in 1990, making it a<br />
wholly owned subsidiary.<br />
Several other railroad companies have owned or operated track in <strong>North</strong> <strong>Dakota</strong>. They<br />
include the Milwaukee Road, Chicago & <strong>North</strong>western, <strong>Dakota</strong>, Minnesota & Eastern<br />
and the Midland Continental. Of these, only the <strong>Dakota</strong>, Minnesota & Eastern still exists<br />
as an operating railroad, but it no longer owns or operates track in ND.<br />
According to <strong>North</strong> <strong>Dakota</strong> Public Service Commission data, miles <strong>of</strong> railroad track (also<br />
known as miles <strong>of</strong> road) in <strong>North</strong> <strong>Dakota</strong> peaked in 1920, at nearly 5,400. By the end <strong>of</strong><br />
the decade, the system it was down to about 5,300 miles. It fluctuated between about<br />
5,100 and 5,250 miles during the 1940s, 50s and 60s. There have been 1774 miles <strong>of</strong><br />
track abandoned in ND since 1936 (Appendix B). The ND rail system has approximately<br />
3,700 miles <strong>of</strong> road today. Miles <strong>of</strong> road is a primary indicator <strong>of</strong> system coverage. 3<br />
<strong>North</strong> <strong>Dakota</strong> <strong>Rail</strong>road System Today<br />
There are currently seven railroad companies operating 3,667 miles <strong>of</strong> road in <strong>North</strong><br />
<strong>Dakota</strong>. Two are Class I carriers, three are regional railroads and two are local railroads.<br />
The Surface <strong>Transportation</strong> Board (STB) classifies railroads as Class I, II, or III on the<br />
basis <strong>of</strong> annual revenue. 4<br />
Miles <strong>of</strong> road is not considered in STB classification.<br />
The Association <strong>of</strong> American <strong>Rail</strong>roads (AAR) has a classification system that considers<br />
both annual revenue and miles <strong>of</strong> road. AAR classifies railroads as Class I, Regional<br />
<strong>Rail</strong>road and Local <strong>Rail</strong>road. The seven railroads operating in ND, with classification,<br />
are named below.<br />
BNSF and CPR are Class I railroads by both AAR and STB classification standards. The<br />
<strong>Dakota</strong>, Missouri Valley & Western <strong>Rail</strong>road (DMVW), the <strong>North</strong>ern Plains <strong>Rail</strong>road<br />
(NPR), and the Red River Valley & Western <strong>Rail</strong>road (RRVW) are defined as regional<br />
railroads by AAR classification standards because they operate more than 350 miles <strong>of</strong><br />
road. The Yellowstone Valley <strong>Rail</strong>road (YSVR) and <strong>Dakota</strong> <strong>North</strong>ern <strong>Rail</strong>road (DNRR)<br />
are both local railroads because they fall below the AAR regional railroad criteria. 5<br />
3<br />
Miles <strong>of</strong> road excludes side tracks, crossovers and yard tracks. The term is synonymous<br />
with route miles.<br />
4 Class I: =>$250 million adjusted annual operating revenue for three consecutive years<br />
Class II: $20 million - $249,999,999.99 - Class III:
Table 1 lists the miles <strong>of</strong> main line and branch line track in <strong>North</strong> <strong>Dakota</strong> by operating<br />
railroad. BNSF miles <strong>of</strong> road are about 66% main line, while CPR has about 73% main<br />
line. The Class I carriers operate 60% <strong>of</strong> the total miles operated in <strong>North</strong> <strong>Dakota</strong>.<br />
Table 1 - <strong>North</strong> <strong>Dakota</strong> <strong>Rail</strong>road System Mileage (2009) 6<br />
<strong>Rail</strong>road Main line Branch Line Trackage Rights Total Miles Operated<br />
BNSF 1,107 609 16 1732<br />
CPR 353 121 8 482<br />
DMVW - 424 51 475<br />
NPR - 361 361<br />
RRVW - 453 87 540<br />
DNRR - 68 68<br />
YSVR - 9 9<br />
TOTAL 1,460 2,045 162 3,667<br />
Table 2 summarizes the overall system characteristics <strong>of</strong> the two Class I railroads. BNSF<br />
operates more than 32,000 route miles. CPR operates nearly 13,200 miles. Both carriers<br />
operate in the United <strong>State</strong>s and Canada. BNSF’s <strong>North</strong> <strong>Dakota</strong> lines comprise 5.4% <strong>of</strong><br />
BNSF’s system miles, while the CPR’s <strong>North</strong> <strong>Dakota</strong> lines comprise 3.7% <strong>of</strong> the CPR’s<br />
system miles. The information is the most recent available.<br />
Table 2 - Select System Statistics for BNSF (2010) and CPR (2008) 7<br />
<strong>Plan</strong>t and Equipment BNSF System CPR System<br />
Miles <strong>of</strong> road operated 32,266 13,199<br />
Miles <strong>of</strong> road owned 23,733 9,300<br />
Freight cars in service 220,000 55,424<br />
Locomotives in service 6,600 1,700<br />
Commodity movement information by railroad is presented in the carrier pr<strong>of</strong>iles that<br />
follow. More information is contained in Appendix A.<br />
6<br />
Source: Annual Reports by the railroads to the <strong>North</strong> <strong>Dakota</strong> Public Service Commission; breakdown<br />
between branchline and mainline miles is from the railroads, as the Annual Report lists only total miles and<br />
trackage rights.<br />
7<br />
Source: Annual Reports to NDPSC; Association <strong>of</strong> American <strong>Rail</strong>roads; railroads. Most recent data<br />
available.<br />
13
Carrier Pr<strong>of</strong>iles – Class I <strong>Rail</strong>roads<br />
BNSF <strong>Rail</strong>way (BNSF) 8<br />
The BNSF <strong>Rail</strong>way system, the second largest in <strong>North</strong> America, is the result <strong>of</strong> a series <strong>of</strong><br />
mergers and acquisitions. In 1970, the Great <strong>North</strong>ern, the <strong>North</strong>ern Pacific, and the Chicago,<br />
Burlington & Quincy merged to form the Burlington <strong>North</strong>ern <strong>Rail</strong>road. In 1980, the Burlington<br />
<strong>North</strong>ern merged with the St. Louis & San Francisco railroad (the “Frisco” line). The company<br />
name remained Burlington <strong>North</strong>ern. In September <strong>of</strong> 1995, the merger <strong>of</strong> Burlington <strong>North</strong>ern<br />
Inc., parent company <strong>of</strong> Burlington <strong>North</strong>ern <strong>Rail</strong>road, and Santa Fe Pacific Corporation, parent<br />
company <strong>of</strong> the Atchison, Topeka and Santa Fe <strong>Rail</strong>way, created the Burlington <strong>North</strong>ern Santa<br />
Fe <strong>Rail</strong>road Company. The Burlington <strong>North</strong>ern Santa Fe <strong>Rail</strong>road Company became BNSF<br />
<strong>Rail</strong>way in 2005. Detail for BNSF operation in ND is presented in Appendix C.<br />
BNSF <strong>Rail</strong>way currently operates 32,266 route miles in 28 states and two Canadian provinces.<br />
Its network covers the western two-thirds <strong>of</strong> the United <strong>State</strong>s, stretching from major west coast<br />
ports in the Pacific <strong>North</strong>west and southern California to the Midwest, Southeast and Southwest,<br />
and from the Gulf <strong>of</strong> Mexico to Canada. BNSF operates 1,148 miles <strong>of</strong> main line, 568 miles <strong>of</strong><br />
branch line, and 16 miles <strong>of</strong> trackage rights in <strong>North</strong> <strong>Dakota</strong>, for a total <strong>of</strong> 1,732 miles <strong>of</strong> road in<br />
the state.<br />
Figure 1 illustrates the BNSF <strong>North</strong> <strong>Dakota</strong> commodity mix using the two-digit Standard<br />
<strong>Transportation</strong> Commodity Code (STCC). The chart is based on the BNSF 2010 annual report to<br />
the <strong>North</strong> <strong>Dakota</strong> Public Service Commission (NDPSC), which reflects 2009 traffic data. As the<br />
chart shows, coal shipments comprised 26% <strong>of</strong> total carloads handled by BNSF in <strong>North</strong> <strong>Dakota</strong>.<br />
Other major commodities transported by the BNSF included: farm products (20.7%), food and<br />
kindred products (6.5%), chemicals (2.1%) and transportation equipment (2.3%). Appendix A<br />
provides more traffic details, listing the carloads and tons originated and terminated for principal<br />
Standard <strong>Transportation</strong> Commodity Codes. Only commodities that comprise at least 1% <strong>of</strong> total<br />
carloads are shown.<br />
Figure 1. Principal Commodities Handled by BNSF in <strong>North</strong> <strong>Dakota</strong> (2009)<br />
8 Sources for the BNSF pr<strong>of</strong>ile: Annual Report to the <strong>North</strong> <strong>Dakota</strong> Public Service Commission, Annual<br />
Report to Stockholders, and press releases by BNSF <strong>of</strong>ficials.<br />
14
Canadian Pacific <strong>Rail</strong>way (CPR) 9<br />
The CPR is the seventh largest railroad system in <strong>North</strong> America. Based in Calgary,<br />
Alberta, it is a wholly owned subsidiary <strong>of</strong> Canadian Pacific Limited which also is the<br />
owner or has majority interests in Pan Canadian Petroleum, CP Hotels, and Fording Inc.<br />
CPR operates 13,199 route miles on a combined railway network that extends from St.<br />
John, Newfoundland, to Vancouver, British Columbia in Canada, throughout the U.S.<br />
Midwest and <strong>North</strong>east, and as far south as Louisville, KY. CPR has direct connections<br />
with all Class I railroads in the United <strong>State</strong>s and Canada. It also has connections to<br />
many US and Canadian regional and local railroads. In <strong>North</strong> <strong>Dakota</strong>, CPR currently<br />
operates 353 miles <strong>of</strong> main line, 121 miles <strong>of</strong> branch line, and 8 miles <strong>of</strong> trackage rights<br />
for a total <strong>of</strong> 482 miles or road in the state.<br />
The CPR markets its services throughout <strong>North</strong> America under the Canadian Pacific<br />
<strong>Rail</strong>way name, but there are four different railroads that handle the company’s business.<br />
They are: CPR, St. Lawrence & Hudson <strong>Rail</strong>way, Delaware & Hudson <strong>Rail</strong>way and Soo<br />
Line <strong>Rail</strong>road Company. Soo Line handles business for CPR in <strong>North</strong> <strong>Dakota</strong>, and in<br />
Minnesota, Wisconsin, Illinois, Indiana, and Michigan. Detail for CPR operation in ND<br />
is presented in Appendix C.<br />
Figure 2 illustrates CPR’s commodity mix using the two-digit STCC. The chart is based<br />
on CPR’s 2010 annual report to the NDPSC, which reflects 2009 traffic data for the Soo<br />
Line system. ND carloads were not reported separately. As the chart shows, farm<br />
products comprise 20.2% <strong>of</strong> total carloads handled by the Soo Line. Other major<br />
commodities transported by the CPR subsidiary include: Coal (13.2%), food products<br />
(8.5%), chemicals and allied products (10.1%), and petroleum & coal products (2.8%).<br />
Only commodities that comprise at least 1% <strong>of</strong> total carloads are shown. Appendix A<br />
provides more traffic details.<br />
Figure 2. Principal Commodities Handled by CPR in <strong>North</strong> <strong>Dakota</strong> (2009)<br />
9 Sources for the CPR pr<strong>of</strong>ile: Annual Report to NDPSC, Annual Report to Stockholders, Company Pr<strong>of</strong>ile<br />
and various press releases as posted at the CPR web site.<br />
15
Carrier Pr<strong>of</strong>iles – Regional <strong>Rail</strong>roads<br />
<strong>Dakota</strong>, Missouri Valley & Western (DVMW) 10<br />
DMVW began operation September, 1990, on track and trackage rights leased from<br />
Canadian Pacific <strong>Rail</strong>way. DMVW is headquartered in Bismarck, <strong>North</strong> <strong>Dakota</strong> and<br />
currently operates 424 miles <strong>of</strong> track and 51 miles <strong>of</strong> trackage rights, for a total <strong>of</strong> 475<br />
miles <strong>of</strong> road in the state, along with limited operations in Montana and South <strong>Dakota</strong>.<br />
The railroad interchanges with CPR at the ND cities <strong>of</strong> Flaxton, Hankinson, and Max.<br />
DMVW also has interchange capability with BNSF at Bismarck, ND. DMVW system<br />
detail is presented in Appendix C.<br />
Figure 3 illustrates the commodity mix for DMVW <strong>North</strong> <strong>Dakota</strong> traffic. The chart is<br />
based on the railroad’s 2010 annual report to the NDPSC, which reflects 2009 traffic<br />
data. DMVW handled 38,527 total carloads in ND in 2009, including bridge traffic. As<br />
shown in Figure 3, wheat, corn, soybeans, and durum comprise nearly 63% <strong>of</strong> the<br />
railroad’s total carloads in ND. Miscellaneous shipments account for just under 26%.<br />
Ethanol, DDG, flyash, lime, and ballast are the largest contributors to the miscellaneous<br />
category. More traffic details are presented in Appendix A. Only commodities that<br />
comprise at least 1% <strong>of</strong> total carloads are shown.<br />
Figure 3. Principal Commodities Handled by DMVW in <strong>North</strong> <strong>Dakota</strong> (2009)<br />
10<br />
The primary sources <strong>of</strong> the DMVW pr<strong>of</strong>ile are a company pr<strong>of</strong>ile provided by railroad <strong>of</strong>ficers and the<br />
DMVW annual report to NDSPC.<br />
16
<strong>North</strong>ern Plains <strong>Rail</strong>road (NPR) 11<br />
NPR began operation January, 1997 over 383 miles <strong>of</strong> track leased from Canadian Pacific<br />
<strong>Rail</strong>way. NPR is headquartered in Fordville, ND and currently operates 361 miles <strong>of</strong><br />
road in ND. NPR also operates track in Minnesota, from Oslo to Thief River Falls. NPR<br />
interchanges with CPR in <strong>North</strong> <strong>Dakota</strong> at Kenmare. NPR system detail is presented in<br />
Appendix C.<br />
Figure 4 illustrates the NPR <strong>North</strong> <strong>Dakota</strong> commodity mix. The chart is based on NPR’s<br />
2010 annual report to the NDPSC, which reflects 2009 traffic data. NPR handled 17,134<br />
carloads in 2009, including bridge traffic. As shown in Figure 4, wheat, soybeans, barley<br />
and durum comprised 87% <strong>of</strong> NPR carloads in <strong>North</strong> <strong>Dakota</strong> in 2009. Miscellaneous<br />
other shipments, including aggregate, fertilizer, and other grains and oilseeds, accounted<br />
for most <strong>of</strong> the remaining carloads. More traffic details are presented in Appendix A.<br />
Only commodities that comprise at least 1% <strong>of</strong> total carloads are shown.<br />
Figure 4. Principal Commodities Handled by NPR in <strong>North</strong> <strong>Dakota</strong> (2009)<br />
11<br />
The primary sources for the NPR pr<strong>of</strong>ile was compiled from newspaper articles and CPR press releases<br />
and the NPR annual report to the NDPSC.<br />
17
Red River Valley & Western <strong>Rail</strong>road (RRVW) 12<br />
RRVW began operations July 19, 1987, over track acquired from BNSF <strong>Rail</strong>way (then<br />
Burlington <strong>North</strong>ern <strong>Rail</strong>road). RRVW is headquartered in Wahpeton, ND and currently<br />
operates 453 miles <strong>of</strong> track and 87 miles <strong>of</strong> trackage rights, for a total <strong>of</strong> 540 miles <strong>of</strong><br />
road in ND, with additional operations in Minnesota. RRVW interchanges with BNSF at<br />
Breckenridge, MN, and Casselton and New Rockford, ND. RRVW has interchange<br />
capability with CPR in ND at Carrington, Enderlin, and Oakes. RRVW system detail is<br />
presented in Appendix C.<br />
Figure 5 illustrates the RRVW <strong>North</strong> <strong>Dakota</strong> commodity mix. The chart is based on<br />
RRVW’s 2010 annual report to the NDPSC, which reflects 2009 traffic data. In 2009,<br />
RRVW handled 48,103 carloads in <strong>North</strong> <strong>Dakota</strong>. Farm products shipments comprised<br />
just over 62% <strong>of</strong> the railroad’s traffic base, but the base is more diversified than that <strong>of</strong><br />
the other regional carriers. Corn, wheat, corn syrup, soybeans, and feed & mill byproducts<br />
account for a combined total <strong>of</strong> 78% <strong>of</strong> traffic. Figure 5 illustrates overall<br />
traffic percentages. More traffic details are shown in Appendix A. Only commodities<br />
that comprise at least 1% <strong>of</strong> total carloads are shown.<br />
Figure 5. Principal Commodities Handled by RRVW in <strong>North</strong> <strong>Dakota</strong> (2009 )<br />
12<br />
The primary sources <strong>of</strong> the RRVW pr<strong>of</strong>ile are a company pr<strong>of</strong>ile provided by railroad <strong>of</strong>ficers and the<br />
RRVW annual report to the NDSPC.<br />
18
Carrier Pr<strong>of</strong>iles – Local <strong>Rail</strong>roads<br />
<strong>Dakota</strong> <strong>North</strong>ern <strong>Rail</strong>road (DNRR) 13<br />
DNRR began operation February 5, 2006, on 70 miles <strong>of</strong> branch line leased from BNSF.<br />
The railroad is headquartered in Crookston, MN and is owned by KBN Group, Inc., a<br />
Minnesota corporation. DNRR currently operates 68 miles <strong>of</strong> road in <strong>North</strong> <strong>Dakota</strong> and<br />
interchanges with BNSF at Grafton. DNRR operates only in ND. The railroad’s system<br />
detail is presented in Appendix C.<br />
Figure 6 illustrates the DNRR’s commodity mix. The chart is based on DNRR’s 2010<br />
annual report to the NDPSC, which reflects 2009 traffic data. In 2009, DNRR handled<br />
2,821 carloads. Alcohol, potatoes and transportation equipment (shown as Miscellaneous<br />
on the chart) comprised just over 43% <strong>of</strong> the railroad’s traffic volume. Corn, wheat, coal,<br />
other grains and oilseeds, and fertilizer account for a combined total <strong>of</strong> nearly 57% <strong>of</strong><br />
traffic. Figure 6 illustrates overall traffic percentages. More traffic details are shown in<br />
Appendix A. Only commodities that comprise at least 1% <strong>of</strong> total carloads are shown.<br />
Figure 6. Principal Commodities Handled by DNRR in <strong>North</strong> <strong>Dakota</strong> (2009 )<br />
13<br />
The primary sources for the DNRR pr<strong>of</strong>ile are the BNSF web site, the Surface <strong>Transportation</strong> Board and<br />
the DNRR annual report to the NDPSC.<br />
19
Yellowstone Valley <strong>Rail</strong>road (YSVR) 14<br />
YSVR began operation August 15, 2005, over track leased from BNSF. YSVR is<br />
headquartered at Sidney, MT. It is one <strong>of</strong> 17 short line railroads owned by Watco<br />
Companies Inc., a Kansas corporation. YSVR is comprised <strong>of</strong> two segments totaling 171<br />
miles. The northern segment, known as the Scobey Line, runs between Bainville and<br />
Plentywood. The southern segment, known as the Sidney line, runs between Glendive<br />
and Snowden.<br />
The YSVR runs entirely in Montana, except for where the Sidney Line crosses into <strong>North</strong><br />
<strong>Dakota</strong> near Fairview and runs north for 8.7 miles before crossing back into Montana.<br />
YSVR interchanges with BNSF in Montana at Glendive, Snowdon, and Bainville.<br />
YSVR system detail is presented in Appendix C.<br />
Figure 7 illustrates the YSVR’s <strong>North</strong> <strong>Dakota</strong> commodity mix. The chart is based on<br />
YSVR’s 2010 annual report to the NDPSC, which reflects 2009 traffic data. In 2009,<br />
YSVR handled 79 carloads in <strong>North</strong> <strong>Dakota</strong>. Petroleum and petroleum products<br />
comprised more than 91% <strong>of</strong> the railroad’s ND carloads. Figure 7 illustrates overall<br />
traffic percentages. The Miscellaneous category was not defined in the railroad’s annual<br />
report. More traffic details are shown in Appendix A.<br />
Figure 7. Principal Commodities Handled by YSVR in <strong>North</strong> <strong>Dakota</strong> (2009 )<br />
14<br />
The primary source for the YSVR pr<strong>of</strong>ile is the company web site and the YSVR annual report to the<br />
NDPSC.<br />
20
<strong>Rail</strong>road Network Characteristics<br />
Track Condition and Quality Indicators<br />
Several aspects <strong>of</strong> the railroad network are important to rail planning, but track speed<br />
limits and maximum car weights in particular impact efficiency <strong>of</strong> line operations.<br />
Collectively, they indicate where railroads have concentrated investments and where<br />
investments may be necessary for continued integration <strong>of</strong> branch lines and main lines<br />
traffic.<br />
Train speed is governed by track classification, which is established by FRA. A line’s<br />
track classification is a proxy for track condition and train operating costs. Freight<br />
operations over Excepted and Class 1 track are restricted to 10 mph; freight operations<br />
over Class 2 track are restricted to 25 mph. Regional railroads view speed restrictions<br />
differently than Class I carriers. Because <strong>of</strong> flexible work rules and lower overhead costs,<br />
regional railroads feel less economic pressure to operate at higher speeds. However, the<br />
slower train speeds on long branch lines with Excepted or Class 1 track may cause crew<br />
related labor cost to be higher than normal for those lines.<br />
The gross weight limit <strong>of</strong> a line is another indicator <strong>of</strong> track quality. It is also provides an<br />
indication <strong>of</strong> the ability <strong>of</strong> a segment to interchange traffic with other segments. In the<br />
1970s, much <strong>of</strong> the branch line network was restricted to gross car weights <strong>of</strong> 220,000<br />
pounds, which allowed net loads <strong>of</strong> 70 to 80 tons. However, the need for effective use <strong>of</strong><br />
100-ton hopper cars resulted in branch line capacity limits being raised to 263,000<br />
pounds. Today, the main line track <strong>of</strong> Class I railroads supports 286,000 pound cars,<br />
which permits cargo loads <strong>of</strong> 110 to 115 tons, depending on the commodity density and<br />
the tare weight <strong>of</strong> the rail car. There are some railroads operating 315,000-pound cars in<br />
designated main line corridors. These high capacity cars permit net loads <strong>of</strong> 125 tons.<br />
Larger capacity rail cars are more efficient for railroads because a higher net to tare<br />
weight ratio generally means more railroad revenue per car without increasing the cost<br />
per bushel for the shipper. But higher carload rates for higher capacity cars may have<br />
economic consequences for shippers beyond the rate itself. With a carload rate structure,<br />
shippers pay for the total capacity <strong>of</strong> the car regardless <strong>of</strong> whether they fully use it. For<br />
example, at $4,000 per carload, a shipper who loads 111 tons on the car pays $36 per ton.<br />
A shipper who loads the same car with 100 tons pays $40 per ton.<br />
21
Figure 6 shows the average gross<br />
weight limit for each railroad in tons.<br />
The values reflect the controlling limit<br />
for each segment, weighted by the<br />
segment length. The chart shows the<br />
DMVW system is limited to 134-ton<br />
cars or 100 tons <strong>of</strong> cargo (exceptions<br />
are permitted). Much <strong>of</strong> the RRVW<br />
system is subject to similar limits.<br />
However, NPR’s system is<br />
unrestricted, even though much <strong>of</strong> it<br />
consists <strong>of</strong> light weight rail. This<br />
anomaly may reflect the substantial<br />
amount <strong>of</strong> tie and ballast work done on<br />
the Wheat Lines between 1983 and<br />
1997, when approximately $11 million<br />
<strong>of</strong> rail assistance funds were invested.<br />
It should be noted that track weight<br />
limits are set by the railroads and are<br />
subject to change. Weight limits are a<br />
compromise based on economics and<br />
engineering judgment.<br />
Figure 7 shows the average train speed<br />
limit for each carrier’s system. The<br />
underlying individual values reflect the<br />
controlling speed for each segment,<br />
weighted by the segment length. As<br />
the chart shows, all <strong>of</strong> the DMVW<br />
150<br />
145<br />
140<br />
135<br />
130<br />
Miles Per Hour<br />
50<br />
45<br />
40<br />
35<br />
30<br />
25<br />
20<br />
15<br />
10<br />
5<br />
0<br />
BNSF CPR DMVW NPR RRVW<br />
Branch and Regional Main Line<br />
Figure 6. Average Gross Weight Limit in Tons,<br />
Weighted by Segment Length<br />
DMVW NPR RRVW BNSF CPR<br />
Figure 7. Average System Speed Limit,<br />
Weighted by Line Length.<br />
system is restricted to 10 mph (exceptions are permitted under special orders). The<br />
average train speed limit on NPR is 15.3 mph; while on RRVW it is 25 mph. Both NPR<br />
and RRVW systems have both Class 1 and Class 2 track, but RRVW is mostly Class 2.<br />
As Figure 7 shows, average speed limits are higher for the Class I railroads; 45.5 mph<br />
and 43.5 mph for CPR and BNSF, respectively.<br />
22
As Figure 8 shows, considerable<br />
differences exist between branch line and<br />
main line speed limits. The controlling<br />
train speed on CPR branch lines is 25<br />
mph, as opposed to 49 mph on main lines.<br />
A similar difference in maximum speed<br />
exists on the BNSF system, where main<br />
line speeds are 30 mph greater than branch<br />
line average speeds.<br />
<strong>Rail</strong> Grade Crossing Characteristics<br />
Miles Per Hour<br />
60<br />
50<br />
40<br />
30<br />
20<br />
10<br />
0<br />
55.4<br />
25.0 25.0<br />
BNSF CPR<br />
Branch Main<br />
Figure 8. Average Class 1 Speed Limit,<br />
Weighted by Line Length.<br />
The Federal <strong>Rail</strong>road Administration (FRA) Office <strong>of</strong> Safety Analysis reported 15<br />
highway-rail incidents in <strong>North</strong> <strong>Dakota</strong> in 2009. This compares with 14 incidents in<br />
2008, 13 in 2007, and 12 in 2006. Crash data is presented graphically on page 45.<br />
Public roads with at grade crossings have warning signs to alert motorists that they are<br />
approaching a rail crossing. The crossings themselves have warning devices to alert<br />
motorists to watch for approaching trains. The devices are either passive or active.<br />
Passive devices typically include crossbucks and signs. Active devices typically include<br />
automated flashing lights and crossing gates.<br />
The AADT on the highway and the number <strong>of</strong> trains per day on the rail line are generally<br />
the dominant criteria for determining the type <strong>of</strong> warning devices used at a crossing.<br />
Several other factors may be considered as well, such as sight distance, school bus traffic,<br />
proximity to schools, local traffic patterns or unusual hazards. In <strong>North</strong> <strong>Dakota</strong>, state<br />
and federal highways with AADT <strong>of</strong> 100 or more, that cross main line railroad tracks at<br />
grade, have active warning devices. Other crossings have active devices based on review<br />
<strong>of</strong> the hazards present at the location.<br />
49.0<br />
23
Characteristics <strong>of</strong> Shipper Facilities<br />
Storage Capacity<br />
Farm product shipments comprise approximately 64% <strong>of</strong> the railroad traffic originating<br />
in <strong>North</strong> <strong>Dakota</strong>. Therefore, the organization and characteristics <strong>of</strong> grain elevators are <strong>of</strong><br />
particular importance to the rail plan. There is discussion in this section about whether<br />
<strong>North</strong> <strong>Dakota</strong> elevators are strategically organized and possess the plant configurations to<br />
take full advantage <strong>of</strong> trends in railroad transportation, such as shuttle train rates.<br />
In the 1990s BNSF introduced shuttle train rates for grain movements in the <strong>North</strong>ern<br />
Plains. To obtain these rates, shippers typically have to be able to load 110 or more 111ton<br />
covered hopper cars within 15 hours, sometimes as <strong>of</strong>ten as three times per month.<br />
This requirement makes on-site storage capacity a significant issue. As a point <strong>of</strong><br />
reference, a 110-car train <strong>of</strong> 111-ton covered hopper cars would require about 400,000<br />
bushels <strong>of</strong> wheat.<br />
Under the strict time limits imposed, 800,000 bushels may be the minimum storage<br />
capacity necessary for an elevator to function effectively in the shuttle train program. 15<br />
There are 206 grain elevators located on the BNSF system in <strong>North</strong> <strong>Dakota</strong>; 29% (60) <strong>of</strong><br />
them currently possess as much as 800,000 bushels <strong>of</strong> storage capacity. 46% (95) have<br />
less than 500,000 bushels <strong>of</strong> available capacity; they might find it difficult to consistently<br />
load three 100-car trains a month. 16<br />
The rest have less than 250,000 bushel capacity and<br />
could at best fill only about 69 cars without re-supply.<br />
Side Track Capacity<br />
Side track capacity <strong>of</strong> shipper facilities impacts railroads and the logistical efficiency <strong>of</strong><br />
the rail system. Side track capacity is measured in equivalent rail cars. For example, a<br />
Trinity Industries 286,000-pound gravity-discharge covered hopper car is approximately<br />
60 feet in length between coupling faces. It takes about 6,600 feet <strong>of</strong> track to hold 110 <strong>of</strong><br />
them. The total amount <strong>of</strong> track required for a 110-car train might exceed 7,000 feet,<br />
considering the additional space required for dedicated power and spotting clearances.<br />
15 This minimal capacity value is approximately equal to two 110-car shuttle trains. There are several<br />
rationales underlying this estimate. First, an elevator would probably need some <strong>of</strong> its storage for specialty<br />
commodities, blending, or other functions. Thus, the full capacity <strong>of</strong> an elevator may not be available for<br />
loading a given shuttle train. Second, to participate in the shuttle program, an elevator may have to load as<br />
many as three trains per month. With a 10-day interval between trains, any shortage <strong>of</strong> grain on hand<br />
could result in the elevator missing a shuttle train. Finally, it may be risky for the elevator to plan on<br />
accumulating a trainload from farms or nearby elevators by truck within 15 hours, particularly during<br />
periods <strong>of</strong> inclement weather or load limits. In many respects, storage provides a buffer against<br />
uncertainties in supply.<br />
16 This value is computed from the BNSF Grain Elevator Directory available via the Internet at bnsf.com.<br />
24
Fewer than 15% (31) <strong>of</strong> the elevators on the BNSF system in ND have track capacity for<br />
an unbroken string <strong>of</strong> more than 100 cars.<br />
Shuttle Train Elevators<br />
Shuttle train rates have caused a proliferation <strong>of</strong> shuttle loading facilities. The<br />
requirements vary by railroad, but a shuttle train is typically a 100 or 110-car train <strong>of</strong><br />
111-ton covered hopper cars. Shuttle trains usually have dedicated power, with the<br />
locomotives and cars remaining together as they move back and forth between shipper<br />
and destination. Elevators must have adequate track and grain storage capacity, as<br />
mentioned above, to be able to take advantage <strong>of</strong> shuttle rates and service.<br />
BNSF <strong>Rail</strong>way Requirements<br />
BNSF defines a shuttle facility as one “that can accept 110-cars in one string and can load<br />
or unload them in 15 hours without fouling the main line. Shuttle facilities on the<br />
RRVW network meet these requirements. Products shipped in the BNSF shuttle program<br />
include corn, wheat, and soybeans.<br />
CPR Requirements<br />
The CPR refers to shuttle trains as efficiency trains. CPR efficiency trains have 100 cars,<br />
usually with dedicated power. An efficiency train elevator is required to be able to load<br />
100 cars within 24 hours without fouling the mainline. All efficiency train facilities on<br />
the CPR and DMVW networks meet these requirements. The requirement for NPR lines<br />
is listed below. Wheat is the primary commodity shipped on CPR efficiency trains.<br />
CPR allows two exceptions to the 100 car efficiency train requirement in <strong>North</strong> <strong>Dakota</strong>.<br />
One is for trains originating on NPR lines. NPR restricts train length to a maximum <strong>of</strong> 75<br />
cars so elevators on NPR lines load 75 car trains. 75 car trains are allowed eastbound<br />
from NPR lines. Trains destined for western Canada and PNW are brought to 100 cars<br />
when they reach the CPR mainline. The other exception is a pooling arrangement where<br />
two elevators each load a certain number <strong>of</strong> cars which are later combined to make up a<br />
100 car train.<br />
Even though there are relatively few shuttle loaders in ND compared to the total number<br />
<strong>of</strong> elevators in the state, their grain handling ability is adequate for present ND crop<br />
production and movement requirements if they are operated at capacity. More shuttle<br />
loader facilities may be established, but, as the shuttle impact analysis that follows<br />
indicates, it will likely be for reasons other than the need for more crop handling capacity<br />
absent a significant change in ND crop production or distribution.<br />
25
NDDOT SHUTTLE AND BIOFUEL PLANT IMPACT ANALYSIS<br />
Shuttle Loaders<br />
Shuttle loading facilities influence commodity movement by rail, both in and out <strong>of</strong> state.<br />
They also impact the highway system. Trucks must move commodities to the shuttle<br />
facility for rail loading. There is <strong>of</strong>ten a shift <strong>of</strong> highway traffic from one road to another<br />
as shippers and producers begin transporting grain to the shuttle loaders instead <strong>of</strong> other<br />
elevators they had used before. Because shuttle loading facilities have substantial impact<br />
on the transportation system, it is important to monitor and periodically review the state’s<br />
shuttle loading system. The emerging bi<strong>of</strong>uel industry will also impact the transportation<br />
system, perhaps in ways similar to those <strong>of</strong> shuttle facilities, but it is unknown at this time<br />
to what extent. A brief analysis follows.<br />
Assumptions and data:<br />
• 286,000 lb. capacity cars are used in shuttle trains 17<br />
18<br />
• Car payload is 224,000 lbs. (112 tons).<br />
• Throughput capacity calculations assume shipment <strong>of</strong> wheat or soybeans.<br />
Throughput for corn is about 7% higher.<br />
• BNSF shuttle trains have 110 cars.<br />
• CPR shuttle trains have 100 cars.<br />
• A facility can ship a maximum <strong>of</strong> 30 shuttle trains per year. 20<br />
• The crops most commonly shipped by shuttle are corn, hard red spring wheat and<br />
soybeans.<br />
Table 3. ND Crop Production 2004 – 2006 (bushels x 1,000):<br />
Crop 2004 2005 2006 3 Year Avg<br />
Corn (for grain) 120,750 154,800 154,020 143,190<br />
Wheat 243,950 224,400 212,350 226,900<br />
Soybeans (for beans) 82,110 107,300 99,900 96,437<br />
Total Production 446,810 486,500 466,270 466,527<br />
17<br />
286,000 lb. capacity cars are assumed since they are the most widely used. In reality, not all shuttle<br />
trains are made up entirely <strong>of</strong> 286,000 lb. cars. Smaller 268,000 lb. cars are sometimes used during peak<br />
demand times when there are not sufficient larger cars available. When this happens, trains might have a<br />
mix <strong>of</strong> 286,000 lb. and 268,000 lb. cars.<br />
18<br />
Trinity Industries covered hopper, a widely used car. Gross loaded weight: 286,000 lbs.; tare weight:<br />
62,000 lbs.; load capacity: 224,000 lbs.<br />
19<br />
Wheat and soybeans are 60 lbs. per bushel. Corn is 56 lbs. per bushel. 286,000 lb. car capacity is 3700<br />
bushels <strong>of</strong> wheat or soybeans or 4000 bushels <strong>of</strong> corn. BNSF shuttle trains carry 400,000 bushels <strong>of</strong><br />
wheat or soybeans or 440,000 bushels <strong>of</strong> corn. CPR shuttle trains carry 370,000 bushels <strong>of</strong> wheat or<br />
soybeans or 400,000 bushels <strong>of</strong> corn. Numbers are rounded down to even hundreds.<br />
20<br />
Based on normal round trip duration for shuttles to Pacific <strong>North</strong>west (PNW) ports.<br />
19<br />
26
Theoretical annual throughput capacity, ND shuttle loader elevators:<br />
BNSF: 21<br />
• Wheat and Soybeans = 288 million bushels<br />
• Corn = 316 million bushels<br />
CPR: 22<br />
• Wheat and Soybeans = 266 million bushels<br />
• Corn = 288 million bushels<br />
Analysis<br />
There are 48 facilities in ND with shuttle loading capability. They are distributed along<br />
rail mainlines and branchlines. Most are north and east <strong>of</strong> the Missouri River, serving<br />
areas where shuttle crop production tends to be greatest. The theoretical annual<br />
throughput capacity <strong>of</strong> these facilities is 554 million bushels <strong>of</strong> wheat or soybeans, or 604<br />
million bushels <strong>of</strong> corn. 23<br />
That capacity is not being fully used at present, and is not<br />
likely to be unless there is a substantial increase in crop production. Over the last three<br />
years, ND averaged 466.5 million bushels per year in total production <strong>of</strong> corn, hard red<br />
spring wheat and soybeans.<br />
Theoretical throughput numbers are higher than the actual shuttle system working<br />
capacity, since calculations assume ideal conditions. 24<br />
However, real world data indicate<br />
that the system can handle more throughput than it presently does. For example,<br />
elevators with track capacity <strong>of</strong> 95 or more cars handled 228.8 million bushels <strong>of</strong> ND<br />
corn, soybean and wheat movements in 2005. If the movements had all been shuttle<br />
shipments, which they were not, they would have used less than half <strong>of</strong> the shuttle system<br />
theoretical throughput capacity.<br />
According to these data, new shuttle loading facilities will probably not be constructed in<br />
ND to increase capacity, unless there is a substantial increase in production <strong>of</strong> crops for<br />
export or a significant change in where they are grown. But shuttle loading facilities are<br />
sometimes constructed for reasons having little to do with capacity. Other factors, such<br />
as competition between railroads or elevators for market share, can determine if shuttle<br />
facilities are built, and when and where. Therefore, it’s not safe to say no new shuttle<br />
facilities will be built. We may, however, be approaching a point where new facilities<br />
will have a greater impact on existing ones than has previously been the case.<br />
Bi<strong>of</strong>uel <strong>Plan</strong>ts<br />
Nearly all bi<strong>of</strong>uel plants in <strong>North</strong> <strong>Dakota</strong>, whether operating, planned or under<br />
construction, are ethanol plants. For that reason, this discussion pertains mostly to<br />
ethanol plants.<br />
21<br />
24 facilities x 30 trains @ 400,000 bushels (wheat and soybeans) and 440,000 bushels (corn).<br />
22<br />
24 facilities x 30 trains @ 370,000 bushels (wheat and soybeans) and 400,000 bushels (corn).<br />
23<br />
Total BNSF + CPR carrying capacity.<br />
24<br />
Theoretical throughput calculations assume product and rail service is available for each facility to ship<br />
30 trains per year.<br />
27
Until recently, ethanol production in <strong>North</strong> <strong>Dakota</strong> was been limited to facilities at<br />
Grafton and Walhalla. Their combined capacity is 34 million gallons per year. 25<br />
The recent strong demand for alternatives to petroleum based energy sources, coupled<br />
with tax incentives, has stimulated this industry. The resurgence <strong>of</strong> the industry will have<br />
an impact on the ND transportation system. Consider the following:<br />
• A 50 million gallon 26<br />
ethanol plant began operation at Richardton in January, 2007.<br />
• A 50 million gallon ethanol plant began operation at Underwood in February, 2007.<br />
• Construction has begun on a 100 million gallon ethanol plant at Hankinson.<br />
• A 100 million gallon ethanol plant will be built at Casselton.<br />
• There is discussion underway regarding a 100 million gallon ethanol plant to be<br />
built near Spiritwood.<br />
• A 50 million gallon ethanol plant is being considered for siting near Williston.<br />
• Archer Daniels Midland is adding an 85 million gallon biodiesel plant to their<br />
existing canola crushing facility at Velva. 27<br />
• Bi<strong>of</strong>uel plants can function as shuttle train and unit train unloading and loading<br />
facilities.<br />
Bi<strong>of</strong>uel plants consume large amounts <strong>of</strong> raw material, and may have an impact on the<br />
transportation system similar to that <strong>of</strong> shuttle loading facilities. For example, a 100<br />
million gallon ethanol plant will consume approximately 35.5 million bushels <strong>of</strong> corn<br />
annually; a 50 million gallon biodiesel plant will consume approximately 460,000 tons <strong>of</strong><br />
canola annually.<br />
For economic reasons, it is likely most inbound raw material to ethanol plants will be by<br />
rail. For example, BNSF has established shuttle rates for corn to the ethanol plant at<br />
Richardton. However, since trucks compete favorably with trains for hauls <strong>of</strong> 300 miles<br />
or less, it is likely that most <strong>of</strong> the raw material grown within ND that bi<strong>of</strong>uel plants use<br />
will be shipped to them by truck. However, there will be some intrastate movement <strong>of</strong><br />
raw material by rail. For example, the Underwood ethanol plant is receiving some corn<br />
grown in southeast ND via rail.<br />
Bi<strong>of</strong>uel plants in ND will likely be powered by coal or natural gas. The Underwood<br />
facility is an exception. Ethanol production there will be fueled by heat from the Coal<br />
Creek Station generating plant, located nearby. In the future, ethanol plants might use<br />
distilled grain solids (DGS), a by-product <strong>of</strong> ethanol production, for fuel. Biodiesel<br />
plants might use the meal that is a by-product <strong>of</strong> vegetable oil production as a fuel source.<br />
Fueling bi<strong>of</strong>uel plants with natural gas will not impact the ND highway or rail system.<br />
Fueling them with coal, on the other hand, will. The Richardton ethanol plant, for<br />
example, uses lignite trucked from a mine near Center, ND, which causes substantial<br />
impact to the highway network in that area.<br />
25<br />
ND Agriculture Commissioner Roger Johnson in testimony before the ND Senate Finance and Taxation<br />
Committee, February 1, 2005.<br />
26<br />
Design annual production capacity.<br />
27<br />
The existing facility has been producing vegetable oil for other than fuel purposes. Total capacity will be<br />
85 million gallons.<br />
28
Depending on the number and location <strong>of</strong> coal using plants, it is possible that coal<br />
transload facilities will serve them. The Crystal Sugar operation in eastern ND models<br />
the concept. There, coal for use by the Crystal Sugar beet plants in eastern ND and<br />
western MN is delivered to a transload facility at Ardoch, ND by rail. From there it is<br />
loaded on trucks for delivery to the beet plants. Before the Ardoch facility was built, coal<br />
was delivered directly to the plants by rail. The change has significantly impacted<br />
highways and traffic patterns in the affected area.<br />
Most ethanol produced in ND will be shipped by rail to out <strong>of</strong> state destinations. Some<br />
might move within the state by rail or truck, such as to the Mandan refinery. Ethanol<br />
plants also have a DGS by-product that will be shipped via highway or rail.<br />
Conclusions:<br />
• It appears that the shuttle loading system in ND is mature in terms <strong>of</strong> capacity.<br />
• New facilities may be constructed for reasons other than the need for additional<br />
capacity.<br />
• It seems unlikely that there will be major changes in the shuttle facility network<br />
unless there is a substantial increase in crop production or a significant change in<br />
production location.<br />
• There are insufficient data at present to predict how or to what extent the bi<strong>of</strong>uel<br />
industry will influence commodity production and movements in ND.<br />
• The bi<strong>of</strong>uel industry will cause increased movement <strong>of</strong> coal into and/or within ND.<br />
• To the extent it occurs by truck, coal movement will increase costs to the public<br />
due to more frequent maintenance and construction requirements for the state’s<br />
highway system.<br />
• Bi<strong>of</strong>uel production will cause increased traffic on the state’s rail system, both for<br />
raw material to the plants and product transportation out.<br />
• Increased demand for rail service from the bi<strong>of</strong>uel industry could affect rates and<br />
service to other market segments.<br />
Figures 9-11 show the locations <strong>of</strong> shuttle and efficiency train elevators in <strong>North</strong> <strong>Dakota</strong>.<br />
The maps are overlaid on crop layers representing production levels across the state.<br />
Four types <strong>of</strong> elevators are included: BNSF 110-car shuttle elevators, CPR Efficiency<br />
Elevators, CPR Efficiency Pooling Elevators, and the 75-car limited NPR Efficiency<br />
Elevators. Figure 12 shows existing and proposed ethanol plant locations overlaid on a<br />
corn production layer. Figure 13 shows existing and proposed biodiesel locations<br />
overlaid on a canola production layer. Canola is the crop <strong>of</strong> choice for most biodiesel<br />
production, although biodiesel can be produced from soy beans or sunflower seeds as<br />
well.<br />
29
Figure 9. Shuttle Elevator Locations on Corn Production Layer<br />
_________________________________________________________________________________________________________<br />
<strong>North</strong> <strong>Dakota</strong> <strong>State</strong> <strong>Rail</strong> <strong>Plan</strong> Update<br />
29
Figure 10. Shuttle Elevator Locations on Soybean Production Layer<br />
_________________________________________________________________________________________________________<br />
<strong>North</strong> <strong>Dakota</strong> <strong>State</strong> <strong>Rail</strong> <strong>Plan</strong> Update<br />
30
Figure 11. Shuttle Elevator Locations on Wheat Production Layer<br />
_________________________________________________________________________________________________________<br />
<strong>North</strong> <strong>Dakota</strong> <strong>State</strong> <strong>Rail</strong> <strong>Plan</strong> Update<br />
31
Figure 12. Biodiesel <strong>Plan</strong>ts on a Canola Production Layer<br />
_________________________________________________________________________________________________________<br />
<strong>North</strong> <strong>Dakota</strong> <strong>State</strong> <strong>Rail</strong> <strong>Plan</strong> Update<br />
32
Figure 13. Ethanol <strong>Plan</strong>ts on a Corn Production Layer<br />
_________________________________________________________________________________________________________<br />
<strong>North</strong> <strong>Dakota</strong> <strong>State</strong> <strong>Rail</strong> <strong>Plan</strong> Update<br />
33
<strong>Rail</strong> Passenger Service and Traffic Levels<br />
The only passenger rail service in <strong>North</strong> <strong>Dakota</strong> is Amtrak’s Empire Builder, which runs<br />
from Chicago, Illinois to Seattle, Washington and Portland, Oregon. In ND, the Empire<br />
Builder operates on the BNSF main line from Fargo to Grand Forks, then west to near<br />
Fort Buford, where it crosses into Montana. The train stops at Fargo, Grand Forks, Devils<br />
Lake, Rugby, Minot, Stanley, and Williston. Service is twice daily, with one train in each<br />
direction.<br />
Figure 14 illustrates ND Amtrak ridership graphically. Table 4 lists ridership statistics by<br />
station. As Figure 14 shows, ridership has trended upward since 2002, except for 2009.<br />
The reduced numbers in 2009 may have been due to the economic downturn during that<br />
year.<br />
28 Source: Amtrak<br />
ND AMTRAK RIDERSHIP 2001-2010<br />
Figure 14. Total Amtrak Ridership in <strong>North</strong> <strong>Dakota</strong> 2001-2010 28<br />
________________________________________________________________________<br />
<strong>North</strong> <strong>Dakota</strong> <strong>State</strong> <strong>Rail</strong> <strong>Plan</strong> 34
As Table 4 shows, Minot generates the most riders <strong>of</strong> any <strong>North</strong> <strong>Dakota</strong> station by quite a<br />
large margin. The reason is not readily apparent.<br />
Table 4. Amtrak Ridership Statistics for <strong>North</strong> <strong>Dakota</strong> by Station 29<br />
City 2001 2002 2003 2004 2005 2006 2007 2008 2009 2010<br />
Devils<br />
Lake<br />
4,713 3,974 4,726 4,834 6,039 6,272 6,536 6,860 5,740 6,148<br />
Fargo 14,738 11,637 13,869 15,546 18,812 22,771 22,259 24,142 21,514 21,286<br />
Grand<br />
Forks<br />
12,923 10,481 13,024 14,638 17,847 19,574 19,916 22,842 17,928 19,751<br />
Minot 26,169 22,522 27,493 29,511 33,314 35,829 38,254 42,801 39,136 40,360<br />
Rugby 5,304 4,179 4,940 5,533 6,272 5,975 6,783 7,048 5,906 6,409<br />
Stanley 2,104 2,112 2,678 2,688 2,694 3,018 3,190 3,694 3,921 4,549<br />
Williston 16,320 13,328 16,196 16,659 19,504 21,300 22,648 23,619 21,793 24,586<br />
Totals 82,271 68,233 82,926 89,409 104,482 114,739 119,586 131,006 115,938 123,089<br />
29 Source: Amtrak. Figures are for the federal fiscal year (October 1 through September 30).<br />
________________________________________________________________________<br />
<strong>North</strong> <strong>Dakota</strong> <strong>State</strong> <strong>Rail</strong> <strong>Plan</strong> 35
________________________________________________________________________<br />
<strong>North</strong> <strong>Dakota</strong> <strong>State</strong> <strong>Rail</strong> <strong>Plan</strong> 36
CHAPTER 3 - RAILROAD FREIGHT ASSISTANCE<br />
PROGRAMS AND GUIDELINES<br />
Brief History<br />
In 1982, NDDOT established a revolving loan fund with dollars from its Local <strong>Rail</strong><br />
Service Assistance (LRSA) federal grant. LRSA became Local <strong>Rail</strong> Freight Assistance<br />
(LRFA) in 1989 when Congress modified the program and changed its name. LRFA<br />
loan funds retained their federal identity until October <strong>of</strong> 2008, when a change in federal<br />
law gave control <strong>of</strong> these funds to the states.<br />
In 1995, NDDOT established a second revolving loan fund, called the Freight <strong>Rail</strong><br />
Improvement Program (FRIP) fund, using interest from repaid LRFA loans as a funding<br />
source. FRIP is similar in purpose to LRFA, and generally follows LRFA guidelines, but<br />
the funds have always been state funds.<br />
Both LRFA and FRIP rail loan funds make available reduced-interest loans, primarily for<br />
infrastructure projects on short line railroads. 30<br />
They were created to keep the state rail<br />
assistance funds from being depleted and to provide railroads with an alternative to<br />
commercial lending sources. The low interest rate and 10-year repayment period help<br />
improve the borrower’s cash flow.<br />
The LRFA account is funded with the principal from repaid loans, plus the interest the<br />
LRFA account itself bears. The FRIP account is funded with the principal and interest<br />
from repaid FRIP loans, interest from repaid LRFA loans, and the interest the account<br />
itself bears.<br />
NDDOT freight rail assistance presently consists <strong>of</strong> the LRFA and FRIP loan funds.<br />
There is no way for them to grow, other than the interest sources already mentioned.<br />
LRFA and FRIP are described in greater detail in the next section.<br />
<strong>North</strong> <strong>Dakota</strong> Local <strong>Rail</strong> Freight Assistance Program<br />
While LRFA funds are now considered state funds, the legislation that gave control <strong>of</strong> the<br />
funds to the states says that the original intent for use <strong>of</strong> the funds should be followed.<br />
These guidelines indicate that LRFA funds may be used for:<br />
• rail line acquisition.<br />
• rail line rehabilitation.<br />
• construction <strong>of</strong> new facilities.<br />
• improving and rehabilitating rail property (to the extent necessary to allow<br />
adequate and efficient transportation on the line).<br />
• Construct or improve intermodal freight terminals.<br />
30 The interest rate on the loans is typically several points below the prime commercial lending rate.<br />
________________________________________________________________________<br />
<strong>North</strong> <strong>Dakota</strong> <strong>State</strong> <strong>Rail</strong> <strong>Plan</strong> 37
• Construct or improve rail sidings or spurs.<br />
• Construct or improve rail bridges.<br />
• Relocation <strong>of</strong> existing rail lines.<br />
• Establishing new connections between existing rail lines.<br />
LRFA loan application instructions are in Appendix F.<br />
<strong>North</strong> <strong>Dakota</strong> Freight <strong>Rail</strong> Improvement Program<br />
FRIP loan guidelines generally mirror those <strong>of</strong> LRFA. Eligible FRIP applicants include<br />
counties, cities, railroads, and current or potential users <strong>of</strong> freight railroad service. An<br />
eligible project generally is one in which the line related to the project has carried less<br />
than five million gross ton-miles <strong>of</strong> freight per mile in the year previous to the year <strong>of</strong><br />
application and which accomplishes any <strong>of</strong> the following objectives: rehabilitates a<br />
segment <strong>of</strong> rail line, results in economic development, improves transportation<br />
efficiency, promotes safety, promotes the viability <strong>of</strong> the state freight rail system, assists<br />
intermodal freight movement, or provides industry access to the national railroad system.<br />
The Director may waive the five million gross ton-miles requirement for a project if is<br />
determined that a significant public interest exists.<br />
FRIP project applications are evaluated on the basis <strong>of</strong> six criteria, each with a weighted<br />
value. The rating system generates a score for establishing project qualification and<br />
ranking. The six criteria are:<br />
1. Benefit-cost ratio.<br />
2. Line traffic density (same as LRFA).<br />
3. System connectivity enhancement.<br />
4. Enhancement to <strong>North</strong> <strong>Dakota</strong>’s economy.<br />
5. Safety and security enhancement <strong>of</strong> the ND rail system.<br />
6. Environmental and community impacts.<br />
FRIP loan application instructions are in Appendix G.<br />
Benefits <strong>of</strong> <strong>Rail</strong> Freight Assistance Programs<br />
NDDOT has provided more than $26 million in assistance since 1979 to rehabilitate more<br />
than 500 miles <strong>of</strong> rail line in the state and to help improve rail-related facilities. Without<br />
state assistance, some <strong>of</strong> the rehabilitated lines would have been abandoned. Preservation<br />
<strong>of</strong> the lines has helped maintain rail access for many <strong>North</strong> <strong>Dakota</strong> producers and<br />
manufacturers, resulting in transportation cost savings for them.<br />
Although safety benefits are difficult to quantify, it is clear that state rehabilitation<br />
funding assistance has had a positive effect on both railroad and public safety by reducing<br />
the probability <strong>of</strong> derailments on many miles <strong>of</strong> improved lines. In addition, the<br />
________________________________________________________________________<br />
<strong>North</strong> <strong>Dakota</strong> <strong>State</strong> <strong>Rail</strong> <strong>Plan</strong> 38
preservation <strong>of</strong> rail lines has helped slow the increase <strong>of</strong> heavy truck axle loads on the<br />
state’s highways, particularly the rural collectors. Finally, the freight rail assistance<br />
programs have allowed some rural communities to maintain connectivity with the<br />
national freight rail system, helping to maintain the economic base <strong>of</strong> rural areas <strong>of</strong> the<br />
state.<br />
<strong>Rail</strong> assistance projects are shown in Appendix H.<br />
Highway-<strong>Rail</strong> Grade Crossing Safety Programs<br />
About every 90 minutes someone in America is hit by a train. 31<br />
Tragically, most <strong>of</strong> those<br />
occurrences are avoidable. Most crossing accidents occur because motorists ignore<br />
warning signs, signals or safety gates. Many people seem unaware that it takes a train<br />
traveling at 50 mph approximately a mile and half to stop.<br />
This chapter describes federal and state programs and related activities aimed at<br />
improving grade crossing safety. The chapter begins with a brief history <strong>of</strong> the programs,<br />
followed by a discussion <strong>of</strong> federal and state safety improvement activities.<br />
Brief History<br />
In 1970, Congress passed the Federal <strong>Rail</strong>road Safety Act and the Highway Safety Act.<br />
Provisions in these laws required comprehensive studies <strong>of</strong> issues related to safety at<br />
highway-rail at grade crossings on the federal aid highway system (FAS). Agencies were<br />
to make recommendations for appropriate action to increase safety at these crossings for<br />
both the public and the railroads.<br />
The Federal Highway Administration (FHWA) and Federal <strong>Rail</strong>road Administration<br />
(FRA) subsequently prepared a report for Congress. Based on the report’s<br />
recommendations, Congress established a program to eliminate hazards at rail crossings.<br />
Section 203 <strong>of</strong> the Highway Safety Act <strong>of</strong> 1973 authorized $175 million from the<br />
Highway Trust Fund for crossing improvements on the FAS. A 1975 inventory revealed<br />
that 77 percent <strong>of</strong> highway–rail crossings were located <strong>of</strong>f the FAS and thus were not<br />
eligible for improvement with Section 203 funds. In 1976, Congress provided funding for<br />
all public crossings.<br />
Congress established a general hazard elimination program in the Surface <strong>Transportation</strong><br />
Assistance Act <strong>of</strong> 1978. The hazard elimination program – described in 23 U.S.C. 152 –<br />
provides funds to each state to “identify hazardous locations...and establish and<br />
implement a schedule <strong>of</strong> projects for their improvement.” 32<br />
Hazard elimination funds<br />
may be used for improvement <strong>of</strong> rail crossings. The cost share is typically 90% federal,<br />
31<br />
Estimate by Federal <strong>Rail</strong>road Administration<br />
32<br />
Funds authorized to carry out this section can be expended on any public road, other than a highway on<br />
the Interstate System. The federal cost share under this section is ninety percent.<br />
________________________________________________________________________<br />
<strong>North</strong> <strong>Dakota</strong> <strong>State</strong> <strong>Rail</strong> <strong>Plan</strong> 39
10% non-federal. 33 These funds may also be used to support crossing closures and<br />
crossing eliminations, such as grade separations. 34<br />
The Intermodal Surface <strong>Transportation</strong> Efficiency Act (ISTEA) <strong>of</strong> 1991 established the<br />
Surface <strong>Transportation</strong> Program. The Surface <strong>Transportation</strong> Program provides funds for<br />
a variety <strong>of</strong> purposes including rail-highway grade crossings safety and hazard<br />
elimination. The Safe, Accountable, Flexible, Efficient <strong>Transportation</strong> Equity Act: A<br />
Legacy for Users <strong>of</strong> 2005 (SAFETEA-LU) continues funding for rail-highway grade<br />
crossing safety and hazard elimination.<br />
Driver education and enforcement programs are major elements <strong>of</strong> federal and state<br />
highway safety improvement programs. Operation Lifesaver (OL) is perhaps the best<br />
known grade crossing educational program. OL began with a cooperative agreement<br />
between the Union Pacific <strong>Rail</strong>road and the state <strong>of</strong> Idaho in 1972. Other state programs<br />
followed. In 1978, the National Safety Council was designated as the national coordinator<br />
for individual state efforts and charged with the “development, implementation, and<br />
evaluation <strong>of</strong> a national Operation Lifesaver program.” 35 In ISTEA 1991, Congress<br />
directed the Secretary <strong>of</strong> <strong>Transportation</strong> to set aside $300,000 each fiscal year for support<br />
<strong>of</strong> OL. 36<br />
Funding for OL has been renewed with each subsequent transportation bill and<br />
is continued under SAFETEA-LU.<br />
U.S. <strong>Department</strong> <strong>of</strong> <strong>Transportation</strong> (USDOT) Action <strong>Plan</strong><br />
According to the FRA, the hazard elimination program has saved more than 10,500 lives<br />
and prevented 51,000 injuries since its inception in 1974. Since 1994, grade crossing<br />
safety efforts have resulted in a 48% reduction in the number <strong>of</strong> crossing fatalities despite<br />
steadily growing exposure. 37<br />
In 1994, USDOT formulated a <strong>Rail</strong> Highway Crossing Safety Action <strong>Plan</strong> designed to<br />
build on early successes <strong>of</strong> safety efforts. New and improved technologies and<br />
engineering solutions were an essential part <strong>of</strong> the plan, addressing three dimensions or<br />
systems:<br />
1. onboard systems, such as train horns<br />
2. highway systems, such as traffic control devices<br />
3. multimodal communication links between highway and rail systems.<br />
33<br />
The railroad share <strong>of</strong> projects that eliminate crossings at which active traffic control devices are in place,<br />
or are scheduled to be installed is five percent. Generally, railroads cannot be required to contribute to<br />
other types <strong>of</strong> improvement projects financed with federal funds. The railroad share, if any, <strong>of</strong> the cost <strong>of</strong><br />
grade crossing improvements shall be determined in accordance with 23 CFR part 646, subpart B<br />
(<strong>Rail</strong>road-Highway Projects).<br />
34<br />
Crossing eliminations include new grade separations, relocation <strong>of</strong> highways, relocation <strong>of</strong> railroads, and<br />
other crossing closures that occur without construction.<br />
35 nd<br />
U.S. Dept. <strong>of</strong> <strong>Transportation</strong>. <strong>Rail</strong>road-Highway Grade Crossing Handbook, 2 Edition, 1986.<br />
36<br />
The ISTEA amended 23 U.S.C. section 104(d) to provide for Operation Lifesaver funding.<br />
37<br />
Estimate by Volpe Center, U.S. DOT.<br />
________________________________________________________________________<br />
<strong>North</strong> <strong>Dakota</strong> <strong>State</strong> <strong>Rail</strong> <strong>Plan</strong> 40
The safety action plan set forth strategies related to enforcement, engineering, education,<br />
research, and public awareness – all crucial aspects <strong>of</strong> grade crossing safety. The goal<br />
was to achieve at least a 50% reduction from 1994 grade crossing accident and fatality<br />
levels by 2003. The plan was also designed to instill an attitude <strong>of</strong> “zero tolerance” for<br />
highway rail crossing collisions, fatalities, and injuries. 38<br />
Onboard <strong>Rail</strong>road Warning and Sounding Devices 39<br />
Research continues regarding the cost-effectiveness <strong>of</strong> alternative onboard warning<br />
devices. Although the relative cost-effectiveness <strong>of</strong> the train horn has not been<br />
established, a 1995 nationwide study by FRA suggests that silencing train horns increases<br />
crash risks by 84%. 40 Moreover, a study <strong>of</strong> local whistle bans on the Florida East Coast<br />
<strong>Rail</strong>way found that crashes at crossings with flashing lights and gates tripled when train<br />
horns were banned. 41 This finding led FRA to issue Emergency Order No. 15 in July,<br />
1991, which required railroad operators to “sound the horn.” Subsequently, in the Federal<br />
<strong>Rail</strong>road Safety Authorization Act <strong>of</strong> 1994, Congress directed FRA to require the use <strong>of</strong><br />
train horns at highway rail crossings. 42<br />
FRA was given authority to allow exceptions<br />
where supplementary safety measures fully compensated for the absence <strong>of</strong> the train<br />
horn. Also, the sounding <strong>of</strong> locomotive horns at public crossings was subject to<br />
applicable state and local laws, and many local governments legislated whistle bans,<br />
(quiet zones), within their communities.<br />
FRA interprets the 1994 statute to mean that “at a minimum, flashing lights and gates<br />
should be provided at crossings where train horns are silenced.” 43 In evaluating<br />
exceptions to the train-horn rule, FRA also judges "what supplementary measures,<br />
provided by local traffic control or law enforcement authorities, will be sufficient to<br />
compensate for loss <strong>of</strong> the train horn on corridors already equipped with flashing lights<br />
and gates.” 44<br />
38 Testimony <strong>of</strong> Jolene M. Molitoris, Federal <strong>Rail</strong>road Administrator, before the House Committee on<br />
<strong>Transportation</strong> and Infrastructure, Subcommittee on <strong>Rail</strong>roads, April 1, 1998.<br />
39 This section is summarized from: (1) the 1994 “<strong>Rail</strong>-Highway Crossing Safety <strong>Plan</strong>,” by FRA, (2)<br />
testimony <strong>of</strong> Jolene M. Molitoris, FRA, before the house Committee on <strong>Transportation</strong> and Infrastructure,<br />
Subcommittee on <strong>Rail</strong>roads, April 1, 1998, and (3) Volpe Center, Highway-<strong>Rail</strong> Grade Crossing Safety<br />
Research Publication, 1998.<br />
40 Testimony <strong>of</strong> Jolene M. Molitoris, Federal <strong>Rail</strong>road Administrator, before the House Committee on<br />
<strong>Transportation</strong> and Infrastructure, Subcommittee on <strong>Rail</strong>roads, April 1, 1998.<br />
41 Ibid.<br />
42 Specifically, Title 49, U.S.C 20153 states that: the Secretary may except from the requirement to sound<br />
the locomotive horn any categories <strong>of</strong> rail operations or categories <strong>of</strong> highway-rail grade crossings (by<br />
train speed or other factors specified by regulation) – (A) that the Secretary determines not to present a<br />
significant risk with respect to the loss <strong>of</strong> life or serious personal injury; (B) for which use <strong>of</strong> the<br />
locomotive horn as a warning measure is impractical; or (C) for which, in the judgment <strong>of</strong> the Secretary,<br />
supplementary safety measures fully compensate for the absence <strong>of</strong> the warning provided by the locomotive<br />
horn.<br />
43 Testimony <strong>of</strong> Jolene M. Molitoris, Federal <strong>Rail</strong>road Administrator, before the House Committee on<br />
<strong>Transportation</strong> and Infrastructure, Subcommittee on <strong>Rail</strong>roads, April 1, 1998.<br />
44 Ibid.<br />
________________________________________________________________________<br />
<strong>North</strong> <strong>Dakota</strong> <strong>State</strong> <strong>Rail</strong> <strong>Plan</strong> 41
In 2005, in response to a legislative mandate, FRA issued a Final Rule on the Use <strong>of</strong><br />
Locomotive Horns at Highway-<strong>Rail</strong> Grade Crossings. The Rule became effective June<br />
24. It pre-empted state and local laws regarding train horn use, but allowed the creation<br />
<strong>of</strong> quiet zones if specified criteria were met. The rule also detailed actions communities<br />
with existing whistle bans could take to meet the new standards and preserve the quiet<br />
zones they had become accustomed to.<br />
In <strong>North</strong> <strong>Dakota</strong>, the city <strong>of</strong> Fargo, in cooperation with Moorhead, MN, has established a<br />
Fargo-Moorhead Quiet Zone (QZ) along the BNSF mainline that runs through the<br />
downtown areas <strong>of</strong> both cities. Implementation <strong>of</strong> this QZ required supplemental safety<br />
measures at some crossings and closure <strong>of</strong> others. FRA also approved a one-crossing QZ<br />
in Mandan, which has been implemented. Eleven other ND cities are in the process <strong>of</strong><br />
establishing Quiet Zones, or have expressed interest in doing so.<br />
Conspicuous Locomotives<br />
Visual warning <strong>of</strong> an on-coming train is especially important at crossings with passive<br />
warning devices. In 1991, FRA began researching conspicuous locomotives. It later<br />
published rules to encourage the industry to adopt changes to make locomotives more<br />
visible to motorists and pedestrians. 45 Subsequently, railroads installed auxiliary lights,<br />
called Locomotive Alerting Lights (LAL), or “ditch lights” on locomotives. LAL are<br />
mounted low on the front <strong>of</strong> the locomotive, one on each side. The LAL and main<br />
headlights form a triangular pattern when viewed from the front. The triangular pattern<br />
and increased light output makes the train more visible and provides motorists and<br />
pedestrians with better perception <strong>of</strong> the size and speed <strong>of</strong> the approaching locomotive.<br />
A FRA benefit/cost analysis claims that installation <strong>of</strong> ditch lights has reduced grade<br />
crossing accidents in the range <strong>of</strong> ten percent for locomotives so equipped. 46<br />
Reflectorized Rolling Stock<br />
While warning <strong>of</strong> an on-coming train is important, additional warning is needed at<br />
passive warning crossings. Since there are no gates or flashing lights, drivers sometimes<br />
don’t see that a train is occupying the crossing until it is too late to avoid hitting it. These<br />
kinds <strong>of</strong> crashes cause deaths and injuries each year. After conducting research into<br />
increasing the visibility <strong>of</strong> locomotives and rail cars, FRA developed regulations<br />
requiring railroads to place reflective material on rolling stock. The requirements and<br />
compliance standards are stated in the Code <strong>of</strong> Federal Regulations (49 CFR, Part 224).<br />
Generally, railroads are required to have all locomotives in compliance by 2010 and all<br />
freight cars in compliance by 2015.<br />
45 FRA issued the first interim regulation on this subject in 1994 to encourage early installation. The<br />
requirement for Locomotive Alerting Lights became fully effective Dec. 31, 1997. LAL are now required<br />
by law.<br />
46 Testimony <strong>of</strong> Jolene M. Molitoris, Federal <strong>Rail</strong>road Administrator, before the House Committee on<br />
<strong>Transportation</strong> and Infrastructure, Subcommittee on <strong>Rail</strong>roads, April 1, 1998.<br />
________________________________________________________________________<br />
<strong>North</strong> <strong>Dakota</strong> <strong>State</strong> <strong>Rail</strong> <strong>Plan</strong> 42
Highway System Engineering and Enforcement Innovations<br />
A long-term goal <strong>of</strong> USDOT is to separate or close crossings on the National Highway<br />
System. For other at-grade crossings, USDOT describes several highway engineering<br />
improvements that warrant further research and debate, include the following:<br />
• median barriers to keep motorists from going around gates;<br />
• paired one way streets with gates extending across all lanes;<br />
• four quadrant gates that block all lanes <strong>of</strong> travel;<br />
• temporary closure <strong>of</strong> roads during whistle ban hours.<br />
Electronic enforcement, such as automated photographic identification, may prove to be<br />
an effective deterrent to those who drive around crossing gates or ignore other warning<br />
devices. Moreover, low cost options may be useful at crossings that lack automated<br />
warning devices.<br />
Enhancements <strong>of</strong> Highway <strong>Rail</strong>road Interface<br />
At many locations, linking grade crossing warning systems and highway traffic signals is<br />
<strong>of</strong> critical importance. With this arrangement, automated crossing warning devices are<br />
coordinated with traffic signals to help reduce the chance vehicles will be caught in<br />
traffic on or dangerously near the crossing. Demonstration projects are sometimes used<br />
to test such systems.<br />
Obstruction <strong>of</strong> Visibility<br />
Removing or modifying obstructions to visibility at highway rail crossings is a lowtechnology<br />
solution that can have large pay<strong>of</strong>fs. However, solutions to visibility<br />
problems frequently require communication and coordination among railroads, property<br />
owners, and public authorities.<br />
<strong>State</strong> Grade Crossing Safety Programs<br />
The <strong>North</strong> <strong>Dakota</strong> rail-highway crossing program complements the federal plan and<br />
continues an on-going grade crossing improvement program that began in 1978. Since<br />
then, the state has spent more than $30 million participating in approximately 600 grade<br />
crossing safety improvement projects.<br />
ND develops an annual list <strong>of</strong> crossing safety projects. Initially, state efforts were<br />
concentrated on signal installation on Class I railroad main line crossings because <strong>of</strong> the<br />
higher number <strong>of</strong> trains and greater train speeds. Presently, Class I main line crossings on<br />
state and federal highways with AADT <strong>of</strong> 100 or more are signalized. The emphasis has<br />
now shifted to crossings on branch lines and other crossings with safety concerns.<br />
The grade crossing program has positively impacted safety in <strong>North</strong> <strong>Dakota</strong>. There were<br />
approximately 97 motor vehicle accidents at ND railroad crossings in 1977. In 2009,<br />
________________________________________________________________________<br />
<strong>North</strong> <strong>Dakota</strong> <strong>State</strong> <strong>Rail</strong> <strong>Plan</strong> 43
there were 14 – a reduction <strong>of</strong> about 86% compared to 1977. The ND grade crossing<br />
crash history from 1977 – 2009 is portrayed graphically in Figure 15 on page 45.<br />
The state is aware <strong>of</strong> the noise impacts <strong>of</strong> train horns on communities and encourages<br />
continued research into alternative audible train warning devices. However, substantial<br />
evidence exists that banning train horns in the absence <strong>of</strong> other effective warning devices<br />
increases the risks <strong>of</strong> crossing accidents. The state does not support additional exceptions<br />
to the train horn under 49 U.S.C. 20148 unless the Secretary <strong>of</strong> <strong>Transportation</strong> determines<br />
that silencing the train horn will not pose a significant risk and supplementary safety<br />
measures exist which fully compensate for absence <strong>of</strong> the horn.<br />
If the cost-effectiveness <strong>of</strong> alternative onboard or wayside warning devices can be<br />
established, NDDOT encourages railroads to adopt new and effective warning<br />
technologies that will mitigate community noise impacts. However, the state is opposed<br />
to the substitution <strong>of</strong> new train warning devices for train horns if such substitutions would<br />
diminish safety levels.<br />
NDDOT believes that the removal or mitigation <strong>of</strong> obstructions to visibility at highway<br />
rail crossings can reduce the risk <strong>of</strong> accidents and may be a cost-effective way to reduce<br />
hazard. The state encourages proper vegetation planning and control by railroads and<br />
other property owners in the vicinity <strong>of</strong> grade crossings.<br />
Operation Lifesaver 47<br />
In 1972, a concerned Union Pacific <strong>Rail</strong>road employee, working with the support <strong>of</strong><br />
many Idaho communities, established a state-wide public education program called<br />
Operation Lifesaver (OL) in an effort to reduce the numbers <strong>of</strong> crashes, injuries and<br />
fatalities occurring at highway-rail at grade crossings. The crossing fatality rate in Idaho<br />
dropped 43 percent in the first year <strong>of</strong> OL. In 1973, the same education program was<br />
started in Nebraska, where there was a 26 percent reduction in the collision rate at rail<br />
crossings. In recent years, OL has placed increased emphasis on reducing and preventing<br />
injuries and fatalities caused by people trespassing on railroad property, in addition to the<br />
effort to reduce crashes at highway crossings.<br />
Operation Lifesaver is now active in the 49 continental United <strong>State</strong>s and Washington,<br />
D.C. In addition, OL is active in Canada, Mexico, Argentina, England and Estonia.<br />
Since its inception in 1972, this public education program has been a major factor in the<br />
dramatic reduction in injuries and fatalities at rail crossings across the nation.<br />
A cooperative effort involving education, engineering and enforcement continues to<br />
make OL successful. Education is provided by OL certified volunteers. Engineering is<br />
provided by the pr<strong>of</strong>essionals who are responsible for improving and maintaining the<br />
crossings. Enforcement is provided by state and local law enforcement <strong>of</strong>ficers who<br />
47<br />
This section summarized from the Operation Lifesaver websites: http://www.oli.org and<br />
http://www.ndsc.org/lifesaver.asp.<br />
________________________________________________________________________<br />
<strong>North</strong> <strong>Dakota</strong> <strong>State</strong> <strong>Rail</strong> <strong>Plan</strong> 44
patrol the public highways and by railroad police <strong>of</strong>ficers who guard railroad right-<strong>of</strong>way<br />
and other property against trespassers.<br />
Operation Lifesaver conducted 161 grade crossing safety presentations in ND in 2009,<br />
along with 36 training events and 23 special events. OL also serves as a resource for<br />
grade crossing safety educational materials and statistics in the state. NDDOT provides<br />
funding support to OL with an annual grant. As Figure 15 shows, there has been a<br />
general downward trend in the annual number <strong>of</strong> crashes at rail crossings in ND since the<br />
late 1970s<br />
Figure 15. <strong>North</strong> <strong>Dakota</strong> At Grade <strong>Rail</strong> Crossing Crash Data<br />
________________________________________________________________________<br />
<strong>North</strong> <strong>Dakota</strong> <strong>State</strong> <strong>Rail</strong> <strong>Plan</strong> 45
________________________________________________________________________<br />
<strong>North</strong> <strong>Dakota</strong> <strong>State</strong> <strong>Rail</strong> <strong>Plan</strong> 46
APPENDIX A<br />
TRAFFIC AND COMMODITY STATISTICS<br />
________________________________________________________________________<br />
<strong>North</strong> <strong>Dakota</strong> <strong>State</strong> <strong>Rail</strong> <strong>Plan</strong> 47
________________________________________________________________________<br />
<strong>North</strong> <strong>Dakota</strong> <strong>State</strong> <strong>Rail</strong> <strong>Plan</strong> 48
<strong>Rail</strong>road Statistics<br />
Table A.1 – BNSF Traffic Originated or Terminated in <strong>North</strong> <strong>Dakota</strong> in 2009, by STCC*<br />
Total Percent <strong>of</strong><br />
Carloads Carloads Carloads Carloads<br />
Originated Terminated Transported Transported<br />
STCC COMMODITY in ND in ND in ND In ND<br />
01 Farm Products 84,913 8,326 315,601 20.7%<br />
11 Coal<br />
35,196 25,947 395,951 26.0%<br />
20 Food and Kindred Products 23,536 786 92,978 6.1%<br />
26 Pulp, Paper, and Allied Products 1 685 24,644 1.6%<br />
28 Chemicals and Allied Products 3,875 7,044 31,577 2.1%<br />
29 Petroleum and Coal Products 3,425 2,672 15,180 1.0%<br />
37 <strong>Transportation</strong> Equipment 235 766 34,883 2.3%<br />
Grand Totals, All Traffic 156,441 63,128 1,524,813<br />
Source: Annual report to the <strong>North</strong> <strong>Dakota</strong> Public Service Commission.<br />
* There were 34 STCC Commodities reported. Only those comprising at least 1 percent <strong>of</strong> total carloads<br />
are shown. Grand Totals All Traffic includes all BNSF traffic in ND.<br />
Table A.2 – CPR-Soo Line Traffic Originated or Terminated* in 2009, by STCC**<br />
Total Percent <strong>of</strong><br />
Carloads Carloads Carloads Carloads<br />
STCC COMMODITY Originated Terminated Transported Transported<br />
01 Farm Products 90,694 46,756 140,177 20.2%<br />
11 Coal<br />
111 85,538 91,652 13.2%<br />
20 Food and Kindred Products 32,915 8,085 58,829 8.5%<br />
28 Chemicals and Allied Products 13,237 20,069 69,686 10.1%<br />
29 Petroleum and Coal Products 11,101 2,631 19,145 2.8%<br />
32 Stone, Clay, Glass & Conc. Prod. 3,786 6,316 16,829 2.4%<br />
40 Waste and Scrap Materials 7,393 4,522 10,673 1.5%<br />
Grand Totals, All Traffic 287,422 293,591 692,905<br />
Source: Annual report to the <strong>North</strong> <strong>Dakota</strong> Public Service Commission.<br />
*The report is for the Soo Line system. Numbers represent traffic for the entire system. ND traffic is not<br />
reported separately. Soo Line is a wholly owned subsidiary <strong>of</strong> CPR and handles CPR traffic in ND, MN,<br />
WI, IL, IN, and MI.<br />
** There were 28 STCC commodities reported. Only those comprising at least 1 percent <strong>of</strong> total carloads<br />
are shown. Grand Totals All Traffic includes all Soo Line traffic.<br />
________________________________________________________________________<br />
<strong>North</strong> <strong>Dakota</strong> <strong>State</strong> <strong>Rail</strong> <strong>Plan</strong> 49
Table A.3 – DMVW Traffic Originated or Terminated in <strong>North</strong> <strong>Dakota</strong> in 2009*<br />
Originate ND Terminate ND Total Traffic<br />
Description Carloads Tons Carloads Tons Carloads Tons<br />
Wheat (except durum) 4,287 537,310 0 0 4,534 589,420<br />
Durum 3,038 394,940 0 0 4,488 583,440<br />
Barley 175 22,750 0 0 192 24,960<br />
Corn 8,904 1,157,520 0 0 9,101 1,183,130<br />
Flax 268 34,840 0 0 268 34,840<br />
Soybeans 5,986 77,180 0 0 6,077 799,100<br />
Other Grains & Oilseeds 1,134 147,420 0 0 1,364 177,320<br />
Fertilizer 0 0 366 47,580 373 48,490<br />
Cement 0 0 0 0 360 46,800<br />
Petroleum & Petroleum Products 1,341 174,330 496 64,480 1,837 238,810<br />
Miscellaneous-includes Ethanol, 4,848 630,240 5,083 277,590 9,933 907,830<br />
DDG, Flyash, Lime, and Ballast<br />
Total all Traffic 29,981 3,176,530 5,945 389,650 38,527 4,634,140<br />
Source: Annual report to the <strong>North</strong> <strong>Dakota</strong> Public Service Commission.<br />
*16 commodities were reported. Commodities with less than 100 total carloads are not shown.<br />
Table A.4 – DNRR Traffic Originated or Terminated in <strong>North</strong> <strong>Dakota</strong> in 2009*<br />
Originate ND Terminate ND Total Traffic<br />
Description Carloads Tons Carloads Tons Carloads Tons<br />
Wheat 562 56,200<br />
562 56,200<br />
Barley 3 300<br />
3 300<br />
Corn 52 5,200<br />
52 5,200<br />
Other Grains and Oilseeds 713 71,300<br />
713 71,300<br />
Fertilizer<br />
74 7,400 74 7,400<br />
Coal<br />
201 20,100 201 20,100<br />
Miscellaneous-includes Alcohol,<br />
Potatoes, & Trans Equip<br />
1,216 121,600<br />
1,216 121,600<br />
Total All Traffic 2,546 254,600 275 27,500 2,821 282,100<br />
Source: Annual report to the <strong>North</strong> <strong>Dakota</strong> Public Service Commission.<br />
*All commodities reported are shown<br />
________________________________________________________________________<br />
<strong>North</strong> <strong>Dakota</strong> <strong>State</strong> <strong>Rail</strong> <strong>Plan</strong> 50
Table A.5 – NPR Traffic Originated or Terminated in <strong>North</strong> <strong>Dakota</strong> in 2009*<br />
Originate ND Terminate ND Total Traffic<br />
Description Carloads Tons Carloads Tons Carloads Tons<br />
Wheat (except durum) 5,524 718,120<br />
7,242 941,460<br />
Durum 852 110,760<br />
856 111,280<br />
Barley 2,580 335,400<br />
2,960 384,800<br />
Corn 695 90,350<br />
770 100,100<br />
Flax 122 15,860<br />
122 15,860<br />
Soybeans 2,656 345,280 110 14,300 3,836 498,680<br />
Other Grains & Oilseeds 134 17,420<br />
134 17,420<br />
Fertilizer<br />
Miscellaneous-includes<br />
408 53,040 408 53,040<br />
Aggregate<br />
and Wind Generator Components<br />
782 101,660 806 104,780<br />
Total All Traffic 12,563 1,633,190 1,300 169,000 17,134 2,227,420<br />
Source: Annual report to the <strong>North</strong> <strong>Dakota</strong> Public Service Commission.<br />
*10 commodities were reported. Commodities with less than 100 total carloads are not shown<br />
Table A.6 – YSVR Traffic Originated or Terminated in <strong>North</strong> <strong>Dakota</strong> in 2009*<br />
Originate ND Terminate ND Total Traffic<br />
Description<br />
Petroleum & petroleum<br />
Carloads Tons Carloads Tons Carloads Tons<br />
products 1 NR 71 NR 72 NR<br />
Miscellaneous 7 NR<br />
7 NR<br />
Total All Traffic 8 NR 71 NR 79 NR<br />
Source: Annual report to the <strong>North</strong> <strong>Dakota</strong> Public Service Commission.<br />
* All commodities reported are shown. YSVR did not report tons on the annual report.<br />
________________________________________________________________________<br />
<strong>North</strong> <strong>Dakota</strong> <strong>State</strong> <strong>Rail</strong> <strong>Plan</strong> 51
Table A.7 – RRVW Traffic Originated or Terminated in <strong>North</strong> <strong>Dakota</strong> in 2009*<br />
Originate ND Terminate ND Total Traffic<br />
Description Carloads Tons Carloads Tons Carloads Tons<br />
Wheat (except durum) 3,480 348,000 45 4,500 4,640 464,000<br />
Durum 3 300 351 35,100 354 35,400<br />
Corn 12,499 1,374,890<br />
14,551 1,600,610<br />
Soybeans 8,419 926,090<br />
10,891 1,198,010<br />
Barley 329 31,255 7 665 336 31,920<br />
Other Grains 243 24,300<br />
243 24,300<br />
Edible Beans, Peas 217 21,700<br />
217 21,700<br />
Flour 947 94,700<br />
947 94,700<br />
Corn Syrup 5,931 652,410<br />
5,931 652,410<br />
Sugar 1,521 152,100<br />
1,521 152,100<br />
Feed & Mill By-Products 1,565 156,500<br />
1,565 156,500<br />
Beet Pellets 652 61,940<br />
652 61,940<br />
Molasses 211 21,100<br />
211 21,100<br />
Steepwater 129 12,900<br />
129 12,900<br />
Fertilizer<br />
1,247 124,700 1,284 128,400<br />
Coal<br />
1,276 127,600 1,276 127,600<br />
Steel<br />
237 26,070 237 26,070<br />
Scrap 383 38,300 126 12,600 509 50,900<br />
Propane<br />
235 17,625 235 17,625<br />
Chemicals<br />
168 16,800 168 16,800<br />
Gravel<br />
803 80,300 803 80,300<br />
Limestone<br />
336 33,600 336 33,600<br />
Ethanol 717 not given<br />
717 not given<br />
DDG 350 not given<br />
350 not given<br />
Total All Traffic 37,596 3,916,485 4,831 479,560 48,103 5,008,885<br />
Source: Annual report to the <strong>North</strong> <strong>Dakota</strong> Public Service Commission<br />
*30 commodities were reported. Commodities with less than 100 total carloads are not shown.<br />
________________________________________________________________________<br />
<strong>North</strong> <strong>Dakota</strong> <strong>State</strong> <strong>Rail</strong> <strong>Plan</strong> 52
<strong>Rail</strong> Commodity Movements<br />
This section presents an in-depth analysis <strong>of</strong> commodity movements and describes the<br />
markets for <strong>North</strong> <strong>Dakota</strong> shipments. It begins with an overview <strong>of</strong> the principal<br />
commodities transported by railroads in <strong>North</strong> <strong>Dakota</strong>, followed by a discussion <strong>of</strong> major<br />
grain destinations and rail share <strong>of</strong> total shipments. The grain summary is followed by a<br />
digest <strong>of</strong> coal, chemical, and food products traffic data. The value <strong>of</strong> <strong>North</strong> <strong>Dakota</strong><br />
shipments and the impacts <strong>of</strong> commodity value on mode choice are summarized in<br />
conclusion. 48<br />
Table A.6 shows percent <strong>of</strong> the tons originated in <strong>North</strong> <strong>Dakota</strong> in 2008 by commodity<br />
for the top five commodities.<br />
Table A.6 – Top Commodities Originated by <strong>Rail</strong>roads in <strong>North</strong> <strong>Dakota</strong> During 2008<br />
Commodity<br />
Farm Products<br />
Tons <strong>of</strong> Freight<br />
18,400,110<br />
Percent <strong>of</strong> Total<br />
Food Products 4,857,456 16<br />
Coal & Non Metallic Minerals 4,274,357 14<br />
Chemicals 910,192<br />
Petroleum & Petroleum Products 546,436<br />
Source: Association <strong>of</strong> American <strong>Rail</strong>roads, from STB Waybill Sample.<br />
Table A.7 shows percentage <strong>of</strong> tons terminated in <strong>North</strong> <strong>Dakota</strong> during 2008 by<br />
commodity for the top five commodities.<br />
Table A.7 – Top Commodities Terminated by <strong>Rail</strong>roads in <strong>North</strong> <strong>Dakota</strong> During 2008<br />
Commodity<br />
Coal<br />
Tons <strong>of</strong> Freight<br />
6,385,979<br />
________________________________________________________________________<br />
<strong>North</strong> <strong>Dakota</strong> <strong>State</strong> <strong>Rail</strong> <strong>Plan</strong> 53<br />
62<br />
3<br />
2<br />
Percent <strong>of</strong> Total<br />
46<br />
Farm Products 3,462,337 25<br />
Chemicals 1,169,948 8<br />
Gravel, Sand, Stone 871,964 6<br />
Cement 510,012 4<br />
Source: Association <strong>of</strong> American <strong>of</strong> <strong>Rail</strong>roads, from STB Waybill Sample.<br />
48 The 2008 data in Tables 6 and 7 are based on Class I railroad QCS Reports to the STB and the AAR<br />
survey <strong>of</strong> local and regional railroads. They represent the most current complete year <strong>of</strong> state-level data<br />
available at the time this section <strong>of</strong> the rail plan was updated. The relative importance <strong>of</strong> commodities may<br />
change somewhat from year-to-year depending on economic and demand factors.
Farm Products Traffic<br />
Two data sources are used to describe farm products shipments: <strong>North</strong> <strong>Dakota</strong> Grain and<br />
Oilseed Shipment Statistics and the <strong>Rail</strong>road Waybill Sample. The Grain and Oilseed<br />
data is based on elevator reports to the <strong>North</strong> <strong>Dakota</strong> Public Service Commission,<br />
referred to hereafter as grain elevator reports. The grain elevator reports include rail and<br />
truck shipments to primary destinations, such as Minneapolis, Duluth, other Minnesota<br />
and Wisconsin, the Gulf Coast and the Pacific <strong>North</strong>west (PNW). The <strong>Rail</strong>road Waybill<br />
data is based on a random sample <strong>of</strong> railroad shipments reported to the STB. In some<br />
cases, the waybill sample provides more specific destination information than grain<br />
elevator reports. Moreover, the waybill sample includes descriptive information about<br />
shipments, such as length <strong>of</strong> haul, rate, and variable cost. The two data sources<br />
complement each other; together, they provide a comprehensive description <strong>of</strong><br />
<strong>North</strong> <strong>Dakota</strong> farm products movements.<br />
According to grain elevator reports, between 75 and 80% <strong>of</strong> the state’s grains and<br />
oilseeds are shipped by rail. As Figure A.1 shows, rail share tends to be greatest in<br />
distant markets. For example, only 35% <strong>of</strong> grain shipments terminated in state were<br />
moved by rail in 2008. These in-state shipments, destined for processing plants and<br />
terminal elevators such as the <strong>North</strong> <strong>Dakota</strong> Mill & Elevator, usually cover short<br />
distances where trucks are more competitive with railroads. In contrast, 99% <strong>of</strong> the grain<br />
moving to Duluth and 91% <strong>of</strong> the grain destined for Minneapolis travels by rail.<br />
Moreover, railroads transport about 99% <strong>of</strong> grain shipments to the PNW and 89% <strong>of</strong><br />
grain shipments to the Gulf.<br />
Figure A.1. <strong>Rail</strong> Share <strong>of</strong> Grain & Oilseeds Originating in <strong>North</strong> <strong>Dakota</strong> by Destination 49<br />
49 Source: Upper Great Plains <strong>Transportation</strong> Institute. Other MN includes movements to WI.<br />
________________________________________________________________________<br />
<strong>North</strong> <strong>Dakota</strong> <strong>State</strong> <strong>Rail</strong> <strong>Plan</strong> 54
Figure A.2 is also based on grain elevator reports. As the chart shows, approximately<br />
26% <strong>of</strong> <strong>North</strong> <strong>Dakota</strong> grain and oilseed shipments went to Minneapolis, Duluth, or other<br />
Minnesota and Wisconsin destinations in 2008-09. Many <strong>of</strong> the shipments terminated at<br />
processing plants or mills in MN and WI. However, some may have been transferred to<br />
barges at Minneapolis or re-billed to another destination, such as Chicago. The fact that<br />
20% <strong>of</strong> ND gain and oilseed shipments were terminated in-state illustrates the importance<br />
<strong>of</strong> the local processing sector <strong>of</strong> the economy.<br />
Figure A.2. Percentage <strong>of</strong> <strong>North</strong> <strong>Dakota</strong> Grain & Oilseed Shipments by Destination 50<br />
50 Source: Upper Great Plains <strong>Transportation</strong> Institute. Other MN includes shipments to Wisconsin.<br />
________________________________________________________________________<br />
<strong>North</strong> <strong>Dakota</strong> <strong>State</strong> <strong>Rail</strong> <strong>Plan</strong> 55
Table A.8 is based on the waybill sample. As the table shows, Washington is the top<br />
destination state for ND farm products. Most shipments to Washington, Oregon,<br />
Louisiana, and Texas were for export. The average distance for interstate rail movements<br />
ranged from 414 miles (Minnesota) to 1,762 miles (Gulf Coast). Average distance for<br />
PNW shipments was 1521 miles.<br />
Table A.8 – Destination <strong>State</strong> for Farm Products Originated In<br />
ND by <strong>Rail</strong> and Average Distance <strong>of</strong> Shipments - 2003 51<br />
Destination <strong>State</strong> Estimated Tons Average Distance<br />
Washington 2,886,407 1,663<br />
Wisconsin 1,907,100 551<br />
Minnesota 1,702,342 414<br />
Illinois 1,470,065 843<br />
Missouri 932,500 1,093<br />
Oregon 597,773 1,380<br />
<strong>North</strong> <strong>Dakota</strong> 526,780 167<br />
Texas 452,197 1,753<br />
Louisiana 332,471 1,771<br />
Alberta 323,498 976<br />
Table A.9 shows the number <strong>of</strong> elevators making grain and oilseed shipments, the<br />
percent using rail service, the percent shipping in various car block sizes, and the<br />
percentage <strong>of</strong> tons shipped under three railroad service levels during 2004.<br />
Table A.9 – <strong>North</strong> <strong>Dakota</strong> Grain and Oilseed Shipments by Car Block Size 52<br />
Number Shipping by Car Block Size<br />
(Percent <strong>of</strong> Elevators With a<br />
Shipment in Various Car Size Blocks)<br />
As Table A.9 shows, 30% <strong>of</strong> RRVW and 20% <strong>of</strong> DMVW grain shipments moved in<br />
l-to-24 car blocks in 2004. Most grain was moved in 50+ car shipments.<br />
51 Source: 2003 Waybill Sample<br />
52 Source: Upper Great Plains <strong>Transportation</strong> Institute<br />
Tons Shipped by Car Block Size (Percent <strong>of</strong><br />
<strong>Rail</strong> Tonnage Shipped in Each Car Size<br />
Block)<br />
1-24 Cars 25-49 Cars 50+ Cars 1-24 Cars 25-49 Cars 50+ Cars<br />
BNSF 123 72 47 761,405 1,239,784 4,019,229<br />
(51%) (30%) (19%) (13%) (21%) (67%)<br />
CPR 32 23 13 367,273 431,644 1,338,240<br />
(47%) (34%) (19%) (17%) (20%) (63%)<br />
DMVW 17 16 13 277,501 314,736 787,187<br />
(37%) (35%) (28%) (20%) (23%) (57%)<br />
NPR 19 12 10 242,297 186,487 612,226<br />
(46%) (29%) (24%) (23%) (18%) (58%)<br />
RRVW 30 17 10 443,363 403,066 631,965<br />
(53%) (30%) (17%) (30%) (27%) (43%)<br />
DNRR NA NA NA NA NA NA<br />
YSVR NA NA NA NA NA NA<br />
________________________________________________________________________<br />
<strong>North</strong> <strong>Dakota</strong> <strong>State</strong> <strong>Rail</strong> <strong>Plan</strong> 56
As Figure A.3 shows, about 67% <strong>of</strong> grain shipments from BNSF elevators consisted <strong>of</strong><br />
50 cars or more. Moreover, shipments <strong>of</strong> 50 cars or more comprised 63% to 43% <strong>of</strong> grain<br />
traffic handled by CPR, DMVW, NPR, and RRVW.<br />
Figure A.3. Percentages <strong>of</strong> Grain Shipped in Blocks <strong>of</strong> 50 Cars or More in 2004 53<br />
<strong>Rail</strong>road<br />
80%<br />
70%<br />
60%<br />
50%<br />
40%<br />
30%<br />
20%<br />
10%<br />
0%<br />
BNSF CPR NPR<br />
Percentage<br />
DMVW RRVW<br />
Coal, Chemical, and Food Products Traffic<br />
The railroad waybill sample is the only consistent source <strong>of</strong> information for commodities<br />
other than grain. The waybill sample is collected each year by the Surface <strong>Transportation</strong><br />
Board. The sampling frame is the terminating railroad. All railroads that terminated more<br />
than 4,500 revenue carloads <strong>of</strong> freight during any <strong>of</strong> the previous three years, or any<br />
railroad that terminated more than 5% <strong>of</strong> the traffic in a given state during any <strong>of</strong> the<br />
previous three years, must participate in the sample. The sampling unit is the waybill,<br />
which is created each time a shipment is consigned, with the possible exception <strong>of</strong><br />
contract movements.<br />
The sampling process uses a stratified random sampling procedure based on the number<br />
<strong>of</strong> cars per shipment. The sampling strata and corresponding rates are: 1-2 cars (1:40), 3-<br />
15 cars (1:12), 16-60 cars (1:4), 61-100 cars (1:3), and more than 100 cars (1:2).<br />
In addition to the waybill sample, the <strong>Department</strong> <strong>of</strong> Energy (DOE) publishes<br />
information regarding coal movements from mines to utilities. According to DOE and<br />
waybill data, about 85% <strong>of</strong> the coal tonnage originated in <strong>North</strong> <strong>Dakota</strong> is terminated instate.<br />
The remaining coal movements originated in <strong>North</strong> <strong>Dakota</strong> are terminated<br />
elsewhere in the northern plains region.<br />
53 Source: Upper Great Plains <strong>Transportation</strong> Institute<br />
________________________________________________________________________<br />
<strong>North</strong> <strong>Dakota</strong> <strong>State</strong> <strong>Rail</strong> <strong>Plan</strong> 57
Destinations for food and kindred products are much more dispersed than are coal or<br />
grain destinations. Illinois, Minnesota, Washington, California, Missouri, Texas, and<br />
<strong>North</strong> <strong>Dakota</strong> were the principal destination states for railroad shipments in 2003 (Table<br />
A.10). 54<br />
Average shipment distances ranged from less than 200 miles to more than 2,300<br />
miles. Essentially, all coal, chemical and food products traffic moved in single-car<br />
consignments.<br />
More than 78% <strong>of</strong> farm products traffic terminated in-state in 2003 originated from<br />
<strong>North</strong> <strong>Dakota</strong> or Montana. Approximately 66% <strong>of</strong> the chemical shipments terminated instate<br />
in 2003 originated from Alberta, Florida, or Minnesota.<br />
Table A.10 – Major Destinations for Food Products Originated in ND by <strong>Rail</strong>, 2003 55<br />
Destination Estimated Tons Average Cars Per Shipment Average Distance<br />
Illinois 1,327,920 1.09 690<br />
Minnesota 524,220 1.70 286<br />
Washington 362,000 1.00 1,598<br />
California 334,056 3.33 2,349<br />
Missouri 305,520 1.21 958<br />
Texas 252,516 2.32 1,502<br />
<strong>North</strong> <strong>Dakota</strong> 200,608 10.03 157<br />
54<br />
The 2003 waybill sample was the most recent data set available at the time the rail plan was prepared.<br />
55<br />
Source: 2003 Waybill Sample<br />
________________________________________________________________________<br />
<strong>North</strong> <strong>Dakota</strong> <strong>State</strong> <strong>Rail</strong> <strong>Plan</strong> 58
Value <strong>of</strong> <strong>North</strong> <strong>Dakota</strong> Shipments<br />
The Bureau <strong>of</strong> <strong>Transportation</strong> Statistics (BTS) has published estimates <strong>of</strong> the value <strong>of</strong><br />
<strong>North</strong> <strong>Dakota</strong> shipments and mode use based on the 2002 Commodity Flow Survey<br />
(CFS). The CFS is a survey <strong>of</strong> 200,000 domestic establishments conducted by the Census<br />
Bureau. These establishments were randomly selected from a universe <strong>of</strong> 800,000<br />
establishments in manufacturing, mining, wholesale, auxiliary warehouses, and other<br />
select activities in the retail and service sectors <strong>of</strong> the economy. Note that CFS is a<br />
sample <strong>of</strong> establishments, not <strong>of</strong> shipments. Moreover, as sample data, the statistics are<br />
subject to potential error when used to estimate population values. However, the data are<br />
useful for comparison to other data sources and for analyzing the value <strong>of</strong> shipments and<br />
mode share.<br />
Based on this survey, BTS estimates that about 61 million tons <strong>of</strong> freight was originated<br />
by all modes in <strong>North</strong> <strong>Dakota</strong> during 2002, and that the goods were valued at<br />
approximately $11 billion. Figure A.4 shows the top five commodities originated in<br />
<strong>North</strong> <strong>Dakota</strong> during 2002 in terms <strong>of</strong> value. The 2002 data was the most recent<br />
available at time <strong>of</strong> publication.<br />
Figure A.4. Top Commodities Originated in ND, by Percentage <strong>of</strong> Total Value. 56<br />
Percent <strong>of</strong> Total<br />
25%<br />
20%<br />
15%<br />
10%<br />
5%<br />
0%<br />
Farm<br />
Products<br />
Food<br />
Products<br />
56 Source: 2002 Commodity Flow Survey<br />
Machinery Petroleum Motorized<br />
Vehicles<br />
________________________________________________________________________<br />
<strong>North</strong> <strong>Dakota</strong> <strong>State</strong> <strong>Rail</strong> <strong>Plan</strong> 59
Figure A.5 shows the estimated distribution <strong>of</strong> shipments originated from <strong>North</strong> <strong>Dakota</strong><br />
by mode <strong>of</strong> transport. Trucks moved about 69% <strong>of</strong> the value <strong>of</strong> originated traffic during<br />
2002, but only 42% <strong>of</strong> the weight. In comparison, railroads moved about 18.6% <strong>of</strong><br />
originated shipments in terms <strong>of</strong> weight, but only 13.9% in terms <strong>of</strong> value. The<br />
comparisons clearly illustrate the distribution <strong>of</strong> high-value manufactured and low-value<br />
bulk products among the two surface modes, particularly when the value <strong>of</strong> parcel and<br />
small freight shipments are considered. About 38% <strong>of</strong> the value and 56% <strong>of</strong> the weight <strong>of</strong><br />
shipments originated in <strong>North</strong> <strong>Dakota</strong> were shipped to destinations within the state.<br />
About 62% <strong>of</strong> the value and 29% <strong>of</strong> the weight <strong>of</strong> <strong>North</strong> <strong>Dakota</strong> shipments went to other<br />
states.<br />
Figure A.5. Distribution <strong>of</strong> ND Shipments Among Modes Based on Value and Weight 57<br />
Percentage<br />
80%<br />
70%<br />
60%<br />
50%<br />
40%<br />
30%<br />
20%<br />
10%<br />
0%<br />
Truck <strong>Rail</strong> Parcel Other<br />
Mode<br />
57 Source: 2002 Commodity Flow Survey<br />
Value<br />
Weight<br />
________________________________________________________________________<br />
<strong>North</strong> <strong>Dakota</strong> <strong>State</strong> <strong>Rail</strong> <strong>Plan</strong> 60
APPENDIX B<br />
RAIL LINE ABANDONMENTS<br />
________________________________________________________________________<br />
<strong>North</strong> <strong>Dakota</strong> <strong>State</strong> <strong>Rail</strong> <strong>Plan</strong> 61
________________________________________________________________________<br />
<strong>North</strong> <strong>Dakota</strong> <strong>State</strong> <strong>Rail</strong> <strong>Plan</strong> 62
<strong>Rail</strong> Abandonment Overview<br />
1,774 miles <strong>of</strong> railroad have been abandoned in <strong>North</strong> <strong>Dakota</strong> since 1936. However, only<br />
26 miles were abandoned prior to 1970. As Figure B.1 shows, most <strong>of</strong> the abandonments<br />
occurred during the 1980s, when 715 miles <strong>of</strong> line were abandoned. The timing and<br />
location <strong>of</strong> abandonments reflects deregulation and the cumulative impacts <strong>of</strong> deferred<br />
track maintenance during the 1960s and 1970s, and the trend in ND toward fewer<br />
numbers <strong>of</strong> grain elevators, but increased storage capacity <strong>of</strong> those elevators.<br />
Figure B.1. Miles <strong>of</strong> <strong>Rail</strong>road Abandoned in <strong>North</strong> <strong>Dakota</strong> Since 1970 58<br />
Abandonment Procedures and Regulations<br />
The ICC Termination Act <strong>of</strong> 1995 requires rail abandonments to be approved by the<br />
Surface <strong>Transportation</strong> Board (STB). The STB has established two types <strong>of</strong><br />
abandonment procedures – Non-Exempt (full) and Exempt. <strong>Rail</strong>roads may use either or<br />
both <strong>of</strong> these procedures to accomplish abandonments. A brief description <strong>of</strong> each<br />
follows. Virtually all abandonments in <strong>North</strong> <strong>Dakota</strong> are Exempt proceedings.<br />
Full Abandonment<br />
STB evaluates full abandonment filings using two basic criteria. The first is the need <strong>of</strong><br />
local communities and shippers for continued service. The second is the broader public<br />
interest in freeing railroads from financial burdens that drain resources and lessen their<br />
ability to operate economically elsewhere. The railroad has to show that continued<br />
operation <strong>of</strong> the line it wants to abandon will be a financial burden.<br />
58 Source: <strong>North</strong> <strong>Dakota</strong> PSC, NDDOT 2005<br />
________________________________________________________________________<br />
<strong>North</strong> <strong>Dakota</strong> <strong>State</strong> <strong>Rail</strong> <strong>Plan</strong> 63
There are four steps in the Non–Exempt abandonment process. In the first step, railroads<br />
communicate full abandonment intentions on what is known as a System Diagram Map.<br />
The System Diagram Map is used for full abandonments only and nothing related to<br />
exempt abandonments appears on it. The System Diagram Map is color-coded to show<br />
five categories <strong>of</strong> lines:<br />
1. Lines or portions <strong>of</strong> lines for which the railroad expects to file abandonment<br />
application within three years <strong>of</strong> the filing date <strong>of</strong> the map or amendment;<br />
2. Lines or portions <strong>of</strong> lines the carrier has under study and believes may be subject<br />
to future abandonment application;<br />
3. Lines or portions <strong>of</strong> lines for which an abandonment application is pending before<br />
the STB;<br />
4. Lines that are presently being operated with financial assistance;<br />
5. All other lines or portions <strong>of</strong> lines the carrier owns and operates, directly or<br />
indirectly.<br />
The second step in the Non–Exempt process requires the railroad to provide the STB with<br />
a Notice <strong>of</strong> Intent, informing it <strong>of</strong> the railroad’s plans to abandon. The Notice <strong>of</strong> Intent is<br />
to be received by STB 15-30 days before an Abandonment Application is filed.<br />
Filing an Abandonment Application is the third step in the process. The abandonment<br />
application is used by the railroad to provide detailed information about costs and<br />
revenues on the subject line, as well as the overall financial condition <strong>of</strong> the railroad.<br />
The fourth step in the process is the STB decision. After receipt <strong>of</strong> the abandonment<br />
application by the STB, there is a 45-day window during which protests may be filed.<br />
All parties involved in the abandonment process may access prior filings, including the<br />
System Diagram Map, Notice <strong>of</strong> Intent, and Abandonment Application, and may base<br />
protests upon these documents. If no successful protests are lodged and the railroad can<br />
prove that the burden caused by the operation <strong>of</strong> the line is greater than the benefit <strong>of</strong><br />
continued operation, the line is abandoned.<br />
Exempt Abandonment<br />
The Exempt abandonment process is much more streamlined. There is no requirement to<br />
file a System Diagram Map or amendment. There are two exempt abandonment<br />
procedures, the Notice <strong>of</strong> Exemption and the Petition for Exemption.<br />
The most used procedure for ND abandonments is the Notice <strong>of</strong> Exemption, where the<br />
railroad files such notice with the STB. A railroad may file a Notice <strong>of</strong> Exemption if: 1)<br />
no local traffic has moved over a line for at least two years; 2) any overhead traffic on the<br />
line can be rerouted over other lines; 3) no formal complaint is filed by a user <strong>of</strong> the<br />
service on the line or by a government entity acting on behalf <strong>of</strong> a user.<br />
________________________________________________________________________<br />
<strong>North</strong> <strong>Dakota</strong> <strong>State</strong> <strong>Rail</strong> <strong>Plan</strong> 64
The Petition for Exemption procedure begins with the railroad filing a Petition for<br />
Exemption with the STB. The carrier must prove, and STB confirm, the following before<br />
approval is granted for the Petition for Exemption:<br />
• that the line is not necessary to carry out the rail transportation policy <strong>of</strong> the<br />
United <strong>State</strong>s Government;<br />
• that the line is <strong>of</strong> limited scope;<br />
• that continued regulation is unnecessary to protect shippers from abuse <strong>of</strong> market<br />
power.<br />
All abandonment procedures require that opportunity be granted for public protest or<br />
comment regarding the abandonment, and that sufficient time be allowed for <strong>of</strong>fers <strong>of</strong><br />
financial assistance to be made for the purpose <strong>of</strong> keeping the line in operation. 59<br />
Feeder <strong>Rail</strong>road Development Program<br />
In addition to provisions previously discussed, the Staggers <strong>Rail</strong> Act also established the<br />
Feeder <strong>Rail</strong>road Development Program, which gives STB authority to require sales <strong>of</strong><br />
light-density lines to Aresponsible owners.@ A line is eligible for forced sale if it appears<br />
in Category 1 or 2 <strong>of</strong> the System Diagram map but the carrier has not yet filed an<br />
abandonment application for it, or if the public convenience and necessity (the pubic<br />
good) requires it. To force a line sale under the public convenience and necessity<br />
criterion, a potential purchaser must show that:<br />
• the operating carrier has refused to provide adequate service to shippers within a<br />
reasonable period <strong>of</strong> time;<br />
• transportation over the line is inadequate for the majority <strong>of</strong> shippers;<br />
• sale <strong>of</strong> the line would not have an adverse financial or operational impact on the<br />
current carrier;<br />
• sale <strong>of</strong> the line would likely result in improved service for shippers.<br />
Two basic conditions are placed on a forced line sale:<br />
1. The purchase price must be at least equal to the greater <strong>of</strong> these two computed<br />
values: Going Concern or Net Liquidation. This provision is designed to protect<br />
the existing carrier’s investment.<br />
2. Potential purchasers must meet these criteria:<br />
Financially responsible party capable <strong>of</strong> assuring continued operations for<br />
at least three years;<br />
Not Class I or Class II carrier;<br />
Willing and able to pay the purchase price.<br />
No rail lines in <strong>North</strong> <strong>Dakota</strong> have been acquired under the feeder railroad program.<br />
Table B.1 begins on the next page. It shows rail line abandonments in <strong>North</strong> <strong>Dakota</strong> since<br />
1936.<br />
59 These sections paraphrase abandonment procedures outlined in<br />
http://www.iowarail.com/pdfs/rail_abandonment_brochure.pdf<br />
and http://www.stb.dot.gov/stb/docs/Abandonments%20and%20Alternatives1.pdf<br />
________________________________________________________________________<br />
<strong>North</strong> <strong>Dakota</strong> <strong>State</strong> <strong>Rail</strong> <strong>Plan</strong> 65
Table B.1 – <strong>North</strong> <strong>Dakota</strong> <strong>Rail</strong> Line Abandonments Since 1936<br />
NORTH DAKOTA RAIL LINE ABANDONMENTS<br />
NDPSC CASE STB DOCKET RAILROAD* LINE MILES YEAR**<br />
1045<br />
MILW Brampton to Cogswell 7.50 1936<br />
A-193<br />
GN Walhalla to the Canadian Border 5.30 1936<br />
A-194<br />
GN St. John to the Canadian Border 3.60 1936<br />
----<br />
GN Clifford to Portland 10.00 1962<br />
1449<br />
MID-CON Clementsville to Edgeley 48.50 1970<br />
1451<br />
BN Maxbass to Dunning 4.70 1972<br />
1450<br />
BN Rutland to Ludden 30.20 1974<br />
IRC 3<br />
BN Neche to the Canadian Border 1.00 1976<br />
IRC 8<br />
BN Blanchard to Mayville 10.10 1976<br />
IRC 23<br />
BN Minnewauken to Brinsmade 7.50 1976<br />
IRC 23 (Sub 1)<br />
BN Brinsmade to Leeds 9.90 1977<br />
IRC 39<br />
BN Jamestown to Klose 5.90 1979<br />
IRC 43<br />
MILW Fargo to the SD border 70.40 1980 P<br />
IRC 50<br />
MILW Edgeley to the SD border 31.50 1980 P<br />
IRC 56<br />
MILW Brampton to the SD border 4.50 1980 P<br />
IRC 57<br />
BN Ellendale to Forbes 13.50 1980 P<br />
IRC 62<br />
BN Devils Lake to Warwick 21.10 1980 C<br />
IRC 63<br />
BN Joliette to Pembina 12.20 1980 P<br />
IRC 73<br />
BN Fairview Junction to Great Bend 8.80 1981 P<br />
IRC 76<br />
BN Binford to McHenry 11.70 1981 C<br />
IRC 77<br />
BN Newburg to Denning 5.60 1981 N<br />
IRC 82<br />
MILW New England to the SD Border 123.80 1892 P<br />
IRC 84<br />
BN Golva to the MT Border 7.40 1981 P<br />
IRC 97<br />
BN Wolford to Dunseith 23.40 1982 P<br />
IRC 100<br />
BN Casselton to Amenia 6.10 1982 C<br />
IRC 101<br />
BN Rolla to St. John 7.20 1982 N<br />
IRC 103<br />
SOO LINE Wimbledon to Clementsville 9.30 1982 N<br />
IRC 105<br />
BN Grand Forks to Honeyford 16.60 1983 C<br />
IRC 106<br />
BN Edgeley to Streeter 39.40 1983 P<br />
IRC 109<br />
BN Ludden Junction to Ellendale 20.10 1984 P<br />
IRC 110<br />
BN Beach to Golva 12.90 1984 P<br />
IRC 111<br />
BN Truax to Truax Junction 6.70 1984 P<br />
IRC 113<br />
BN Regan to Wilton 11.50 1984 P<br />
IRC 115<br />
BN Loraine to Sherwood 7.60 1984 N<br />
IRC 116<br />
BN Zeeland to the SD Border 6.00 1984 P<br />
IRC 117<br />
SOO LINE Egeland to Amourdale 19.60 1984 N<br />
IRC 119<br />
BN Westhope to Antler 13.00 1985 N<br />
IRC 120<br />
BN Hunter to Blanchard 10.50 1985 C<br />
IRC 125<br />
BN Zap to Killdeer 40.90 1984 P<br />
IRC 128<br />
BN Mandan to Mott 99.40 1986 N<br />
IRC 132<br />
SOO LINE Bismarck to M<strong>of</strong>fit 22.10 1986 N<br />
IRC 135<br />
SOO LINE Ashley to the SD Border 16.30 1987 N<br />
________________________________________________________________________<br />
<strong>North</strong> <strong>Dakota</strong> <strong>State</strong> <strong>Rail</strong> <strong>Plan</strong> 66
IRC 139<br />
BN Fargo to Horace 8.10 1988 N<br />
IRC 140<br />
BN Rogers to Dazey 7.70 1988 N<br />
IRC 143<br />
BN Fairview to Watford City 36.60 1992 C<br />
IRC 144<br />
CPR Drake to Baker 40.90 1991 N<br />
IRC 149<br />
RRVW Alice to Lucca 8.70 1992 N<br />
IRC 150<br />
BN Linton to Zeeland 29.90 1993 N<br />
IRC 151<br />
BN McCanna to Conway 16.70 1993 N<br />
IRC 152<br />
BN Towner to Newburg 35.00 1993 N<br />
IRC 153<br />
BN Glasston to Neche 19.20 1993 N<br />
IRC 154<br />
BN Mohall to Loraine 7.40 1993 N<br />
IRC 157<br />
CPR Harlow to Baker 5.50 1995 N<br />
IRC 158<br />
BN Devils Lake to Hansboro 65.70 1996 N<br />
IRC 159<br />
BN Hannaford to Binford 25.10 1996 N<br />
IRC 163 AB-391-3-X RRVW Maddock to Esmond 11.90 1997 N<br />
IRC 164 AB-493-3-X TT Hamar to Warwick 5.90 1997 N<br />
IRC 165 AB-493-4-X TT Minot to Tatman (Minot AF Base) 12.70 1997 N<br />
IRC 166 AB-391-4-X RRVW Oberon to Minnewauken 10.60 1998 N<br />
IRC 170 AB-391-5-X RRVW Woodworth to Regan 59.70 1999 N<br />
IRC 172 AB-391-6-X RRVW Casselton to Alice 18.70 1999 N<br />
IRC 173 AB-391-7-X RRVW Bowdon to Turtle Lake 56.30 2000 N<br />
IRC 174 AB-57-49-X CPR Wishek to Ashley 19.00 1999 N<br />
IRC 175 AB-6-386-X BNSF Valley City Low Line 7.90 1999 N<br />
IRC 178 AB-577-0-X MRI Granville to Lansford 29.80 2001 N<br />
IRC 179 AB-391-8-X RRVW Oakes to the SD Border 13.60 2001 N<br />
IRC 180 AB-391-9-X RRVW Lucca to Marion 32.90 2002 N<br />
IRC 182 AB-6-393-X BNSF Tolan to Hamar 6.00 2002 N<br />
IRC 183 AB-6-394-X BNSF Powers Lake to Grenora 60.50 2002 N<br />
RR-04-165 AB-6-415-X BNSF Langdon to Hannah 20.93 2004 N<br />
RR-04-175 AB-6-416-X BNSF Souris to Westhope 15.50 2004 N<br />
RR-04-190 AB-6-419-X BNSF Walum to Dazey 4.69 2004 N<br />
RR-04-202 AB-6-420-X BNSF Antelope Valley Station to Zap 3.36 2004 N<br />
RR-04-198 AB-6-418-X BNSF Hannah Junction to McCanna 6.50 2004 N<br />
RR-04-291 AB-57-54-X CPR Devils Lake to Harlow 28.35 2004 N<br />
RR-04-401 AB-391-10-X RRVW Carrington to Bowden 27.76 2004 N<br />
RR-04-625 AB-6-427-X BNSF Sanborn to Rogers 8.00 2005 N<br />
RR-05-208 AB-6-933-X DMVW M<strong>of</strong>fit to Linton 32.30 2005 N<br />
RR-05-656 AB-6-432-X BNSF Voss to Grafton 7.12 2005 N<br />
RR-06-258 AB-6-439-X BNSF Bottineau to Souris 11.90 2006 N<br />
RR-07-693 AB-1003-0-X MCR Lakota to Munich 44.44 2007 N<br />
RR-08-245 AB-577-1-X MRI Voss to Forest River 7.06 2008 N<br />
RR-08-636 AB-57-56-X CPR Bisbee to Kramer 60.50 2008 N<br />
RR-07-693 AB-1003-1-X MCR Calvin to Sarles 5.40 2010 N<br />
RR-10-645 AB-6-473-X BNSF Bisbee to Rolla 17.75 2010 N<br />
TOTAL MILES ABANDONED<br />
1796.86<br />
________________________________________________________________________<br />
<strong>North</strong> <strong>Dakota</strong> <strong>State</strong> <strong>Rail</strong> <strong>Plan</strong> 67
*<strong>Rail</strong>road Company Legend<br />
BN Burlington <strong>North</strong>ern<br />
BNSF Burlington <strong>North</strong>ern Santa Fe - BNSF <strong>Rail</strong>way Company<br />
CPR Canadian Pacific <strong>Rail</strong>way<br />
DMVW <strong>Dakota</strong> Missouri Valley & Western<br />
GN Great <strong>North</strong>ern<br />
MCR Mohall Central <strong>Rail</strong>road<br />
MID-CON Mid Continent<br />
MILW Milwaukee Road<br />
MRI Mohall <strong>Rail</strong>road Inc.<br />
RRVW Red River Valley & Western<br />
SOO Soo Line<br />
TT<br />
Track<br />
Tech<br />
**<strong>North</strong> <strong>Dakota</strong> Public Service Commission (NDPSC) Response<br />
P = NDPSC filed a protest with the ICC/STB.<br />
C = NDPSC filed comments with the ICC/STB.<br />
N = NDPSC did not file a protest or comments with the ICC/STB.<br />
SOO LINE is used as the railroad name in abandonment petitions prior to 1990 that were<br />
for Canadian Pacific <strong>Rail</strong>way lines in <strong>North</strong> <strong>Dakota</strong>. CPR is used as the company reference<br />
from 1990 on.<br />
Soo Line is used as the company name in abandonment petitions prior to 1990 that were for<br />
Canadian Pacific <strong>Rail</strong>way lines in <strong>North</strong> <strong>Dakota</strong>. CPR is used as the company reference from<br />
1990 on.<br />
________________________________________________________________________<br />
<strong>North</strong> <strong>Dakota</strong> <strong>State</strong> <strong>Rail</strong> <strong>Plan</strong> 68
APPENDIX C<br />
DESCRIPTION OF NORTH DAKOTA RAIL LINES<br />
________________________________________________________________________<br />
<strong>North</strong> <strong>Dakota</strong> <strong>State</strong> <strong>Rail</strong> <strong>Plan</strong> 69
________________________________________________________________________<br />
<strong>North</strong> <strong>Dakota</strong> <strong>State</strong> <strong>Rail</strong> <strong>Plan</strong> 70
Devils Lake Subdivision (BNSF):<br />
Grand Forks-Surrey Line<br />
(BN012, BN022, & BN028)<br />
The BNSF Devils Lake Subdivision<br />
consists <strong>of</strong> the mainline track between<br />
Grand Forks and Surrey. The subdivision<br />
begins at milepost 0.4 in Grand Forks, at<br />
the Devils Lake Switch, and from there<br />
runs west 195.9 miles to the Surrey station. The Devils Lake subdivision connects to the<br />
BNSF KO Subdivision at Surrey. The traffic density over the line is between 5 and 9.99<br />
million gross ton-miles per mile. The maximum speed for freight trains on the Devils<br />
Lake Subdivision line is 50 miles per hour and the maximum carload is 143 tons.<br />
Detailed information about this segment is given in Table C.1. The Amtrak Empire<br />
Builder also uses this line. The maximum speed for passenger trains is 79 miles per hour.<br />
Table C.1 Devils Lake Subdivision Grand Forks-Surrey Line<br />
Beginning<br />
Milepost<br />
Ending<br />
Milepost<br />
Maximum<br />
Speed<br />
Maximum<br />
Carload<br />
Traffic Density<br />
(Million Gross Ton<br />
Miles/Mile)<br />
0.0 196.3 50 mph 143 tons 5-9.99<br />
The Grand Forks-Surrey line generated 18.6 million bushels <strong>of</strong> grain movements in 2004;<br />
10.5% more than the 2002 – 2004 three year average <strong>of</strong> 16.8 million bushels. There were<br />
4,878 carloads <strong>of</strong> grain generated in 2004. Detailed information about grain movements<br />
is given in Table C.2.<br />
Table C.2 Grain Movements Generated on the BNSF Devils Lake Subdivision<br />
Quantity Three Year Average<br />
(02, 03, 04)<br />
2004<br />
Bushels 16,810,912 18,579,158<br />
Tons 489,691 544,345<br />
Cars 4,388 4,878<br />
Cars Per Mile 22 25<br />
________________________________________________________________________<br />
<strong>North</strong> <strong>Dakota</strong> <strong>State</strong> <strong>Rail</strong> <strong>Plan</strong> 71
Drayton Subdivision (BNSF):<br />
Grafton-Joliette Line (BN033)<br />
The Grafton-Joliette Line is the BNSF<br />
Drayton Subdivision in northeastern <strong>North</strong><br />
<strong>Dakota</strong>. The Grafton-Joliette line runs<br />
33.8 miles northeast <strong>of</strong> the Grafton station<br />
to Joliette.<br />
The Drayton Subdivision has a maximum speed <strong>of</strong> 25 mph and a maximum carload <strong>of</strong><br />
134 tons. For confidentiality reasons, the grain movement reported includes the Glasston<br />
and Walhalla Subdivisions. In 2004, 356,950 tons <strong>of</strong> grain movements were generated<br />
over the Drayton, Glasston, and Walhalla Subdivisions, 18.4% greater than the 2002 –<br />
2004 three year average <strong>of</strong> 301,259 tons.<br />
Detailed information about the grain movements generated over the Grafton-Joliette Lind<br />
is given in Table C.3.<br />
Table C.3 Grafton-Joliette Line<br />
Beginning<br />
Milepost<br />
Ending<br />
Milepost<br />
Maximum<br />
Speed<br />
Maximum<br />
Carload<br />
Tons Generated<br />
(3 yr. avg.<br />
02, 03, 04)<br />
Tons<br />
Generated<br />
(2004)<br />
145.0 178.8 25 mph 134 tons 301,259 356,950<br />
There were 11.9 million bushels <strong>of</strong> grain movements, 1.8 million more than the three<br />
year average <strong>of</strong> 10.1 million bushels, generated on the Drayton, Glasston, and Walhalla<br />
Subdivisions in 2004. There were 2,978 carloads generated on the line in 2004.<br />
Detailed information about the grain movements generated over the Drayton, Glasston,<br />
and Walhalla Subdivisions is given in Table C.4.<br />
Table C.4 Grain Movements Generated on the BNSF Drayton, Glasston, and<br />
Walhalla Subdivisions<br />
Quantity Three Year Average<br />
(02, 03, 04)<br />
2004<br />
Bushels 10,112,343 11,905,616<br />
Tons 301,260 356,950<br />
Cars 2,699 2,978<br />
Cars Per Mile 19 21<br />
________________________________________________________________________<br />
<strong>North</strong> <strong>Dakota</strong> <strong>State</strong> <strong>Rail</strong> <strong>Plan</strong> 72
Glasston Subdivision (BNSF):<br />
Grand Forks-Glasston Line (BN033)<br />
The Grand Forks-Glasston Line is the<br />
BNSF Glasston Subdivision in northeast<br />
<strong>North</strong> <strong>Dakota</strong>. This branch line connects<br />
to the main line at Grand Forks and runs<br />
59.6 miles north and west to the Glasston<br />
Station.<br />
The Glasston Subdivision has a maximum speed <strong>of</strong> 25 mph and a maximum carload <strong>of</strong><br />
143 tons. For confidentiality reasons, the grain movement reported includes the<br />
Glasston and Walhalla Subdivisions. In 2004, 356,950 tons <strong>of</strong> grain movements were<br />
generated over the Drayton, Glasston, and Walhalla Subdivisions, 18.4% greater than the<br />
2002 – 2004 three year average <strong>of</strong> 301,259 tons.<br />
Table C.5 Grand Forks-Glasston Line<br />
Beginning<br />
Milepost<br />
Ending<br />
Milepost<br />
Maximum<br />
Speed<br />
Maximum<br />
Carload<br />
Tons Generated<br />
(3 yr. avg.<br />
02, 03, 04)<br />
Tons<br />
Generated<br />
(2004)<br />
145.0 178.8 25 mph 143 tons 301,260 356,950<br />
There were 11.9 million bushels <strong>of</strong> grain movements, 1.8 million more than the three<br />
year average <strong>of</strong> 10.1 million bushels, generated on the Drayton, Glasston, and Walhalla<br />
Subdivisions in 2004. There were 2,978 carloads generated on the line during the same<br />
period. Detailed information about the grain movements generated over the Drayton,<br />
Glasston, and Walhalla Subdivisions is given in Table C.4.<br />
Table C.4 Grain Movements Generated on the BNSF Drayton, Glasston, and<br />
Walhalla Subdivisions<br />
Quantity Three Year Average<br />
(02, 03, 04)<br />
2004<br />
Bushels 10,112,343 11,905,616<br />
Tons 301,260 356,950<br />
Cars 2,699 2,978<br />
Cars Per Mile 19 21<br />
The part <strong>of</strong> the Glasston Subdivision between Grafton and Glasston was leased to the<br />
<strong>Dakota</strong> <strong>North</strong>ern <strong>Rail</strong>road on February 5, 2006. As the line was in operation by BNSF in<br />
2004, the above data reflect commodity movements under BNSF.<br />
The part <strong>of</strong> the Walhalla Subdivision between Grafton and Walhalla was leased to the<br />
<strong>Dakota</strong> <strong>North</strong>ern <strong>Rail</strong>road on February 5, 2006. As the line was in operation by BNSF in<br />
2004, the above data reflect commodity movements under BNSF.<br />
________________________________________________________________________<br />
<strong>North</strong> <strong>Dakota</strong> <strong>State</strong> <strong>Rail</strong> <strong>Plan</strong> 73
Hannah Subdivision (BNSF):<br />
Conway-Langdon Line (BN027)<br />
The Conway-Langdon line is the BNSF<br />
Hannah Subdivision in northeastern <strong>North</strong><br />
<strong>Dakota</strong>. The Conway station is located<br />
southwest <strong>of</strong> Grafton. The line connects<br />
a section <strong>of</strong> rail on which BNSF and<br />
<strong>North</strong>ern Plains <strong>Rail</strong>road have joint<br />
trackage rights. The line connects to the BNSF Glasston Subdivision at Ardoch via the<br />
NPR Devils Lake Subdivision. From Conway, the Conway-Langdon line runs northwest<br />
50 miles to the Langdon station.<br />
The Hannah Subdivision has a maximum speed <strong>of</strong> 25 mph and a maximum carload <strong>of</strong><br />
143 tons. In 2004 369,389 tons <strong>of</strong> grain movements were generated on the Conway-<br />
Langdon line, slightly more than the 2002 to 2004 three year average <strong>of</strong> 359,874 tons.<br />
Detailed information about the Conway-Langdon line is given in Table C.6.<br />
Table C.6 Conway-Langdon Line<br />
Beginning<br />
Milepost<br />
Ending<br />
Milepost<br />
Maximum<br />
Speed<br />
Maximum<br />
Carload<br />
Tons Generated<br />
(3 yr. avg.<br />
02, 03, 04)<br />
Tons<br />
Generated<br />
(2004)<br />
23.6 73.6 25 mph 143 tons 359,874 369,389<br />
In 2004, 12.5 million bushels <strong>of</strong> grain movements were generated on the Conway-<br />
Langdon line, less than 3% greater than the 2002 to 2004 three year average 12.2 million<br />
bushels. There were 3,309 carloads generated on the line in 2004. Detailed information<br />
about the grain movements generated over the Conway-Langdon line is given in Table<br />
C.7.<br />
Table C.7 Grain Movements Generated on the BNSF Hannah Subdivision<br />
Quantity Three Year Average<br />
(02, 03, 04)<br />
2004<br />
Bushels 12,246,609 12,588,891<br />
Tons 359,874 369,389<br />
Cars 3,224 3,309<br />
Cars Per Mile 64 66<br />
________________________________________________________________________<br />
<strong>North</strong> <strong>Dakota</strong> <strong>State</strong> <strong>Rail</strong> <strong>Plan</strong> 74
Hillsboro Subdivision (BNSF):<br />
Fargo-Grand Forks Line (BN030)<br />
The Fargo-Grand Forks line is the BNSF<br />
Hillsboro Subdivision in east central<br />
<strong>North</strong> <strong>Dakota</strong>. The Fargo-Grand Forks<br />
line runs north 74 miles from Fargo to the<br />
Grand Forks station. The Hillsboro<br />
Subdivision connects to the Devils Lake<br />
Subdivision at the Devils Lake Switch in Grand Forks.<br />
The Fargo-Grand Forks main line connects to the KO subdivision main line at Fargo, and<br />
the Devils Lake subdivision main line at Grand Forks. The traffic density over the line is<br />
between 10 and 19.99 million gross ton-miles per mile. The maximum speed for freight<br />
trains on the Fargo-Grand Forks line is 50 miles per hour and the maximum carload is<br />
143 tons. Detailed information about this segment is given in Table C.8. The Amtrak<br />
Empire Builder also uses this line. The maximum speed for passenger trains is 79 miles<br />
per hour.<br />
Table C.8 Fargo-Grand Forks Line<br />
Beginning<br />
Milepost<br />
Ending<br />
Milepost<br />
Maximum<br />
Speed<br />
Maximum<br />
Carload<br />
Traffic Density<br />
(Million Gross Ton<br />
Miles/Mile)<br />
24.2 98.2 50 mph 143 tons 10-19.9<br />
24.5 million bushels <strong>of</strong> grain movements were generated on the Fargo-Grand Forks line<br />
in 2004, 10.6% lower than 2002 to 2004 three year average <strong>of</strong> 27.4 million bushels.<br />
There were 6,310 carloads <strong>of</strong> grain generated in 2004. Detailed information about grain<br />
movements is given in Table C.9.<br />
Table C.9 Grain Movements Generated on the BNSF Hillsboro Subdivision<br />
Quantity Three Year Average<br />
(02, 03, 04)<br />
2004<br />
Bushels 27,417,411 24,488,948<br />
Tons 794,730 704,270<br />
Cars 7,121 6,310<br />
Cars Per Mile 96 85<br />
________________________________________________________________________<br />
<strong>North</strong> <strong>Dakota</strong> <strong>State</strong> <strong>Rail</strong> <strong>Plan</strong> 75
Hunter, Clifford, & Prosper<br />
Subdivisions (BNSF):<br />
Vance-Hunter Line (BN050)<br />
Erie Junction-Clifford Line (BN050)<br />
Fargo-Nolan Line (BN050)<br />
Vance-Hunter Line (BN050)<br />
The Hunter, Clifford, and Prosper<br />
Subdivisions are grouped together due to<br />
the similar operating characteristics and the limited number <strong>of</strong> stations present in each<br />
Subdivision. The Hunter, Clifford, and Prosper Subdivisions include two short branch<br />
lines and one low-volume main line.<br />
The first, Vance-Hunter Line is the BNSF Hunter Subdivision in eastern <strong>North</strong> <strong>Dakota</strong>.<br />
The Vance station is located 23 miles west <strong>of</strong> Fargo on the Prosper Subdivision <strong>of</strong> the<br />
BNSF main line. The Vance-Hunter Line connects to the Prosper line and runs north<br />
11.4 miles to the Hunter station. Detailed information about the Vance-Hunter Line is<br />
given in Table C.10.<br />
Table C.10 Vance-Hunter Line<br />
Beginning<br />
Milepost<br />
Ending<br />
Milepost<br />
Maximum<br />
Speed<br />
Maximum<br />
Carload<br />
Tons Generated<br />
(3 yr. avg.<br />
02, 03, 04)<br />
Tons<br />
Generated<br />
(2004)<br />
64.2 75.2 10 mph 134 tons 170,004 100,474<br />
Erie Junction-Clifford Line (BN050)<br />
The Erie Junction-Clifford line is part <strong>of</strong> the BNSF Clifford Subdivision in eastern <strong>North</strong><br />
<strong>Dakota</strong>. The Erie Junction is located 33 miles west <strong>of</strong> Fargo on the Prosper Subdivision<br />
<strong>of</strong> the BNSF main line. The Erie Junction-Clifford line connects to the Prosper line and<br />
runs north 17.5 miles to the Clifford station. Detailed information about the Erie<br />
Junction-Clifford line is given in Table C.11.<br />
Table C.11 Erie Junction-Clifford Line<br />
Beginning<br />
Milepost<br />
Ending<br />
Milepost<br />
Maximum<br />
Speed<br />
Maximum<br />
Carload<br />
Tons Generated<br />
(3 yr. avg.<br />
02, 03, 04)<br />
Tons<br />
Generated<br />
(2004)<br />
0.0 17.5 25 mph 134 tons 170,004 100,474<br />
________________________________________________________________________<br />
<strong>North</strong> <strong>Dakota</strong> <strong>State</strong> <strong>Rail</strong> <strong>Plan</strong> 76
Fargo-Nolan Line (BN050)<br />
The Fargo-Nolan line is known as the Prosper subdivision <strong>of</strong> the BNSF main line in<br />
eastern <strong>North</strong> <strong>Dakota</strong>. The Fargo-Nolan line runs 41.0 miles northwest from Fargo to the<br />
Nolan station. The Fargo-Nolan Line connects to the BNSF KO Subdivision main line at<br />
Nolan. The Prosper Subdivision also connects to the Clifford and Hunter branch line<br />
Subdivisions at Erie Junction and Vance respectively. Detailed information about the<br />
Fargo-Nolan line is given in Table C.12.<br />
Table C.12 Fargo-Nolan Line<br />
Beginning<br />
Milepost<br />
Ending<br />
Milepost<br />
Maximum<br />
Speed<br />
Maximum<br />
Carload<br />
Traffic Density<br />
(Million Gross Ton<br />
Miles/Mile)<br />
0.0 41.0 49 mph 143 tons 0-0.99<br />
For confidentiality reasons, the grain movements generated are not reported for the<br />
individual subdivisions. In 2004, 3.6 million bushels <strong>of</strong> grain movements were<br />
generated on the Hunter, Clifford, and Prosper Subdivisions. This is nearly 40% lower<br />
than the 2002-2004 three year average <strong>of</strong> 5.9 million bushels. In 2004, 900 carloads <strong>of</strong><br />
grain were generated over these three subdivisions. Detailed information about grain<br />
movements on the Hunter, Clifford, and prosper subdivisions is given in Table C.13.<br />
Table C.13 Grain Movements Generated on the BNSF Hunter, Clifford, and<br />
Prosper Subdivisions<br />
Quantity Three Year Average<br />
(02, 03, 04)<br />
2004<br />
Bushels 5,977,096 3,617,210<br />
Tons 170,004 100,474<br />
Cars 1,523 900<br />
Cars Per Mile 22 13<br />
________________________________________________________________________<br />
<strong>North</strong> <strong>Dakota</strong> <strong>State</strong> <strong>Rail</strong> <strong>Plan</strong> 77
Warwick Subdivision (BNSF):<br />
Warwick Junction-Tolna Line (BN059)<br />
The Warwick Junction-Tolna Line is the<br />
BNSF Warwick Subdivision. The<br />
Warwick Junction is located at Nolan<br />
which is 49.9 miles west <strong>of</strong> the Dilworth,<br />
MN station on the BNSF KO Subdivision.<br />
The Warwick Junction-Tolna line runs<br />
66.6 miles northwest from Warwick to the Tolna station.<br />
The Warwick Subdivision has a maximum speed <strong>of</strong> 25 miles per hour and a maximum<br />
carload <strong>of</strong> 134 tons. In 2004, 373,587 tons <strong>of</strong> grain movements were generated on the<br />
Warwick Junction-Tolna line, which is slightly less than the 2002-2004 three year<br />
average <strong>of</strong> 375,346 tons. Detailed information about the Warwick Junction-Tolna line is<br />
given in Table C.14.<br />
Table C.14 Warwick Junction-Tolna Line<br />
Beginning<br />
Milepost<br />
Ending<br />
Milepost<br />
Maximum<br />
Speed<br />
Maximum<br />
Carload<br />
Tons Generated<br />
(3 yr. avg.<br />
02, 03, 04)<br />
Tons<br />
Generated<br />
(2004)<br />
24.3 90.9 25 mph 134 tons 375,346 373,587<br />
In 2004, 12.8 million bushels <strong>of</strong> grain movement generated on the Warwick Subdivision,<br />
which is roughly 100,000 less than the 2002-2004 three year average <strong>of</strong> 12.9 million<br />
bushels. There were 3,347 carloads generated in 2004. Detailed information about<br />
grain movements generated over the Warwick Subdivision is given in Table C.15.<br />
Table C.15 Grain Movements Generated on the BNSF Warwick Subdivision<br />
Quantity Three Year Average<br />
(02, 03, 04)<br />
2004<br />
Bushels 12,921,711 12,827,765<br />
Tons 375,346 373,587<br />
Cars 3,363 3,347<br />
Cars Per Mile 50 50<br />
________________________________________________________________________<br />
<strong>North</strong> <strong>Dakota</strong> <strong>State</strong> <strong>Rail</strong> <strong>Plan</strong> 78
Jamestown Subdivision (BNSF):<br />
Surrey Junction-Mandan Line<br />
(BN064 & BN076)<br />
The Surrey Junction-Mandan Line is the<br />
BNSF Jamestown subdivision, which is<br />
part <strong>of</strong> the BNSF mainline that extends<br />
across southern <strong>North</strong> <strong>Dakota</strong>. The<br />
Surrey Junction-Mandan line connects<br />
to the KO Subdivision at Surrey Junction and runs west 169.1 miles to the Mandan<br />
station. The Surrey Junction is located 31.2 miles west <strong>of</strong> Fargo on the KO Subdivision,<br />
which is part <strong>of</strong> another BNSF main line.<br />
Traffic density over this line is greater than 40 million gross ton-miles per mile. The<br />
maximum speed on the line is 60 miles per hour and the maximum carload is 143 tons.<br />
Detailed information about this segment is given in Table C.16.<br />
Table C.16 Surrey Junction-Mandan Mainline<br />
Beginning<br />
Milepost<br />
Ending<br />
Milepost<br />
Maximum<br />
Speed<br />
Maximum<br />
Carload<br />
Traffic Density<br />
(Million Gross Ton<br />
Miles/Mile)<br />
31.2 200.3 60 mph 143 tons > 40<br />
In 2004, there were 23.8 million bushels <strong>of</strong> grain movement generated on the Surrey<br />
Junction-Mandan line, slightly less than the 2002-2004 three year average 24.3 million<br />
bushels. There were 6,332 carloads generated on the line in 2004. Detailed information<br />
about grain movements on the Surrey Junction-Mandan line is given in Table C.17.<br />
Table C.17 Grain Movements Generated on the BNSF Jamestown Subdivision<br />
Quantity Three Year Average<br />
(02, 03, 04)<br />
2004<br />
Bushels 24,377,423 23,862,720<br />
Tons 723,304 706,673<br />
Cars 6,481 6,332<br />
Cars Per Mile 38 37<br />
________________________________________________________________________<br />
<strong>North</strong> <strong>Dakota</strong> <strong>State</strong> <strong>Rail</strong> <strong>Plan</strong> 79
KO Subdivision (BNSF):<br />
Fargo –Minot<br />
(BN0036, BN076, BN0061, & BN059)<br />
The BNSF Fargo-Minot main line is the<br />
KO Subdivision, extending from eastern<br />
to north central <strong>North</strong> <strong>Dakota</strong>. The Fargo-<br />
Minot line extends from the Fargo station<br />
on the <strong>North</strong> <strong>Dakota</strong>-Minnesota border<br />
northwest 203.2 miles to the Minot station. The KO Subdivision connects to the<br />
Jamestown Subdivision mainline at the Surrey Junction, and to the Devils Lake<br />
Subdivision mainline at the Surrey station. It is part <strong>of</strong> the KO-Glasgow main line.<br />
The traffic density over the entire BNSF KO-Glasgow main line in <strong>North</strong> <strong>Dakota</strong> is<br />
greater than 40 million gross ton miles per mile. The maximum speed on the Fargo-<br />
Minot line is 60 miles per hour and the maximum carload is 143 tons. Detailed<br />
information about this segment is given in Table C.18.<br />
Table C.18 Fargo-Minot Line<br />
Beginning<br />
Milepost<br />
Ending<br />
Milepost<br />
Maximum<br />
Speed<br />
Maximum<br />
Carload<br />
Traffic Density<br />
(Million Gross Ton<br />
Miles/Mile)<br />
0 203.2 60 mph 143 tons > 40<br />
There were 15.9 million bushels <strong>of</strong> grain movements generated on the Fargo-Minot line<br />
in 2004, more than 11.6% less than the 2002-2004 three year average <strong>of</strong> 18 million<br />
bushels. There were 3,906 carloads generated in 2004. Detailed information about grain<br />
movements is given in Table C.19.<br />
Table C.19 Grain Movements Generated on the BNSF KO Subdivision<br />
Quantity Three Year Average<br />
(02, 03, 04)<br />
2004<br />
Bushels 18,055,988 15,950,381<br />
Tons 494,447 435,893<br />
Cars 4,431 3,906<br />
Cars Per Mile 22 19<br />
________________________________________________________________________<br />
<strong>North</strong> <strong>Dakota</strong> <strong>State</strong> <strong>Rail</strong> <strong>Plan</strong> 80
Mayville Subdivision (BNSF):<br />
Mayville Junction-Mayville (BN073)<br />
The Mayville Junction-Mayville line is<br />
known as the BNSF Mayville Subdivision<br />
in eastern <strong>North</strong> <strong>Dakota</strong>. The Mayville<br />
Junction is located 0.6 miles east <strong>of</strong><br />
Larimore on the Devils Lake Subdivision<br />
<strong>of</strong> the BNSF main line. The Mayville<br />
Junction-Mayville line connects to the main line and runs south 33.6 miles to the<br />
Mayville station.<br />
The Mayville Junction-Mayville line has a maximum speed <strong>of</strong> 25 miles per hour and a<br />
maximum carload <strong>of</strong> 143 tons. In 2004, 199,691 tons <strong>of</strong> grain movements were<br />
generated over the Mayville Subdivision, 5% less than the 2002-2004 three year average<br />
<strong>of</strong> 211,369 tons. Detailed information about the Mayville Junction-Mayville line is given<br />
in Table C.20.<br />
Table C.20 Mayville Junction-Mayville Line<br />
Beginning<br />
Milepost<br />
Ending<br />
Milepost<br />
Maximum<br />
Speed<br />
Maximum<br />
Carload<br />
Tons Generated<br />
(3 yr. avg.<br />
02, 03, 04)<br />
Tons<br />
Generated<br />
(2004)<br />
129.6 97.5 25 mph 143 tons 211,369 199,691<br />
In 2004, 6.7 million bushels <strong>of</strong> grain movements were generated on the Mayville<br />
Subdivision, 389,000 million bushels less than the 2002-2004 three year average <strong>of</strong> 7.1<br />
million bushels. There were 1,789 carloads generated in 2004. Detailed information<br />
about the grain movements generated over the Mayville Junction-Mayville line is given<br />
in Table C.21.<br />
Table C.21 Grain Movements Generated on the BNSF Mayville Subdivision<br />
Quantity Three Year Average<br />
(02, 03, 04)<br />
2004<br />
Bushels 7,112,171 6,723,276<br />
Tons 211,369 199,691<br />
Cars 1,893 1,789<br />
Cars Per Mile 56 53<br />
________________________________________________________________________<br />
<strong>North</strong> <strong>Dakota</strong> <strong>State</strong> <strong>Rail</strong> <strong>Plan</strong> 81
Rolla Subdivision (BNSF):<br />
Churchs Ferry-Rolla Line (BN021)<br />
The Churchs Ferry-Rolla line is the BNSF<br />
Rolla Subdivision in north central <strong>North</strong><br />
<strong>Dakota</strong>. The Churchs Ferry station is<br />
located 19 miles west <strong>of</strong> Devils Lake on<br />
the Devils Lake Subdivision <strong>of</strong> the BNSF<br />
main line. The Churchs Ferry-Rolla line<br />
connects to the Devils Lake Subdivision and runs northwest 47.4 miles to the Rolla<br />
station.<br />
The Churchs Ferry-Rolla line has a maximum speed <strong>of</strong> 25 miles per hour and a maximum<br />
carload <strong>of</strong> 134 tons. In 2004, 54,455 tons <strong>of</strong> grain movements were generated over the<br />
Rolla Subdivision, 30% less than the 2002-2004 three year average <strong>of</strong> 77,321 tons.<br />
Detailed information about the Churchs Ferry-Rolla Line is given in Table C.22.<br />
Table C.22 Churchs Ferry-Rolla Line<br />
Beginning<br />
Milepost<br />
Ending<br />
Milepost<br />
Maximum<br />
Speed<br />
Maximum<br />
Carload<br />
Tons Generated<br />
(3 yr. avg.<br />
02, 03, 04)<br />
Tons<br />
Generated<br />
(2004)<br />
0.0 47.3 25 mph 143 tons 77,321 54,455<br />
In 2004, 1.9 million bushels <strong>of</strong> grain movements were generated on the Rolla<br />
Subdivision, 800,000 less than the 2002-2004 three year average <strong>of</strong> 2.7 million bushels.<br />
There were 488 carloads generated in 2004. Detailed information about the grain<br />
movements generated on the Rolla Subdivision is given in Table C.23.<br />
Table C.23 Grain Movements Generated on the BNSF Rolla Subdivision<br />
Quantity Three Year Average<br />
(02, 03, 04)<br />
2004<br />
Bushels 2,725,569 1,926,170<br />
Tons 77,321 54,455<br />
Cars 693 488<br />
Cars Per Mile 15 10<br />
________________________________________________________________________<br />
<strong>North</strong> <strong>Dakota</strong> <strong>State</strong> <strong>Rail</strong> <strong>Plan</strong> 82
Westhope Subdivision (BNSF):<br />
Rugby-Souris Line (BN011)<br />
The Rugby-Souris line is commonly<br />
known as the BNSF Westhope<br />
Subdivision in north central <strong>North</strong> <strong>Dakota</strong>.<br />
The segment from Souris to Westhope has<br />
been abandoned and the line presently<br />
ends just west <strong>of</strong> Souris. The line begins<br />
at the Rugby station, located 60.5 miles<br />
east <strong>of</strong> Minot on the BNSF main line (Devils Lake Subdivision) and runs northwest 51<br />
miles to Souris.<br />
The Rugby-Souris line has a maximum speed <strong>of</strong> 25 mph and a maximum carload <strong>of</strong> 143<br />
tons between Rugby and Bottineau, and 134 tons between Bottineau and Souris. In 2004,<br />
137,596 tons <strong>of</strong> grain movements were generated over the Westhope Subdivision, 8%<br />
below the 2002-2004 three year average <strong>of</strong> 149,127 tons. Detailed information about the<br />
line is given in Table C.24.<br />
Table C.24 Rugby-Westhope Line<br />
Beginning<br />
Milepost<br />
Ending<br />
Milepost<br />
Maximum<br />
Speed<br />
Maximum<br />
Carload<br />
Tons Generated<br />
(3 yr. avg.<br />
02, 03, 04)<br />
Tons<br />
Generated<br />
(2004)<br />
0.0 51.0 25-30 mph 134-143 tons 149,127 137,596<br />
In 2004, 4.97 million bushels <strong>of</strong> grain movements were generated over the Westhope<br />
Subdivision, roughly a half million bushels less than the 2002-2004 three year average <strong>of</strong><br />
5.44 million bushels. Detailed information about the grain movements generated over the<br />
line is given in Table C.25.<br />
Table C.25 Grain Movements Generated on the BNSF Westhope Subdivision<br />
Quantity Three Year Average<br />
(02, 03, 04)<br />
2004<br />
Bushels 5,441,830 4,973,253<br />
Tons 149,127 137,596<br />
Cars 1,336 1,232<br />
Cars Per Mile 26 24<br />
________________________________________________________________________<br />
<strong>North</strong> <strong>Dakota</strong> <strong>State</strong> <strong>Rail</strong> <strong>Plan</strong> 83
Zap Subdivision (BNSF)<br />
Mandan-Zap Line (BN101)<br />
The Mandan-Zap line is commonly known<br />
as the Zap Subdivision <strong>of</strong> the BNSF in<br />
central <strong>North</strong> <strong>Dakota</strong>. The Mandan<br />
station is located on the western end <strong>of</strong> the<br />
Jamestown Subdivision <strong>of</strong> the BNSF main<br />
line. The Mandan-Zap line connects to<br />
the main line at Mandan, and runs northwest 80.5 miles to the Zap station.<br />
The Mandan-Zap line has a maximum speed <strong>of</strong> 25 miles per hour and a maximum<br />
carload <strong>of</strong> 143 tons. The traffic density on the Mandan-Zap line is between 1 and 4.99<br />
carloads per mile from Mandan to Stanton, and between 5 and 9.99 carloads per mile<br />
from Stanton to Zap. The increased density between Stanton and Zap is due to shipments<br />
from coal mines in the area to the Antelope Valley and Coyote power plants and to the<br />
Great Plains Synfuels <strong>Plan</strong>t, which are all near Beulah on the western end <strong>of</strong> the Mandan-<br />
Zap line.<br />
For confidentiality reasons, and the low volume <strong>of</strong> grain movement over the Zap<br />
Subdivision, grain movement data is not reported. However, a shuttle loader facility was<br />
recently built on the Mandan-Zap line, which will substantially increase grain movements<br />
on the line. Detailed information about the Mandan-Zap line is given in Table C.26.<br />
Table C.26 Mandan-Zap Line<br />
Beginning Ending Maximum Maximum<br />
Milepost Milepost Speed Carload<br />
0.0 80.5 25 mph 143 tons<br />
________________________________________________________________________<br />
<strong>North</strong> <strong>Dakota</strong> <strong>State</strong> <strong>Rail</strong> <strong>Plan</strong> 84
Crosby Subdivision (BNSF):<br />
Berthold-Crosby Line (BN007)<br />
The Berthold-Crosby branch line is known<br />
as the Crosby Subdivision <strong>of</strong> the BNSF in<br />
<strong>North</strong> <strong>Dakota</strong>. The Berthold station is<br />
located 23 miles west <strong>of</strong> Minot on the<br />
Glasgow Subdivision <strong>of</strong> the main line.<br />
The Berthold-Crosby line connects to the<br />
Glasgow line and runs northwest 85.9 miles to the Crosby station. Currently, the last<br />
31.5 miles <strong>of</strong> the line, from Lignite Junction to Crosby, is listed by BNSF as out <strong>of</strong><br />
service trackage.<br />
The Berthold-Crosby line has a maximum speed <strong>of</strong> 25 miles per hour and a maximum<br />
carload <strong>of</strong> 143 tons. In 2004, 117,064 tons <strong>of</strong> grain movements were generated over the<br />
Berthold-Crosby line, 21% greater than the 2002-2004 three year average <strong>of</strong> 96,306 tons.<br />
Detailed information about the Berthold-Crosby line is given in Table C.27.<br />
Table C.27 Berthold-Crosby Line<br />
Beginning<br />
Milepost<br />
Ending<br />
Milepost<br />
Maximum<br />
Speed<br />
Maximum<br />
Carload<br />
Tons Generated<br />
(3 yr. avg.<br />
02, 03, 04)<br />
Tons<br />
Generated<br />
(2004)<br />
0.0 88.5 25 mph 143 tons 96,306 117,064<br />
In 2004, 5.97 million bushels <strong>of</strong> grain movements were generated on the Crosby<br />
Subdivision, 1.3 million bushels greater than the 2002-2004 three year average <strong>of</strong> 4.67<br />
million bushels. In 2004, 1,048 carloads <strong>of</strong> grain were generated on the line. Detailed<br />
information about the grain movements generated on the Crosby Subdivision is given in<br />
Table C.28.<br />
Table C.28 Grain Movements Generated on the BNSF Crosby Subdivision<br />
Quantity Three Year Average<br />
(02, 03, 04)<br />
2004<br />
Bushels 4,666,227 5,977,005<br />
Tons 96,306 117,064<br />
Cars 863 1,048<br />
Cars Per Mile 15 18<br />
________________________________________________________________________<br />
<strong>North</strong> <strong>Dakota</strong> <strong>State</strong> <strong>Rail</strong> <strong>Plan</strong> 85
Dickinson Subdivision (BNSF):<br />
Mandan-Beach Line<br />
(BN058)<br />
The Mandan-Beach main line is the BNSF<br />
Dickinson Subdivision in <strong>North</strong> <strong>Dakota</strong><br />
extending from Mandan in south central<br />
<strong>North</strong> <strong>Dakota</strong> 174.2 miles west to Beach<br />
on the Montana/<strong>North</strong> <strong>Dakota</strong> Border.<br />
The Mandan-Beach line is a continuation <strong>of</strong> the Jamestown Subdivision <strong>of</strong> the southern<br />
east-west BNSF main line in <strong>North</strong> <strong>Dakota</strong>.<br />
The traffic density over the entire BNSF Dickinson and Jamestown main line is greater<br />
than 40 million gross ton miles per mile. The maximum speed on the Mandan-Beach<br />
line is 60 miles per hour and the maximum carload is 143 tons. Detailed information<br />
about this segment is given in Table C.29.<br />
Table C.29 Mandan-Beach Line<br />
Beginning<br />
Milepost<br />
Ending<br />
Milepost<br />
Maximum<br />
Speed<br />
Maximum<br />
Carload<br />
Traffic Density<br />
(Million Gross Ton<br />
Miles/Mile)<br />
0 203.2 60 mph 143 tons > 40<br />
There were 24.1 million bushels <strong>of</strong> grain movements generated on the Mandan-Beach<br />
line in 2004, more than 23% greater than the 2002-2004 three year average <strong>of</strong> 19.6<br />
million bushels. There were 6,471 carloads <strong>of</strong> grain generated on the line in 2004.<br />
Detailed information about grain movements on the Dickinson Subdivision is given in<br />
Table C.30.<br />
Table C.30 Grain Movements Generated on the BNSF Dickinson Subdivision<br />
Quantity Three Year Average<br />
(02, 03, 04)<br />
2004<br />
Bushels 19,628,136 24,115,638<br />
Tons 589,754 722,241<br />
Cars 5,284 6,471<br />
Cars Per Mile 30 37<br />
________________________________________________________________________<br />
<strong>North</strong> <strong>Dakota</strong> <strong>State</strong> <strong>Rail</strong> <strong>Plan</strong> 86
Glasgow Subdivision (BNSF):<br />
Minot-Williston Line (BN002 & BN008)<br />
The Minot-Williston main line in<br />
northwestern <strong>North</strong> <strong>Dakota</strong> is commonly<br />
referred to as the Glasgow Subdivision. It<br />
extends 133.2 miles from Minot to the<br />
Montana border, where it crosses near<br />
Trenton.<br />
The traffic density over the entire BNSF Glasgow and KO main line in <strong>North</strong> <strong>Dakota</strong> is<br />
greater than 40 million gross ton miles per mile. The maximum speed for freight trains<br />
on the Minot-Williston line is 60 miles per hour and the maximum carload is 143 tons.<br />
Detailed information about this segment is given in Table C.31. The Amtrak Empire<br />
Builder also uses this line. The maximum speed for freight trains is 79 miles per hour.<br />
Table C.31 Minot-Williston Line<br />
Beginning<br />
Milepost<br />
Ending<br />
Milepost<br />
Maximum<br />
Speed<br />
Maximum<br />
Carload<br />
Traffic Density<br />
(Million Gross Ton<br />
Miles/Mile)<br />
0.0 133.2 60 mph 143 tons > 40<br />
Grain movements on the line were slightly higher than the 2002-2004 three year average.<br />
Detailed information about grain movements on the BNSF Glasgow Subdivision is given<br />
in Table C.32.<br />
Table C.32 Grain Movements Generated on the BNSF Glasgow Subdivision<br />
Quantity Three Year Average<br />
(02, 03, 04)<br />
2004<br />
Bushels 18,334,653 18,550,716<br />
Tons 530,703 541,106<br />
Cars 4,755 4,848<br />
Cars Per Mile 36 36<br />
________________________________________________________________________<br />
<strong>North</strong> <strong>Dakota</strong> <strong>State</strong> <strong>Rail</strong> <strong>Plan</strong> 87
Grenora Subdivision (BNSF):<br />
Stanley-Powers Lake Line (BN001)<br />
The Stanley-Powers Lake line is<br />
commonly known as the Grenora<br />
Subdivision <strong>of</strong> the Minot Division <strong>of</strong> the<br />
BNSF in <strong>North</strong> <strong>Dakota</strong>. The Stanley<br />
station is located 54 miles west <strong>of</strong> Minot<br />
on the Glasgow Subdivision <strong>of</strong> the main<br />
line. The Stanley-Powers Lake line connects to the Glasgow line an runs northwest 24.6<br />
miles to the Powers Lake station.<br />
For confidentiality reasons and the low volume <strong>of</strong> grain movement over the Grenora<br />
Subdivision, grain movement data is not reported. Detailed information about the<br />
Stanley-Powers Lake line is given in Table C.33.<br />
Table C.33 Stanley-Powers Lake Line<br />
Beginning Ending Maximum Maximum<br />
Milepost Milepost Speed Carload<br />
0.0 24.6 25 mph 143 tons<br />
________________________________________________________________________<br />
<strong>North</strong> <strong>Dakota</strong> <strong>State</strong> <strong>Rail</strong> <strong>Plan</strong> 88
Hettinger Subdivision (BNSF):<br />
Hettinger-Baker Line (BN078)<br />
The Hettinger-Baker line is commonly<br />
known as the Hettinger Subdivision <strong>of</strong> the<br />
BNSF in <strong>North</strong> <strong>Dakota</strong>. The Hettinger<br />
station is located at the west end <strong>of</strong> the<br />
Mobridge Subdivision <strong>of</strong> the BNSF in<br />
South <strong>Dakota</strong>. The Hettinger-Baker line<br />
connects to the Mobridge Subdivision and crosses the extreme southwest corner <strong>of</strong> <strong>North</strong><br />
<strong>Dakota</strong> as it runs west northwest 89.6 miles to the Baker, Montana station in eastern<br />
Montana.<br />
The traffic density over the entire BNSF Hettinger main line in <strong>North</strong> <strong>Dakota</strong> is between<br />
10 and 19.99 million gross ton miles per mile. The maximum speed on the Minot-<br />
Williston line is 60 miles per hour and the maximum carload is 143 tons. Detailed<br />
information about this segment is given in Table C.34.<br />
Table C.34 Hettinger-Baker, Montana Line<br />
Beginning<br />
Milepost<br />
Ending<br />
Milepost<br />
Maximum<br />
Speed<br />
Maximum<br />
Carload<br />
Traffic Density<br />
(Million Gross Ton<br />
Miles/Mile)<br />
926.0 1015.6 40 mph 143 tons 10 – 19.99<br />
In 2004, 11.1 million bushels <strong>of</strong> grain movements were generated on the Hettinger-Baker<br />
line, 1.9 million bushels greater than the three year average <strong>of</strong> 9.1 million bushels. There<br />
were 2,981 carloads <strong>of</strong> grain generated on the line in 2004. Detailed information about<br />
the grain movements generated over the Hettinger Subdivision is given in Table C.35.<br />
Table C.35 Grain Movements Generated on the BNSF Hettinger Subdivision<br />
Quantity Three Year Average<br />
(02, 03, 04)<br />
2004<br />
Bushels 9,116,802 11,100,588<br />
Tons 273,231 332,651<br />
Cars 2,448 2,981<br />
Cars Per Mile 27 33<br />
________________________________________________________________________<br />
<strong>North</strong> <strong>Dakota</strong> <strong>State</strong> <strong>Rail</strong> <strong>Plan</strong> 89
Portal Subdivision (CPR):<br />
Harvey-Portal Line<br />
(CPR130 and CPR137)<br />
The Harvey-Portal line is the CPR Portal<br />
Subdivision in west-central <strong>North</strong> <strong>Dakota</strong>.<br />
The Harvey station is located 72.2 miles<br />
southeast <strong>of</strong> Minot. The Harvey-Portal<br />
line runs 152.5 miles from Harvey in<br />
central <strong>North</strong> <strong>Dakota</strong> to Portal which is<br />
located at the Canadian Border.<br />
The Harvey-Portal line is part <strong>of</strong> the CPR main line that runs diagonally across the state<br />
<strong>of</strong> <strong>North</strong> <strong>Dakota</strong>. The traffic density over the main line is between 10 and 19.99 million<br />
gross ton-miles per mile. The maximum speed on the Harvey-Portal line is 49 mph and<br />
the maximum carload is 143 tons. Detailed information about this segment is given in<br />
Table C.36.<br />
Table C.36 Harvey-Portal Line<br />
Beginning<br />
Milepost<br />
Ending<br />
Milepost<br />
Maximum<br />
Speed<br />
Maximum<br />
Carload<br />
Traffic Density<br />
(Million Gross Ton<br />
Miles/Mile)<br />
396.5 549.0 30-49 mph 143 tons 10-19.99<br />
In 2004 over 22 million bushels <strong>of</strong> grain movements were generated on the Harvey-Portal<br />
line, slightly more than the 2002-2004 three year average <strong>of</strong> 21.57 million bushels.<br />
Detailed information about grain movements over the Portal Subdivision is given in<br />
Table C.37<br />
Table C.37 Grain Movements Generated on the CPR Portal Subdivision<br />
Quantity Three Year Average<br />
(02, 03, 04)<br />
2004<br />
Bushels 21,574,214 22,150,780<br />
Tons 595,857 625,832<br />
Cars 5,339 5,607<br />
Cars Per Mile 35 37<br />
________________________________________________________________________<br />
<strong>North</strong> <strong>Dakota</strong> <strong>State</strong> <strong>Rail</strong> <strong>Plan</strong> 90
New Town Subdivision (CPR):<br />
The New Town Subdivision consists <strong>of</strong> the<br />
Drake-Max line, the Max-New Town line and the<br />
Prairie Junction-Plaza line. The total length <strong>of</strong><br />
the New Town Subdivision is 114.7 miles.<br />
Drake-Max Line (CPR133)<br />
The Drake-Max line is part <strong>of</strong> the CPR New<br />
Town Subdivision in west-central <strong>North</strong> <strong>Dakota</strong>.<br />
The Drake station is located 49.2 miles southeast<br />
<strong>of</strong> Minot on the Portal Subdivision <strong>of</strong> the CPR main line. The Drake-Max branch line<br />
connects to the Portal line and runs 48.2 miles west to the Max station.<br />
Max-New Town Line (CPR131)<br />
The Max-New Town line runs from the Max station 62.7 miles northwest to the New<br />
Town station.<br />
Prairie Jct.-Plaza Line (CPR131)<br />
The Prairie Junction station is located 31.1 miles west <strong>of</strong> Max and extends 3.8 miles<br />
north to the Plaza station.<br />
The New Town subdivision has a maximum speed <strong>of</strong> 25 mph and a maximum carload <strong>of</strong><br />
143 tons. In 2004, 332,329 tons <strong>of</strong> grain movements were generated on the subdivision,<br />
slightly greater than the 2002-2004 three-year average <strong>of</strong> 310,150 tons. Detailed<br />
information about the New Town Subdivision is given in Table C.38.<br />
Table C.38 New Town Subdivision<br />
Beginning<br />
Milepost<br />
Ending<br />
Milepost<br />
Maximum<br />
Speed<br />
Maximum<br />
Carload<br />
Tons Generated<br />
(3 yr. avg.<br />
02, 03, 04)<br />
Tons<br />
Generated<br />
(2004)<br />
418.5 529.4 25 mph 143 tons 310,150 332,329<br />
In 2004, 11.67 million bushels <strong>of</strong> grain movements were generated on the New Town<br />
Subdivision, 1 million greater than the 2002-2004 three year average. There were 2,978<br />
carloads <strong>of</strong> grain shipped on the line in 2004. Detailed information about grain<br />
movement on the New Town Subdivision is given in Table C.39.<br />
Table C.39 Grain Movement Generated on CPR New Town Subdivision<br />
Quantity Three Year Average<br />
(02, 03, 04)<br />
2004<br />
Bushels 10,739,359 11,672,001<br />
Tons 310,150 332,329<br />
Cars 2,779 2,978<br />
Cars Per Mile 25 27<br />
________________________________________________________________________<br />
<strong>North</strong> <strong>Dakota</strong> <strong>State</strong> <strong>Rail</strong> <strong>Plan</strong> 91
Carrington Subdivision (CPR):<br />
Enderlin-Harvey Line<br />
(CPR136 & CPR138)<br />
The Enderlin-Harvey Line is the CPR<br />
Carrington Subdivision in east-central<br />
<strong>North</strong> <strong>Dakota</strong>. The Enderlin station is<br />
located 30 miles southeast <strong>of</strong> Valley City.<br />
The Enderlin-Harvey line runs 112.2 miles<br />
from Enderlin in southeast <strong>North</strong> <strong>Dakota</strong> to Harvey in the central part <strong>of</strong> the state.<br />
The Enderlin-Harvey Line is part <strong>of</strong> the CPR mainline which extends diagonally across<br />
the state <strong>of</strong> <strong>North</strong> <strong>Dakota</strong>. The traffic density over the entire line in <strong>North</strong> <strong>Dakota</strong> is<br />
between 10 and 19.99 million gross ton-miles per mile. The maximum speed on the<br />
Enderlin-Harvey Line is 49 mph and the maximum carload is 143 tons. Detailed<br />
information about this segment is given in Table C.40.<br />
Table C.40 Enderlin-Harvey Line<br />
Beginning<br />
Milepost<br />
Ending<br />
Milepost<br />
Maximum<br />
Speed<br />
Maximum<br />
Carload<br />
Traffic Density<br />
(Million Gross Ton<br />
Miles/Mile)<br />
257.3 396.5 49 mph 143 tons 10-19.99<br />
In 2004, 22.3 million bushels <strong>of</strong> grain movements were generated on the Enderlin-<br />
Harvey line, more than 14% greater than the 2002-2004 three year average <strong>of</strong><br />
19.5 million bushels. There were 5,795 carloads <strong>of</strong> grain movements generated on the<br />
line in 2004. Detailed information about grain movements on the Carrington Subdivision<br />
is given in Table C.40.<br />
Table C.40 Grain Movements Generated on CPR Carrington Subdivision<br />
Quantity Three Year Average<br />
(02, 03, 04)<br />
2004<br />
Bushels 19,513,144 22,276,916<br />
Tons 570,831 646,774<br />
Cars 5,114 5,795<br />
Cars Per Mile 46 52<br />
.<br />
________________________________________________________________________<br />
<strong>North</strong> <strong>Dakota</strong> <strong>State</strong> <strong>Rail</strong> <strong>Plan</strong> 92
Elbow Lake Subdivision & Veblen<br />
Subdivision (CPR):<br />
Fairmount-Enderlin Line (CPR138)<br />
The Fairmount-Enderlin Line is located in<br />
the CPR Elbow Lake Subdivision <strong>of</strong> the<br />
CPR main line in southeastern <strong>North</strong><br />
<strong>Dakota</strong>. The Fairmount station is located<br />
1.2 miles west <strong>of</strong> the Minnesota border.<br />
The Fairmount-Enderlin Line runs 67 miles northwest from Fairmount to Enderlin in<br />
<strong>North</strong> <strong>Dakota</strong>. Detailed information about the segment is given in Table C.41<br />
Table C.41 Fairmount-Enderlin Line<br />
Beginning<br />
Milepost<br />
Ending<br />
Milepost<br />
Maximum<br />
Speed<br />
Maximum<br />
Carload<br />
Traffic Density<br />
(Million Gross Ton<br />
Miles/Mile)<br />
190.3 257.3 49 mph 143 tons 10-19.99<br />
Veblen Jct-South <strong>Dakota</strong> Line (CPR138)<br />
The Veblen Junction-South <strong>Dakota</strong> Line is the CPR Veblen Subdivision in southeast<br />
<strong>North</strong> <strong>Dakota</strong>. Veblen Junction is located 10 miles east <strong>of</strong> Hankinson in ND, on the<br />
Elbow Lake Subdivision <strong>of</strong> the main line. The Veblen Junction line connects to the<br />
Elbow Lake line and runs south 8.9 miles to the South <strong>Dakota</strong> border. Available<br />
information about the segment is given in Table C.42<br />
Table C.42 Veblen Junction-South <strong>Dakota</strong> Line<br />
Beginning Ending Maximum Maximum<br />
Milepost Milepost Speed Carload<br />
191.4 210.0 25 mph 143 tons<br />
In 2004, 17, 888,637 bushels <strong>of</strong> grain were shipped on the Subdivision, more than 5<br />
million bushels above the 2002-2004 average. Detailed information about grain<br />
movements on the subdivision is given in table C.43<br />
Table C.43 Grain Movement Generated on CPR Elbow Lake and Veblen<br />
Subdivisions<br />
Quantity Three Year Average<br />
(02, 03, 04)<br />
2004<br />
Bushels 12,506,345 17,888,637<br />
Tons 364,028 522,220<br />
Cars 3,262 4,679<br />
Cars Per Mile 43 61<br />
________________________________________________________________________<br />
<strong>North</strong> <strong>Dakota</strong> <strong>State</strong> <strong>Rail</strong> <strong>Plan</strong> 93
Wallhalla and Glasston Lines<br />
(DNRR):<br />
DNRR began operation February 5, 2006<br />
on the Grafton to Glasston and Grafton<br />
to Walhalla lines, leased from BNSF.<br />
DNRR has interchange capability with<br />
BNSF at Grafton. This branch line<br />
connects to the Glasston Subdivision <strong>of</strong><br />
the BNSF branch line at Grafton.<br />
In 2010, DNRR discontinued service on 18.12 miles <strong>of</strong> the Grafton to Glasston line, from<br />
approximately 2.7 miles north <strong>of</strong> Grafton (MP 42.08) to the end <strong>of</strong> the line approximately<br />
0.6 miles north <strong>of</strong> Glasston (MP 60.2). The action was a discontinuance <strong>of</strong> service, not<br />
an abandonment.<br />
The Grafton-Glasston and Grafton-Walhalla lines have a maximum speed <strong>of</strong> 25 mph and<br />
a maximum carload <strong>of</strong> 143 tons.<br />
Table C.44 Grafton-Glasston Line<br />
Beginning Ending Maximum Maximum<br />
Milepost Milepost Speed Carload<br />
39.4 59.6 25 mph 134 tons<br />
Table C.45 Grafton-Walhalla Line<br />
Beginning Ending Maximum Maximum<br />
Milepost Milepost Speed Carload<br />
0.0 47.9 25 mph 134 tons<br />
In 2009, 4,848,214 bushels <strong>of</strong> grain were shipped on the Glasston and Walhalla Lines.<br />
More detailed information about grain movements on the lines is given in table C.46<br />
below.<br />
Table C.46 2009 Grain and Oilseed Movements Generated on the Glasston and<br />
Walhalla Lines<br />
Quantity 2009<br />
Bushels* 4,448,214<br />
Tons 133,000<br />
Cars 1,330<br />
Cars Per Mile 20<br />
*Bushels are approximate as the total commodity mix is not given<br />
________________________________________________________________________<br />
<strong>North</strong> <strong>Dakota</strong> <strong>State</strong> <strong>Rail</strong> <strong>Plan</strong> 94
<strong>Dakota</strong> Subdivision (DMVW):<br />
Wishek-Hankinson Line<br />
(DM151 & DM145)<br />
The Wishek-Hankinson line is commonly<br />
referred to as the <strong>Dakota</strong> Subdivision <strong>of</strong><br />
the DMVW in southeastern <strong>North</strong> <strong>Dakota</strong>.<br />
The line connects to the RRVW Third<br />
Subdivision at Oakes and the CPR Elbow<br />
Lake Subdivision <strong>of</strong> the main line at Hankinson. From the Wishek station in southern<br />
<strong>North</strong> <strong>Dakota</strong>, the Wishek-Hankinson line runs 135.4 miles east to the Hankinson station.<br />
The <strong>Dakota</strong> Subdivision has a maximum speed <strong>of</strong> 10 mph and a maximum carload <strong>of</strong> 143<br />
tons. However, between the Fullerton and Wishek stations, the maximum carload is<br />
restricted to 134 tons. In 2004, 914,681 tons <strong>of</strong> grain movements were generated on the<br />
Wishek-Hankinson line, 7% greater than the 2002-2004 three-year average <strong>of</strong> 850,901<br />
tons. Detailed information about the Wishek-Hankinson line is given in Table C.47.<br />
Table C.47 Wishek-Hankinson Line<br />
Beginning<br />
Milepost<br />
Ending<br />
Milepost<br />
Maximum<br />
Speed<br />
Maximum<br />
Carload<br />
Tons Generated<br />
(3 yr. avg.<br />
02, 03, 04)<br />
Tons<br />
Generated<br />
(2004)<br />
341.0 205.6 10 mph 143 tons 850,906 914,681<br />
In 2004, 31.6 million bushels <strong>of</strong> grain movements were generated on the <strong>Dakota</strong><br />
Subdivision, roughly 2.3 million greater than the 2002-2004 three year average <strong>of</strong> 29.2<br />
million bushels. There were 8,196 carloads <strong>of</strong> grain generated on the line in 2004.<br />
Detailed information about grain movements generated over the <strong>Dakota</strong> Subdivision is<br />
given in Table C.48.<br />
Table C.48 Grain Movements Generated on the <strong>Dakota</strong> Subdivision<br />
Quantity Three Year Average<br />
(02, 03, 04)<br />
2004<br />
Bushels 29,297,447 31,601,455<br />
Tons 850,906 914,681<br />
Cars 7,625 8,196<br />
Cars Per Mile 56 60<br />
________________________________________________________________________<br />
<strong>North</strong> <strong>Dakota</strong> <strong>State</strong> <strong>Rail</strong> <strong>Plan</strong> 95
Aberdeen Subdivision (DMVW):<br />
Geneseo Junction-Havana<br />
The Geneseo Junction-Havana Line is<br />
part <strong>of</strong> the DMVW Aberdeen Subdivision<br />
in southeast <strong>North</strong> <strong>Dakota</strong>. The Geneseo<br />
Junction-Havana line runs from the<br />
Geneseo Junction, located 0.7 miles west<br />
<strong>of</strong> Geneseo in <strong>North</strong> <strong>Dakota</strong>, on the<br />
DMVW <strong>Dakota</strong> Subdivision and runs southwest 20.8 miles to Havana, near the<br />
South <strong>Dakota</strong> Border.<br />
The Aberdeen Subdivision has a maximum speed <strong>of</strong> 10 miles per hour and a maximum<br />
carload <strong>of</strong> 134 tons. Detailed information about the Geneseo Junction-Havana line is<br />
given in Table C.49. Grain movement data for the line was not available.<br />
Table C.49 Geneseo Junction-Havana Line<br />
Beginning Ending Maximum Maximum<br />
Milepost Milepost Speed Carload<br />
43.3 64.1 10 mph 134 tons<br />
________________________________________________________________________<br />
<strong>North</strong> <strong>Dakota</strong> <strong>State</strong> <strong>Rail</strong> <strong>Plan</strong> 96
Napoleon and Hazelton<br />
Subdivisions (DMVW):<br />
Wishek-M<strong>of</strong>fit Line (DM151)<br />
The Wishek-M<strong>of</strong>fit Line is the DMVW<br />
Napoleon Subdivision in south central<br />
<strong>North</strong> <strong>Dakota</strong>. The Wishek-M<strong>of</strong>fit line<br />
connects to the <strong>Dakota</strong> Subdivision at<br />
Wishek and runs northwest 52.9 miles to<br />
M<strong>of</strong>fit.<br />
The Napoleon Subdivision has a maximum speed <strong>of</strong> 10 miles per hour and a maximum<br />
carload <strong>of</strong> 134 tons. For confidentiality reasons, grain movements over the Wishek-<br />
M<strong>of</strong>fit line are not reported. Detailed information about the Wishek-M<strong>of</strong>fit line is given<br />
in Table C.50.<br />
Table C.50 Wishek-M<strong>of</strong>fit Line<br />
Beginning Ending Maximum Maximum<br />
Milepost Milepost Speed Carload<br />
341.0 391.9 10 mph 134 tons<br />
McKenzie-Linton Line (DM151)<br />
The McKenzie-Linton line is the DMVW Hazelton Subdivision in south central <strong>North</strong><br />
<strong>Dakota</strong>. The McKenzie station is located 18.3 miles east <strong>of</strong> Bismarck on the Jamestown<br />
Subdivision <strong>of</strong> the BNSF main line. DMVW has trackage rights on the BNSF mainline<br />
between Bismarck and the McKenzie Station. The McKenzie-Linton line connects to the<br />
BNSF Jamestown Subdivision and runs south to a point one mile south <strong>of</strong> the M<strong>of</strong>fit<br />
Junction. The remainder <strong>of</strong> the line between there and Linton has been abandoned.<br />
The Hazelton Subdivision has a maximum speed <strong>of</strong> 10 miles per hour and a maximum<br />
carload <strong>of</strong> 134 tons. For confidentiality reasons, grain movements over McKenzie-<br />
Linton line are not reported. Detailed information about the McKenzie-Linton line is<br />
given in Table C.51.<br />
Table C.51 McKenzie-Linton Line<br />
Beginning Ending Maximum Maximum<br />
Milepost Milepost Speed Carload<br />
0.0 45.3 10 mph 134 tons<br />
________________________________________________________________________<br />
<strong>North</strong> <strong>Dakota</strong> <strong>State</strong> <strong>Rail</strong> <strong>Plan</strong> 97
Missouri Valley Subdivision<br />
(DMVW):<br />
Max-Bismarck Line<br />
(DM149 & DM 151)<br />
The Max-Bismarck line is commonly<br />
referred to as the Missouri Valley<br />
Subdivision <strong>of</strong> the DMVW in <strong>North</strong><br />
<strong>Dakota</strong>. The line runs from the Max<br />
station on the CPR Newtown subdivision 48.2 miles west <strong>of</strong> Drake south 93.3 miles to<br />
the Bismarck station. The Max-Bismarck line connects to the BNSF main line at<br />
Bismarck. DMVW has trackage rights on the BNSF mainline from Bismarck east to the<br />
McKenzie Station.<br />
The Missouri Valley Subdivision has a maximum speed <strong>of</strong> 10 miles per hour and a<br />
maximum carload <strong>of</strong> 134 tons between Bismarck and Falkirk, and 143 tons on the<br />
remainder <strong>of</strong> the line. In 2004, 278,908 tons <strong>of</strong> grain movements were generated on the<br />
Max-Bismarck line, 16% higher than the 2002-2004 three year average <strong>of</strong> 241,282 tons.<br />
Detailed information about the Max-Bismarck line is given in Table C.52.<br />
Table C.52 Max-Bismarck Line<br />
Beginning<br />
Milepost<br />
Ending<br />
Milepost<br />
Maximum<br />
Speed<br />
Maximum<br />
Carload<br />
Tons Generated<br />
(3 yr. avg.<br />
02, 03, 04)<br />
Tons<br />
Generated<br />
(2004)<br />
341.0 205.6 10 mph 134 tons 241,282 278,908<br />
In 2004, 9.8 million bushels <strong>of</strong> grain movements were generated on the Missouri Valley<br />
Subdivision, roughly 1.3 million greater than the 2002-2004 three year average <strong>of</strong> 8.5<br />
million bushels. There were 2,499 carloads <strong>of</strong> grain generated on the line in 2004.<br />
Detailed information about the grain movements generated over the <strong>Dakota</strong> Subdivision<br />
is given in Table C.53.<br />
Table C.53 Grain Movements Generated on the DMVW Missouri Valley<br />
Subdivision<br />
Quantity Three Year Average<br />
(02, 03, 04)<br />
2004<br />
Bushels 8,483,620 9,785,310<br />
Tons 241,282 278,908<br />
Cars 2,162 2,499<br />
Cars Per Mile 23 27<br />
________________________________________________________________________<br />
<strong>North</strong> <strong>Dakota</strong> <strong>State</strong> <strong>Rail</strong> <strong>Plan</strong> 98
Western Subdivision (DMVW):<br />
Flaxton-Montana Line (DM125)<br />
The Flaxton-Montana Line is commonly<br />
known as the Western Subdivision <strong>of</strong> the<br />
DMVW in <strong>North</strong> <strong>Dakota</strong>. The line runs<br />
10.3 miles west from the Flaxton station<br />
on the CPR mainline, Portal Subdivision,<br />
to the to the Crosby station on BNSF<br />
Crosby Subdivision. From the Crosby station, the Western Subdivision runs 29.9 miles<br />
west to the Montana border, then on to Whitetail, MT<br />
The Western Subdivision has a maximum speed <strong>of</strong> 10 miles per hour and a maximum<br />
carload <strong>of</strong> 134 tons. In 2004, 140,326 tons <strong>of</strong> grain movements were generated on the<br />
Flaxton-Montana line, 23% below the 2002-2004 three year average <strong>of</strong> 183,148 tons.<br />
Detailed information about the Flaxton-Montana Line is given in Table C.54.<br />
Table C.54 Flaxton-Montana Line<br />
Beginning<br />
Milepost<br />
Ending<br />
Milepost<br />
Maximum<br />
Speed<br />
Maximum<br />
Carload<br />
Tons Generated<br />
(3 yr. avg.<br />
02, 03, 04)<br />
Tons<br />
Generated<br />
(2004)<br />
540.5 676.4 10 mph 134 tons 183,148 140,326<br />
In 2004, 4.7 million bushels <strong>of</strong> grain movements were generated on the Western<br />
Subdivision, roughly 1.5 million less than the 2002-2004 three year average <strong>of</strong> 6.2<br />
million bushels. There were 1,257 carloads <strong>of</strong> grain generated on the line in 2004.<br />
Detailed information about the grain movements generated over the Western Subdivision<br />
is given in Table C.55.<br />
Table C.55 Grain Movements Generated on the DMVW Western Subdivision<br />
Quantity Three Year Average<br />
(02, 03, 04)<br />
2004<br />
Bushels 6,159,356 4,720,557<br />
Tons 183,148 140,326<br />
Cars 1,641 1,257<br />
Cars Per Mile 21 18<br />
________________________________________________________________________<br />
<strong>North</strong> <strong>Dakota</strong> <strong>State</strong> <strong>Rail</strong> <strong>Plan</strong> 99
Bisbee Subdivision (NPR):<br />
Fordville-Kenmare Line (NPR135 & NPR139)<br />
The Fordville-Kenmare Line is the NPR Bisbee<br />
Subdivision in north central <strong>North</strong> <strong>Dakota</strong>. The<br />
Fordville station is located 34.3 miles west <strong>of</strong><br />
Oslo on the Devils Lake Subdivision. The<br />
Fordville-Kenmare line connects to the Devils<br />
Lake line and runs northwest 216.8 miles to the<br />
Kenmare station. In 2008, the segment between Bisbee and Kramer was abandoned. The<br />
line is now split into two segments and runs from Fordville to Bisbee and Kramer to<br />
Kenmare. The two segments have a total length <strong>of</strong> 156.3 miles.<br />
The branch line from Fordville-Kenmare has a maximum speed <strong>of</strong> 10 miles per hour and<br />
a maximum carload capacity <strong>of</strong> 143 tons. In 2004, the Fordville/Kenmare line generated<br />
634,715 tons <strong>of</strong> grain movements, slightly greater than the 2002-2004 average <strong>of</strong> 596,838<br />
tons. Tables C.56 provides a detailed summary <strong>of</strong> the segment.<br />
Table C.56 Fordville-Kenmare Line<br />
Beginning<br />
Milepost<br />
Ending<br />
Milepost<br />
Maximum<br />
Speed<br />
Maximum<br />
Carload<br />
Tons Generated<br />
(3 yr. avg.<br />
02, 03, 04)<br />
Tons<br />
Generated<br />
(2004)<br />
389.2 606.0 10 mph 143 tons 596,838 634,715<br />
In 2004, there were 23,099,658 bushels shipped on this branch line, more than 1,000,000<br />
bushels higher than the 2002-2004 three-year average. There were 5,687 carloads <strong>of</strong><br />
grain shipped on the line in 2004, 6.3% higher than the 2002-2004 three year average <strong>of</strong><br />
5,348. Detailed information about the grain movements over the Bisbee Subdivision is<br />
given in Table C.57.<br />
Table C.57 Grain Movements Generated on NPR Bisbee Subdivision<br />
Quantity Three Year Average<br />
(02, 03, 04)<br />
2004<br />
Bushels 22,010,268 23,099,658<br />
Tons 596,838 634,715<br />
Cars 5,348 5,687<br />
Cars Per Mile 25 26<br />
________________________________________________________________________<br />
<strong>North</strong> <strong>Dakota</strong> <strong>State</strong> <strong>Rail</strong> <strong>Plan</strong> 100
Sarles – Lakota line: (NPR)<br />
Sarles – Lakota Line<br />
The Sarles-Lakota line begins just north <strong>of</strong> the<br />
Lakota station, which is located 24.6 miles east<br />
<strong>of</strong> Devils Lake on the Devils Lake Subdivision<br />
<strong>of</strong> the BNSF main line. The Sarles-Lakota line<br />
runs north 73 miles to the Sarles station.<br />
NPR began operation on this line after it was acquired from BNSF in October, 2005. The<br />
Sarles-Lakota line has a maximum speed <strong>of</strong> 10 miles per hour and a maximum carload <strong>of</strong><br />
134 tons.<br />
In 2008, 44.44 miles <strong>of</strong> this line was abandoned, from approximately 3.75 miles north <strong>of</strong><br />
Lakota (MP 3.75), to approximately four miles south <strong>of</strong> Munich (MP 48.19).<br />
In 2010, an additional 5.4 miles <strong>of</strong> the line was abandoned, from MP 72.9 at Sarles to MP<br />
67.5 near Calvin. Detailed information about the remaining line is given in Table C.58.<br />
Table C.58 Calvin-Munich Line<br />
Beginning Ending Maximum Maximum<br />
Milepost Milepost Speed Carload<br />
48.19 67.5 25 mph 134 tons<br />
There was no history available for commodity movements on the line under NPR<br />
operation.<br />
________________________________________________________________________<br />
<strong>North</strong> <strong>Dakota</strong> <strong>State</strong> <strong>Rail</strong> <strong>Plan</strong> 101
Devils Lake Subdivision (NPR):<br />
Oslo-Devils Lake Line (NPR144)<br />
The Oslo-Devils Lake line is part <strong>of</strong> the NPR<br />
Devils Lake Subdivision in northeast<br />
<strong>North</strong> <strong>Dakota</strong>. The Oslo Station is located on<br />
the Minnesota side <strong>of</strong> the Red River, 48.5 miles<br />
west <strong>of</strong> Thief River Falls, Minnesota. The line<br />
runs 118 miles west from Oslo to the Harlow,<br />
<strong>North</strong> <strong>Dakota</strong> station.<br />
The branch line from Oslo-Devils Lake operates at speeds ranging from 5 to 25 mph.<br />
The maximum car load is 143 tons. In 2004, the Oslo-Devils Lake line generated<br />
395,967 tons <strong>of</strong> grain movements, about 14% higher than the 2002-2004 three year<br />
average <strong>of</strong> 348,563 tons. Table C.59 provides a detailed summary <strong>of</strong> the segment.<br />
Table C.59 Oslo-Devils Lake Line<br />
Beginning<br />
Milepost<br />
Ending<br />
Milepost<br />
Maximum<br />
Speed<br />
Maximum<br />
Carload<br />
Tons Generated<br />
(3 yr. avg.<br />
02, 03, 04)<br />
Tons<br />
Generated<br />
(2004)<br />
354.9 472.9 5-25 143 tons 348,563 395,967<br />
Table C.60 gives a detailed summary <strong>of</strong> the grain movements over the Devils Lake<br />
Subdivision. In, 2004, 13,373,572 bushels <strong>of</strong> grain movements were generated on the<br />
line, more than 1.5 million greater than the 2002-2004 average 11,833,771 bushels.<br />
There were 3,548 carloads <strong>of</strong> grain generated on the line in 2004, nearly 14% higher than<br />
the 2002-2004 three year average <strong>of</strong> 3,123.<br />
Table C.60 Grain Movements Generated on the NPR Devils Lake Subdivision<br />
Quantity Three Year Average<br />
(02, 03, 04)<br />
2004<br />
Bushels 11,883,771 13,373,572<br />
Tons 348,563 395,967<br />
Cars 3,123 3,548<br />
Cars Per Mile 14 16<br />
________________________________________________________________________<br />
<strong>North</strong> <strong>Dakota</strong> <strong>State</strong> <strong>Rail</strong> <strong>Plan</strong> 102
Second Subdivision (RRVW):<br />
Wahpeton Jct.-Casselton Line<br />
(RV051 & RV085)<br />
The Wahpeton Junction-Casselton line<br />
is the largest portion <strong>of</strong> the RRVW<br />
Second Subdivision in southeastern<br />
<strong>North</strong> <strong>Dakota</strong>. The line connects to<br />
the BNSF Jamestown Subdivision and<br />
runs southeast 53.6 miles south and<br />
east to the Wahpeton Junction. The Wahpeton Junction-Casselton Line has a maximum<br />
speed <strong>of</strong> 25 mph and a maximum carload <strong>of</strong> 143 tons. A detailed summary <strong>of</strong> the<br />
segment is included in Table C.61.<br />
Table C.61 Wahpeton Jct.-Casselton Line<br />
Beginning Ending Maximum Maximum<br />
Milepost Milepost Speed Carload<br />
1.4 55.0 25 mph 143 tons<br />
Chaffee Jct.-Chaffee Line (RV051)<br />
The Chaffee Junction-Chaffee Line is part <strong>of</strong> the RRVW Second Subdivision in<br />
southeastern <strong>North</strong> <strong>Dakota</strong>. The line connects to the Wahpeton Junction-Casselton line<br />
and runs west 11.6 miles to Chaffee. The Chaffee Junction-Chaffee line has a maximum<br />
speed <strong>of</strong> 25 mph and a maximum carload <strong>of</strong> 143 tons. A detailed summary <strong>of</strong> the<br />
segment is included in Table C.62.<br />
Table C.62 Chaffee Jct.-Chaffee Line<br />
Beginning Ending Maximum Maximum<br />
Milepost Milepost Speed Carload<br />
0 11.6 25 mph 143 tons<br />
Table C.63 gives a detailed summary <strong>of</strong> the grain movements over the RRVW Second<br />
Subdivision. In 2004, the number <strong>of</strong> bushels <strong>of</strong> grain shipped on this branch line was<br />
nearly 1 million higher than the 2002-2004 three-year average. There were 4,655<br />
carloads <strong>of</strong> grain shipped on the line in 2004, 4.2% higher than the three year average <strong>of</strong><br />
4,465.<br />
Table C.63 Grain Movements Generated on the RRVW Second Subdivision<br />
Quantity Three Year Average<br />
(02, 03, 04)<br />
2004<br />
Bushels 17,380,672 18,328,106<br />
Tons 498,277 519,450<br />
Cars 4,465 4,655<br />
Cars Per Mile 68 71<br />
________________________________________________________________________<br />
<strong>North</strong> <strong>Dakota</strong> <strong>State</strong> <strong>Rail</strong> <strong>Plan</strong> 103
Third Subdivision (RRVW):<br />
Oakes Junction-Independence Line<br />
(RV063)<br />
The Oakes Junction-Independence line<br />
is commonly referred to as the RRVW<br />
Third Subdivision in southeastern<br />
<strong>North</strong> <strong>Dakota</strong>. The line connects to<br />
the BNSF main line at Wahpeton and<br />
runs 88.8 miles west and north to the Independence station via Oakes.<br />
The Oakes Junction-Independence line has a maximum travel speed <strong>of</strong> 25 miles per hour,<br />
and a maximum carload capacity <strong>of</strong> 143 tons. In 2004, the Oakes-Independence line<br />
generated 559,390 tons <strong>of</strong> grain movements, 40% more than the 2002-2004 three year<br />
average <strong>of</strong> 397,225 tons. Table C.64 provides a detailed summary <strong>of</strong> the segment.<br />
Table C.64 Oakes Junction-Independence Line<br />
Beginning<br />
Milepost<br />
Ending<br />
Milepost<br />
Maximum<br />
Speed<br />
Maximum<br />
Carload<br />
Tons Generated<br />
(3 yr. avg.<br />
02, 03, 04)<br />
Tons<br />
Generated<br />
(2004)<br />
76.5 0 25 143 tons 397,225 556,390<br />
Table C.65 gives a detailed summary <strong>of</strong> the grain movements over this line. In 2004,<br />
there were 19,083,965 bushels <strong>of</strong> grain movements on the line, 40% greater than the<br />
2002-2004 average. There were 4,986 carloads <strong>of</strong> grain moved in 2004, 40% greater<br />
than the 2002-2004 three year average <strong>of</strong> 3,559.<br />
Table C.65 Grain Movements Generated on the RRVW Third Subdivision<br />
Quantity Three Year Average<br />
(02, 03, 04)<br />
2004<br />
Bushels 13,643,405 19,083,965<br />
Tons 397,225 556,390<br />
Cars 3,559 4,986<br />
Cars Per Mile 46 65<br />
________________________________________________________________________<br />
<strong>North</strong> <strong>Dakota</strong> <strong>State</strong> <strong>Rail</strong> <strong>Plan</strong> 104
Fourth Subdivision (RRVW):<br />
Horace-Edgeley Line<br />
(RV087, RV055 & RV091)<br />
The Horace-Edgeley line is commonly<br />
referred to as the RRVW Fourth<br />
Subdivision in southeastern <strong>North</strong> <strong>Dakota</strong>.<br />
The line runs 98.4 miles in an east-west<br />
direction and intersects with the RRVW<br />
Second, Third, and Sixth Subdivisions at Davenport, Independence, and LaMoure<br />
respectively.<br />
The Horace-Edgeley line has a maximum travel speed <strong>of</strong> 25 miles per hour and a<br />
maximum carload capacity <strong>of</strong> 143 tons. In 2004, the Horace-Edgeley line generated<br />
249,910 tons <strong>of</strong> grain movements, 40% less than the 2002-2004 average. Table C.66<br />
provides a detailed summary <strong>of</strong> the segment.<br />
Table C.66 Horace-Edgeley Line<br />
Beginning<br />
Milepost<br />
Ending<br />
Milepost<br />
Maximum<br />
Speed<br />
Maximum<br />
Carload<br />
Tons Generated<br />
(3 yr. avg.<br />
02, 03, 04)<br />
Tons<br />
Generated<br />
(2004)<br />
9.5 107.9 25 mph 143 tons 351,224 249,910<br />
Table C.67 gives a detailed summary <strong>of</strong> the grain movements over this line. In 2004, the<br />
there were 8,477,846 bushels <strong>of</strong> grain shipped on this branch line, about 3.5 million less<br />
than the 2002-2004 average. There were 2,239 carloads in 2004, 40% less than the 2002-<br />
2004 three year average.<br />
Table C.67 Grain Movements Generated on the RRVW Fourth Subdivision<br />
Quantity Three Year Average<br />
(02, 03, 04)<br />
2004<br />
Bushels 11,939,576 8,477,846<br />
Tons 351,224 249,910<br />
Cars 3,147 2,239<br />
Cars Per Mile 32 23<br />
________________________________________________________________________<br />
<strong>North</strong> <strong>Dakota</strong> <strong>State</strong> <strong>Rail</strong> <strong>Plan</strong> 105
Sixth Subdivision (RRVW):<br />
Jamestown-LaMoure Line (RV099)<br />
The Jamestown-LaMoure line is<br />
commonly referred to as the RRVW<br />
Sixth Subdivision in southeastern<br />
<strong>North</strong> <strong>Dakota</strong>. The line connects to<br />
the BNSF mainline at Jamestown and<br />
runs south 48.5 miles to the Lamoure<br />
station.<br />
The Jamestown-LaMoure line has a maximum travel speed <strong>of</strong> 25 miles per hour and a<br />
maximum carload capacity <strong>of</strong> 134 tons. For confidentiality reasons, grain movement data<br />
for the line is not reported. Detailed information about the Jamestown-LaMoure Line is<br />
given in Table C.68.<br />
Table C.68 Jamestown-LaMoure Line<br />
Beginning Ending Maximum Maximum<br />
Milepost Milepost Speed Carload<br />
2.0 48.5 25 mph 134 tons<br />
________________________________________________________________________<br />
<strong>North</strong> <strong>Dakota</strong> <strong>State</strong> <strong>Rail</strong> <strong>Plan</strong> 106
Seventh Subdivision (RRVW):<br />
Jamestown-Maddock Line<br />
(RV017, RV019, RV083 & RV099)<br />
The Jamestown-Maddock Line is<br />
commonly referred to as the RRVW<br />
Seventh Subdivision in central <strong>North</strong><br />
<strong>Dakota</strong>. The line connects to the<br />
BNSF mainline and the RRVW Sixth<br />
Subdivision at Jamestown and runs <strong>North</strong> 78.3 miles to Oberon and 15.4 miles west to<br />
Maddock.<br />
The Jamestown-Maddock line has a maximum travel speed <strong>of</strong> 25 miles per hour, and a<br />
maximum carload capacity <strong>of</strong> 143 tons. Detailed information about the Seventh<br />
Subdivision is given in Tables C.69 and C.70.<br />
Table C.69 Jamestown-Oberon Line<br />
Beginning Ending Maximum Maximum<br />
Milepost Milepost Speed Carload<br />
0.0 78.3 25 mph 134 tons<br />
Table C.70 Oberon-Maddock Line<br />
Beginning Ending Maximum Maximum<br />
Milepost Milepost Speed Carload<br />
0.0 15.4 25 mph 134 tons<br />
Table C.71 gives a detailed summary <strong>of</strong> the grain movements over this line. 2004 grain<br />
shipments on this line exceeded the 2002-2004 three year average by nearly 700,000<br />
bushels, an increase <strong>of</strong> more than 16%. There were 1,222 carloads <strong>of</strong> grain shipped on<br />
the line in 2004.<br />
Table C.71 Grain Movements Generated on the RRVW Seventh Subdivision<br />
Quantity Three Year Average<br />
(02, 03, 04)<br />
2004<br />
Bushels 4,112,161 4,781,911<br />
Tons 118,270 136,323<br />
Cars 1,060 1,222<br />
Cars Per Mile 11 13<br />
________________________________________________________________________<br />
<strong>North</strong> <strong>Dakota</strong> <strong>State</strong> <strong>Rail</strong> <strong>Plan</strong> 107
Eighth Subdivision (RRVW):<br />
Pingree-Woodworth Line (RV081)<br />
The Pingree-Woodworth line is commonly<br />
known as the RRVW Eighth Subdivision in<br />
central <strong>North</strong> <strong>Dakota</strong>. The line connects to<br />
the RRVW Seventh Subdivision at Pingree<br />
and runs 21.55 miles west to the Woodworth<br />
station. Available information about the line<br />
is given in Table C.72<br />
Table C.72 Pingree-Woodworth Line<br />
Beginning Ending Maximum Maximum<br />
Milepost Milepost Speed Carload<br />
0.4 21.55 25 mph 134 tons<br />
For confidentiality reasons, grain movements over the Eighth Subdivision are not<br />
reported.<br />
________________________________________________________________________<br />
<strong>North</strong> <strong>Dakota</strong> <strong>State</strong> <strong>Rail</strong> <strong>Plan</strong> 108
Sidney Line (YVSR):<br />
Glendive, MT – Snowdon, MT<br />
Bainville, MT – Scobey, MT<br />
YSVR began operation August 15, 2005, over<br />
track leased from BNSF. YSVR is headquartered<br />
at Sidney, MT. The YSVR network runs from<br />
Glendive to Snowdon and Bainville to Scobey,<br />
with trackage rights on the BNSF Glasgow<br />
Subdivision mainline between Snowdon and Bainville. The YSVR network is entirely in<br />
Montana, except for where the Glendive line crosses into <strong>North</strong> <strong>Dakota</strong> near Fairview<br />
and runs north for 8.7 miles before crossing back into Montana. YSVR interchanges with<br />
BNSF at Glendive and Snowdon. Available information about the line is given in Table<br />
C.73<br />
Table C.73 Glendive Line (ND segment)<br />
Beginning Ending Maximum Maximum<br />
Milepost Milepost Speed Carload<br />
64.6 73.3 NA NA<br />
YSVR reported no grain movements in ND for 2009.<br />
________________________________________________________________________<br />
<strong>North</strong> <strong>Dakota</strong> <strong>State</strong> <strong>Rail</strong> <strong>Plan</strong> 109
________________________________________________________________________<br />
<strong>North</strong> <strong>Dakota</strong> <strong>State</strong> <strong>Rail</strong> <strong>Plan</strong> 110
APPENDIX D<br />
GOALS FOR NORTH DAKOTA RAIL PLANNING<br />
________________________________________________________________________<br />
<strong>North</strong> <strong>Dakota</strong> <strong>State</strong> <strong>Rail</strong> <strong>Plan</strong> 111
________________________________________________________________________<br />
<strong>North</strong> <strong>Dakota</strong> <strong>State</strong> <strong>Rail</strong> <strong>Plan</strong> 112
<strong>Rail</strong> <strong>Plan</strong> Advisory and Visioning<br />
A rail advisory group was formed to provide input<br />
to the rail plan update process and to establish a<br />
vision for the future <strong>of</strong> <strong>North</strong> <strong>Dakota</strong>’s rail<br />
system. The advisory group consisted <strong>of</strong> various<br />
stakeholders in the rail industry in <strong>North</strong> <strong>Dakota</strong>.<br />
The group held four meetings, including a joint<br />
meeting with Minnesota to consider cross border<br />
issues and issues common to both states.<br />
The visions and strategies generated from the<br />
advisory committee were condensed to formulate<br />
the rail planning goals outlined in Chapter 1. The<br />
main visions identified were:<br />
1. A safe and secure railroad system, without<br />
fatalities or trespassers, that is integrated<br />
with a comprehensive homeland security<br />
vision and is achieved without excessive<br />
administrative burdens.<br />
2. An integrated railroad network.<br />
3. An adequately maintained railroad<br />
<strong>State</strong> <strong>Rail</strong> Advisory Group<br />
BNSF <strong>Rail</strong>way<br />
Canadian Pacific <strong>Rail</strong>way<br />
<strong>Dakota</strong>, Missouri Valley &<br />
Western <strong>Rail</strong>road<br />
<strong>North</strong>ern Plains <strong>Rail</strong>road<br />
Red River Valley & Western<br />
<strong>Rail</strong>road<br />
Fargo/Moorhead MetroCog<br />
Grand Forks/East Grand Forks<br />
MPO<br />
Bismarck/Mandan MPO<br />
<strong>North</strong> <strong>Dakota</strong> <strong>Department</strong> <strong>of</strong><br />
<strong>Transportation</strong><br />
<strong>North</strong> <strong>Dakota</strong> Public Service<br />
commission<br />
<strong>North</strong> <strong>Dakota</strong> <strong>Department</strong> <strong>of</strong><br />
Agriculture<br />
<strong>North</strong> <strong>Dakota</strong> <strong>Department</strong> <strong>of</strong><br />
Commerce<br />
Operation Lifesaver<br />
Federal <strong>Rail</strong>road<br />
Administration<br />
Federal Highway<br />
Administration<br />
infrastructure that is capable <strong>of</strong> meeting current and future service demands.<br />
4. <strong>Rail</strong>road operations and infrastructure that enhance community mobility and<br />
quality <strong>of</strong> life.<br />
5. A level <strong>of</strong> railroad service that reflects service frequencies, times, and equipment<br />
availability; develop a separate level <strong>of</strong> service for freight transportation<br />
6. Improve service by eliminating choke points and through consolidation that<br />
benefits both railroads and shippers.<br />
7. A viable railroad system with adequate service and capacity to promote efficiency<br />
and growth and allow existing and potential businesses to develop and expand<br />
into national and world markets.<br />
8. A favorable business and regulatory climate for shippers and railroads that<br />
reflects a heightened focus on investment and business development.<br />
9. Public-private partnerships that improve communication and coordination among<br />
shippers, governments, and railroad companies and promote business<br />
development, economic growth, and grade crossing safety.<br />
10. A viable and coordinated inter/multimodal facilities network that maximizes<br />
benefits to the state, allows agricultural and manufacturing businesses to grow and<br />
diversify, and improves access for communities.<br />
11. Coordinated public-private multimodal planning efforts that consider all modes <strong>of</strong><br />
transportation to make the best investments <strong>of</strong> public and private funds.<br />
From these visioning statements, specific categories within each vision were identified.<br />
________________________________________________________________________<br />
<strong>North</strong> <strong>Dakota</strong> <strong>State</strong> <strong>Rail</strong> <strong>Plan</strong> 113
<strong>North</strong> <strong>Dakota</strong> <strong>Rail</strong> <strong>Plan</strong>ning Vision <strong>State</strong>ments<br />
1. A safe and secure railroad system, without fatalities or trespassers, that is<br />
integrated with a comprehensive homeland security vision and is achieved<br />
without excessive administrative burdens<br />
• A practical and achievable partnership between private and public agencies to<br />
help ensure the success <strong>of</strong> railroad operations<br />
• A rail system that expedites the movement <strong>of</strong> commodities, goods, materials,<br />
and people and that contributes to and does not hinder the safety and security <strong>of</strong><br />
individuals and communities in <strong>North</strong> <strong>Dakota</strong><br />
• <strong>Rail</strong>roads that contribute to an integrated comprehensive focus on homeland<br />
security<br />
• A safe and secure railroad system achieved without excessive administrative<br />
burdens<br />
• Enhanced opportunities for secure shipments <strong>of</strong> identity preserved products by<br />
rail<br />
• No deaths at rail-highway grade crossings and within the industry itself<br />
including derailments, rail operations, and trespassers on railroad property<br />
• A public that is better educated about grade crossing safety and procedures<br />
• No unprotected grade crossings<br />
• More grade separations for safer highway-rail intersections<br />
• No trespassers on railroad properties<br />
• Greater awareness at border crossings <strong>of</strong> the potential impacts <strong>of</strong> trespassers on<br />
homeland security<br />
• An updated rail/highway crossing inventory which supports proper safety<br />
measures being in place<br />
• Installation <strong>of</strong> automated signals at crossings with high traffic volumes or poor<br />
visibility<br />
• Closing <strong>of</strong> unnecessary at-grade crossings<br />
2. A railroad network that provides enhanced access in both rural and urban areas<br />
and is integrated with alternative transportation services<br />
• A connected transportation system with alternative services, including public<br />
transportation<br />
• Enhanced access in both urban and rural areas<br />
• A fully integrated multimodal transportation infrastructure<br />
● Smooth transitions from short line railroads to Class 1 railroads<br />
3. An adequately maintained railroad infrastructure that is capable <strong>of</strong> meeting<br />
current and future service demands<br />
• A rail system (including short line railroads) that is adequately maintained with<br />
a track structure capable <strong>of</strong> meeting current and future service demands<br />
• Upgraded railroad infrastructure capable <strong>of</strong> handling increased car weights and<br />
train speeds<br />
• Public infrastructure investment to assist short line and Class 1 railroads<br />
________________________________________________________________________<br />
<strong>North</strong> <strong>Dakota</strong> <strong>State</strong> <strong>Rail</strong> <strong>Plan</strong> 114
4. <strong>Rail</strong>road operations and infrastructure that enhance community mobility and<br />
quality <strong>of</strong> life while reducing intermodal conflicts<br />
• Minimize intermodal conflicts<br />
• Quiet zones are a local issue<br />
• Quiet zones should be implemented without compromising public safety<br />
• Less noise – horns, operations and coupling<br />
• Smart Growth <strong>of</strong> communities (integrate rail planning with urban planning)<br />
• Include railroads and rail safety in land use planning (public vs. private<br />
crossings, siting <strong>of</strong> residential developments)<br />
• Trade<strong>of</strong>f between reduced through-town speeds and blocked crossing duration<br />
• Reduce time lost due to blocked crossings<br />
5. A measurable level <strong>of</strong> railroad service that reflects service frequencies, times,<br />
and equipment availability (separate passenger and freight); develop a separate<br />
level <strong>of</strong> service for freight transportation – i.e. capacity <strong>of</strong> railroads to move<br />
desired volumes)<br />
• Increased equipment availability to meet service demands<br />
• Better arrival and departure times for passenger rail services<br />
• A measurable and understandable level <strong>of</strong> service<br />
• Competitively priced passenger rail service<br />
6. Improve service by eliminating choke points and through consolidation that<br />
benefits both railroads and shippers<br />
• No bottlenecks, pinch-points, or system defects on the rail system which limit<br />
effects cascading to other modes<br />
• Service consolidation locations which make sense to shippers, service providers<br />
and other modes<br />
7. A viable railroad system with adequate service and capacity to promote<br />
efficiency and growth and allow existing and potential businesses to develop and<br />
expand into world and national markets<br />
• An economically viable railroad system<br />
• <strong>Rail</strong>road pr<strong>of</strong>itability which supports reinvestment in rail equipment and<br />
infrastructure<br />
• <strong>Rail</strong>road service <strong>of</strong>ferings that accommodate efficiency, growth, and capacity<br />
• A rail system that allows existing and potential businesses to develop and<br />
expand in <strong>North</strong> <strong>Dakota</strong> by moving into world and national markets<br />
• <strong>Rail</strong> services that contribute to and do not hinder economic growth<br />
• A rail system that accentuates <strong>North</strong> <strong>Dakota</strong>’s strengths and capabilities<br />
8. A favorable business and regulatory climate for shippers and railroads that<br />
reflects a heightened focus on investment and business development<br />
• A favorable business and regulatory climate for shippers and railroads<br />
• Heightened focus on investment and business development<br />
________________________________________________________________________<br />
<strong>North</strong> <strong>Dakota</strong> <strong>State</strong> <strong>Rail</strong> <strong>Plan</strong> 115
9. Public-private partnerships that improve communication and coordination<br />
among shippers, governments, and railroad companies and promote business<br />
development, economic growth, and grade crossing safety<br />
• More public/private partnerships that would specifically improve railroad<br />
competitiveness<br />
• Public programs for the retention <strong>of</strong> abandoned railroad rights-<strong>of</strong>-way and to<br />
assess different opportunities for right-<strong>of</strong>-way use<br />
• Improved communications between state and local economic development<br />
entities and railroads to move forward new ideas for business opportunities and<br />
growth<br />
• Enhanced communication between the public and railroads to achieve better<br />
understanding <strong>of</strong> expectations and perspectives on both sides<br />
• ND rail system should become a key component in economic development<br />
considerations <strong>of</strong> the state including investment in necessary projects<br />
• Mesh the expectations <strong>of</strong> shippers, governments, and railroads<br />
• Leverage state investments in the rail system through project prioritization<br />
• Entities other than state and local government increase contribution to crossing<br />
safety<br />
10. A viable and coordinated inter/multimodal facilities network that maximizes<br />
benefits to the state, allows agricultural and manufacturing businesses to grow<br />
and diversify, and improves access for communities<br />
• Geographic locations <strong>of</strong> intermodal/multimodal facilities that maintain their<br />
viability and allow agricultural and manufacturing opportunity to grow and<br />
diversify<br />
• Smaller distributed facilities in addition to larger centralized facilities<br />
• Established thresholds for intermodal facilities to assist in facility planning<br />
• Structure to coordinate facility location and size to maximize the overall benefit<br />
to the state rather than individual communities<br />
• Provide intermodal connectivity consistent with community commitment,<br />
resources and capabilities<br />
• Improve and enhance access roads to intermodal facilities<br />
• Real-time data exchange among modes for optimization <strong>of</strong> operations<br />
• <strong>Plan</strong>ning to include all types <strong>of</strong> intermodal movements not just containerized<br />
shipments<br />
• Multimodal commerce centers including intermodal, transfer and transloading<br />
capabilities<br />
11. Coordinated public-private multimodal planning efforts that consider all modes<br />
<strong>of</strong> transportation in order to make the best investments <strong>of</strong> public and private<br />
funds<br />
• More flexibility and partnerships between states, cities and railroads to achieve<br />
intermodal connectivity<br />
• Facility planning and construction with the necessary highway infrastructure to<br />
provide adequate service to and from the facility<br />
________________________________________________________________________<br />
<strong>North</strong> <strong>Dakota</strong> <strong>State</strong> <strong>Rail</strong> <strong>Plan</strong> 116
• A rail/intermodal plan that addresses both long-term and geographic<br />
competitiveness <strong>of</strong> <strong>North</strong> <strong>Dakota</strong> transportation<br />
• Strategic investment <strong>of</strong> public funds<br />
Strategies to Achieve <strong>North</strong> <strong>Dakota</strong> <strong>Rail</strong> <strong>Plan</strong> Visions<br />
Action items, or strategies, were developed to achieve the rail plan visions. The<br />
strategies were further refined to ensure that the proposed actions were within the scope<br />
<strong>of</strong> the rail plan. The strategies are presented below.<br />
1. A safe and secure railroad system, without fatalities or trespassers, that is<br />
integrated with a comprehensive homeland security vision and is achieved<br />
without excessive administrative burdens.<br />
● Broaden Operation Lifesaver target groups to achieve a public that is better<br />
educated about grade crossings<br />
● Include rail safety issues in farmer safety seminars, ATV, Snowmobile and gun<br />
safety courses and in schools<br />
● Support mandated grade crossing material in driver education<br />
● Develop a best practices manual for implementation <strong>of</strong> safety measures by<br />
working with the appropriate AASHTO committees<br />
● Identify safety and security issues and develop a prioritization method for reaching<br />
the desired performance level<br />
● Update the grade crossing inventory so that it is reliable and consistent – and<br />
implement a user friendly update process<br />
● Survey local communities to identify safety and security problems<br />
● Add upgrade <strong>of</strong> existing automated signals as appropriate to new installation <strong>of</strong><br />
automated signals<br />
● Integrated rail and local planning – to potentially include plat review, city &<br />
county, MPO technical reviews, city & county planning commissions, city &<br />
county commissions<br />
● Integrate rail planning into other planning processes to align goals – increase<br />
communication <strong>of</strong> parties involved<br />
● Continue to work with railroads and local governments to provide incentives to<br />
reduce at-grade crossings – require local subdivisions to address the issue <strong>of</strong> grade<br />
crossings before zoning would be approved<br />
● Link funding issues with implementation <strong>of</strong> safety measures<br />
● Review law regarding railroad trespassers; consider advocating change if indicated<br />
● Support enforcement <strong>of</strong> grade crossing violations<br />
● Modify statement regarding border crossing to include shipments as well as<br />
trespassers – also add the impact <strong>of</strong> trespassers on public safety in general<br />
2. An integrated railroad network<br />
• Evaluate open access<br />
• Identify what is needed to accomplish the goal <strong>of</strong> an integrated railroad network<br />
• Develop an accessibility rating to identify areas which need improvements<br />
________________________________________________________________________<br />
<strong>North</strong> <strong>Dakota</strong> <strong>State</strong> <strong>Rail</strong> <strong>Plan</strong> 117
• Expand yard tracks at connections or put in additional sidings at yards, providing<br />
quicker turn times and reduction in delays<br />
• Target specific areas or projects that would benefit from increased access<br />
• Survey railroads to identify problems with transitions between Class I railroads<br />
and Short Line railroads including documentation, physical problems such as<br />
mixed destination shipments, capacity, and managerial issues.<br />
• Target specific areas or projects that would benefit from increased access<br />
3. An adequately maintained railroad infrastructure that is capable <strong>of</strong> meeting<br />
current and future service demands<br />
• Continue to provide public notice on major improvements <strong>of</strong> tracks – so there will<br />
be an opportunity to provide input to the process<br />
• Develop procedures and rationale for investment decisions for state rail fund<br />
programs – include a timely response requirement for both the state and applicants.<br />
• Consider the effect <strong>of</strong> the infrastructure on the overall transportation network <strong>of</strong><br />
the state<br />
• Use survey and/or other means to determine where problems are – and to develop<br />
strategies to address the most critical situations first<br />
• Coordinate plans <strong>of</strong> entities involved (NDDOT, Class I, Short Line) to include<br />
highway planning<br />
• Identification <strong>of</strong> demand side – also, determine whether railroads would be willing<br />
to share improvement plans and improvement strategies<br />
• Encourage development <strong>of</strong> a formal mechanism to determine adequate service<br />
between Short Lines and Class I, i.e., more supply chain information processing<br />
(more information = less risk <strong>of</strong> lack <strong>of</strong> service)<br />
• Continue/initiate annual meetings between railroads and customers to discuss car<br />
availability and infrastructure improvement needs<br />
• Support federal tax incentives to short lines for implementation <strong>of</strong> improvements<br />
(i.e., fencing mandate) to provide relief for short lines and branch lines<br />
4. <strong>Rail</strong>road operations and infrastructure that enhance community mobility and<br />
quality <strong>of</strong> life<br />
• Support adequate advance notice <strong>of</strong> blocked crossings due to construction or<br />
loading/unloading/siding/switching operations to accommodate emergency<br />
services and public highway travel<br />
• Quiet zones are local issue<br />
• Assess trade<strong>of</strong>f between reduced through-town train speeds and the length <strong>of</strong> time<br />
crossings are blocked<br />
• Minimize intermodal conflicts – grade separations, alternate highway routes<br />
• Facilitate Smart Growth <strong>of</strong> communities by integrating rail planning with urban<br />
planning. Include railroads and rail safety issues in land use planning (public vs.<br />
private crossings, siting <strong>of</strong> residential developments)<br />
• Explore potential for rail relocation projects<br />
________________________________________________________________________<br />
<strong>North</strong> <strong>Dakota</strong> <strong>State</strong> <strong>Rail</strong> <strong>Plan</strong> 118
5. Measurable level <strong>of</strong> railroad service that reflects service frequencies, times, and<br />
equipment availability (separate passenger and freight); develop separate level<br />
<strong>of</strong> service for freight transportation – capacity to move desired volumes)<br />
• Identify key level <strong>of</strong> service attributes and combine them to provide a measurable<br />
level <strong>of</strong> service indicator or indicators<br />
6. Improve service by eliminating choke points and by consolidation that benefits<br />
both railroads and shippers<br />
• Identify bottlenecks, pinch-points, or system defects on the rail system<br />
• Emphasize network improvements as a criteria for state rail assistance funds<br />
• Facilitate communication between shippers and transportation providers to show<br />
benefits <strong>of</strong> consolidation points<br />
• Assess the desirability <strong>of</strong> legislation to promote development <strong>of</strong> consolidation<br />
centers<br />
7. A viable railroad system with adequate service and capacity to promote<br />
efficiency and growth and allow existing and potential businesses to develop and<br />
expand into world and national markets<br />
● Identify industries served by rail to identify the key rail network within the state,<br />
and also to identify areas for improvement which would increase benefits to<br />
shippers both on these segments and elsewhere<br />
● Promote an economically viable railroad system with railroad pr<strong>of</strong>itability that<br />
supports reinvestment in rail equipment and infrastructure<br />
8. A favorable business and regulatory climate for shippers and railroads that<br />
reflects a heightened focus on investment and business development<br />
• Prioritization <strong>of</strong> rail assistance funds through competitive submission process<br />
9. Public-private partnerships that improve communication and coordination<br />
among shippers, governments, and railroad companies and promote business<br />
development, economic growth, and grade crossing safety<br />
• Continue “visioning” type sessions with stakeholders to allow expectations <strong>of</strong> all<br />
parties to be communicated not only to the NDDOT, but among parties to enhance<br />
understanding and provide opportunities for collaboration<br />
• Develop a multifaceted approach to the rail project screening process:<br />
• state’s rail network Benefit/Cost Analysis<br />
• Assess the project’s importance to the economy (local, regional, state)<br />
• Consider the project’s strategic impact on the and local, regional and statewide<br />
transportation system<br />
• Increase communication with private industry to assess rail needs and<br />
opportunities to invest with the state’s best interests in mind<br />
• Identify opportunities for private industry to contribute to grade crossing safety<br />
issues<br />
• Identify opportunities with legislation aimed at economic development which may<br />
involve rail policies and infrastructure<br />
• Assess opportunities for abandoned rail rights-<strong>of</strong>-way<br />
________________________________________________________________________<br />
<strong>North</strong> <strong>Dakota</strong> <strong>State</strong> <strong>Rail</strong> <strong>Plan</strong> 119
10. A viable and coordinated inter/multimodal facilities network that maximizes<br />
benefits to the state, allows agricultural and manufacturing businesses to grow<br />
and diversify, and improves access for communities<br />
• Conduct research, formal or informal, regarding the characteristics <strong>of</strong> successful<br />
intermodal facilities and how to accurately assess potential shipment volume<br />
• Assess the desirability <strong>of</strong> smaller distributed facilities in addition to larger<br />
centralized facilities<br />
• Assess the desirability <strong>of</strong> the use <strong>of</strong> rail funds to enhance connectivity <strong>of</strong> proposed<br />
facilities to maximize benefit to the local area and region<br />
• Facilitate discussion between local government and facility ownership to ensure<br />
connectivity and the success <strong>of</strong> proposed facilities<br />
11. Coordinated public-private multimodal planning efforts that consider all modes<br />
<strong>of</strong> transportation in order to make the best investments <strong>of</strong> public and private<br />
funds<br />
• <strong>Rail</strong> <strong>Plan</strong>ning to serve as a facilitation/liaison between highway planning and<br />
private parties involved to provide adequate service to future facilities<br />
• Develop a strategic plan for intermodal development. Serve as an information<br />
source regarding rail access for proposed facilities, and assess possible publicly<br />
funded rail access<br />
• Continue visioning type sessions outside <strong>of</strong> the rail plan update to increase<br />
communication between stakeholders. This allows for further understanding <strong>of</strong><br />
each party’s concerns and opportunities<br />
• Develop prioritization techniques for the allocation <strong>of</strong> state rail assistance funds to<br />
projects which have:<br />
• The best overall Benefit/Cost Ratio<br />
• Strategic benefits, such as rail network enhancement<br />
• Intermodal and multimodal connectivity benefits above and beyond direct local<br />
impacts<br />
• Economic enhancement benefits, state, regional, and local<br />
________________________________________________________________________<br />
<strong>North</strong> <strong>Dakota</strong> <strong>State</strong> <strong>Rail</strong> <strong>Plan</strong> 120
Joint Minnesota-<strong>North</strong> <strong>Dakota</strong> <strong>Rail</strong> <strong>Plan</strong>ning Conference:<br />
Regional <strong>Rail</strong> <strong>Plan</strong>ning Issues<br />
September 27, 2005, a joint Minnesota – <strong>North</strong> <strong>Dakota</strong> rail conference was held in Fargo.<br />
Participants included the <strong>North</strong> <strong>Dakota</strong> <strong>Rail</strong> Advisory Group, planning representatives<br />
from the Minnesota (MNDOT) and <strong>North</strong> <strong>Dakota</strong> (NDDOT) <strong>Department</strong>s <strong>of</strong><br />
<strong>Transportation</strong> and district engineers from border districts in both states.<br />
The purpose <strong>of</strong> the conference was to: (1) involve stakeholders with interests in both<br />
Minnesota and <strong>North</strong> <strong>Dakota</strong> rail programs in a dialogue with MNDOT and NDDOT rail<br />
planners, (2) discuss common and cross-border rail and intermodal issues, and (3)<br />
identify areas <strong>of</strong> future coordination and collaboration between Minnesota and <strong>North</strong><br />
<strong>Dakota</strong> to help meet the needs <strong>of</strong> both states.<br />
A summary <strong>of</strong> the substance <strong>of</strong> the meeting is presented below. Detailed notes follow,<br />
under a separate heading.<br />
Access to Facilities and Transfer Points. Access to and from facilities across state lines<br />
is essential for economic growth and trade. Access to shuttle elevators, plants,<br />
warehouses, and intermodal transfer facilities is especially important. Much <strong>of</strong> eastern<br />
<strong>North</strong> <strong>Dakota</strong>’s grain crop moves to Minnesota ports. Continued access to these ports is<br />
vital. However, differences in truck size and weight regulations among states may affect<br />
truck access and the desirability <strong>of</strong> locations for industry.<br />
Improved communication from shippers regarding new rail or intermodal facilities<br />
would provide benefit railroads, state DOT, and metropolitan and county governments.<br />
Advance notice <strong>of</strong> new facilities should be made available at the time <strong>of</strong> initial facility<br />
planning. This time frame would allow state and local transportation agencies time to<br />
react. This process would allow DOT to be proactive rather than reactive. Potential<br />
locations in proximity to access highways should be encouraged.<br />
Coordinated planning could maximize available resources and simplify planning<br />
procedures. Several layers <strong>of</strong> planning exist within the region. However, all levels <strong>of</strong><br />
government do not have access to the information they need. Metropolitan <strong>Plan</strong>ning<br />
Organizations and Councils <strong>of</strong> Government would like to develop better sources <strong>of</strong> crossborder<br />
traffic data, as well as better freight data for short- and long-term planning. The<br />
lack <strong>of</strong> freight data causes a reactive rather than a proactive approach. MPOs must<br />
respond to individual complaints and proposals without a comprehensive picture <strong>of</strong><br />
overall freight flows and facility needs.<br />
Moreover, current planning is automobile-oriented because <strong>of</strong> the lack <strong>of</strong> freight data and<br />
freight planning programs. Freight access and mobility should be fully considered in<br />
long-range planning, along with related safety considerations. However, railroads rarely<br />
participate in this process. Within state transportation departments, much <strong>of</strong> the planning<br />
occurs at central levels. Nevertheless, there is considerable opportunity for on-going<br />
communication between railroads and district engineers.<br />
________________________________________________________________________<br />
<strong>North</strong> <strong>Dakota</strong> <strong>State</strong> <strong>Rail</strong> <strong>Plan</strong> 121
Integration <strong>of</strong> railroad objectives and infrastructure needs into state and local planning<br />
processes could improve community planning and avoid many potential conflicts and<br />
issues. For example, highway bridge construction planning should include criteria to<br />
accommodate doublestack trains and other high/wide loads moving over rail lines.<br />
<strong>Rail</strong>roads need to participate in local government planning processes. However, there are<br />
multiple units <strong>of</strong> government to deal with, making it difficult for railroads actively<br />
participate in all the areas they would like. A streamlining <strong>of</strong> contacts among railroads,<br />
MPOs, and DOT districts could help improve communication and planning. The states<br />
could facilitate this communication and host annual meetings. Moreover, the railroads<br />
could plan annual meetings with each MPO to provide input into the long-range planning<br />
process.<br />
Joint Minnesota-<strong>North</strong> <strong>Dakota</strong> <strong>Rail</strong> <strong>Plan</strong>ning Conference<br />
Notes<br />
Overview <strong>of</strong> <strong>State</strong> <strong>Rail</strong> Programs<br />
Tim Spencer— Director <strong>of</strong> the <strong>Rail</strong> and Program Development Section <strong>of</strong> the Minnesota<br />
<strong>Department</strong> <strong>of</strong> <strong>Transportation</strong> (MNDOT) — provided an overview <strong>of</strong> MNDOT<br />
programs, including the Minnesota <strong>Rail</strong> Service Improvement Program (MRSI) and the<br />
Minnesota <strong>Rail</strong>road-Highway Grade Crossing Safety Improvement Program.<br />
The MSRI program provides loans or grants to rail users and carriers to rehabilitate lines,<br />
improve rail shipping opportunities, and preserve and maintain abandoned rail corridors<br />
for future transportation use. These funds can be used for rail siding improvements and<br />
related facilities along a siding to improve loading efficiency. The MRSI Program has<br />
received both General Fund and Bond appropriations. However, the program has<br />
essentially funded itself for the last 25 years.<br />
The Minnesota <strong>Rail</strong>road-Highway Grade Crossing Safety Improvement Program<br />
provides funds that are used to: (1) close and consolidate crossings, (2) install active<br />
signals and signal upgrades, (3) install passive signs, (4) improve sight distances, (5)<br />
improve crossing alignments and grades, (6) improve lighting, and (7) contribute to grade<br />
separation, up to the cost <strong>of</strong> signal installation. The USDOT Accident Prediction Formula<br />
is used to identify high hazard locations. MNDOT has developed several grade-crossing<br />
performance measures including: reducing crashes by 2 percent per year and<br />
programming 40 grade-crossing safety improvements per year. Moreover, MNDOT has<br />
created a condition formula to assess grade-crossing safety. During the TEA-21 period,<br />
10 percent <strong>of</strong> Minnesota’s Surface <strong>Transportation</strong> Program (STP) improvement funds<br />
were used for the grade crossing-program.<br />
The recently passed SAFETEA-LU legislation includes authorization for <strong>Rail</strong> Relocation<br />
Funds. If funds are later appropriated by Congress, strict standards will likely be<br />
imposed. The most likely use <strong>of</strong> these funds will be for large urban areas.<br />
________________________________________________________________________<br />
<strong>North</strong> <strong>Dakota</strong> <strong>State</strong> <strong>Rail</strong> <strong>Plan</strong> 122
Robert Johnston <strong>of</strong> the <strong>North</strong> <strong>Dakota</strong> <strong>Department</strong> <strong>of</strong> <strong>Transportation</strong> (NDDOT) provided<br />
an overview <strong>of</strong> NDDOT rail programs and the state rail plan. The rail plan-which has<br />
three parts-was published in 1998. Currently, the plan is being updated and prepared for<br />
web access. The update will align the rail plan with TransAction, <strong>North</strong> <strong>Dakota</strong>’s<br />
statewide strategic transportation plan. However, rates, car service, and other regulatory<br />
issues will be removed from the rail plan, as these issues are not within the purview <strong>of</strong> the<br />
NDDOT.<br />
NDDOT has two revolving loan funds for rail assistance – Local <strong>Rail</strong> Freight Assistance<br />
(LRFA) and Freight <strong>Rail</strong> Improvement Program (FRIP). LRFA uses funds originally<br />
provided by the Federal <strong>Rail</strong>road Administration (FRA). The money retains its federal<br />
identity and LRFA projects require FRA approval. FRIP uses state money derived from<br />
interest on repaid loans. FRIP generally mirrors LRFA in intent and application, but<br />
projects do not require FRA approval.<br />
The Grade Crossing Safety Program includes the following components: support for<br />
Operation Lifesaver, signalization and signal upgrades, resurfacing <strong>of</strong> crossings, and<br />
crossing closures. In limited use, some <strong>of</strong> the funds may contribute to grade separations.<br />
Perspectives <strong>of</strong> Metropolitan <strong>Plan</strong>ning Organizations<br />
Robert Bright—Executive Director <strong>of</strong> FM MetroCog, discussed relationships between<br />
the MPOs and state agencies, quiet zones, and access to intermodal facilities. Fargo-<br />
Moorhead is planning a quiet zone that would encompass 20 crossings and greatly reduce<br />
train horn noise in the metropolitan area. Access to intermodal facilities is a key to<br />
regional growth and is very important for the Fargo–Moorhead area MPOs. Fifty percent<br />
<strong>of</strong> trade in the region consists <strong>of</strong> exports. Shippers have expressed concerns about<br />
intermodal access and difficulty in getting and shipping containers – “how can we get the<br />
trains to stop?” Improved access, in part, depends upon the return-empty policies <strong>of</strong><br />
steamship companies. Because <strong>of</strong> their desires for fast container cycle times, steamship<br />
companies are <strong>of</strong>ten reluctant to have their empty containers stopped for reloading at an<br />
interior point. However, identity preservation is very important to buyers and sellers in<br />
international trade. In particular, genetically modified and organic crops need containers<br />
for identity preservation. The empty-return policy isn’t the only obstacle to improved<br />
access. Steamship capacity is also an issue—e.g., how to secure space for additional<br />
containers on-board already-full steamships.<br />
Earl Haugen—Executive Director <strong>of</strong> the Grand Forks-East Grand Forks MPO—<br />
discussed grade-crossing issues, including the movement <strong>of</strong> highway traffic through<br />
crossings, and the long-range planning requirements <strong>of</strong> MPOs. MPOs must engage in<br />
long-range planning, with at least a 20-year time frame. In comparison, the time line for<br />
most transportation projects is much shorter than that; the TIP, for example, extends only<br />
a few years into the future. Nevertheless, there are many opportunities for multimodal<br />
collaboration and integrating both long range and short term planning.<br />
Many aspects <strong>of</strong> rail-highway interaction are important to MPOs. Blocked-crossing time<br />
is an issue at some crossings. However, grade separations are very expensive and are only<br />
________________________________________________________________________<br />
<strong>North</strong> <strong>Dakota</strong> <strong>State</strong> <strong>Rail</strong> <strong>Plan</strong> 123
practical on the most heavily traveled highways. The GF – EGF MPO is working hard to<br />
identify potential safety issues and educate the public on grade crossings. In evaluating<br />
quiet zones, there is <strong>of</strong>ten a trade<strong>of</strong>f between the infrastructure upgrades to implement<br />
quiet zones and other needed transportation improvements.<br />
A 1996 study was performed <strong>of</strong> a potential intermodal facility in the Grand Forks area.<br />
However, interest has waned since the Grand Forks area experienced the 1997 flood.<br />
Some <strong>of</strong> the champions have moved on. The study concluded that more throughput<br />
would be needed to make the facility successful.<br />
Perspectives <strong>of</strong> District Engineers<br />
Robert Walton— District Engineer, Fargo District, NDDOT—stressed the need to<br />
examine highway interactions with railroads. Cooperation between railroads and district<br />
engineers has been very successful with respect to highway construction projects and<br />
crossing issues. The CPR line at Enderlin is a case in point. A blocked-crossing warning<br />
sign was placed at an intersection near the crossing to keep queues from forming on local<br />
streets.<br />
Other issues and opportunities relate to truck versus railroad movements. In many cases,<br />
it is better for highways if certain traffic moves over rail lines, especially heavy freight<br />
and very high/wide loads. Wind towers are an example. Vertical and lateral clearance is<br />
an issue. If the railroads cannot transport products such as wind towers, they must move<br />
via highways. Because <strong>of</strong> Interstate highway clearance restrictions, some <strong>of</strong> these<br />
shipments may shift to state highways. Similarly, heavy trucks may use state highways to<br />
avoid Interstate weight limits or special permits.<br />
A key area <strong>of</strong> interaction is the updating and negotiation <strong>of</strong> maintenance agreements<br />
between railroads and NDDOT. An example is 10 th Street in Fargo, which has been<br />
moved onto the state highway system. Agreements with railroads regarding crossings and<br />
bridges are out <strong>of</strong> date. There is uncertainty about who has maintenance responsibilities.<br />
Similar maintenance responsibility issues should be resolved with respect to crossing<br />
deterioration and rail bridge painting.<br />
Bungalow slopes are another issue. Some are potentially in violation <strong>of</strong> clear zone rules.<br />
In some cases, the slopes are too steep—e.g., 8:1 instead <strong>of</strong> 2:1. In these cases, who is<br />
liable if a car leaves the road? (The railroads have indicated they are willing to work<br />
with NDDOT to construct the slopes to the desired ratio).<br />
Les Noehre—District Engineer, Grand Forks District, NDDOT—emphasized the need<br />
for safety at grade crossings. Moreover, there is a need for increased communication<br />
between stakeholders regarding changes to the railroad system that impact highways—for<br />
example, the location <strong>of</strong> bean crushing plants. Another example is the construction <strong>of</strong> a<br />
large coal transload facility at Ardoch by American Crystal Sugar Company. More<br />
advance notice is helpful so that state and local agencies can plan highway adjustments.<br />
Communication between district engineers, railroads, and private companies is<br />
________________________________________________________________________<br />
<strong>North</strong> <strong>Dakota</strong> <strong>State</strong> <strong>Rail</strong> <strong>Plan</strong> 124
imperative. The main problem has been lack <strong>of</strong> communication by private companies,<br />
which have not communicated with NDDOT regarding potential expansions<br />
Jody Martinson—representing the Detroit Lakes District <strong>of</strong> MNDOT—stressed safety<br />
and improved communication among all levels <strong>of</strong> government and railroads. In the<br />
Detroit Lakes District, $500,000 per year is spent on improving safety at rail-highway<br />
grade crossings. This is a major emphasis in the district. BNSF <strong>Rail</strong>way and the Detroit<br />
Lakes District are cooperating on the realignment <strong>of</strong> Highway 10, which will result in<br />
BNSF moving its tracks north. In general, there is a need for increased communication<br />
among agencies, railroads, and industry.<br />
Lynn Eaton—District Engineer, Bemidji District, MNDOT—discussed the potential<br />
benefits that could arise from keeping heavy freight traffic on rail lines, including a<br />
reduction in the financial and maintenance burdens <strong>of</strong> county and state highways and<br />
improved safety. <strong>Plan</strong>ning for freight movements is an important part <strong>of</strong> the local area<br />
transportation planning partnerships between MNDOT and county and local<br />
governments. The relationship between transportation and economic development is very<br />
important in local and district planning. Providing year-round highway access to<br />
industries and rail transfer facilities is a key objective. However, the freight modes need<br />
to be better integrated to increase flexibility and options.<br />
Much <strong>of</strong> the truck traffic in the Red River Valley moves back and forth across state<br />
borders. Differences in truck configurations between states may be a problem for the<br />
trucking industry and businesses. However, federal action may be necessary to correct<br />
this situation. The potential exists for “freight ports” to be located at state borders to<br />
facilitate cross-border movements.<br />
Perspectives <strong>of</strong> Regional <strong>Rail</strong>roads<br />
Dan Zink— Director <strong>of</strong> Administration, Red River Valley & Western <strong>Rail</strong>road—<br />
emphasized capital availability as one <strong>of</strong> the key issues facing the <strong>North</strong> <strong>Dakota</strong> rail<br />
system. Will the capital be available to upgrade lines to sustain movements <strong>of</strong> 286,000-lb<br />
cars over the long run? Both <strong>North</strong> <strong>Dakota</strong> and Minnesota loan programs are very good.<br />
In fact, the state programs are more useful than the national RRIF program, which is<br />
targeted towards very large loans. The NDDOT revolving loan program is essential to<br />
<strong>North</strong> <strong>Dakota</strong>. Because it is a loan program, it provides discipline in investment.<br />
Preserving the integrity <strong>of</strong> the program is essential to the availability <strong>of</strong> capital in the<br />
future.<br />
Grade crossings and related safety issues are a priority for the railroads. Crossing closures<br />
should be examined as a potential option. (Jack Olson <strong>of</strong> the NDDOT described the<br />
existence <strong>of</strong> a rail crossing closure incentive program.) The future <strong>of</strong> the railroad system<br />
in not completely clear. Some shrinkage in the current railroad network should be<br />
expected. The viability <strong>of</strong> intermodal facilities and shipment options is a key issue.<br />
Larry Jamieson— <strong>North</strong>ern Plains <strong>Rail</strong>road —stressed the importance <strong>of</strong> working with<br />
both <strong>North</strong> <strong>Dakota</strong> and Minnesota, regional railroads, Class I railroads, and the FRA to<br />
________________________________________________________________________<br />
<strong>North</strong> <strong>Dakota</strong> <strong>State</strong> <strong>Rail</strong> <strong>Plan</strong> 125
upgrade tracks and bridges to accommodate the 286,000-lb cars that are in high demand<br />
due to expansions and increased business. Service can be improved by expanding yard<br />
tracks at connection points, or putting in additional sidings to facilitate quicker turn times<br />
and avoid congestion and delay between the Class Is and short lines. Increased public<br />
education is needed concerning crossing safety procedures and the consequences <strong>of</strong><br />
trespassing on railroad property. These educational efforts should include farmers and<br />
hunters, and integrate training with public meetings.<br />
Perspectives <strong>of</strong> Class I <strong>Rail</strong>roads<br />
Brian Sweeney— Legislative Counsel <strong>of</strong> BNSF <strong>Rail</strong>way—noted that BNSF has made<br />
substantial investments to increase railroad capacity and service in the nation and region.<br />
Over the last three years, BNSF has invested $430 million in Minnesota and $261 million<br />
in <strong>North</strong> <strong>Dakota</strong>, and has made substantial investments in grain railcars. Technological<br />
improvements have also enhanced railroad capacity and efficiency. For example,<br />
remotely-controlled switching operations <strong>of</strong>fer potential savings. However, they also<br />
pose labor-related issues which must be resolved.<br />
It is important to include railroad infrastructure considerations and freight access in<br />
metropolitan and local land-use plans. Improved local planning can help reduce potential<br />
conflicts. For example, zoning that allows land development (especially residential)<br />
adjacent to tracks may lead to future noise issues in the community. Crossing closures<br />
can help safety and noise problems. However, they can be politically controversial.<br />
Restrictions on operating speeds by states or localities may actually worsen problems<br />
such as blocked-crossing time. Highway access to intermodal facilities is very important.<br />
Although rumors have surfaced about the future <strong>of</strong> the Dilworth facility, BNSF <strong>Rail</strong>way<br />
has not announced plans to close, relocate, or demote the facility.<br />
<strong>Rail</strong>roads need assistance from stakeholder groups on legislative efforts to improve safety<br />
and benefit the economy. <strong>Rail</strong>road trespasser laws are one area <strong>of</strong> potential collaboration.<br />
Ed Dahlby— Area Manager for Business Development <strong>of</strong> the Canadian Pacific<br />
<strong>Rail</strong>way-identified the following issues and potential actions:<br />
1. Continued maintenance and upgrades <strong>of</strong> Farm-to-Market roads to facilitate<br />
movements to rail heads.<br />
2. Crossing safety.<br />
A. Enforcement <strong>of</strong> existing laws<br />
B. Additions <strong>of</strong> signals where possible<br />
C. Major highways to have grade separations<br />
D. New technological developments for grade crossing safety (GPS warning<br />
system, solar powered advanced warning devices, <strong>North</strong> Star<br />
Communication warning system, etc.)<br />
E. Don’t pass laws that add burdens to railroads’ operations or costs<br />
________________________________________________________________________<br />
<strong>North</strong> <strong>Dakota</strong> <strong>State</strong> <strong>Rail</strong> <strong>Plan</strong> 126
3. Short line issues.<br />
A. Need to upgrade to 286,000-lb. capacity<br />
B. Upgrade with heavier rail<br />
C. Bridge work needed<br />
D. Crossing upgrades<br />
4. Transload facilities needed.<br />
A. Agricultural Products (identity preservation)<br />
B. Niche market opportunities<br />
C. Facilities at Ports for transfer <strong>of</strong> goods from railcar to ocean container<br />
D. Export and Import marketing strategy<br />
E. Free Trade (duty free) Zones for warehousing products until delivery<br />
5. Tax incentives, grants or low interest loans for companies to install rail as their major<br />
mode <strong>of</strong> freight transportation.<br />
6. No conversions <strong>of</strong> farm crossings to crossings into developments without authority<br />
from the <strong>State</strong> or <strong>Rail</strong>road (Smart Growth).<br />
________________________________________________________________________<br />
<strong>North</strong> <strong>Dakota</strong> <strong>State</strong> <strong>Rail</strong> <strong>Plan</strong> 127
________________________________________________________________________<br />
<strong>North</strong> <strong>Dakota</strong> <strong>State</strong> <strong>Rail</strong> <strong>Plan</strong> 128
APPENDIX E<br />
BENEFIT COST ANALYSIS<br />
________________________________________________________________________<br />
<strong>North</strong> <strong>Dakota</strong> <strong>State</strong> <strong>Rail</strong> <strong>Plan</strong> 129
________________________________________________________________________<br />
<strong>North</strong> <strong>Dakota</strong> <strong>State</strong> <strong>Rail</strong> <strong>Plan</strong> 130
Benefit Cost Analysis Criteria<br />
Introduction<br />
In benefit-cost analysis <strong>of</strong> rail rehabilitation projects, the state compares criteria under<br />
two scenarios: a base case, or null alternative, in which the state takes no action, and a<br />
project case in which the state makes investments or takes other actions to affect the<br />
outcome <strong>of</strong> a light-density line. The base case usually describes one <strong>of</strong> two future states –<br />
continued operation <strong>of</strong> a rail line (usually with diminishing service) or abandonment.<br />
Benefits are estimated by comparing future conditions in the base case (without an<br />
investment) to future conditions in the project case (with an investment). The base case is<br />
also referred to as the null alternative, indicating that no capital investment occurs.<br />
Under Base Case 1, the primary efficiency benefits are cost savings to rail operators and<br />
safety benefits from improved track conditions. If the investment decision impacts the<br />
distribution <strong>of</strong> traffic between railroads and trucks, highway costs are also considered—<br />
e.g., pavement resurfacing and maintenance cost savings as a result <strong>of</strong> keeping heavy<br />
freight traffic on rail lines. Under Base Case 2, the primary efficiency benefits are: (1)<br />
shipper cost savings, (2) railroad income gains, (3) shipper pr<strong>of</strong>it on new output produced<br />
as a result <strong>of</strong> the investment, and (4) highway cost savings.<br />
Shipper and railroad benefits are referred to as primary efficiency benefits, because they<br />
result directly from an investment. However, transportation efficiency benefits also<br />
include highway costs savings as a result <strong>of</strong> traffic shifts among modes.<br />
Base vs. Incremental Traffic<br />
In benefit-cost analysis, base traffic is the number <strong>of</strong> carloads, containers, and tons that<br />
would be shipped under the null and project alternatives, by any mode. Incremental<br />
traffic is the amount <strong>of</strong> traffic that would be shipped under the project alternative (with<br />
the investment), but would not be shipped under the null alternative (without the<br />
investment).<br />
Incremental traffic is the result <strong>of</strong> new or increased production. However, it does not<br />
include shifts in traffic among modes, or transfers within the local economy. Incremental<br />
production may result from various business decisions. For example, a new industry may<br />
open that would not have located in the state without the rail improvement. A more<br />
typical case is one in which a business increases its output because the rail improvement<br />
has reduced the cost <strong>of</strong> transportation or improved the level <strong>of</strong> transportation services.<br />
Incremental traffic may consist <strong>of</strong> traffic retained on the rail line by preventing an<br />
abandonment that would reduce shipper output or result in business closures. The latter<br />
result is an extreme case. More typically, businesses may reduce output and quantity<br />
shipped by truck after abandonment because <strong>of</strong> higher truck rates and reduced shipping<br />
capacity.<br />
________________________________________________________________________<br />
<strong>North</strong> <strong>Dakota</strong> <strong>State</strong> <strong>Rail</strong> <strong>Plan</strong> 131
In many cases, incremental traffic will be zero, even if shipper output levels change in the<br />
base or project cases. The change in a shipper’s output or volume may be the result <strong>of</strong><br />
local transfers because the business has become less competitive locally. Such transfers<br />
<strong>of</strong>ten occur among grain elevators. Increased crop production in a region rarely results<br />
from isolated railroad investments. An increase or decrease in the volume handled by one<br />
grain shipper may be <strong>of</strong>fset by corresponding changes in the volume handled by nearby<br />
elevators. However, if a railroad investment stimulates increased crop production in the<br />
area, then this new production should be considered as incremental traffic.<br />
Base Case <strong>of</strong> Continued Operation<br />
Under continued operation, railroad cost savings are primarily the result <strong>of</strong> faster speed,<br />
increased car payload, and reduced track maintenance cost. Faster speeds reduce crew,<br />
car, locomotive, and other time-related train costs for all classes <strong>of</strong> traffic: origin,<br />
destination, and through. If heavier rail cars are used after an investment, then fewer carmiles,<br />
train-miles, and locomotive-miles will be needed to move the same net tons over<br />
the line. However, heavier cars may result in higher track maintenance costs, which must<br />
be reflected in the net calculation.<br />
Normal track maintenance cost may drop after rehabilitation because <strong>of</strong> the elimination<br />
<strong>of</strong> deferred maintenance. Deferred maintenance is an economic cost that must be<br />
considered, even though the railroad is not expending funds for this maintenance.<br />
Deferred maintenance is a cost that eventually must be covered if a line is to remain in<br />
service. Track rehabilitation projects that eliminate deferred maintenance usually result in<br />
lower spot maintenance and inspection costs.<br />
Abandonment Base Case<br />
Shipper Cost Savings<br />
Changes in post-abandonment shipping costs reflect: (1) trucking costs from stations on<br />
the abandoned branch line to a nearby rail line (e.g., a mainline), and (2) transfer or<br />
transloading costs at the mainline facility. If the rail rate from the mainline station to<br />
common destinations is less than the rail rate from branch-line stations, these savings<br />
may partly or wholly <strong>of</strong>fset the increased shipping cost.<br />
<strong>Rail</strong>road Income Gains<br />
Net railroad income is a transportation efficiency gain attributable to the reduced<br />
operating and maintenance cost <strong>of</strong> a line after an investment is made. When the base case<br />
is abandonment, the net income derived from a line will be lost without public<br />
investment. The retained income may help preserve railroad jobs in <strong>North</strong> <strong>Dakota</strong> and<br />
generate economic benefits. In the long run, public investment provides economic<br />
incentives and cash flows that may induce railroads to reinvest in branch lines, perform<br />
long-run maintenance, or increase service levels. If trucker pr<strong>of</strong>its will be lost because <strong>of</strong><br />
________________________________________________________________________<br />
<strong>North</strong> <strong>Dakota</strong> <strong>State</strong> <strong>Rail</strong> <strong>Plan</strong> 132
a railroad investment, these losses must be considered as <strong>of</strong>fsets. However, <strong>of</strong>fsets are not<br />
applicable to private trucking or custom hauling in farmer-owned vehicles.<br />
Shipper Pr<strong>of</strong>it on New Production<br />
In some cases, shipper gains or pr<strong>of</strong>its from incremental production may be the primary<br />
benefits <strong>of</strong> rehabilitation. Pr<strong>of</strong>its are usually proprietary information. Businesses may be<br />
reluctant to provide this information, even though it can be treated as confidential by the<br />
NDDOT.<br />
Impacts on Through Traffic<br />
The segment being analyzed may be part <strong>of</strong> a through route between two terminals or<br />
gateways. If the segment is abandoned, the through traffic must move over a longer,<br />
circuitous route. In this case, the primary impacts <strong>of</strong> abandonment are the incremental<br />
car, locomotive, and train costs incurred by the through traffic, which must circumvent<br />
the abandoned segment. A similar situation can result from line bifurcation—in which the<br />
middle segment <strong>of</strong> a local line is abandoned.<br />
Highway Impacts<br />
If an investment will change the distribution <strong>of</strong> traffic between railroads and trucks, then<br />
highway impacts are analyzed. The highway impact procedure is based on functions<br />
developed by the American Association <strong>of</strong> <strong>State</strong> Highway and <strong>Transportation</strong> Officials<br />
(AASHTO). The highway model includes many <strong>of</strong> the same equations and parameters<br />
used in pavement design. However, the model is used to estimate the incremental<br />
resurfacing costs <strong>of</strong> pavements, rather than the actual construction costs. Additional truck<br />
revenues received by highway agencies are used to <strong>of</strong>fset projected cost increases.<br />
Highway Impact Procedure<br />
A highway impact analysis is required when the null alternative is abandonment. Two <strong>of</strong><br />
the initial steps in a highway impact analysis are identification <strong>of</strong> post-abandonment truck<br />
routes from branch-line stations to railroad main lines and truck configurations used to<br />
transport diverted traffic.<br />
The preferred truck type will depend on the commodity, local highway designs and<br />
conditions, and the economics <strong>of</strong> different truck types. In some cases, more than one<br />
truck configuration may be used.<br />
The highway impact procedure is based on an analytical function developed by the<br />
American Association <strong>of</strong> <strong>State</strong> Highway and <strong>Transportation</strong> Officials (AASHTO), which<br />
was later modified by FHWA for use in the Highway Performance Monitoring System<br />
(HPMS). FHWA and many states use HPMS to estimate highway rehabilitation and<br />
restoration needs.<br />
________________________________________________________________________<br />
<strong>North</strong> <strong>Dakota</strong> <strong>State</strong> <strong>Rail</strong> <strong>Plan</strong> 133
The highway model includes many <strong>of</strong> the same equations and parameters used in<br />
pavement design. However, the application is reversed. In pavement design, the question<br />
is: given a projected truck traffic level, what structural design is needed to ensure<br />
pavement performance for the desired period (e.g., 15 years). In pavement deterioration<br />
analysis, the question is: given an existing highway with a known structural rating, how<br />
will additional truck traffic – beyond the level expected in the design stage – affect the<br />
performance period, and thus affect the annualized resurfacing and reconstruction costs?<br />
The effects <strong>of</strong> different truck axle configurations on pavements are estimated by<br />
converting all axle loads to equivalent single-axle loads or ESALs. An ESAL represents<br />
the equivalent pavement damage that would be caused by the passage <strong>of</strong> an 18,000-pound<br />
single axle over a pavement section. For example, an axle with an ESAL factor <strong>of</strong> 1.2<br />
inflicts 1.2 times the damage <strong>of</strong> a single 18,000-pound axle. The ESAL factor <strong>of</strong> an axle<br />
group will depend on the type <strong>of</strong> axle (single, tandem, or tridem), the load on the axle in<br />
thousands <strong>of</strong> pounds (kilo-pounds or kips), the type <strong>of</strong> pavement section (flexible or<br />
rigid), and the terminal serviceability rating <strong>of</strong> the pavement (pt). 60<br />
Figure E.1 illustrates the impacts <strong>of</strong> single<br />
axle loads on a medium strength flexible<br />
pavement with a terminal serviceability <strong>of</strong><br />
2.5, which is typical <strong>of</strong> a rural principal<br />
arterial highway. The chart illustrates<br />
several relationships. First, a 16,000pound<br />
single-axle load followed by a<br />
20,000-pound single-axle load generates a<br />
total <strong>of</strong> 2.115 ESALs as compared to two<br />
ESALs for the passage <strong>of</strong> two 18,000pound<br />
single axles. In essence, load<br />
distribution among axles is important in<br />
pavement impact analysis. Second, an<br />
increase in a single-axle load from 18,000<br />
to 22,000 pounds more than doubles the<br />
pavement impact. In general, the ESAL<br />
factor for a given type <strong>of</strong> axle increases<br />
with the fourth power <strong>of</strong> the axle load.<br />
Consequently, even modest overloads<br />
(e.g., 22,000 pound on a single axle) can<br />
significantly increase pavement<br />
damage. 61<br />
60<br />
The terminal serviceability rating is the value at which a pavement is expected to be resurfaced or<br />
reconstructed (po).<br />
61<br />
<strong>Transportation</strong> Research Board (TRB), Truck Weight Limits, Special Report 225, 1990.<br />
________________________________________________________________________<br />
<strong>North</strong> <strong>Dakota</strong> <strong>State</strong> <strong>Rail</strong> <strong>Plan</strong> 134<br />
3<br />
2.5<br />
2<br />
1.5<br />
1<br />
0.5<br />
0<br />
0.645<br />
1<br />
1.47<br />
2.09<br />
2.89<br />
16 18 20 22 24<br />
Single Axle Load in Thousand Pounds<br />
Figure E.1. Relative Pavement Impacts <strong>of</strong><br />
Single-Axle Loads on a Flexible Pavement –<br />
Source: Computed from AASHTO Axle Load<br />
Equivalency Formulas [Values Reflect Terminal<br />
Serviceability <strong>of</strong> 2.5]
Figure E.2 illustrates the impacts <strong>of</strong> a<br />
tandem axle set on the same type <strong>of</strong><br />
pavement. As the chart shows, 34,000<br />
pounds on a tandem axle generates only<br />
1.11 times the impact <strong>of</strong> 18,000 pounds<br />
on a single axle.<br />
AASHTO=s ESAL factors are<br />
conservative estimates <strong>of</strong> pavement<br />
damage. The factors are based on road<br />
test data from the 1960s, which reflect the<br />
use <strong>of</strong> dual, bias (ply) tires with pressures<br />
<strong>of</strong> 75 to 80 psi. Today, most commercial<br />
trucks use radial tires inflated to 100 psi<br />
or greater. In some cases, Asuper single@<br />
tires are used instead <strong>of</strong> dual tires.<br />
Research suggests that increasing the tire<br />
pressure from 75 to 100 psi increases the<br />
pavement impact <strong>of</strong> an 18,000 pound<br />
single-axle load by approximately<br />
16 percent. 62 Research also suggests that<br />
using single tires instead <strong>of</strong> dual tires can increase the pavement impact <strong>of</strong> an 18,000pound<br />
single axle load by 31 to 132 percent. 63 In short, the use <strong>of</strong> super-single tires and<br />
high inflation pressures result in much greater reductions in pavement life than AASHTO<br />
ESAL factors suggest. 64<br />
The highway impact model and computational process are described in a technical<br />
appendix to Chapter 5 <strong>of</strong> Part 1. Two intermediate outputs are especially important to an<br />
impact analysis:<br />
1. the unit costs per ESAL-mile <strong>of</strong> travel<br />
2. the incremental ESAL-miles <strong>of</strong> travel over impacted highway sections. In the<br />
final step <strong>of</strong> the process, the annual avoidable cost <strong>of</strong> each impacted highway<br />
section is computed by multiplying the incremental ESAL-miles by the<br />
appropriate unit cost.<br />
62 <strong>Transportation</strong> Research Board (TRB), Truck Weight Limits, Special Report 225, 1990.<br />
63 Ibid. The range <strong>of</strong> impacts depends on the Awander@ or lateral movement <strong>of</strong> truck tires. Wander has a<br />
positive effect on pavement life for a given axle load and tire because the load is not concentrated on a<br />
linear path or area <strong>of</strong> pavement. The 31 percent increase corresponds to a wander standard deviation <strong>of</strong> 8<br />
inches, while the 132 percent increase corresponds to zero wander.<br />
64 The effects <strong>of</strong> modern tire pressures on pavement lives are taken into account during a rail line analysis<br />
through use <strong>of</strong> an adjustment factor. However, the effects <strong>of</strong> single tires are not considered.<br />
________________________________________________________________________<br />
<strong>North</strong> <strong>Dakota</strong> <strong>State</strong> <strong>Rail</strong> <strong>Plan</strong> 135<br />
1.4<br />
1.2<br />
1<br />
0.8<br />
0.6<br />
0.4<br />
0.2<br />
0<br />
0.534<br />
0.695<br />
0.887<br />
1.11<br />
1.38<br />
28 30 32 34 36<br />
Tandem Axle Load in Thousand Pounds<br />
Figure E.2. Relative Pavement Impacts <strong>of</strong><br />
Tandem-Axle Loads on a Flexible Pavement –<br />
Source: Computed from AASHTO Axle Load<br />
Equivalency Formulas [Values Reflect Terminal<br />
Serviceability <strong>of</strong> 2.5]
________________________________________________________________________<br />
<strong>North</strong> <strong>Dakota</strong> <strong>State</strong> <strong>Rail</strong> <strong>Plan</strong> 136
APPENDIX F<br />
NDDOT LOCAL RAIL FREIGHT ASSISTANCE (LRFA)<br />
APPLICATION INSTRUCTIONS<br />
________________________________________________________________________<br />
<strong>North</strong> <strong>Dakota</strong> <strong>State</strong> <strong>Rail</strong> <strong>Plan</strong> 137
________________________________________________________________________<br />
<strong>North</strong> <strong>Dakota</strong> <strong>State</strong> <strong>Rail</strong> <strong>Plan</strong> 138
SECTION 1.0 – INTRODUCTION<br />
The <strong>North</strong> <strong>Dakota</strong> <strong>Department</strong> <strong>of</strong> <strong>Transportation</strong> (NDDOT) has administration and<br />
oversight responsibility for the <strong>North</strong> <strong>Dakota</strong> Freight <strong>Rail</strong> Improvement Program (FRIP)<br />
and Local <strong>Rail</strong> Freight Assistance (LRFA) loan funds.<br />
This document describes the rail loan fund application process. It also describes the<br />
methods used by NDDOT to evaluate rail loan projects. There is in addition a description<br />
<strong>of</strong> several obligations incurred by applicants when assistance is accepted.<br />
Potential applicants should review this document before submitting project proposals.<br />
SECTION 2.0 – ELIGIBLE APPLICANTS<br />
Eligible applicants include cities, counties, railroads, or other current or potential users <strong>of</strong><br />
freight railroad service.<br />
SECTION 3.0 – ELIGIBLE PROJECTS<br />
The NDDOT rail loan funds have limited resources. They are intended to be used<br />
primarily to upgrade and enhance infrastructure to improve rail service in ND through aid<br />
to short line railroads and, in some cases, shippers or other rail stakeholders.<br />
Generally, an eligible project is one in which the rail line related to the project has carried<br />
less than 5 million gross ton miles <strong>of</strong> freight per mile in the year previous to the year <strong>of</strong><br />
application and which accomplishes any <strong>of</strong> the following: rehabilitates a segment <strong>of</strong> rail<br />
line, results in economic development, improves transportation efficiency, promotes<br />
safety, promotes the viability <strong>of</strong> the statewide system <strong>of</strong> freight rail service, assists<br />
intermodal freight movement, or provides industry access to the national railroad system.<br />
The Director may waive the 5 million gross ton miles requirement if it is determined that<br />
a significant public interest in the project exists.<br />
SECTION 4.0 – APPLICATION PROCESS<br />
4.1 SUBMISSION<br />
Project requests must be received by NDDOT as follows:<br />
Annual Submission – December 1: Annual submission is for rail projects that<br />
are planned and developed in the normal course <strong>of</strong> business. They include<br />
infrastructure projects, such as rail relay or tie and ballast, and economic<br />
development type projects, such as loading spurs.<br />
Reserve Consideration – June 1: Reserve consideration is for projects that<br />
support economic competitiveness and that have been identified subsequent to<br />
the annual submission date. Reserve consideration is for projects that are<br />
unforeseen in the normal course <strong>of</strong> business. It is not an alternative date for<br />
annual submission projects.<br />
Economic Competitiveness projects identified after June 1, but before<br />
December 1, will be included at the next annual submission.<br />
________________________________________________________________________<br />
<strong>North</strong> <strong>Dakota</strong> <strong>State</strong> <strong>Rail</strong> <strong>Plan</strong> 139
Project proposals must be submitted in writing to NDDOT, in either hard copy or<br />
electronic format. Address hard copy to:<br />
NDDOT<br />
ATTN: <strong>Rail</strong> <strong>Plan</strong>ner<br />
608 East Boulevard Avenue<br />
Bismarck, ND 58505-0700<br />
Send electronic submissions to: rjohnsto@nd.gov.<br />
Proposals must provide the information requested in 4.1.1 through 4.1.6 and 4.2.1 <strong>of</strong><br />
this document.<br />
4.1.1 Identification <strong>of</strong> Parties and Projects<br />
(a) Applicant name, address, phone number, and point <strong>of</strong> contact (POC).<br />
Provide name, phone number, and email address for POC.<br />
(b) Name, address, phone number, and POC for the railroad party to the<br />
project. Provide name, phone number, and email address for POC.<br />
(c) Name, address, phone number, and POC <strong>of</strong> any shipper party to the<br />
project. Provide name, phone number, and email address for POC.<br />
(d) A narrative addressing the purpose, need and public benefits <strong>of</strong> the<br />
project. This might include, as applicable: capacity, safety and security,<br />
system linkage, system deficiencies, modal interrelationships, social<br />
demands, or economic development. This section should also describe<br />
and justify any negative impacts thought to be associated with the project.<br />
(e) A description <strong>of</strong> the proposed project, including:<br />
(1) Physical measurements (Linear, area, etc.).<br />
(2) Physical location (Address, mileposts, street crossings, etc.).<br />
(3) Major material specifications (<strong>Rail</strong> weight, ballast type, tie grade<br />
and type, etc.).<br />
(4) Map/sketch <strong>of</strong> project design and location.<br />
(5) Such other information as deemed useful by the Applicant to<br />
support and define the project concept and purpose.<br />
(6) Number <strong>of</strong> shippers served and/or affected, and commodities<br />
handled.<br />
(f) A narrative stating the alternative(s) to be pursued should assistance not be<br />
awarded and the applicable consequences there<strong>of</strong> (postpone or abandon<br />
project, reduce service by x amount, forgo x amount <strong>of</strong> revenue or cost<br />
________________________________________________________________________<br />
<strong>North</strong> <strong>Dakota</strong> <strong>State</strong> <strong>Rail</strong> <strong>Plan</strong> 140
savings, etc.). Data must be objective and quantified (numbers, dates,<br />
quantities, dollar amounts, etc.).<br />
4.1.2 Estimated Project Cost and Work Method<br />
(a) A line item breakout <strong>of</strong> estimated direct project costs at least to the level<br />
<strong>of</strong>:<br />
(1) Materials<br />
(2) Equipment<br />
(3) Labor<br />
(4) Force account work<br />
(5) Contract work<br />
(6) Total project cost<br />
(b) A description <strong>of</strong> the method or methods proposed for accomplishing major<br />
project tasks. (e.g., tie replacement by force account, surfacing by<br />
contractor, etc).<br />
4.1.3 Proposed Project Financing<br />
(a) <strong>State</strong> the dollar amount <strong>of</strong> assistance requested.<br />
(b) Identify the source <strong>of</strong> all anticipated non-state assistance.<br />
4.1.4 Intended Benefit and Cost Items<br />
Provide a list or description <strong>of</strong> the type or category <strong>of</strong> benefits and costs<br />
assumed by applicant to be associated with this project.<br />
4.1.5 Intended Environmental and Economic Enhancement Items<br />
Provide a list or description <strong>of</strong> any environmental or economic<br />
enhancement outcomes projected by the Applicant to result from the<br />
project.<br />
4.1.6 Public Involvement Process<br />
NDDOT shall solicit public input for each project that is accepted.<br />
NDDOT will place a legal notice in the <strong>of</strong>ficial newspaper(s) <strong>of</strong> record for<br />
the county or counties in which the proposed project is to be done, giving<br />
notice <strong>of</strong> opportunity to request a public hearing and/or submit comments<br />
on a proposed amendment to the <strong>State</strong> <strong>Rail</strong> <strong>Plan</strong>. The legal notice will<br />
state the reason for the proposed amendment (i.e., rail rehabilitation or<br />
other project), a point <strong>of</strong> contact for response, and the deadline for<br />
response.<br />
If a public hearing is held, all comments will be recorded verbatim and<br />
included in the application.<br />
________________________________________________________________________<br />
<strong>North</strong> <strong>Dakota</strong> <strong>State</strong> <strong>Rail</strong> <strong>Plan</strong> 141
4.2 APPLICATION REVIEW/CONFERENCE<br />
NDDOT staff will review all project applications. If the reviews indicate the need for<br />
more information, conferences with Applicants and any other significant entities may be<br />
needed. Conferences, if needed, are usually done by phone.<br />
4.2.1 Data for Benefit-Cost Analysis<br />
(a) The single most influential criterion in determining project qualification<br />
and rank is the Benefit-Cost Ratio (BCR). NDDOT may employ the<br />
services <strong>of</strong> others in analyzing and calculating the BCR.<br />
(b) The following list is representative <strong>of</strong> the type <strong>of</strong> data required for<br />
benefit/cost analysis:<br />
(1) What is the expected change (if any), expressed in dollars, in these<br />
areas from accomplishing the project.<br />
● Maintenance <strong>of</strong> Way (MOW) costs<br />
● Locomotive costs<br />
● Fuel costs<br />
● Freight rate/unit<br />
● Number <strong>of</strong> carloads<br />
● Lading handling costs<br />
● Car hire and/or car investment costs<br />
● Maintenance <strong>of</strong> Equipment (MOE) costs<br />
● Train crew costs<br />
● Product/lading shrinkage<br />
● Derailment Costs<br />
(2) Other statistical information pertinent to the analysis.<br />
● Project impact on market penetration (intermodal, customer<br />
territory, service frequency).<br />
● Average car capacity in same units used in freight rates<br />
above<br />
● Net liquidation value <strong>of</strong> in-place track assets.<br />
4.3 PROJECT QUALIFICATION AND RANKING<br />
4.3.1 The data required for project qualification and ranking shall be submitted<br />
to NDDOT by the Applicant.<br />
4.3.2 All project proposals will be reviewed for qualification. Qualified<br />
proposals will be scored and ranked for funding priority. (See Section 8<br />
for qualification and ranking criteria and scoring procedures.) Applicants<br />
will be informed <strong>of</strong> their project proposal's ranking.<br />
4.4 EMERGENCY ASSISTANCE<br />
The department may, at its sole discretion and upon application by an eligible applicant,<br />
provide assistance from the rail loan funds on a non-competitive basis at any time for a<br />
project addressing a (Government) declared emergency situation. The project must meet<br />
________________________________________________________________________<br />
<strong>North</strong> <strong>Dakota</strong> <strong>State</strong> <strong>Rail</strong> <strong>Plan</strong> 142
eligibility requirements. An emergency project shall deal with failure <strong>of</strong> significant<br />
infrastructure essential to operation <strong>of</strong> rail freight service, such as bridge failure, major<br />
washout, destruction by fire, and the like. Insurance proceeds must first be dedicated to<br />
the project.<br />
SECTION 5.0 – ASSISTANCE AWARD PROCESS<br />
5.1 APPLICANT ACCEPTANCE OF AWARD<br />
The Applicant shall accept or reject any <strong>of</strong>fer <strong>of</strong> assistance within 10 working days <strong>of</strong> the<br />
date <strong>of</strong> <strong>of</strong>fer.<br />
5.2 AGREEMENT EXECUTION<br />
A loan agreement between NDDOT and the Applicant must be executed within 90<br />
calendar days <strong>of</strong> the Applicant’s acceptance <strong>of</strong> an <strong>of</strong>fer <strong>of</strong> loan assistance. Unless<br />
NDDOT otherwise agrees, the <strong>of</strong>fer <strong>of</strong> loan assistance expires and is withdrawn if this<br />
condition is not met.<br />
SECTION 6.0 – ASSISTANCE FORM AND AMOUNT<br />
6.1 POLICIES AFFECTING ASSISTANCE FORM AND AMOUNT<br />
6.1.1 The measure <strong>of</strong> public interest, for program purposes, is determined by<br />
the project's qualification and ranking according to the criteria set forth<br />
under Part II, Section 1.0 herein.<br />
6.1.2 Loan assistance is provided at an interest rate calculated at 1/2 <strong>of</strong> a<br />
prime rate at the Bank <strong>of</strong> <strong>North</strong> <strong>Dakota</strong>, but not less than 3%.<br />
6.1.3 Loan amounts for rehabilitation construction will be 70% <strong>of</strong> estimated<br />
project cost, with the Applicant’s share being 30% <strong>of</strong> estimated project<br />
cost. The Applicant’s share must come from non-state funds. New<br />
construction will be financed on a 50% - 50% basis.<br />
6.1.4 The loan term is 10 years, with payment deferred the first two years.<br />
Interest accrues during the deferred period. The loan is repaid in eight<br />
annual installments, beginning the third year <strong>of</strong> the loan. The interest<br />
accrued during the deferred period is due with the first loan payment.<br />
SECTION 7.0 – KEY ASSISTANCE AGREEMENT TERMS<br />
7.1 LIST<br />
7.1.1 The Applicant must agree to maintain the project line at or above FRA<br />
Class 2 Track Safety Standard until the loan is fully repaid. Termination<br />
<strong>of</strong> service will make the full loan amount, plus an amount equal to the<br />
interest rate stated in the agreement applied to the full loan amount from<br />
the effective date <strong>of</strong> the agreement to date <strong>of</strong> termination, immediately<br />
due and payable.<br />
7.1.3 Interest charges begin upon first draw <strong>of</strong> loan funds and are calculated<br />
on a fixed regular schedule.<br />
________________________________________________________________________<br />
<strong>North</strong> <strong>Dakota</strong> <strong>State</strong> <strong>Rail</strong> <strong>Plan</strong> 143
7.1.4 Rehabilitation and construction material and performance specifications<br />
shall conform to American <strong>Rail</strong>way Engineering and Maintenance <strong>of</strong><br />
Way Association (AREMA) standards and practices.<br />
7.1.5 Project costs may not be incurred on any project before an agreement is<br />
fully executed between NDDOT and the Applicant.<br />
7.1.6 If work on the project has not begun within one year <strong>of</strong> the date the loan<br />
agreement was fully executed, the agreement becomes void and the <strong>of</strong>fer<br />
<strong>of</strong> assistance is withdrawn, unless NDDOT agrees to extend the term. If<br />
the agreement becomes void, the Applicant may re-apply for assistance.<br />
The application will be considered a new submission, and will be<br />
evaluated as such.<br />
7.1.7 Competitive bidding must be used for contract work on loan projects.<br />
7.1.8 The progress billing method will be permitted with 10% retainage by<br />
NDDOT. Final billing must include a statement <strong>of</strong> total actual costs and<br />
may be subject to a detailed audit. Final billing must be submitted to<br />
NDDOT within three months after project completion.<br />
7.1.9 The applicant shall, upon any sale or disposition <strong>of</strong> all or any portion <strong>of</strong><br />
the subject line, or the filing <strong>of</strong> an application for abandonment <strong>of</strong> all or<br />
any portion <strong>of</strong> the subject line at any time during the term <strong>of</strong> agreement,<br />
repay to NDDOT the full amount <strong>of</strong> the NDDOT share <strong>of</strong> the cost <strong>of</strong><br />
improvements made to the subject line.<br />
SECTION 8.0 – PROJECT SELECTION<br />
8.1 PROJECT SELECTION POLICIES<br />
8.1.1 Purpose <strong>of</strong> Qualification and Ranking: Proposed projects must generate<br />
improvements in transportation efficiency and may also generate broad<br />
public benefit.<br />
8.1.2 Method <strong>of</strong> Qualification and Ranking: Six criteria are used to evaluate<br />
and rank proposed projects. The rating system generates a point value for<br />
each criterion. The criteria are:<br />
• Benefit-Cost Ratio (BCR)<br />
• Impact on the ND <strong>Rail</strong> System<br />
• <strong>Rail</strong> System Connectivity<br />
• Economic Impact<br />
• Safety and Security<br />
• Community and Environmental Impact<br />
A project must have a primary BCR <strong>of</strong> at least 1.0 to qualify for further<br />
evaluation. Qualified projects are ranked according to total point score.<br />
The rankings are used in determining which applicants receive <strong>of</strong>fers <strong>of</strong><br />
assistance. Offers are made, at the Directors discretion, to applicants in<br />
________________________________________________________________________<br />
<strong>North</strong> <strong>Dakota</strong> <strong>State</strong> <strong>Rail</strong> <strong>Plan</strong> 144
ank order until program resources are no longer until available resources<br />
have been allocated.<br />
8.1.3 Relation <strong>of</strong> Rank to Funding: Project rank is a factor in determining<br />
whether a project is funded and what priority the project has. The ranking<br />
process has no influence on the type <strong>of</strong> assistance <strong>of</strong>fered. All assistance<br />
is will be in the form <strong>of</strong> a low interest loan.<br />
It is possible for a project to be funded outside <strong>of</strong> rank order. If a lower<br />
ranked project may be funded within available resource limits while a<br />
higher ranked project would exceed those limits, the lower ranked project<br />
may be funded if the applicant <strong>of</strong> the higher ranked project is unable or<br />
unwilling to proceed with the project funded with only the remaining<br />
available resources.<br />
If two or more qualified projects end up with the same total score, the<br />
BCR will determine the final ranking.<br />
8.1.4 Directors Authority: On a case by case basis the Director will have the<br />
authority to modify funding limits and/or repayment criteria.<br />
8.2 PROJECT SELECTION CRITERIA<br />
8.2.1 Benefit-Cost Ratio:<br />
(a) Purpose: The purpose <strong>of</strong> the BCR criterion is to afford a measure<br />
<strong>of</strong> the economic soundness <strong>of</strong> an investment <strong>of</strong> public funds in the<br />
project.<br />
(b) Description: The total BCR consists <strong>of</strong> three levels: (1) primary<br />
efficiency benefits, (2) transportation efficiency benefits, including<br />
highway impacts, and (3) total economic benefits. A project must<br />
have a primary BCR <strong>of</strong> 1.0 or greater to qualify for further<br />
evaluation. The total BCR is used in comparing projects that<br />
qualify for further evaluation.<br />
(c) Scoring: The numeric score for the BCR criterion is the total<br />
BCR. To remain consistent with a multi criteria scoring system,<br />
the BCR cannot increase without bound. It is therefore capped at<br />
25. Since a BCR above 25 is a rare occurrence, the cap’s effect on<br />
project score should be minimal.<br />
MAXIMUM OF 25 POINTS<br />
8.2.2 Carloads per Mile:<br />
(a) Purpose: The purpose <strong>of</strong> this criterion is to represent the scale <strong>of</strong><br />
the total project benefits. Traffic density is a proxy for the<br />
strategic significance <strong>of</strong> a line, the likelihood <strong>of</strong> long-run survival<br />
________________________________________________________________________<br />
<strong>North</strong> <strong>Dakota</strong> <strong>State</strong> <strong>Rail</strong> <strong>Plan</strong> 145
<strong>of</strong> the line, and the continuation <strong>of</strong> benefits beyond the analysis<br />
period.<br />
(b) Description: The number <strong>of</strong> carloads per mile is an average <strong>of</strong><br />
carloads from a period <strong>of</strong> three consecutive years. All carloads are<br />
counted, including bridge and overhead traffic. Any bridge or<br />
overhead carloads included in the total shall also be shown<br />
separately. Multi-platform articulated cars are to be treated as<br />
single or multiple cars according to how they are treated in the<br />
tariff or contract under which they move. Carloads from the past<br />
three years and projections for the next two years may be used for<br />
the average, but it must be three consecutive years. Absent valid<br />
projections, traffic for the past three years must be used.<br />
(c) Scoring: Points are awarded on the basis <strong>of</strong> carloads per mile as<br />
shown in the table below. The points awarded increase as the<br />
traffic increases. Points are awarded in this manner to reflect the<br />
lesser impact on the economy <strong>of</strong> very light density lines.<br />
Carloads/Mile<br />
3 Yr. Average<br />
< 12<br />
12 - 20<br />
21 - 35<br />
36 - 80<br />
81 - 120<br />
> 120<br />
MAXIMUM OF 5 POINTS<br />
Points<br />
8.2.3 System Connectivity:<br />
(a) Purpose: The purpose <strong>of</strong> this criterion is to afford a means to<br />
reflect the value a project may present in serving a distinct<br />
system function even though traffic origin or destination<br />
functions may be minimal or absent.<br />
(b) Description: System connectivity is present when the project<br />
specifically provides for the only direct connection <strong>of</strong> two<br />
distinct through route line segments <strong>of</strong> the applicant's system, or<br />
the system's sole interchange connection with another railroad.<br />
(c) Scoring: System connectivity points are awarded as shown<br />
below.<br />
________________________________________________________________________<br />
<strong>North</strong> <strong>Dakota</strong> <strong>State</strong> <strong>Rail</strong> <strong>Plan</strong> 146<br />
0<br />
1<br />
2<br />
3<br />
4<br />
5
Description Score or Range<br />
High Connectivity 3<br />
Moderate Connectivity 2<br />
Low Connectivity 1<br />
Nonexistent 0<br />
MAXIMUM OF 3 POINTS<br />
Score Example <strong>of</strong> Qualifying Project<br />
3 Line improvement that rehabilitates a segment that connects two high<br />
volume branch lines and prevents circuitous routing<br />
2 Line improvement to ensure that a segment <strong>of</strong> track remains continuous<br />
1 Low usage gateway between branch lines<br />
0 Stub Line or Siding<br />
8.2.4 Enhancing <strong>North</strong> <strong>Dakota</strong>’s Economy:<br />
(a) Purpose: The purpose <strong>of</strong> this criterion is to afford a means to<br />
consider aspects <strong>of</strong> the project that <strong>of</strong>fer economic benefits that<br />
may not be captured under either the traditional benefit-cost<br />
analysis or a REMI analysis. A qualifying scenario includes an<br />
exogenous economic impact, that is, an impact not measureable<br />
in the context <strong>of</strong> the usual benefit-cost analysis.<br />
(b) Description: Points are awarded under this criterion on the basis<br />
<strong>of</strong> the department's finding that the project:<br />
(1) Will address an unusual <strong>North</strong> <strong>Dakota</strong> job gain or loss<br />
situation.<br />
(2) Contains an element <strong>of</strong> urgency/timeliness significant to<br />
its ability to deliver long-term benefits.<br />
(3) Improves viability <strong>of</strong> businesses served by the operator.<br />
(4) Improves the attractiveness <strong>of</strong> <strong>North</strong> <strong>Dakota</strong> for new<br />
business.<br />
(5) Serves a developed industrial park (streets, sewer, and<br />
water in place).<br />
(a) Scoring: Enhancing <strong>North</strong> <strong>Dakota</strong>’s economy points are<br />
awarded as follows:<br />
Description Score or Range<br />
High Exogenous Impact 3<br />
Moderate Exogenous Impact 2<br />
Low Exogenous Impact 1<br />
Nonexistent 0<br />
MAXIMUM OF 3 POINTS<br />
________________________________________________________________________<br />
<strong>North</strong> <strong>Dakota</strong> <strong>State</strong> <strong>Rail</strong> <strong>Plan</strong> 147
Score Example <strong>of</strong> Qualifying Project<br />
3 Project that provides rail access to an industrial park, which raises<br />
attractiveness for firms to locate there<br />
2 Project that provides rail access to an industrial park, which may<br />
induce existing firms to expand<br />
1 Project that maintains infrastructure which may lead to firm retention<br />
0 Project that does not have exogenous potential economic impact<br />
8.2.5 Safety and Security:<br />
(a) Purpose: The purpose <strong>of</strong> this criterion is to provide a means to<br />
consider aspects <strong>of</strong> the project that <strong>of</strong>fer unique benefits to<br />
railroad safety or enhance the state’s security. A qualifying<br />
scenario would include a safety or security impact that is not<br />
quantifiable, and therefore not included in the benefit-cost<br />
analysis.<br />
(b) Description: Points are awarded under this criterion on the basis<br />
<strong>of</strong> the department's finding the project will result in:<br />
(1) Reduction in potential derailments.<br />
(2) Reduction <strong>of</strong> hazards to railroad personnel and<br />
contractors.<br />
(3) A shift <strong>of</strong> shipments <strong>of</strong> hazardous materials from the<br />
highway system to the railroad network that would<br />
reduce accident exposure.<br />
(4) Grade crossing safety enhancements.<br />
(5) Increasing the security <strong>of</strong> yards, containers, tank cars, and<br />
other equipment and facilities.<br />
(6) Security enhancements to border crossings, inspection<br />
locations, bridges and potential choke points.<br />
(c) Scoring: Safety and Security points are awarded as follows:<br />
Description Score or Range<br />
High Safety and Security Impact 3<br />
Moderate Safety and Security Impact 2<br />
Low Safety and Security Impact 1<br />
Nonexistent 0<br />
MAXIMUM OF 3 POINTS<br />
________________________________________________________________________<br />
<strong>North</strong> <strong>Dakota</strong> <strong>State</strong> <strong>Rail</strong> <strong>Plan</strong> 148
Score Example <strong>of</strong> Qualifying Project<br />
3 Project that reduces hazmat transportation risks by shifting traffic from highrisk<br />
highway routes, reduces the risks <strong>of</strong> hazmat accidents at grade crossings,<br />
or reduces the risks <strong>of</strong> train derailments involving hazmat cargo<br />
2 Project that generally reduces highway accident risks by shifting freight<br />
traffic from highway routes to rail lines, or, that reduces the risk <strong>of</strong> train<br />
derailments<br />
1 Project that improves the safety and security <strong>of</strong> railroad lines or yards by<br />
eliminating hazards to railroad workers or the public, including reductions in<br />
trespassing<br />
0 Project that does not positively impact safety or security<br />
8.2.6 Environmental and Community Effects:<br />
(a) Purpose: The purpose <strong>of</strong> this criterion is to consider aspects <strong>of</strong><br />
the project that <strong>of</strong>fer unique benefits related to environmental<br />
and community impacts. A qualifying scenario would include an<br />
environmental or community impact that is not quantifiable, and<br />
therefore not included in the benefit-cost analysis.<br />
(b) Description: Points are awarded under this criterion on the basis<br />
<strong>of</strong> the department’s finding the project:<br />
(1) Will reduce negative community impacts <strong>of</strong> rail<br />
transportation such as noise, traffic interference, or<br />
blocked crossings.<br />
(2) Will reduce environmental impacts aside from efficiency<br />
gains due to modal shift.<br />
(c) Scoring: Environmental and Community Effects points are<br />
awarded as follows:<br />
Description Score or Range<br />
High Benefit Level 3<br />
Moderate Benefit Level 2<br />
Low Benefit Level 1<br />
Nonexistent 0<br />
MAXIMUM OF 3 POINTS<br />
Score Example <strong>of</strong> Qualifying Project<br />
3 <strong>Rail</strong> relocation project which eliminates noise, traffic interference or the<br />
need for a quiet zone<br />
2 <strong>Rail</strong> line construction that provides rail access to an industrial park, thereby<br />
shifting traffic to rail<br />
1 <strong>Rail</strong> rehabilitation through wetlands which corrects prior environmental<br />
impacts<br />
0 <strong>Rail</strong> project which does not generate environmental or community benefits<br />
________________________________________________________________________<br />
<strong>North</strong> <strong>Dakota</strong> <strong>State</strong> <strong>Rail</strong> <strong>Plan</strong> 149
8.2.7 Scoring and Weighting Method:<br />
(a) Purpose: The purpose <strong>of</strong> weighting the criteria is to<br />
appropriately assess the importance <strong>of</strong> each criterion to<br />
determine the total overall impact <strong>of</strong> the project.<br />
(d) Description: The weights assigned were determined by a<br />
committee <strong>of</strong> stakeholders in <strong>North</strong> <strong>Dakota</strong>’s rail industry. Each<br />
criterion is assigned with a weight which reflects the importance<br />
<strong>of</strong> the criterion to the committee.<br />
(e) Weighting: The scoring and weighting method is implemented<br />
as follows:<br />
Criterion<br />
Minimum<br />
Score<br />
Maximum<br />
Score<br />
Weight Total<br />
Total B/C ratio 0 25 1.12 28<br />
Carloads per mile 0 5 3.6 18<br />
System connectivity 0 3 6 18<br />
Economic development 0 3 4.6 14<br />
Safety/Security 0 3 4 12<br />
Environmental/Community 0 3 3.3 10<br />
Weighted 100<br />
________________________________________________________________________<br />
<strong>North</strong> <strong>Dakota</strong> <strong>State</strong> <strong>Rail</strong> <strong>Plan</strong> 150
APPENDIX G<br />
NDDOT FREIGHT RAILROAD IMPROVEMENT<br />
PROGRAM (FRIP)<br />
APPLICATION INSTRUCTIONS<br />
________________________________________________________________________<br />
<strong>North</strong> <strong>Dakota</strong> <strong>State</strong> <strong>Rail</strong> <strong>Plan</strong> 151
________________________________________________________________________<br />
<strong>North</strong> <strong>Dakota</strong> <strong>State</strong> <strong>Rail</strong> <strong>Plan</strong> 152
SECTION 1.0 – INTRODUCTION<br />
The <strong>North</strong> <strong>Dakota</strong> <strong>Department</strong> <strong>of</strong> <strong>Transportation</strong> (NDDOT) has administration and<br />
oversight responsibility for the <strong>North</strong> <strong>Dakota</strong> Freight <strong>Rail</strong> Improvement Program (FRIP)<br />
and Local <strong>Rail</strong> Freight Assistance (LRFA) loan funds.<br />
This document describes the rail loan fund application process. It also describes the<br />
methods used by NDDOT to evaluate rail loan projects. There is in addition a description<br />
<strong>of</strong> several obligations incurred by applicants when assistance is accepted.<br />
Potential applicants should review this document before submitting project proposals.<br />
SECTION 2.0 – ELIGIBLE APPLICANTS<br />
Eligible applicants include cities, counties, railroads, or other current or potential users <strong>of</strong><br />
freight railroad service.<br />
SECTION 3.0 – ELIGIBLE PROJECTS<br />
The NDDOT rail loan funds have limited resources. They are intended to be used<br />
primarily to upgrade and enhance infrastructure to improve rail service in ND through aid<br />
to short line railroads and, in some cases, shippers or other rail stakeholders.<br />
Generally, an eligible project is one in which the rail line related to the project has carried<br />
less than 5 million gross ton miles <strong>of</strong> freight per mile in the year previous to the year <strong>of</strong><br />
application and which accomplishes any <strong>of</strong> the following: rehabilitates a segment <strong>of</strong> rail<br />
line, results in economic development, improves transportation efficiency, promotes<br />
safety, promotes the viability <strong>of</strong> the statewide system <strong>of</strong> freight rail service, assists<br />
intermodal freight movement, or provides industry access to the national railroad system.<br />
The Director may waive the 5 million gross ton miles requirement if it is determined that<br />
a significant public interest in the project exists.<br />
SECTION 4.0 – APPLICATION PROCESS<br />
4.1 SUBMISSION<br />
Project requests must be received by NDDOT as follows:<br />
Annual Submission – December 1: Annual submission is for rail projects that<br />
are planned and developed in the normal course <strong>of</strong> business. They include<br />
infrastructure projects, such as rail relay or tie and ballast, and economic<br />
development type projects, such as loading spurs.<br />
Reserve Consideration – June 1: Reserve consideration is for projects that<br />
support economic competitiveness and that have been identified subsequent to<br />
the annual submission date. Reserve consideration is for projects that are<br />
unforeseen in the normal course <strong>of</strong> business. It is not an alternative date for<br />
annual submission projects.<br />
________________________________________________________________________<br />
<strong>North</strong> <strong>Dakota</strong> <strong>State</strong> <strong>Rail</strong> <strong>Plan</strong> 153
Economic Competitiveness projects identified after June 1, but before<br />
December 1, will be included at the next annual submission.<br />
Project proposals must be submitted in writing to NDDOT, in either hard copy or<br />
electronic format. Address hard copy to:<br />
NDDOT<br />
ATTN: <strong>Rail</strong> <strong>Plan</strong>ner<br />
608 East Boulevard Avenue<br />
Bismarck, ND 58505-0700<br />
Send electronic submissions to: rjohnsto@nd.gov.<br />
Proposals must provide the information requested in 4.1.1 through 4.1.6 and 4.2.1 <strong>of</strong><br />
this document.<br />
4.1.1 Identification <strong>of</strong> Parties and Projects<br />
(a) Applicant name, address, phone number, and point <strong>of</strong> contact (POC).<br />
Provide name, phone number, and email address for POC.<br />
(b) Name, address, phone number, and POC for the railroad party to the<br />
project. Provide name, phone number, and email address for POC.<br />
(c) Name, address, phone number, and POC <strong>of</strong> any shipper party to the<br />
project. Provide name, phone number, and email address for POC.<br />
(d) A narrative addressing the purpose, need and public benefits <strong>of</strong> the<br />
project. This might include, as applicable: capacity, safety and security,<br />
system linkage, system deficiencies, modal interrelationships, social<br />
demands, or economic development. This section should also describe<br />
and justify any negative impacts thought to be associated with the project.<br />
(e) A description <strong>of</strong> the proposed project, including:<br />
(1) Physical measurements (Linear, area, etc.).<br />
(2) Physical location (Address, mileposts, street crossings, etc.).<br />
(3) Major material specifications (<strong>Rail</strong> weight, ballast type, tie grade<br />
and type, etc.).<br />
(4) Map/sketch <strong>of</strong> project design and location.<br />
(5) Such other information as deemed useful by the Applicant to<br />
support and define the project concept and purpose.<br />
(6) Number <strong>of</strong> shippers served and/or affected, and commodities<br />
handled.<br />
(f) A narrative stating the alternative(s) to be pursued should assistance not be<br />
awarded and the applicable consequences there<strong>of</strong> (postpone or abandon<br />
________________________________________________________________________<br />
<strong>North</strong> <strong>Dakota</strong> <strong>State</strong> <strong>Rail</strong> <strong>Plan</strong> 154
project, reduce service by x amount, forgo x amount <strong>of</strong> revenue or cost<br />
savings, etc.). Data must be objective and quantified (numbers, dates,<br />
quantities, dollar amounts, etc.).<br />
4.1.2 Estimated Project Cost and Work Method<br />
(a) A line item breakout <strong>of</strong> estimated direct project costs at least to the level<br />
<strong>of</strong>:<br />
(1) Materials<br />
(2) Equipment<br />
(3) Labor<br />
(4) Force account work<br />
(5) Contract work<br />
(6) Total project cost<br />
(b) A description <strong>of</strong> the method or methods proposed for accomplishing major<br />
project tasks. (e.g., tie replacement by force account, surfacing by<br />
contractor, etc).<br />
4.1.3 Proposed Project Financing<br />
(a) <strong>State</strong> the dollar amount <strong>of</strong> assistance requested.<br />
(b) Identify the source <strong>of</strong> all anticipated non-state assistance.<br />
4.1.4 Intended Benefit and Cost Items<br />
Provide a list or description <strong>of</strong> the type or category <strong>of</strong> benefits and costs<br />
assumed by applicant to be associated with this project.<br />
4.1.5 Intended Environmental and Economic Enhancement Items<br />
Provide a list or description <strong>of</strong> any environmental or economic<br />
enhancement outcomes projected by the Applicant to result from the<br />
project.<br />
4.1.6 Public Involvement Process<br />
NDDOT shall solicit public input for each project that is accepted.<br />
NDDOT will place a legal notice in the <strong>of</strong>ficial newspaper(s) <strong>of</strong> record for<br />
the county or counties in which the proposed project is to be done, giving<br />
notice <strong>of</strong> opportunity to request a public hearing and/or submit comments<br />
on a proposed amendment to the <strong>State</strong> <strong>Rail</strong> <strong>Plan</strong>. The legal notice will<br />
state the reason for the proposed amendment (i.e., rail rehabilitation or<br />
other project), a point <strong>of</strong> contact for response, and the deadline for<br />
response.<br />
If a public hearing is held, all comments will be recorded verbatim and<br />
included in the application.<br />
________________________________________________________________________<br />
<strong>North</strong> <strong>Dakota</strong> <strong>State</strong> <strong>Rail</strong> <strong>Plan</strong> 155
4.2 APPLICATION REVIEW/CONFERENCE<br />
NDDOT staff will review all project applications. If the reviews indicate the need for<br />
more information, conferences with Applicants and any other significant entities may be<br />
needed. Conferences, if needed, are usually done by phone.<br />
4.2.1 Data for Benefit-Cost Analysis<br />
(a) The single most influential criterion in determining project qualification<br />
and rank is the Benefit-Cost Ratio (BCR). NDDOT may employ the<br />
services <strong>of</strong> others in analyzing and calculating the BCR.<br />
(b) The following list is representative <strong>of</strong> the type <strong>of</strong> data required for<br />
benefit/cost analysis:<br />
(1) What is the expected change (if any), expressed in dollars, in these<br />
areas from accomplishing the project.<br />
● Maintenance <strong>of</strong> Way (MOW) costs<br />
● Locomotive costs<br />
● Fuel costs<br />
● Freight rate/unit<br />
● Number <strong>of</strong> carloads<br />
● Lading handling costs<br />
● Car hire and/or car investment costs<br />
● Maintenance <strong>of</strong> Equipment (MOE) costs<br />
● Train crew costs<br />
● Product/lading shrinkage<br />
● Derailment Costs<br />
(2) Other statistical information pertinent to the analysis.<br />
● Project impact on market penetration (intermodal, customer<br />
territory, service frequency).<br />
● Average car capacity in same units used in freight rates above<br />
● Net liquidation value <strong>of</strong> in-place track assets.<br />
4.3 PROJECT QUALIFICATION AND RANKING<br />
4.3.1 The data required for project qualification and ranking shall be submitted<br />
to NDDOT by the Applicant.<br />
4.3.2 All project proposals will be reviewed for qualification. Qualified<br />
proposals will be scored and ranked for funding priority. (See Section 8<br />
for qualification and ranking criteria and scoring procedures.) Applicants<br />
will be informed <strong>of</strong> their project proposal's ranking.<br />
4.4 EMERGENCY ASSISTANCE<br />
The department may, at its sole discretion and upon application by an eligible applicant,<br />
provide assistance from the rail loan funds on a non-competitive basis at any time for a<br />
project addressing a (Government) declared emergency situation. The project must meet<br />
eligibility requirements. An emergency project shall deal with failure <strong>of</strong> significant<br />
________________________________________________________________________<br />
<strong>North</strong> <strong>Dakota</strong> <strong>State</strong> <strong>Rail</strong> <strong>Plan</strong> 156
infrastructure essential to operation <strong>of</strong> rail freight service, such as bridge failure, major<br />
washout, destruction by fire, and the like. Insurance proceeds must first be dedicated to<br />
the project.<br />
SECTION 5.0 – ASSISTANCE AWARD PROCESS<br />
5.1 APPLICANT ACCEPTANCE OF AWARD<br />
The Applicant shall accept or reject any <strong>of</strong>fer <strong>of</strong> assistance within 10 working days <strong>of</strong> the<br />
date <strong>of</strong> <strong>of</strong>fer.<br />
5.2 AGREEMENT EXECUTION<br />
A loan agreement between NDDOT and the Applicant must be executed within 90<br />
calendar days <strong>of</strong> the Applicant’s acceptance <strong>of</strong> an <strong>of</strong>fer <strong>of</strong> loan assistance. Unless<br />
NDDOT otherwise agrees, the <strong>of</strong>fer <strong>of</strong> loan assistance expires and is withdrawn if this<br />
condition is not met.<br />
SECTION 6.0 – ASSISTANCE FORM AND AMOUNT<br />
6.1 POLICIES AFFECTING ASSISTANCE FORM AND AMOUNT<br />
6.1.1 The measure <strong>of</strong> public interest, for program purposes, is determined by<br />
the project's qualification and ranking according to the criteria set forth<br />
under Part II, Section 1.0 herein.<br />
6.1.2 Loan assistance is provided at an interest rate calculated at 1/2 <strong>of</strong> a<br />
prime rate at the Bank <strong>of</strong> <strong>North</strong> <strong>Dakota</strong>, but not less than 3%.<br />
6.1.3 Loan amounts for rehabilitation construction will be 70% <strong>of</strong> estimated<br />
project cost, with the Applicant’s share being 30% <strong>of</strong> estimated project<br />
cost. The Applicant’s share must come from non-state funds. New<br />
construction will be financed on a 50% - 50% basis.<br />
6.1.4 The loan term is 10 years, with payment deferred the first two years.<br />
Interest accrues during the deferred period. The loan is repaid in eight<br />
annual installments, beginning the third year <strong>of</strong> the loan. The interest<br />
accrued during the deferred period is due with the first loan payment.<br />
SECTION 7.0 – KEY ASSISTANCE AGREEMENT TERMS<br />
7.1 LIST<br />
7.1.1 The Applicant must agree to maintain the project line at or above FRA<br />
Class 2 Track Safety Standard until the loan is fully repaid. Termination<br />
<strong>of</strong> service will make the full loan amount, plus an amount equal to the<br />
interest rate stated in the agreement applied to the full loan amount from<br />
the effective date <strong>of</strong> the agreement to date <strong>of</strong> termination, immediately<br />
due and payable.<br />
7.1.3 Interest charges begin upon first draw <strong>of</strong> loan funds and are calculated<br />
on a fixed regular schedule.<br />
________________________________________________________________________<br />
<strong>North</strong> <strong>Dakota</strong> <strong>State</strong> <strong>Rail</strong> <strong>Plan</strong> 157
7.1.4 Rehabilitation and construction material and performance specifications<br />
shall conform to American <strong>Rail</strong>way Engineering and Maintenance <strong>of</strong><br />
Way Association (AREMA) standards and practices.<br />
7.1.5 Project costs may not be incurred on any project before an agreement is<br />
fully executed between NDDOT and the Applicant.<br />
7.1.6 If work on the project has not begun within one year <strong>of</strong> the date the loan<br />
agreement was fully executed, the agreement becomes void and the <strong>of</strong>fer<br />
<strong>of</strong> assistance is withdrawn, unless NDDOT agrees to extend the term. If<br />
the agreement becomes void, the Applicant may re-apply for assistance.<br />
The application will be considered a new submission, and will be<br />
evaluated as such.<br />
7.1.7 Competitive bidding must be used for contract work on loan projects.<br />
7.1.8 The progress billing method will be permitted with 10% retainage by<br />
NDDOT. Final billing must include a statement <strong>of</strong> total actual costs and<br />
may be subject to a detailed audit. Final billing must be submitted to<br />
NDDOT within three months after project completion.<br />
7.1.9 The applicant shall, upon any sale or disposition <strong>of</strong> all or any portion <strong>of</strong><br />
the subject line, or the filing <strong>of</strong> an application for abandonment <strong>of</strong> all or<br />
any portion <strong>of</strong> the subject line at any time during the term <strong>of</strong> agreement,<br />
repay to NDDOT the full amount <strong>of</strong> the NDDOT share <strong>of</strong> the cost <strong>of</strong><br />
improvements made to the subject line.<br />
SECTION 8.0 – PROJECT SELECTION<br />
8.1 PROJECT SELECTION POLICIES<br />
8.1.1 Purpose <strong>of</strong> Qualification and Ranking: Proposed projects must generate<br />
improvements in transportation efficiency and may also generate broad<br />
public benefit.<br />
8.1.2 Method <strong>of</strong> Qualification and Ranking: Six criteria are used to evaluate<br />
and rank proposed projects. The rating system generates a point value for<br />
each criterion. The criteria are:<br />
• Benefit-Cost Ratio (BCR)<br />
• Impact on the ND <strong>Rail</strong> System<br />
• <strong>Rail</strong> System Connectivity<br />
• Economic Impact<br />
• Safety and Security<br />
• Community and Environmental Impact<br />
A project must have a primary BCR <strong>of</strong> at least 1.0 to qualify for further<br />
evaluation. Qualified projects are ranked according to total point score.<br />
The rankings are used in determining which applicants receive <strong>of</strong>fers <strong>of</strong><br />
assistance. Offers are made, at the Directors discretion, to applicants in<br />
________________________________________________________________________<br />
<strong>North</strong> <strong>Dakota</strong> <strong>State</strong> <strong>Rail</strong> <strong>Plan</strong> 158
ank order until program resources are no longer until available resources<br />
have been allocated.<br />
8.1.3 Relation <strong>of</strong> Rank to Funding: Project rank is a factor in determining<br />
whether a project is funded and what priority the project has. The ranking<br />
process has no influence on the type <strong>of</strong> assistance <strong>of</strong>fered. All assistance<br />
is will be in the form <strong>of</strong> a low interest loan.<br />
It is possible for a project to be funded outside <strong>of</strong> rank order. If a lower<br />
ranked project may be funded within available resource limits while a<br />
higher ranked project would exceed those limits, the lower ranked project<br />
may be funded if the applicant <strong>of</strong> the higher ranked project is unable or<br />
unwilling to proceed with the project funded with only the remaining<br />
available resources.<br />
If two or more qualified projects end up with the same total score, the<br />
BCR will determine the final ranking.<br />
8.1.4 Directors Authority: On a case by case basis the Director will have the<br />
authority to modify funding limits and/or repayment criteria.<br />
8.2 PROJECT SELECTION CRITERIA<br />
8.2.1 Benefit-Cost Ratio:<br />
(a) Purpose: The purpose <strong>of</strong> the BCR criterion is to afford a measure<br />
<strong>of</strong> the economic soundness <strong>of</strong> an investment <strong>of</strong> public funds in the<br />
project.<br />
(b) Description: The total BCR consists <strong>of</strong> three levels: (1) primary<br />
efficiency benefits, (2) transportation efficiency benefits, including<br />
highway impacts, and (3) total economic benefits. A project must<br />
have a primary BCR <strong>of</strong> 1.0 or greater to qualify for further<br />
evaluation. The total BCR is used in comparing projects that<br />
qualify for further evaluation.<br />
(c) Scoring: The numeric score for the BCR criterion is the total<br />
BCR. To remain consistent with a multi criteria scoring system,<br />
the BCR cannot increase without bound. It is therefore capped at<br />
25. Since a BCR above 25 is a rare occurrence, the cap’s effect on<br />
project score should be minimal.<br />
MAXIMUM OF 25 POINTS<br />
8.2.2 Carloads per Mile:<br />
(a) Purpose: The purpose <strong>of</strong> this criterion is to represent the scale <strong>of</strong><br />
the total project benefits. Traffic density is a proxy for the<br />
strategic significance <strong>of</strong> a line, the likelihood <strong>of</strong> long-run survival<br />
________________________________________________________________________<br />
<strong>North</strong> <strong>Dakota</strong> <strong>State</strong> <strong>Rail</strong> <strong>Plan</strong> 159
<strong>of</strong> the line, and the continuation <strong>of</strong> benefits beyond the analysis<br />
period.<br />
(b) Description: The number <strong>of</strong> carloads per mile is an average <strong>of</strong><br />
carloads from a period <strong>of</strong> three consecutive years. All carloads are<br />
counted, including bridge and overhead traffic. Any bridge or<br />
overhead carloads included in the total shall also be shown<br />
separately. Multi-platform articulated cars are to be treated as<br />
single or multiple cars according to how they are treated in the<br />
tariff or contract under which they move. Carloads from the past<br />
three years and projections for the next two years may be used for<br />
the average, but it must be three consecutive years. Absent valid<br />
projections, traffic for the past three years must be used.<br />
(c) Scoring: Points are awarded on the basis <strong>of</strong> carloads per mile as<br />
shown in the table below. The points awarded increase as the<br />
traffic increases. Points are awarded in this manner to reflect the<br />
lesser impact on the economy <strong>of</strong> very light density lines.<br />
Carloads/Mile<br />
3 Yr. Average<br />
< 12<br />
12 - 20<br />
21 - 35<br />
36 - 80<br />
81 - 120<br />
> 120<br />
MAXIMUM OF 5 POINTS<br />
Points<br />
8.2.3 System Connectivity:<br />
(a) Purpose: The purpose <strong>of</strong> this criterion is to afford a means to<br />
reflect the value a project may present in serving a distinct<br />
system function even though traffic origin or destination<br />
functions may be minimal or absent.<br />
(b) Description: System connectivity is present when the project<br />
specifically provides for the only direct connection <strong>of</strong> two<br />
distinct through route line segments <strong>of</strong> the applicant's system, or<br />
the system's sole interchange connection with another railroad.<br />
(d) Scoring: System connectivity points are awarded as shown<br />
below.<br />
________________________________________________________________________<br />
<strong>North</strong> <strong>Dakota</strong> <strong>State</strong> <strong>Rail</strong> <strong>Plan</strong> 160<br />
0<br />
1<br />
2<br />
3<br />
4<br />
5
Description Score or Range<br />
High Connectivity 3<br />
Moderate Connectivity 2<br />
Low Connectivity 1<br />
Nonexistent 0<br />
MAXIMUM OF 3 POINTS<br />
Score Example <strong>of</strong> Qualifying Project<br />
3 Line improvement that rehabilitates a segment that connects two high<br />
volume branch lines and prevents circuitous routing<br />
2 Line improvement to ensure that a segment <strong>of</strong> track remains continuous<br />
1 Low usage gateway between branch lines<br />
0 Stub Line or Siding<br />
8.2.4 Enhancing <strong>North</strong> <strong>Dakota</strong>’s Economy:<br />
(a) Purpose: The purpose <strong>of</strong> this criterion is to afford a means to<br />
consider aspects <strong>of</strong> the project that <strong>of</strong>fer economic benefits that<br />
may not be captured under either the traditional benefit-cost<br />
analysis or a REMI analysis. A qualifying scenario includes an<br />
exogenous economic impact, that is, an impact not measureable<br />
in the context <strong>of</strong> the usual benefit-cost analysis.<br />
(b) Description: Points are awarded under this criterion on the basis<br />
<strong>of</strong> the department's finding that the project:<br />
(1) Will address an unusual <strong>North</strong> <strong>Dakota</strong> job gain or loss<br />
situation.<br />
(2) Contains an element <strong>of</strong> urgency/timeliness significant to<br />
its ability to deliver long-term benefits.<br />
(3) Improves viability <strong>of</strong> businesses served by the operator.<br />
(4) Improves the attractiveness <strong>of</strong> <strong>North</strong> <strong>Dakota</strong> for new<br />
business.<br />
(5) Serves a developed industrial park (streets, sewer, and<br />
water in place).<br />
(b) Scoring: Enhancing <strong>North</strong> <strong>Dakota</strong>’s economy points are<br />
awarded as follows:<br />
Description Score or Range<br />
High Exogenous Impact 3<br />
Moderate Exogenous Impact 2<br />
Low Exogenous Impact 1<br />
Nonexistent 0<br />
MAXIMUM OF 3 POINTS<br />
________________________________________________________________________<br />
<strong>North</strong> <strong>Dakota</strong> <strong>State</strong> <strong>Rail</strong> <strong>Plan</strong> 161
Score Example <strong>of</strong> Qualifying Project<br />
3 Project that provides rail access to an industrial park, which raises<br />
attractiveness for firms to locate there<br />
2 Project that provides rail access to an industrial park, which may<br />
induce existing firms to expand<br />
1 Project that maintains infrastructure which may lead to firm retention<br />
0 Project that does not have exogenous potential economic impact<br />
8.2.6 Safety and Security:<br />
(f) Purpose: The purpose <strong>of</strong> this criterion is to provide a means to<br />
consider aspects <strong>of</strong> the project that <strong>of</strong>fer unique benefits to<br />
railroad safety or enhance the state’s security. A qualifying<br />
scenario would include a safety or security impact that is not<br />
quantifiable, and therefore not included in the benefit-cost<br />
analysis.<br />
(g) Description: Points are awarded under this criterion on the basis<br />
<strong>of</strong> the department's finding the project will result in:<br />
(1) Reduction in potential derailments.<br />
(2) Reduction <strong>of</strong> hazards to railroad personnel and<br />
contractors.<br />
(3) A shift <strong>of</strong> shipments <strong>of</strong> hazardous materials from the<br />
highway system to the railroad network that would<br />
reduce accident exposure.<br />
(4) Grade crossing safety enhancements.<br />
(5) Increasing the security <strong>of</strong> yards, containers, tank cars, and<br />
other equipment and facilities.<br />
(6) Security enhancements to border crossings, inspection<br />
locations, bridges and potential choke points.<br />
(h) Scoring: Safety and Security points are awarded as follows:<br />
Description Score or Range<br />
High Safety and Security Impact 3<br />
Moderate Safety and Security Impact 2<br />
Low Safety and Security Impact 1<br />
Nonexistent 0<br />
MAXIMUM OF 3 POINTS<br />
________________________________________________________________________<br />
<strong>North</strong> <strong>Dakota</strong> <strong>State</strong> <strong>Rail</strong> <strong>Plan</strong> 162
Score Example <strong>of</strong> Qualifying Project<br />
3 Project that reduces hazmat transportation risks by shifting traffic from highrisk<br />
highway routes, reduces the risks <strong>of</strong> hazmat accidents at grade crossings,<br />
or reduces the risks <strong>of</strong> train derailments involving hazmat cargo<br />
2 Project that generally reduces highway accident risks by shifting freight<br />
traffic from highway routes to rail lines, or, that reduces the risk <strong>of</strong> train<br />
derailments<br />
1 Project that improves the safety and security <strong>of</strong> railroad lines or yards by<br />
eliminating hazards to railroad workers or the public, including reductions in<br />
trespassing<br />
0 Project that does not positively impact safety or security<br />
8.2.6 Environmental and Community Effects:<br />
(d) Purpose: The purpose <strong>of</strong> this criterion is to consider aspects <strong>of</strong><br />
the project that <strong>of</strong>fer unique benefits related to environmental<br />
and community impacts. A qualifying scenario would include an<br />
environmental or community impact that is not quantifiable, and<br />
therefore not included in the benefit-cost analysis.<br />
(e) Description: Points are awarded under this criterion on the basis<br />
<strong>of</strong> the department’s finding the project:<br />
(1) Will reduce negative community impacts <strong>of</strong> rail<br />
transportation such as noise, traffic interference, or<br />
blocked crossings.<br />
(2) Will reduce environmental impacts aside from efficiency<br />
gains due to modal shift.<br />
(f) Scoring: Environmental and Community Effects points are<br />
awarded as follows:<br />
Description Score or Range<br />
High Benefit Level 3<br />
Moderate Benefit Level 2<br />
Low Benefit Level 1<br />
Nonexistent 0<br />
MAXIMUM OF 3 POINTS<br />
Score Example <strong>of</strong> Qualifying Project<br />
3 <strong>Rail</strong> relocation project which eliminates noise, traffic interference or the<br />
need for a quiet zone<br />
2 <strong>Rail</strong> line construction that provides rail access to an industrial park,<br />
thereby shifting traffic to rail<br />
1 <strong>Rail</strong> rehabilitation through wetlands which corrects prior environmental<br />
impacts<br />
0 <strong>Rail</strong> project which does not generate environmental or community<br />
benefits<br />
________________________________________________________________________<br />
<strong>North</strong> <strong>Dakota</strong> <strong>State</strong> <strong>Rail</strong> <strong>Plan</strong> 163
8.2.7 Scoring and Weighting Method:<br />
(a) Purpose: The purpose <strong>of</strong> weighting the criteria is to<br />
appropriately assess the importance <strong>of</strong> each criterion to<br />
determine the total overall impact <strong>of</strong> the project.<br />
(i) Description: The weights assigned were determined by a<br />
committee <strong>of</strong> stakeholders in <strong>North</strong> <strong>Dakota</strong>’s rail industry. Each<br />
criterion is assigned with a weight which reflects the importance<br />
<strong>of</strong> the criterion to the committee.<br />
(j) Weighting: The scoring and weighting method is implemented<br />
as follows:<br />
Criterion<br />
Minimum<br />
Score<br />
Maximum<br />
Score<br />
Weight Total<br />
Total B/C ratio 0 25 1.12 28<br />
Carloads per mile 0 5 3.6 18<br />
System connectivity 0 3 6 18<br />
Economic development 0 3 4.6 14<br />
Safety/Security 0 3 4 12<br />
Environmental/Community 0 3 3.3 10<br />
Weighted 100<br />
________________________________________________________________________<br />
<strong>North</strong> <strong>Dakota</strong> <strong>State</strong> <strong>Rail</strong> <strong>Plan</strong> 164
APPENDIX H<br />
RAIL REHABILITATION PROJECTS<br />
________________________________________________________________________<br />
<strong>North</strong> <strong>Dakota</strong> <strong>State</strong> <strong>Rail</strong> <strong>Plan</strong> 165
________________________________________________________________________<br />
<strong>North</strong> <strong>Dakota</strong> <strong>State</strong> <strong>Rail</strong> <strong>Plan</strong> 166
NORTH DAKOTA LRSA/LRFA<br />
REVOLVING LOAN ACCOUNT ACTIVITY<br />
YEAR RR PROJECT MILES LRSA/LRFA MATCHING TOTAL<br />
1982 BN New Rockford to Maddock, rail rehab 36.6 $1,450,236.53 $765,079.29 $2,215,315.82<br />
1982 BN Larimore to Mayville, rail rehab 36.3 $1,106,740.47 $628,302.00 $1,735,042.47<br />
1983 BN Edgeley to Lisbon, rail replacement 53.4 $861,556.62 $1,604,908.25 $2,466,464.87<br />
1983 CPR Fordville to Poland, rail rehab, 3 phase project 35.7<br />
1983 CPR Phase I, Fordville to Conway $216,293.00 $92,697.00 $308,990.00<br />
1984 CPR Phase II, Conway to Forest River $425,659.00 $212,822.28 $638,481.28<br />
1985 CPR Phase III, Forest River to Poland $222,855.00 $386,882.79 $609,737.79<br />
1986 CPR<br />
Tolley to Russell, rail rehab, phase 1 <strong>of</strong> a 2 phase<br />
project; Loma to Lankin (done in 1989) is Phase II<br />
45.0 $1,688,855.00 $1,515,742.74 $3,204,597.74<br />
1986 CPR Egeland to Loma, rail rehab 19.0 $905,100.00 $837,436.68 $1,742,536.68<br />
1988 RRVW Mooreton to Wahpeton, replace rail 5.0 $347,400.00 $157,800.20 $505,200.20<br />
1988 RRVW Independence to Oakes, ties & ballast 15.0 $195,600.00 $126,916.02 $322,516.02<br />
1988 RRVW New Rockford to Carrington, rail rehab 15.0 $256,940.00 $198,703.35 $455,643.35<br />
1989 CPR Loma to Lankin, rail rehab 30.0 $1,887,686.62 $809,008.55 $2,696,695.17<br />
1989 RRVW Milnor to Wahpeton, rail rehab 40.0 $527,761.25 $226,183.39 $753,944.64<br />
1990 RRVW Wyndmere to Barney, rail relay 4.2 $283,256.30 $121,395.56 $404,651.86<br />
____________________________________________________________________________________________________________<br />
<strong>North</strong> <strong>Dakota</strong> <strong>State</strong> <strong>Rail</strong> <strong>Plan</strong> Update 167
1991 RRVW Barney to Mooreton, rail replacement 5.0 $464,670.00 $164,720.10 $629,390.10<br />
1992 RRVW Mooreton to Oakes Jct., replace rail 6.5 $505,217.59 $220,807.54 $726,025.13<br />
1993 RRVW Chaffee Junction to Chaffee, rail relay 11.6 $338,594.28 $146,540.40 $485,134.68<br />
1993 DMVW Kulm to Merricourt, rail relay 10.0 $506,101.00 $216,901.00 $723,002.00<br />
1996 RRVW<br />
Davenport to Lisbon, tie & ballast upgrade,<br />
resurface rail<br />
37.0 $583,877.00 $250,233.00 $834,110.00<br />
1996 CPR Calio to Bisbee, ties & ballast, resurface rail 19.5 $1,082,813.20 $464,062.80 $1,546,876.00<br />
1996 CPR Conway to Ardoch, rail relay 2.0 $266,000.00 $114,000.00 $380,000.00<br />
1996 DMVW<br />
Crosby to Fortuna, tie & ballast upgrade, resurface<br />
rail<br />
24.0 $706,490.40 $302,781.60 $1,009,272.00<br />
1997 RRVW<br />
Carrington to New Rockford, tie and ballast<br />
upgrade, resurface rail<br />
16.0 $223,166.58 $95,642.82 $318,809.40<br />
1999 RRVW Berlin Elevator, siding, new const. $80,982.00 $80,982.00 $161,964.00<br />
1998 NPR Ardoch to Conway, ties & ballast upgrade, 2 phases 16.0<br />
2000 NPR Ardoch to Conway, phase I $505,396.27 $216,597.40 $721,993.67<br />
2002 NPR Ardoch to Conway, phase II $1,505,205.00 $1,045,989.91 $2,551,194.91<br />
2002 RRVW<br />
Oakes to Independence, replace rail, tie & ballast<br />
upgrade<br />
16.0 $2,420,000.00 $1,037,142.86 $3,457,142.86<br />
2005 NPR<br />
Ardoch to Red River Bridge, rail replacement with<br />
tie & ballast upgrade<br />
9.6 $1,511,170.00 $647,644.29 $2,158,814.29<br />
2010 NPR<br />
Kenmare to Tolley rail relay with tie & ballast<br />
upgrade (to be completed in 2011)<br />
15.2 $2,488,404.00 $1,066,459.00 $3,554,863<br />
TOTALS 507.6 $23,154,113.11 $13,578,705.82 $36,732,818.93<br />
____________________________________________________________________________________________________________<br />
<strong>North</strong> <strong>Dakota</strong> <strong>State</strong> <strong>Rail</strong> <strong>Plan</strong> Update 168
NORTH DAKOTA FRIP<br />
REVOLVING LOAN ACCOUNT ACTIVITY<br />
YEAR RR PROJECT FRIP MATCHING TOTAL<br />
1997 DMVW Crosby to Ambrose, rail relay 9.8 $657,994.00 $281,998.00 $939,992.00<br />
2001 RRVW<br />
Oakes to Independence line, rail replacement, tie and<br />
ballast upgrade<br />
3.0 $ 920,939.00 $276,282.00 $1,197,221.00<br />
2001 RRVW<br />
Oakes Junction to Oakes, rail replacement, tie<br />
and ballast upgrade<br />
2.3 $ 813,247.00 $346,372.00 $1,154,574.00<br />
2005 CRETE<br />
GRAIN<br />
Bernard Siding; Oakes junction to Oakes, new<br />
construction, including switch and track scale; rehab<br />
construction including tie and ballast upgrade<br />
3.1 $ 639,326.00 $549,761.00 $1,243,087.00<br />
2005 RRVW<br />
Oakes, rail replacement and tie & ballast upgrade to<br />
support Crete Grain project<br />
2.0 $ 212,657.00 $91,139.00 $303,796.00<br />
2006 WDF&S <strong>Rail</strong> Spur $107,073.00 $107,073.00 $214,146.00<br />
2008 DMVW<br />
Bismarck to Coal Creek Station, rail relay with the and<br />
ballast upgrade<br />
26.9 $1,572,000.00 $678,000.00 $2,250,000.00<br />
2008 RRVW Horace to Lisbon, tie and ballast replacement 45.3 $697,616.00 298,978.00 $996,594.00<br />
2008 HARVEY <strong>Rail</strong> Spur $293,000.00 $293,000.00<br />
$586,000.00<br />
2009 RRVW Jamestown to Carrington, tie and ballast replacement 42.5 $370,589.00 $158,824.00 $529,413.00<br />
2010 DMVW Bismarck Connection $453,180.00 $453,180.00 $906,360.00<br />
TOTALS 134.9 $6,737,621.00 $3,534,607.00 $10,321,183.00<br />
____________________________________________________________________________________________________________<br />
<strong>North</strong> <strong>Dakota</strong> <strong>State</strong> <strong>Rail</strong> <strong>Plan</strong> Update 169
NORTH DAKOTA LRSA/LRFA<br />
GRANT ACTIVITY<br />
YEAR RR PROJECT MILES LRSA/LRFA MATCHING TOTAL<br />
1979 BN<br />
1980 CPR<br />
1980 CPR<br />
1981 Coop<br />
GRANT Jamestown – Upgrade spur line into the <strong>State</strong> Hospital to<br />
allow coal car access.<br />
GRANT Monango – Siding to provide CPR rail service to a new<br />
consolidated grain terminal after Milwaukee Road abandonment.<br />
GRANT Fairmount – provide CPR rail service to Cenex bulk<br />
fertilizer plant after Milwaukee Road abandonment.<br />
GRANT Gladstone – Siding to provide BN rail service to new grain<br />
subterminal constructed after Milwaukee Road abandonment.<br />
1993 DMVW GRANT System-wide Flood<br />
1993 RRVW GRANT System-wide Flood<br />
1993<br />
1996<br />
CPR<br />
PRO<br />
GOLD<br />
GRANT System-wide Flood<br />
GRANT Richland County – <strong>Rail</strong> spur and intermodal facilities to<br />
support a $267 million corn processing plant. The project is served by<br />
the RRVW 1st subdivision north <strong>of</strong> Wahpeton ND and will have<br />
significant impacts on both the railroad and the local economy.<br />
Inbound corn will by via RRVW and trucks. Outbound product will be<br />
via RRVW, then BNSF for nationwide distribution.<br />
4.5 $594,536.28 $139,612.15 $734,148.43<br />
$207,627.06 $51,906.77 $259,533.83<br />
$13,977.28 $3,494.32 $17,471.60<br />
$335,972.00 $89,873.03 $425,845.03<br />
$80,541.39 $14,213.19 $94,754.58<br />
$133,550.30 $23,556.70 $157,107.00<br />
$340,000.00<br />
$88,221.38<br />
$428,221.38<br />
3.5 $1,200,000.00 $3,400,000.00 $4,600,000.00<br />
TOTALS 8.0 $2,906,204.31 $3,810,877.54 $6,717,081.85<br />
____________________________________________________________________________________________________________<br />
<strong>North</strong> <strong>Dakota</strong> <strong>State</strong> <strong>Rail</strong> <strong>Plan</strong> Update 170
APPENDIX I<br />
RAIL PLAN UPDATE PUBLIC HEARING COMMENTS<br />
________________________________________________________________________<br />
<strong>North</strong> <strong>Dakota</strong> <strong>State</strong> <strong>Rail</strong> <strong>Plan</strong> Update 171
________________________________________________________________________<br />
<strong>North</strong> <strong>Dakota</strong> <strong>State</strong> <strong>Rail</strong> <strong>Plan</strong> Update 172
I. Introduction<br />
Summary <strong>of</strong> Comments<br />
The <strong>State</strong> <strong>Rail</strong> <strong>Plan</strong> update public hearing was held September 21, 2006. The<br />
meeting was held simultaneously at sites in Bismarck and Fargo via interactive video.<br />
Invitations were sent to agencies, businesses and individuals prior to the meeting.<br />
The meeting was publicized in all <strong>North</strong> <strong>Dakota</strong> daily newspapers 21 days prior to<br />
the meeting. A follow up public service announcement was sent to the same newspapers<br />
approximately 10 days before the hearing. Written comments could be submitted<br />
through the October 5, 2006. No written comments were received. Verbal comments<br />
were received at the hearing.<br />
The draft rail plan was posted on the NDDOT web site about three weeks before<br />
the public hearing. The draft was available for download. Hard copy was available on<br />
request. The public was granted the opportunity to submit comments electronically or in<br />
hard copy. No comments were received. Hard copy <strong>of</strong> the draft rail plan was also<br />
available at the meeting sites.<br />
The hearing was open house format. An overview <strong>of</strong> the updated plan was<br />
presented. The meeting was then opened for comments.<br />
II. Purpose <strong>of</strong> Hearing<br />
The meeting was held to receive comments on the draft <strong>State</strong> <strong>Rail</strong> <strong>Plan</strong> and to<br />
inform the public about current rail related issues.<br />
________________________________________________________________________<br />
<strong>North</strong> <strong>Dakota</strong> <strong>State</strong> <strong>Rail</strong> <strong>Plan</strong> Update 173
III. Verbal Comments (paraphrased)<br />
DAN ZINK, RED RIVER VALLEY & WESTERN RAILROAD: One <strong>of</strong> the most<br />
important things within the <strong>State</strong> <strong>Rail</strong> <strong>Plan</strong> is the loan programs. The <strong>North</strong> <strong>Dakota</strong> rail<br />
loan programs are absolutely critical to the success <strong>of</strong> the short line railroads in the state,<br />
and RRVW has been a frequent user <strong>of</strong> them. They are the best source <strong>of</strong> financing for<br />
track rehabilitation projects, short <strong>of</strong> outright grants. The short lines are grateful for<br />
being able to use the loan programs.<br />
It is critical to the future <strong>of</strong> the short lines to be able to obtain financing for track<br />
projects. Financing for larger track projects is one <strong>of</strong> the greatest challenges that short<br />
lines face nationwide, and is probably the biggest single obstacle in the way <strong>of</strong> further<br />
short line development in the country. Nearly all <strong>of</strong> the legislative initiatives that the<br />
short lines have pursued at the state and national levels during the last several years have<br />
been related to financing track projects.<br />
Short lines have been good for <strong>North</strong> <strong>Dakota</strong> and the nation. Short lines now<br />
operate just over a third <strong>of</strong> the track miles in <strong>North</strong> <strong>Dakota</strong> and represent the first-mile<br />
last-mile in many areas that would not otherwise have rail service. From the RRVW<br />
perspective, the loan programs, how they’re treated, how they’re funded, to what level<br />
they’re funded, and the criteria for eligibility, are very important.<br />
BOB JOHNSTON, NDDOT: The latest edition <strong>of</strong> <strong>Rail</strong>way Age talks about how<br />
critically important railroads were in the development <strong>of</strong> the western part <strong>of</strong> the United<br />
<strong>State</strong>s and how the economy <strong>of</strong> the nation couldn’t have coalesced and specialized the<br />
________________________________________________________________________<br />
<strong>North</strong> <strong>Dakota</strong> <strong>State</strong> <strong>Rail</strong> <strong>Plan</strong> Update 174
way it did without the railroad network being in place. I think this adds a little emphasis<br />
to what we’re talking about today.<br />
STEVE STREGE, NORTH DAKOTA GRAIN DEALERS ASSOCIATION: I agree<br />
that the railroads are important to <strong>North</strong> <strong>Dakota</strong>. My industry is saying that crop<br />
production is still the number one generator <strong>of</strong> rail use in the state. Most grain moves by<br />
rail at some point. This is a focal point for a large segment <strong>of</strong> the <strong>North</strong> <strong>Dakota</strong><br />
economy. Pages 24 and 25 <strong>of</strong> the draft rail plan deal with shuttle loader facilities. These<br />
facilities exert great influence on the movement <strong>of</strong> grain, and producers and shippers<br />
must take this into account for their economic survival. With the coming <strong>of</strong> ethanol and<br />
other bi<strong>of</strong>uel plants, change will again come for producers, shippers and the<br />
transportation network. We need to keep on top <strong>of</strong> this, to monitor and track it.<br />
MR. JOHNSTON: The system has changed since 1998. With the opportunities and<br />
market for ethanol processing, and some <strong>of</strong> the other activities that we’re likely to see<br />
within the next three to five years, we’re likely to see a much different and/or expanded<br />
set <strong>of</strong> facilities and a different facilities map than we do today. The railroads are ready to<br />
serve that market, but there are also some implications for our local highway planning,<br />
looking at access into some <strong>of</strong> these facilities.<br />
MR. ZINK: Overall, these facilities bring about movement <strong>of</strong> larger volumes through<br />
fewer points. The rail system, the highway system, the grain elevator system, and<br />
producers are all impacted. This is an indication <strong>of</strong> the level <strong>of</strong> planning this document is<br />
________________________________________________________________________<br />
<strong>North</strong> <strong>Dakota</strong> <strong>State</strong> <strong>Rail</strong> <strong>Plan</strong> Update 175
a part <strong>of</strong>, whether it be for or around the rail system. The planning process has to<br />
continue, and it should probably be more frequent and intense because <strong>of</strong> the impact this<br />
consolidation <strong>of</strong> operations has. There will be benefits, but there will also be substantial<br />
cost in terms <strong>of</strong> public and/or private infrastructure development. Short and long term<br />
investment plans may be impacted by this<br />
MR. STREGE: Earlier in this month, agricultural economist Keith Kahl testified before<br />
the US Senate regarding bi<strong>of</strong>uel in the United <strong>State</strong>s, and how the growth <strong>of</strong> that industry<br />
has been a lot faster than what USDA projected just two or three or four years ago; he<br />
was talking about perhaps 20 percent <strong>of</strong> CRP acres coming out and going into some crop<br />
production. ND is among the top three areas <strong>of</strong> the county for acres in CRP. The central<br />
part <strong>of</strong> the state – Pierce, Sheridan, Stutsman and Wells counties, for example – has a lot<br />
<strong>of</strong> acres in CRP. I don’t know if corn can be successfully grown on those acres because<br />
<strong>of</strong> water problems, but there are many acres there.<br />
MR. ZINK: I think Steve raised another interesting point that is talked a little bit about<br />
in the plan; potential changes, with corn shifting to big shuttle facilities or ethanol plants,<br />
and possibly oilseeds going to bi<strong>of</strong>uel plants. Other crops might be involved as well. I<br />
also think it’s important to be aware <strong>of</strong> how growers are moving product, whether it is<br />
through the elevator system plants or trucking it directly to the plants. I think there are<br />
major implications for highway planning in all this, since there is potential for shifting<br />
truck traffic patterns, which would affect highways and planning in the NDDOT districts.<br />
I think it’s something we should monitor and keep track <strong>of</strong>.<br />
________________________________________________________________________<br />
<strong>North</strong> <strong>Dakota</strong> <strong>State</strong> <strong>Rail</strong> <strong>Plan</strong> Update 176
MR. STREGE: Well, to move into the plants might not make sense to the railroads<br />
because I’ve been told that they’re going to be brining corn from Minnesota into <strong>North</strong><br />
<strong>Dakota</strong> plants, while <strong>North</strong> <strong>Dakota</strong> corn is going to go to the PNW. I don’t know if that’s<br />
true or not. Maybe Dan can shed some light on that. The railroads can do a lot <strong>of</strong> things<br />
through rates and service. They’re pretty free to do that, and so we may think we’ve got<br />
it figured out, but we may not have it figured out.<br />
MR. ZINK: Well, I don’t disagree with that at all, Steve. I think a lot is still up in the<br />
air. One <strong>of</strong> the best examples right now is the two ethanol plants under construction in<br />
the western part <strong>of</strong> the state. They’re not in or near what traditionally has been corn<br />
country. The plants will have some corn inbound by truck, but the facilities are built to<br />
be served by rail. Most <strong>of</strong> them are building enough track to receive shuttle trains or unit<br />
trains, but where the source <strong>of</strong> the corn is I think is very much up in the air. We have<br />
within the last few days been involved in preliminary discussion about the process <strong>of</strong><br />
bringing service into one <strong>of</strong> those plants. One <strong>of</strong> the big questions is about the source <strong>of</strong><br />
corn. This is a very new thing and there is no experience to fall back on. It changes the<br />
dynamic <strong>of</strong> our westbound corn movement completely. How do you satisfy demand far<br />
away and up close at the same time; what are the right rates to make that happen, to get<br />
the product where it belongs and to do it with enough margin to stay in business for the<br />
long term.<br />
JACK OLSON, NDDOT: I appreciate Dan and Steve’s comments. I also want to say<br />
that we appreciate Dan’s comments about the loan programs, about their importance to<br />
________________________________________________________________________<br />
<strong>North</strong> <strong>Dakota</strong> <strong>State</strong> <strong>Rail</strong> <strong>Plan</strong> Update 177
the state as a whole, and that they should be used for track projects as much as possible.<br />
We have heard that again and again at different times and places. Most <strong>of</strong> our money has<br />
gone for track projects in the past and we would like to continue to use the loan funds<br />
primarily for that purpose.<br />
On the issue <strong>of</strong> corn moving to ethanol plants: I think the two presently being<br />
constructed in the western part <strong>of</strong> the state anticipated more corn from local sources than<br />
will be available locally. They are going to have to bring corn in from other areas, and<br />
they realize that. They did talk about new varieties <strong>of</strong> corn that are more drought<br />
resistant and mature more quickly. That may extend the corn area to some degree.<br />
We’ve seen some expansion <strong>of</strong> corn production in <strong>North</strong> <strong>Dakota</strong> already, from south to<br />
north, to places like Grand Forks County and other areas.<br />
In addition to corn, we’re going to see the impacts <strong>of</strong> moving coal to these plants,<br />
either from within the state or from out <strong>of</strong> state. The movement <strong>of</strong> ethanol and by-<br />
product out <strong>of</strong> the plants will also impact the transportation system. The points that both<br />
Dan and Steve have touched on are extremely important. We’re watching them, and we<br />
need to continue to watch them as industry grows and changes.<br />
MR. ZINK: Steve, what are the prospects <strong>of</strong> that 20, 25 percent that’s in the CRP<br />
becoming active, productive land?<br />
MR. STREGE: There are a lot <strong>of</strong> contracts coming due next year and the year after.<br />
The USDA could, by changing its environmental benefits, indexed EDI, payments, or<br />
capping the number <strong>of</strong> acres in each county, impact how many contracts will be renewed.<br />
________________________________________________________________________<br />
<strong>North</strong> <strong>Dakota</strong> <strong>State</strong> <strong>Rail</strong> <strong>Plan</strong> Update 178
I mentioned a problem with water. They can’t raise corn without water, and even if there<br />
are more drought tolerant or shorter season varieties, they may not have the yield <strong>of</strong> the<br />
more conventional varieties. Usually you sacrifice something to gain something.<br />
MR. ZINK: We heard that the ethanol facility at Williston is looking at designing that<br />
plant to run on 15 to 20 percent on non-corn. It could be barley, peas, lentils or other<br />
crops that haven’t been traditionally used for ethanol production.<br />
MR. STREGE: There is another issue emerging in coal. With new technology that<br />
handles coal very quickly, we have the potential <strong>of</strong> a few large coal transload facilities<br />
being built, where the coal is railed in and trucked to final destination, rather than being<br />
delivered to final destination by rail. If this comes about, the transload facilities may not<br />
be in or near a place where a particular company wants to be. This is most likely to occur<br />
in areas where coal users cannot receive more than a few rail cars at a time. Probably the<br />
broader policy issue is whether the public interest is better served by having coal trucked<br />
from a consolidated facility, or delivered to the user directly by rail. As with many<br />
issues, economics plays a large part. The railroads want to move coal quickly, with<br />
minimum down time for loading and unloading, while those receiving the coal want it<br />
delivered as cheaply as possible and are probably less concerned about turn around time.<br />
The public is concerned about increased truck traffic on the highways, and noise and<br />
congestion. It is sometimes difficult to balance these competing interests.<br />
________________________________________________________________________<br />
<strong>North</strong> <strong>Dakota</strong> <strong>State</strong> <strong>Rail</strong> <strong>Plan</strong> Update 179
MR. ZINK: Excellent point. Coal transloading has already happened with the sugar<br />
beet industry in <strong>North</strong> <strong>Dakota</strong>. While coal used to be delivered on site by rail to the sugar<br />
beet plants, it is now railed to a transload facility at Ardoch, ND. From there it is trucked<br />
to the beet plants in the valley. There are presently about 150 trucks a day in and out <strong>of</strong><br />
the Ardoch facility. Those trucks were not on the highway network before the coal<br />
transload facility was built.<br />
MR. STREGE: Are any <strong>of</strong> the ethanol plants anticipating using lignite or is it all<br />
bituminous?<br />
MR. JOHNSTON: The only one I’m aware <strong>of</strong> is Richardton. I believe they are going<br />
to use lignite.<br />
MR OLSON: Yes, the Richardton plant is planning to get coal from the mine at Center,<br />
<strong>North</strong> <strong>Dakota</strong>. The Yellowstone ethanol plant at Williston will either get coal from the<br />
Savage Mine, which is between Glendive and Sidney, Montana, or it will be trucked from<br />
Center.<br />
VOICE: Can’t coal from the Center Mine be railed into Richardton?<br />
MR. JOHNSTON: It could be railed if the track between the mine and the BNSF<br />
mainline is good, but right now, they’re looking at trucking it all.<br />
________________________________________________________________________<br />
<strong>North</strong> <strong>Dakota</strong> <strong>State</strong> <strong>Rail</strong> <strong>Plan</strong> Update 180
MR. STREGE: If I remember the rail system out there, it’s probably a much shorter<br />
truck haul than it is a rail haul given the location <strong>of</strong> the tracks and the need to access the<br />
BNSF mainline.<br />
VOICE: Yes, it is.<br />
MR. STREGE: The big issue there that they’ve identified is the length <strong>of</strong> the agreement<br />
that they have with the coal company. They can get a 35-year agreement on their coal<br />
there. I asked them why they weren’t looking at, say, coal from Montana. They said it<br />
had to do with the length <strong>of</strong> agreement on the term for the purchase <strong>of</strong> the coal. I think<br />
they got what they thought was a better deal by using <strong>North</strong> <strong>Dakota</strong> lignite. They were<br />
also going to try to employ some new pollution control equipment to make the<br />
<strong>North</strong> <strong>Dakota</strong> coal more viable that way.<br />
VOICE: Well, how would a facility around Jamestown get its coal?<br />
DENVER TOLLIVER, UPPER GREAT PLAINS TRANSPORTATION<br />
INSTITUTE: It would more than likely be brought in from Montana or Wyoming on<br />
the BNSF main line. That’s my opinion.<br />
VOICE: So you’re suggesting there could be a distribution center established<br />
somewhere in eastern or south central <strong>North</strong> <strong>Dakota</strong> if there are several ethanol plants.<br />
The coal might come to one centralized facility and then be trucked to various sites.<br />
________________________________________________________________________<br />
<strong>North</strong> <strong>Dakota</strong> <strong>State</strong> <strong>Rail</strong> <strong>Plan</strong> Update 181
MR. TOLLIVER: I think that’s a very real possibility.<br />
VOICE: The location <strong>of</strong> that site would have a huge impact on highway planning in<br />
Jamestown, Valley City and Fargo districts.<br />
MR. STREGE: There may be a trend developing toward consolidated distribution sites,<br />
where coal is transloaded from train to truck, for final delivery, rather that train delivery<br />
to individual facilities. If it’s not a trend, it may be something we need to be aware <strong>of</strong><br />
and monitor to see what develops. We have one such facility now at Ardoch, and it has<br />
changed truck traffic patterns and significantly impacted the highway system in the<br />
service area. If other such facilities are developed, the impact is likely to be similar,<br />
assuming a similar size operation.<br />
MR. OLSON: Are there other comments about the rail plan document? Are there things<br />
we missed, overlooked, should have included, or need to get rid <strong>of</strong>? We intend to expand<br />
the directory section, adding more information about economic development contacts at<br />
the railroads for communities or businesses that are considering projects that would<br />
require rail infrastructure and rail service. We also want to work with groups like the<br />
<strong>North</strong> <strong>Dakota</strong> Economic Development Association and others to get them to understand<br />
what the rail system can and can’t provide in certain communities, so that if a community<br />
is out looking for a particular type <strong>of</strong> development, they’ll know what their options are.<br />
________________________________________________________________________<br />
<strong>North</strong> <strong>Dakota</strong> <strong>State</strong> <strong>Rail</strong> <strong>Plan</strong> Update 182
MR. TOLLIVER: We worked to provide more relevant information in Appendix C,<br />
compiling a brief but detailed description <strong>of</strong> line segments for each <strong>of</strong> the seven railroads<br />
that operate in ND, including maximum speed, gross car weight limit, traffic density<br />
range in gross ton miles per mile, and a brief narrative.<br />
MR. OLSON: We want to eventually have a document that can be electronically altered<br />
to be kept current during the life <strong>of</strong> the plan. We’d like to include information like<br />
contact information for railroad safety and operational issues such as crossing signal<br />
malfunctions, missing warning signs, missing or damaged crossbucks and so on. We<br />
want to provide the public with contact information so they will be able inform the<br />
railroad if they see a problem, or if there is an emergency, like a derailment or crash. We<br />
hope this will promote public awareness <strong>of</strong> the rail system and how it should function.<br />
MR. STREGE: I understand why the rate and service section was removed, but rail<br />
rates and service are still the most important factors in determining commodity<br />
movements and market access. Maybe something like that could be said in the rail plan<br />
if it isn’t there already.<br />
MR. ZINK: I think you have a very good point there, Steve. A comment could be made<br />
about that. I think Bob was trying to indicate that since the states no longer have a<br />
regulatory function regarding rail rates and service, we weren’t going to spend a lot <strong>of</strong><br />
time on it and possibly create an adversarial relationship with the railroads. The STB has<br />
________________________________________________________________________<br />
<strong>North</strong> <strong>Dakota</strong> <strong>State</strong> <strong>Rail</strong> <strong>Plan</strong> Update 183
egulatory oversight in these areas now, and that’s where issues will be sorted out, but I<br />
think your comment is valid.<br />
MR. OLSON: Are there any more comments on the plan?<br />
MR. STREGE: I’d like to thank the railroads for participating. I thought we had much<br />
better participation this time from the railroad companies. We had very constructive<br />
input from Red River Valley and Western, <strong>North</strong>ern Plains <strong>Rail</strong>road, CP <strong>Rail</strong>way and<br />
BNSF <strong>Rail</strong>way. That input was critical to shaping this document and coming up with<br />
some <strong>of</strong> those strategies, which I think are going to be very useful in guiding us in the<br />
future. Thanks.<br />
MR. OLSON: Also, Denver, we want to note that the railroads acted in good faith and<br />
were never critical, nor were the others who served on the advisory group in the<br />
development <strong>of</strong> the <strong>Rail</strong> <strong>Plan</strong> update. We also appreciate very much having the<br />
opportunity to meet with Minnesota and talk about common issues. We want to extend<br />
that dialogue to include Montana and South <strong>Dakota</strong> and the Canadian provinces into the<br />
future, since our rail system connects with theirs.<br />
We are going to look a developing an annual work plan, identifying underneath<br />
the goals and strategies in the <strong>Rail</strong> <strong>Plan</strong> which elements we’re going to work on in any<br />
given year and what we’re going to try to achieve. That would then become part <strong>of</strong> the<br />
rail plan. It would be updated at least annually, and would be a resource available to the<br />
pubic to enable them to see where we have and will put our resources and efforts.<br />
________________________________________________________________________<br />
<strong>North</strong> <strong>Dakota</strong> <strong>State</strong> <strong>Rail</strong> <strong>Plan</strong> Update 184
MR. OLSON: Denver, could we have a short discussion about the rail loan application<br />
process and selection criteria? Have they changed significantly and are we looking at<br />
different kinds <strong>of</strong> projects or not? I think we need to talk about that.<br />
MR. TOLLIVER: We started with the original FRIP guidelines from the previous <strong>Rail</strong><br />
<strong>Plan</strong>. We changed the selection criteria some to accommodate different types <strong>of</strong> projects<br />
and to make the evaluation process more valid. We also tried modify criteria where<br />
needed to make it easier to quantify them so the process would be less subjective. We<br />
realize that there are times we don’t have all the data we would like to have. We wanted<br />
to make the process as objective as we could and as uniform as we could, so projects<br />
would be evaluated on merit, in a fair and consistent manner. The following is a brief<br />
overview.<br />
We still consider the basic benefit/cost (B/C) ratio as foundational, but it is part <strong>of</strong><br />
a multi criteria scoring system. We use the actual B/C ratio as a point value. It is capped<br />
at 25, but a ratio <strong>of</strong> greater than 25:1 would be very unusual.<br />
In addition, we assign points based on carloads per mile generated from the rail line.<br />
This is reflected to some extent in the B/C ratio, but there is justification in saying that<br />
traffic density is a proxy for the likelihood <strong>of</strong> the survival <strong>of</strong> the rail line. For this reason,<br />
we assign a maximum <strong>of</strong> five additional points for lines with higher traffic density.<br />
We have a system connectivity criterion, which we think is extremely important.<br />
If there is a line segment in the middle <strong>of</strong> the network that not only originates local traffic<br />
but links other strategic segments, it exhibits connectivity and is an extremely important<br />
________________________________________________________________________<br />
<strong>North</strong> <strong>Dakota</strong> <strong>State</strong> <strong>Rail</strong> <strong>Plan</strong> Update 185
part <strong>of</strong> the railroad’s system. Projects on such line segments are assigned up to three<br />
additional points.<br />
We also look at the potential effect a project has on the <strong>North</strong> <strong>Dakota</strong> economy<br />
and use that in the B/C computation. That is a significant change, since that data was not<br />
used in the B/C ratio computation before. The B/C ratio used to be computed based on<br />
direct benefits to shippers and railroads through cost savings and improved efficiency.<br />
We still do that computation, but we now also use a sophisticated regional economic<br />
model called the REMI model for additional analysis. The REMI model takes direct<br />
benefits and translates them into not only spending effects in the economy, but also the<br />
impact on jobs and other potential economic activity generated by the project. This gives<br />
us a much more sophisticated benefit cost methodology than have had up to now.<br />
There is a safety and security criteria which we didn’t have before. Typically, in<br />
the direct benefit cost ratio, we don’t quantify the changes in derailment risk or things <strong>of</strong><br />
that nature. This criterion allows us to assign some points to a project if we think that it<br />
potentially improves the safety on a line by lessening the chance <strong>of</strong> derailment or other<br />
mishap due to track defect, condition <strong>of</strong> the line, or some other factor the project might<br />
mitigate.<br />
Finally, we also have a criterion for environmental and community affects. Here<br />
we can assign points to a project that would, for example, reduce noise or interference<br />
with highway traffic in the community by reducing the length <strong>of</strong> time crossings are<br />
blocked by trains. We might also be able to consider potential fuel savings and/or<br />
lessening <strong>of</strong> emissions when moving freight by rail compared to other modes <strong>of</strong><br />
transportation.<br />
________________________________________________________________________<br />
<strong>North</strong> <strong>Dakota</strong> <strong>State</strong> <strong>Rail</strong> <strong>Plan</strong> Update 186
These modifications give us a more flexible project evaluation framework than<br />
before, with more sophisticated and inclusive B/C methodology than we had before.<br />
MR. ZINK: I agree that it’s important to include these criteria that we didn’t include in<br />
the past. I think it brings the rail plan more in line with our overall state transportation<br />
plan.<br />
MR. TOLLIVER: We’re interested in the response from all stakeholders. This is a new<br />
process for the rail plan, with on line access and potential for running modifications. It’s<br />
a test, <strong>of</strong> sorts, and we’ll revisit it a couple <strong>of</strong> years down the road to see how it’s<br />
working. We can always go back to a more traditional methodology if that is indicated.<br />
MR. ZINK: Attention to security in the railroad industry has become extremely high in<br />
the last half dozen years or so. It’s important to recognize that in planning and<br />
operations. We have a long way to go in terms <strong>of</strong> providing some assurance <strong>of</strong> security<br />
in the industry. There’s a real vulnerability there, but much attention is being focused on<br />
it.<br />
I was also very interested in the system connectivity portion <strong>of</strong> the project<br />
evaluation process. Jack mentioned the Independence line project. We were we were<br />
reminded <strong>of</strong> the importance <strong>of</strong> system connectivity there because in the whole process <strong>of</strong><br />
developing that project and trying to get buy-in from a number <strong>of</strong> parties on things<br />
related to it, we were reminded daily that without it, and the connectivity it would<br />
provide, the entire west end <strong>of</strong> our system was in jeopardy.<br />
________________________________________________________________________<br />
<strong>North</strong> <strong>Dakota</strong> <strong>State</strong> <strong>Rail</strong> <strong>Plan</strong> Update 187
This project was problematic for us because, while business was there and it was<br />
essential for us to do the project for the long term good <strong>of</strong> our system, the short term<br />
economic reality made it difficult. The rail loan program helped us out there, and the<br />
importance <strong>of</strong> connectivity was a factor in that.<br />
MR. ZINK: Also, related to connectivity, the RRVW, in the 20 years since it started,<br />
has gone from about 675 system miles to the about 500 miles it has today. The size<br />
reduction was for economic reasons. The lines we no longer operate were not<br />
economically viable. The process <strong>of</strong> rationalization will likely continue for our railroad<br />
and others. However, someday we’re going to get to a core system <strong>of</strong> interconnected<br />
short lines and Class I carriers that we can say with a fair amount <strong>of</strong> confidence is solid<br />
for the future. I think this will be true both nationwide and within each state that has a<br />
rail network. If we can keep focus on system connectivity here, <strong>North</strong> <strong>Dakota</strong> will have a<br />
better core system in the future.<br />
MR. TOLLIVER: Absolutely. I agree. Connectivity is a very important criterion.<br />
MR. ZINK: One more comment. Hazardous materials is a big issue that has developed<br />
nationally amongst not only the short lines, but all railroads. There is a security aspect to<br />
it, but, in addition to that, is the whole issue <strong>of</strong> liability. Risk management has grown<br />
exponentially in the last few years, driven by the need to mitigate the risk attendant with<br />
carrying hazardous materials, and especially, can you insure for it? Due to the common<br />
carrier obligation, railroads cannot easily refuse to carry a very hazardous product like<br />
________________________________________________________________________<br />
<strong>North</strong> <strong>Dakota</strong> <strong>State</strong> <strong>Rail</strong> <strong>Plan</strong> Update 188
anhydrous ammonia. On our small railroad, we question whether or not it really makes<br />
economic sense to haul the very small number <strong>of</strong> hazardous materials that we do, because<br />
one serious incident like the Minot incident could break our small company. We carry<br />
what we feel to be adequate insurance, but an incident like that could put us under.<br />
I believe the insurance industry is very quickly coming to the point where they<br />
will someday refuse to insure for those kinds <strong>of</strong> incidents. Right now, the insurance costs<br />
contemplated by some <strong>of</strong> the bigger carriers are astronomical. There are presently 500<br />
small railroad companies and only four companies nationally that will provide liability<br />
insurance for small railroads. Insurance companies have become more and more<br />
reluctant to provide coverage for hazmat incidents and the number that do will probably<br />
decrease within a few years.<br />
MR. OLSON: We certainly appreciate the input the railroads and the other members <strong>of</strong><br />
the committee gave us. I think we have a better document this time around. We<br />
appreciate Upper Great Plains’ efforts on this, both Alan and Denver and the other people<br />
that worked on it. We’re going to try to make this document an electronic document, so<br />
it may change monthly or quarterly or whenever things occur that make it necessary to<br />
change what’s there. If that happens, the hard copies, obviously, will be outdated, but we<br />
don’t want to wait eight years again before we update the rail plan.<br />
________________________________________________________________________<br />
<strong>North</strong> <strong>Dakota</strong> <strong>State</strong> <strong>Rail</strong> <strong>Plan</strong> Update 189
ATTENDEES<br />
Bismarck: NDDOT: Brad Darr, Ben Ehreth, Bob Fode, Bob Johnston,<br />
Jack Olson, Jim Styron, Francis Ziegler<br />
Other: Kevin Gribble, Nick Steffens (media representatives)<br />
Fargo: NDDOT: Bob Walton<br />
UGPTI: Alan Dybing, Denver Tolliver<br />
Other: Steve Strege, ND Grain Dealers; Dan Zink, Red River<br />
Valley & Western <strong>Rail</strong>road; media representatives, names<br />
unknown<br />
________________________________________________________________________<br />
<strong>North</strong> <strong>Dakota</strong> <strong>State</strong> <strong>Rail</strong> <strong>Plan</strong> Update 190
APPENDIX J<br />
DIRECTORY<br />
________________________________________________________________________<br />
<strong>North</strong> <strong>Dakota</strong> <strong>State</strong> <strong>Rail</strong> <strong>Plan</strong> Update 191
________________________________________________________________________<br />
<strong>North</strong> <strong>Dakota</strong> <strong>State</strong> <strong>Rail</strong> <strong>Plan</strong> Update 192
RAILROAD BUSINESS CONTACTS<br />
BNSF<br />
Patrick Thompson, Director, BNSF Economic Development<br />
2650 Lou Menk Dr.<br />
MOB-2<br />
Ft. Worth, TX 76171-2830<br />
Phone: 817.867.6547<br />
Web: http://www.bnsf.com/tools/econdev<br />
Steve Dodd, BNSF ND Region<br />
4515 Kansas Ave.<br />
Kansas City, KS 66106-1199<br />
Phone: 913.554.4168<br />
Web: http://www.bnsf.com/prospective/contacts<br />
CPR<br />
Lin Gartner, Area Manager, Business Development<br />
501 Marquette Avenue<br />
Suite 1510<br />
Minneapolis, MN 55402<br />
Phone: 612.904.5932<br />
lin_gartner@cpr.ca<br />
DMVW<br />
Dennis Ming<br />
DMVW <strong>Rail</strong>road<br />
3501 E. Rosser Ave.<br />
Bismarck, ND 58501<br />
Phone: 701.223.9282<br />
dming@dmvwrr.com<br />
DNRR<br />
George LaPray<br />
Box 705<br />
Crookston, MN 56716<br />
Phone: 218.281.1750<br />
mnn@rrv.net<br />
NPR<br />
Jesse Chalich, Marketing & Sales Manager<br />
100 <strong>Rail</strong>road Avenue<br />
Box 38<br />
Fordville, ND 58231<br />
Phone: 701.229.3330<br />
nprserv@polarcomm.com<br />
________________________________________________________________________<br />
<strong>North</strong> <strong>Dakota</strong> <strong>State</strong> <strong>Rail</strong> <strong>Plan</strong> Update 193
RRVW<br />
Andy Thompson, President & CEO<br />
Box 608<br />
Wahpeton, ND 58074<br />
Phone: 701.642.8257<br />
andy.thompson@rrvw.net<br />
YSVR<br />
James Mattsen<br />
Marketing Manager<br />
909 E. Main Street<br />
Sidney, MT 59270<br />
Phone: 406-433-8561<br />
Fax: 406-433-8564<br />
E-mail: jmattsen@watcocompanies.com<br />
________________________________________________________________________<br />
<strong>North</strong> <strong>Dakota</strong> <strong>State</strong> <strong>Rail</strong> <strong>Plan</strong> Update 194
RAILROAD OPERATIONS/SAFETY CONTACTS<br />
To report emergencies, grade crossing signal and gate malfunctions, other safety issues,<br />
or anonymous crime tips.<br />
BNSF<br />
Phone: 800.832.5452<br />
Web: http://www.bnsf.com/tools/resourceprotection/protection.html<br />
CPR<br />
Phone: 800.716.9132<br />
Web: http://www.rrvw.net/contact/contact.htm<br />
DMVW<br />
877.398.9642<br />
DNRR<br />
During business hours (8-5), call the land line first; call the cell number(s) if contact is<br />
not made via land line. After hours call the cell phone number(s), primary first, then<br />
alternate if contact is not made via the primary number.<br />
Land line: 218.281.4707 Extension 6<br />
Cell Primary: 701.739.4124<br />
Alternate: 701.420.8186<br />
NPR<br />
701.280.7338<br />
RRVW<br />
218.643.4994<br />
http://www.rrvw.net/contact/contact.htm<br />
YSVR<br />
877.926.9663<br />
________________________________________________________________________<br />
<strong>North</strong> <strong>Dakota</strong> <strong>State</strong> <strong>Rail</strong> <strong>Plan</strong> Update 195
Local government planning<br />
Bismarck/Mandan MPO<br />
Steve Saunders<br />
Bismarck – Mandan MPO<br />
221 N. 5 th St.<br />
Box 5503<br />
Bismarck, ND 58506 – 5503<br />
Phone: 701.355.1840<br />
ssaunder@nd.gov<br />
Web: http://www.bismarck.org<br />
Fargo/Moorhead MetroCOG<br />
Wade E. Kline, Executive Director<br />
F-M MetroCog<br />
Case Plaza, Suite 232<br />
1 <strong>North</strong> 2 nd St.<br />
Fargo, ND 58102<br />
Phone: 701.232.3242<br />
kline@fmmetrocog.org<br />
Web: http://www.fmmetrocog.org<br />
Grand Forks/East Grand Forks MPO<br />
Earl Haugen, Executive Director<br />
GF/EGF MPO<br />
Box 5200<br />
Grand Forks, ND 58206-5200<br />
Phone: 701.746.2660<br />
ehaugen@grandforksgov.com<br />
Web: http://www.theforksmpo.org/<br />
MPO CONTACTS<br />
________________________________________________________________________<br />
<strong>North</strong> <strong>Dakota</strong> <strong>State</strong> <strong>Rail</strong> <strong>Plan</strong> Update 196
WEB: http://www.dot.nd.gov<br />
NDDOT CONTACTS<br />
PLANNING<br />
Jack Olson<br />
Assistant Division Director – <strong>Plan</strong>ning & Programming Division<br />
608 E. Blvd. Ave.<br />
Bismarck, ND 58505<br />
701.328.1029<br />
jolson@nd.gov<br />
Robert Johnston<br />
<strong>Rail</strong> <strong>Plan</strong>ner – <strong>State</strong> <strong>Rail</strong> <strong>Plan</strong>, <strong>Rail</strong> Loans (LRFA, FRIP), Operation Lifesaver<br />
608 E. Blvd. Ave.<br />
Bismarck, ND 58505<br />
701.328.2675<br />
rjohnsto@nd.gov<br />
Jim Styron<br />
Program Manager – <strong>Rail</strong> Crossings<br />
608 E. Blvd. Ave.<br />
Bismarck, ND 58505<br />
701.328.4409<br />
jstyron@nd.gov<br />
DISTRICT ENGINEERS<br />
District 1<br />
Kevin Levi<br />
218 South Airport Road<br />
Bismarck, ND 58504-6003<br />
701 328-6950<br />
klevi@nd.gov<br />
District 2<br />
John Thompson<br />
1524 Eighth Avenue SW<br />
Valley City, ND 58072-4200<br />
701 845-8800<br />
jthompso@nd.gov<br />
District 3<br />
Wayde Swenson<br />
316 Sixth Street South East<br />
Devils Lake, ND 58301-3628<br />
701 665-5100<br />
wswenson@nd.gov<br />
________________________________________________________________________<br />
<strong>North</strong> <strong>Dakota</strong> <strong>State</strong> <strong>Rail</strong> <strong>Plan</strong> Update 197
District 4<br />
Jim Redding<br />
1305 Highway 2 Bypass East<br />
Minot, ND 58701-7922<br />
701 837-7625<br />
pregan@nd.gov<br />
District 5<br />
Larry Gangl<br />
1700 Third Avenue West, Suite 101<br />
Dickinson, ND 58601-3009<br />
701 227-6500<br />
lgangl@nd.gov<br />
District 6<br />
Les Noehre<br />
1951 <strong>North</strong> Washington<br />
P.O. Box 3077<br />
Grand Forks, ND 58208-3077<br />
701 787-6500<br />
lnoehre@nd.gov<br />
District 7<br />
Walt Peterson<br />
605 <strong>Dakota</strong> Parkway West<br />
P.O. Box 698<br />
Williston, ND 58802-0698<br />
701 774-2700<br />
wpeterso@nd.gov<br />
District 8<br />
Bob Walton<br />
503 38th Street South<br />
Fargo, ND 58103-1198<br />
701 239-8900<br />
bwalton@nd.gov<br />
________________________________________________________________________<br />
<strong>North</strong> <strong>Dakota</strong> <strong>State</strong> <strong>Rail</strong> <strong>Plan</strong> Update 198
OTHER NORTH DAKOTA STATE GOVERNMENT CONTACTS<br />
<strong>North</strong> <strong>Dakota</strong> Public Service Commission<br />
Annette Bendish<br />
ND Public Service Commission<br />
608 E. Blvd. Ave<br />
Dept. 408<br />
Bismarck, ND 58505-0480<br />
abendish@nd.gov<br />
Web: http://www.psc.state.nd.us/<br />
<strong>North</strong> <strong>Dakota</strong> <strong>Department</strong> <strong>of</strong> Agriculture<br />
Chuck Fleming<br />
ND <strong>Department</strong> <strong>of</strong> Agriculture<br />
600 E. Blvd. Ave.<br />
Dept. 602<br />
Bismarck. ND 58505-0020<br />
cfleming@nd.gov<br />
Web: http://www.agdepartment.com/<br />
<strong>North</strong> <strong>Dakota</strong> <strong>Department</strong> <strong>of</strong> Commerce<br />
Jim Boyd<br />
ND <strong>Department</strong> <strong>of</strong> Commerce<br />
1600 E. Century Ave.<br />
Box 2057<br />
Bismarck, ND 58503<br />
jboyd@nd.gov<br />
Web: http://www.ndcommerce.com<br />
________________________________________________________________________<br />
<strong>North</strong> <strong>Dakota</strong> <strong>State</strong> <strong>Rail</strong> <strong>Plan</strong> Update 199
FEDERAL GOVERNMENT CONTACTS<br />
Federal <strong>Rail</strong>road Administration<br />
D. B. Messmer, <strong>Rail</strong>road Safety Inspector<br />
FRA<br />
Federal Building, Room 343<br />
304 E. Broadway<br />
Bismarck, ND 58501-4082<br />
Web: http://www.fra.dot.gov/<br />
Federal Highway Administration<br />
Stephanie Hickman<br />
FHWA<br />
1471 Interstate Loop<br />
Bismarck, ND 58503-0567<br />
Web: http://www.fhwa.dot.gov/<br />
Serena Schmit<br />
Program Coordinator<br />
<strong>North</strong> <strong>Dakota</strong> Safety Council<br />
1640 Burnt Boat Drive<br />
Bismarck, ND 58503<br />
P: 701.223.6372<br />
M: 701.361.0889<br />
F: 701.223.0087<br />
serenas@ndsc.org<br />
www.ndsc.org<br />
OPERATION LIFESAVER CONTACT<br />
________________________________________________________________________<br />
<strong>North</strong> <strong>Dakota</strong> <strong>State</strong> <strong>Rail</strong> <strong>Plan</strong> Update 200
GLOSSARY<br />
AAR Association <strong>of</strong> American <strong>Rail</strong>roads.<br />
AADT Average Annual Daily Traffic. Number <strong>of</strong> vehicles, on average,<br />
that travel a road each day.<br />
ASLRRA American Short Line and Regional <strong>Rail</strong>road Association.<br />
At Grade Crossing Highway – rail crossing where both the railroad track and the<br />
highway are at ground level. Also known as grade crossing.<br />
Commonly referred to as crossing or rail crossing.<br />
Bill <strong>of</strong> Lading A document issued by a carrier to a shipper, listing and<br />
acknowledging receipt <strong>of</strong> goods and specifying terms <strong>of</strong> delivery.<br />
Bi<strong>of</strong>uel A combustible liquid or gas, derived from various forms <strong>of</strong><br />
vegetation, that can be used for fuel. Examples include ethanol<br />
from corn, biodiesel from canola or soybeans, and methane from<br />
cow manure.<br />
Branch line Secondary line, usually shorter and with less traffic density than<br />
the main line.<br />
Bridge Traffic Freight from one RR moved by a second RR for delivery to a third.<br />
For example, COFC received by RRVW, forwarded by BNSF, for<br />
delivery to Union Pacific. Also know as Overhead Traffic.<br />
Carloads per Mile Measure <strong>of</strong> traffic density on a rail line.<br />
Class I <strong>Rail</strong>road (STB definition) RR with annual operating revenue <strong>of</strong> at least $250<br />
million for three consecutive years.<br />
Class II <strong>Rail</strong>road (STB definition) RR with annual operating revenue <strong>of</strong> at least $20<br />
million but less than $250 million. See Regional <strong>Rail</strong>road, Local<br />
<strong>Rail</strong>road and Short Line.<br />
Class III <strong>Rail</strong>road (STB definition) RR with annual operating revenue <strong>of</strong> less than<br />
$20 million. See Local <strong>Rail</strong>road and Short Line.<br />
COFC Container On Flat Car. Intermodal traffic consisting <strong>of</strong> shipping<br />
containers loaded on rail cars. See Intermodal.<br />
Consignee Entity to which a shipment will be delivered.<br />
________________________________________________________________________<br />
<strong>North</strong> <strong>Dakota</strong> <strong>State</strong> <strong>Rail</strong> <strong>Plan</strong> Update 201
Conspicuous Locomotive Locomotive made more visible with reflective markings<br />
and ditch lights.<br />
Crossover Track connecting two adjacent tracks.<br />
Diamond Track configured in such a way that two railroad lines can cross at<br />
grade.<br />
Efficiency Train CPR term. A train composed usually <strong>of</strong> 100 cars that is loaded<br />
with a single commodity and runs between a loading and<br />
unloading facility. May or may not have dedicated power. May or<br />
may not have cars from more than one elevator (pooling). See<br />
Shuttle Train.<br />
Foul the Main line Block or obstruct the main line to the extent that traffic cannot<br />
pass.<br />
FRA Federal <strong>Rail</strong>road Administration<br />
FRIP Freight <strong>Rail</strong> Improvement Program. NDDOT rail assistance loan<br />
program that uses state funds.<br />
Grade Separation In this context, a rail crossing where the tracks run above the<br />
highway (rail over) or under the highway (rail under). Commonly<br />
referred to as overpass or underpass.<br />
Gross Tons per Mile Measure <strong>of</strong> freight carried on a rail line.<br />
Interchange Point A point at which two or more railroads join. Traffic may be<br />
passed from one railroad to another at interchange points.<br />
Intermodal In this context, rail cars carrying goods in a trailer or container that<br />
is moved by another mode <strong>of</strong> transport for part <strong>of</strong> its journey. See<br />
TOFC, COFC, Piggyback.<br />
ICC Interstate Commerce Commission. Federal agency that was<br />
assigned regulatory oversight <strong>of</strong> interstate commerce, including<br />
railroads. The agency was abolished in the ICC Termination Act<br />
<strong>of</strong> 1995. See STB.<br />
Local <strong>Rail</strong>road (AAR definition) A Class III railroad that falls below the AAR<br />
Regional <strong>Rail</strong>road threshold. May also be called a short line.<br />
LRFA Local <strong>Rail</strong> Freight Assistance. <strong>Rail</strong> assistance program created by<br />
federal legislation. Also, NDDOT rail assistance loan program<br />
that uses federal funds.<br />
________________________________________________________________________<br />
<strong>North</strong> <strong>Dakota</strong> <strong>State</strong> <strong>Rail</strong> <strong>Plan</strong> Update 202
Main Line Main track that runs through rail yards and from station to<br />
station; cannot be occupied without authorization or protection.<br />
Mile Post Indicates the distance from a specific location such as a major rail<br />
terminal or junction. May be expressed in tenths or hundredths,<br />
such as MP 10.1 or 10.12.<br />
Miles <strong>of</strong> Road Miles <strong>of</strong> railroad, excluding yards and sidings. May also be called<br />
route miles. A mile <strong>of</strong> road may include two or more parallel<br />
tracks. For example, 10 miles <strong>of</strong> main line is 10 miles <strong>of</strong> road<br />
regardless <strong>of</strong> whether it is single, double or triple track. Miles <strong>of</strong><br />
road, less trackage rights, is a measure <strong>of</strong> the rail network.<br />
NDDOT <strong>North</strong> <strong>Dakota</strong> <strong>Department</strong> <strong>of</strong> <strong>Transportation</strong><br />
Overhead Traffic See Bridge traffic.<br />
Piggyback Early term for intermodal traffic consisting <strong>of</strong> truck trailers loaded<br />
on flat cars for rail transport. See TOFC.<br />
Pre-Empted Signals Traffic signals that are overridden by rail crossing warning<br />
devices. Pre-empted signals turn red when RR crossing warning<br />
devices are activated and stay red until the train clears the crossing.<br />
Quiet Zone Designated area where train horns are not sounded. FRA approval<br />
is required before quiet zones may be established.<br />
<strong>Rail</strong> Weight Weight <strong>of</strong> rail per yard. For example, 120lb. rail weighs 120 lbs.<br />
per yard. Generally, heavier rail supports higher speeds and<br />
heavier loads than lighter rail, but rail pr<strong>of</strong>ile and quality <strong>of</strong> steel<br />
are factors as well.<br />
<strong>Rail</strong> Yard A system <strong>of</strong> tracks, other than mainline, used for making up trains,<br />
parking or storing cars, fueling locomotives and other purposes.<br />
Regional <strong>Rail</strong>road (AAR definition) <strong>Rail</strong>road that operates at least 350 miles <strong>of</strong> track<br />
and/or earns $40 million in annual revenues. May also be called a<br />
short line.<br />
Short Line Generic term for a railroad that does not meet STB Class I criteria.<br />
A short line is usually a Class II or III railroad by STB definition<br />
and/or a Regional or Local railroad by AAR definition.<br />
Shuttle Loader Facility that can load shuttle trains or efficiency trains in<br />
compliance with railroad requirements.<br />
________________________________________________________________________<br />
<strong>North</strong> <strong>Dakota</strong> <strong>State</strong> <strong>Rail</strong> <strong>Plan</strong> Update 203
Shuttle Train BNSF term. A train composed usually <strong>of</strong> 110 cars loaded with a<br />
single commodity that runs directly to and from a loading and<br />
unloading facility. Usually has dedicated power. See Efficiency<br />
Train.<br />
Siding Track for meeting or passing trains. <strong>Rail</strong>road timetables indicate<br />
siding locations. May also be called side track or passing track.<br />
Slow Order Temporary speed reduction, usually on a specific section <strong>of</strong> a main<br />
or branch line.<br />
Smart Growth Well planned, orderly development which strives to balance land<br />
use among competing interests. In the context <strong>of</strong> the rail plan, this<br />
would include inviting railroad input to the planning and zoning<br />
process.<br />
STB Surface <strong>Transportation</strong> Board, created by the ICC Termination Act<br />
<strong>of</strong> 1995. The STB oversees rail abandonments and performs other<br />
functions that were once under the purview <strong>of</strong> the ICC. See ICC.<br />
Staggers <strong>Rail</strong> Act Federal legislation that began deregulation <strong>of</strong> railroads. Some<br />
provisions:<br />
• Limited rate regulation authority <strong>of</strong> the ICC (now STB) to<br />
service areas where competition is ineffective or<br />
insufficient to protect shippers.<br />
• Legalized contracts between railroads and shippers.<br />
• Allowed railroads to restructure their systems, including<br />
abandonment <strong>of</strong> redundant and light density lines.<br />
STCC Standard <strong>Transportation</strong> Commodity Code. A seven-digit<br />
numeric code representing 38 commodity groups. Code<br />
assignment is related to descriptions in freight<br />
classifications <strong>of</strong> rail and motor carriers. The STCC is<br />
maintained and published by AAR and is used in railroad waybill<br />
data.<br />
System Diagram Map Map <strong>of</strong> railroad system color coded to show five categories <strong>of</strong><br />
line as follows:<br />
1. Red – anticipate filing abandonment within three years<br />
2. Green – under study for potential future abandonment<br />
3. Yellow – abandonment filed and pending before STB<br />
4. Brown – lines being operated with financial assistance<br />
5. Black or dark blue – all other lines owned and operated<br />
Used for non-exempt (full) abandonment only.<br />
Tare Weight Empty weight.<br />
________________________________________________________________________<br />
<strong>North</strong> <strong>Dakota</strong> <strong>State</strong> <strong>Rail</strong> <strong>Plan</strong> Update 204
Timetable Authority for movement <strong>of</strong> regular trains subject to specified rules.<br />
Contains operating instructions and may list special conditions and<br />
rules.<br />
TOFC Trailer On Flat Car. Intermodal traffic where truck trailers are<br />
loaded on rail cars. See Piggyback.<br />
Track Classification Track classification is set by FRA based on prescribed<br />
requirements. FRA establishes maximum allowable operating<br />
speeds for freight and passenger trains by track class. Present<br />
track classes and speeds are shown below.<br />
TRACK CLASS MAX SPEED – FREIGHT MAX SPEED – PASS<br />
Excepted 10 MPH NA<br />
Class 1 10 MPH 15 MPH<br />
Class 2 25 MPH 30 MPH<br />
Class 3 40 MPH 60 MPH<br />
Class 4 60 MPH 80 MPH<br />
Class 5 80 MPH 90 MPH<br />
Transload The use <strong>of</strong> more than one mode <strong>of</strong> transportation to ship goods or<br />
commodities from an origin to a destination. In a rail/truck transload, the<br />
shipment is initially loaded on a rail car and taken to a transload facility or<br />
depot, where it is unloaded from the rail car and loaded onto a truck for<br />
transport to final destination.<br />
Transload shipments differ from intermodal shipments in that the cargo,<br />
not the container, is transported by more than one mode.<br />
Unit Train Train loaded with one commodity, such as coal or grain, with a<br />
single destination, such as a power plant or port terminal.<br />
USDOT (DOT) US <strong>Department</strong> <strong>of</strong> <strong>Transportation</strong>.<br />
Waybill Legal document, based on bill <strong>of</strong> lading, that gives details and<br />
instructions relating to a shipment <strong>of</strong> goods and specifies a legal<br />
weight for billing purposes.<br />
________________________________________________________________________<br />
<strong>North</strong> <strong>Dakota</strong> <strong>State</strong> <strong>Rail</strong> <strong>Plan</strong> Update 205


