Lisø PhD Dissertation Manuscript - NTNU
Lisø PhD Dissertation Manuscript - NTNU
Lisø PhD Dissertation Manuscript - NTNU

You also want an ePaper? Increase the reach of your titles
YUMPU automatically turns print PDFs into web optimized ePapers that Google loves.
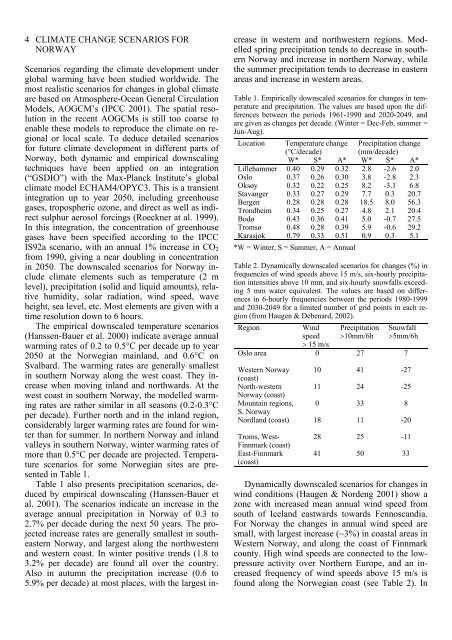
4 CLIMATE CHANGE SCENARIOS FOR<br />
NORWAY<br />
Scenarios regarding the climate development under<br />
global warming have been studied worldwide. The<br />
most realistic scenarios for changes in global climate<br />
are based on Atmosphere-Ocean General Circulation<br />
Models, AOGCM’s (IPCC 2001). The spatial resolution<br />
in the recent AOGCMs is still too coarse to<br />
enable these models to reproduce the climate on regional<br />
or local scale. To deduce detailed scenarios<br />
for future climate development in different parts of<br />
Norway, both dynamic and empirical downscaling<br />
techniques have been applied on an integration<br />
(“GSDIO”) with the Max-Planck Institute’s global<br />
climate model ECHAM4/OPYC3. This is a transient<br />
integration up to year 2050, including greenhouse<br />
gases, tropospheric ozone, and direct as well as indirect<br />
sulphur aerosol forcings (Roeckner at al. 1999).<br />
In this integration, the concentration of greenhouse<br />
gases have been specified according to the IPCC<br />
IS92a scenario, with an annual 1% increase in CO2<br />
from 1990, giving a near doubling in concentration<br />
in 2050. The downscaled scenarios for Norway include<br />
climate elements such as temperature (2 m<br />
level), precipitation (solid and liquid amounts), relative<br />
humidity, solar radiation, wind speed, wave<br />
height, sea level, etc. Most elements are given with a<br />
time resolution down to 6 hours.<br />
The empirical downscaled temperature scenarios<br />
(Hanssen-Bauer et al. 2000) indicate average annual<br />
warming rates of 0.2 to 0.5°C per decade up to year<br />
2050 at the Norwegian mainland, and 0.6°C on<br />
Svalbard. The warming rates are generally smallest<br />
in southern Norway along the west coast. They increase<br />
when moving inland and northwards. At the<br />
west coast in southern Norway, the modelled warming<br />
rates are rather similar in all seasons (0.2-0.3°C<br />
per decade). Further north and in the inland region,<br />
considerably larger warming rates are found for winter<br />
than for summer. In northern Norway and inland<br />
valleys in southern Norway, winter warming rates of<br />
more than 0.5°C per decade are projected. Temperature<br />
scenarios for some Norwegian sites are presented<br />
in Table 1.<br />
Table 1 also presents precipitation scenarios, deduced<br />
by empirical downscaling (Hanssen-Bauer et<br />
al. 2001). The scenarios indicate an increase in the<br />
average annual precipitation in Norway of 0.3 to<br />
2.7% per decade during the next 50 years. The projected<br />
increase rates are generally smallest in southeastern<br />
Norway, and largest along the northwestern<br />
and western coast. In winter positive trends (1.8 to<br />
3.2% per decade) are found all over the country.<br />
Also in autumn the precipitation increase (0.6 to<br />
5.9% per decade) at most places, with the largest in-<br />
crease in western and northwestern regions. Modelled<br />
spring precipitation tends to decrease in southern<br />
Norway and increase in northern Norway, while<br />
the summer precipitation tends to decrease in eastern<br />
areas and increase in western areas.<br />
Table 1. Empirically downscaled scenarios for changes in temperature<br />
and precipitation. The values are based upon the differences<br />
between the periods 1961-1990 and 2020-2049, and<br />
are given as changes per decade. (Winter = Dec-Feb, summer =<br />
J un-Aug).<br />
Location Temperature change Precipitation change<br />
(°C/decade) (mm/decade)<br />
W* S* A* W* S* A*<br />
Lillehammer 0.40 0.29 0.32 2.8 -2.6 2.0<br />
Oslo 0.37 0.26 0.30 3.8 -2.8 2.3<br />
Oksøy 0.32 0.22 0.25 8.2 -3.1 6.8<br />
Stavanger 0.33 0.27 0.29 7.7 0.3 20.7<br />
Bergen 0.28 0.28 0.28 18.5 8.0 56.3<br />
Trondheim 0.34 0.25 0.27 4.8 2.1 20.4<br />
Bodø 0.43 0.36 0.41 5.0 -0.7 27.5<br />
Tromsø 0.48 0.28 0.39 5.9 -0.6 29.2<br />
Karasjok 0.79 0.33 0.51 0.9 0.3 5.1<br />
*W = Winter, S = Summer, A = Annual<br />
Table 2. Dynamically downscaled scenarios for changes (%) in<br />
frequencies of wind speeds above 15 m/s, six-hourly precipitation<br />
intensities above 10 mm, and six-hourly snowfalls exceeding<br />
5 mm water equivalent. The values are based on differences<br />
in 6-hourly frequencies between the periods 1980-1999<br />
and 2030-2049 for a limited number of grid points in each re-<br />
g ion (from Haugen & Debenard, 2002).<br />
Region Wind<br />
speed<br />
> 15 m/s<br />
Oslo area<br />
Western Norway<br />
(coast)<br />
North-western<br />
Norway (coast)<br />
Mountain regions,<br />
S. Norway<br />
Nordland (coast)<br />
Troms, West-<br />
Finnmark (coast)<br />
East-Finnmark<br />
(coast)<br />
Precipitation<br />
>10mm/6h<br />
Snowfall<br />
>5mm/6h<br />
0 27 7<br />
10 41 -27<br />
11 24 -25<br />
0 33 8<br />
18 11 -20<br />
28 25 -11<br />
41 50 33<br />
Dynamically downscaled scenarios for changes in<br />
wind conditions (Haugen & Nordeng 2001) show a<br />
zone with increased mean annual wind speed from<br />
south of Iceland eastwards towards Fennoscandia.<br />
For Norway the changes in annual wind speed are<br />
small, with largest increase (~3%) in coastal areas in<br />
Western Norway, and along the coast of Finnmark<br />
county. High wind speeds are connected to the lowpressure<br />
activity over Northern Europe, and an increased<br />
frequency of wind speeds above 15 m/s is<br />
found along the Norwegian coast (see Table 2). In


![Diagnosis and FTC by Prof. Blanke [pdf] - NTNU](https://img.yumpu.com/12483948/1/190x245/diagnosis-and-ftc-by-prof-blanke-pdf-ntnu.jpg?quality=85)