Study of Technology for Detecting Pre-Ignition Conditions of ... - NIST
Study of Technology for Detecting Pre-Ignition Conditions of ... - NIST
Study of Technology for Detecting Pre-Ignition Conditions of ... - NIST
Create successful ePaper yourself
Turn your PDF publications into a flip-book with our unique Google optimized e-Paper software.
.<br />
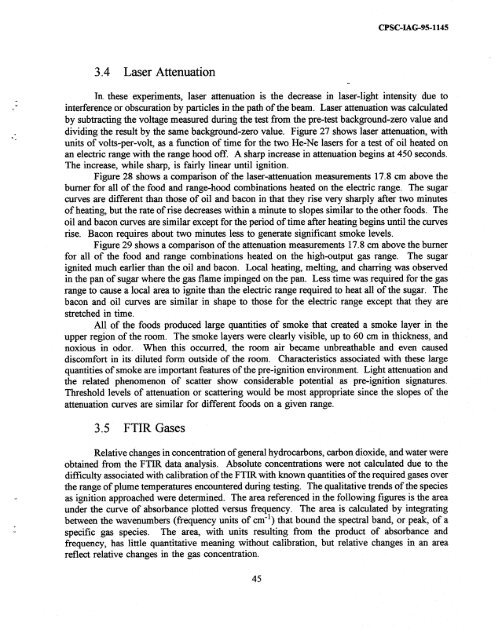
3.4 Laser Attenuation<br />
CPSC-IAG95-1145<br />
In. these experiments, laser attenuation is the decrease in laser-light intensity due to<br />
interference or obscuration by particles in the path <strong>of</strong> the beam. Laser attenuation was calculated<br />
by subtracting the voltage measured during the test from the pre-test background-zero wdue and<br />
dividing the result by the same background-zero value. Figure 27 shows laser attenuation, with<br />
units <strong>of</strong> volts-per-volt, as a function <strong>of</strong> time <strong>for</strong> the two He-Ne lasers <strong>for</strong> a test <strong>of</strong> oil heated on<br />
an electric range with the range hood <strong>of</strong>f. A sharp increase in attenuation begins at 450 seconds.<br />
The increase, while sharp, is fairly linear until ignition.<br />
Figure 28 shows a comparison <strong>of</strong> the laser-attenuation measurements 17.8 cm above the<br />
burner <strong>for</strong> all <strong>of</strong> the food and range-hood combinations heated on the electric range. The sugar<br />
curves are different than those <strong>of</strong> oil and bacon in that they rise very sharply after two minutes<br />
<strong>of</strong> heating, but the rate <strong>of</strong> rise decreases within a minute to slopes similar to the other foods. The<br />
oil and bacon curves are similar except <strong>for</strong> the period <strong>of</strong> time a&er heating begins until the curves<br />
rise. Bacon requires about two minutes less to generate significant smoke levels.<br />
Figure 29 shows a comparison <strong>of</strong> the attenuation measurements 17.8 cm above the burner<br />
<strong>for</strong> all <strong>of</strong> the food and range combinations heated on the high-output gas range. The sugar<br />
ignited much earlier than the oil and bacon. Local heating, melting and charring was observed<br />
in the pan <strong>of</strong> sugar where the gas flame impinged on the pan. Less time was required <strong>for</strong> the gas<br />
range to cause a local area to ignite than the electric range required to heat all <strong>of</strong> the sugar. The<br />
bacon and oil curves are similar in shape to those <strong>for</strong> the electric range except that they are<br />
stretched in time.<br />
All <strong>of</strong> the foods produced large quantities <strong>of</strong> smoke that created a smoke layer in the<br />
upper region <strong>of</strong> the room. The smoke layers were clearly visible, up to 60 cm in thickness, and<br />
noxious in odor. When this occurred, the room air became unbreathable and even caused<br />
discom<strong>for</strong>t in its diluted <strong>for</strong>m outside <strong>of</strong> the room. Characteristics associated with these large<br />
quantities <strong>of</strong> smoke are important features <strong>of</strong> the pre-ignition environment. Light attenuation and<br />
the related phenomenon <strong>of</strong> scatter show considerable potential as pre-ignition signatures.<br />
Threshold levels <strong>of</strong> attenuation or scattering would be most appropriate since the slopes <strong>of</strong> the<br />
attenuation curves are similar <strong>for</strong> different finds on a given range.<br />
3.5 FTIR Gases<br />
Relative changes in concentration <strong>of</strong> general hydrocarbons, carbon dioxide, and water were<br />
obtained from the FTIR data analysis. Absolute concentrations were not calculated due to the<br />
difilculty associated with calibration <strong>of</strong> the FTIR with known quantities <strong>of</strong> the required gases over<br />
the range <strong>of</strong> plume temperatures encountered during testing. The qualitative trends <strong>of</strong> the species<br />
as ignition approached were determined. The area referenced in the following figures is the area<br />
under the curve <strong>of</strong> absorbance plotted versus frequency. The area is calculated by integrating<br />
between the wavenumbers (frequency units <strong>of</strong> cm-l) that bound the spectral band, or peak, <strong>of</strong> a<br />
specific gas species. The area, with units resulting from the product <strong>of</strong> absorbance and<br />
frequency, has little quantitative meaning without calibration, but relative changes in an area<br />
reflect relative changes in the gas concentration.<br />
45


